Analyzing target user group¡¦s preferences and product form design specification through web-based...
19
Shih-Yen Huang & Jih-Shyong Lin International Journal of Business Research and Management (IJBRM), Volume (1): Issue (2) 14 Analyzing Target User Group’s Preferences and Product Form Design Specification Through Web-Based 2-Dimensinoal Design Decision Tool Shih-Yen Huang [email protected] Department of Industrial Design Huafan University Taipei County, 22301, Taiwan (R.O.C) Jih-Shyong Lin [email protected] Ph.D. Program of Design Science Tatung University Taipei, 106, Taiwan (R.O.C) Abstract In the modern market where consumerism is running higher and the product life span is getting shorter, it is one of the challenges for the marketing and design departments in enterprises to know how to get a thorough grasp of the consumer’s preference and potential target user group. With the wide spread and growth of the internet, a web-based survey is not influenced by time and space factors, making it easier for designers to have an in-depth understanding of the consumer’s preferences towards products. Based upon the 2-dimensional image scale, 120 college students from Taiwan and Japan were invited to evaluate 27 pencil sharpener samples in terms of their preferences and intention of purchase. From the survey, competitive portable pencil sharpeners were identified for the references of new product design and development. The results indicated that such a web-based 2-dimensional image survey system could offer real time help in product segmentation and the selection of competition products as well as the target user group with the output systematic diagrams and tables. Furthermore, morphological analysis for product form elements and quantification type I analysis could help designers and marketing managers set up proper policies for product form design for the target user groups in the design and marketing of new product development. Keywords: Design Decision Tool, Market Segmentation, Target User Group Analysis 1. INTRODUCTION The development of the internet has made the web an efficient channel for communication. As a result, many scholars construct image analytic tools based upon the internet technology to help designers control the consumer’s feelings of product form so as to develop products that meet the consumer’s preferences and needs. In their systems, data obtained from the survey were used for product image analysis by statistical analyses such as factor analysis or Multidimensional Scaling Analysis (MDS). Because of the variation of consumer behaviors in the market place nowadays, different user groups may vary in their preferences toward products. It causes the segmentation of the market place of the same products. In light of this, it is necessary that
-
Upload
waqas-tariq -
Category
Education
-
view
407 -
download
0
Transcript of Analyzing target user group¡¦s preferences and product form design specification through web-based...

Shih-Yen Huang & Jih-Shyong Lin
International Journal of Business Research and Management (IJBRM), Volume (1): Issue (2) 14
Analyzing Target User Group’s Preferences and Product Form Design Specification Through Web-Based 2-Dimensinoal Design
Decision Tool
Shih-Yen Huang [email protected] Department of Industrial Design Huafan University Taipei County, 22301, Taiwan (R.O.C) Jih-Shyong Lin [email protected] Ph.D. Program of Design Science Tatung University Taipei, 106, Taiwan (R.O.C)
Abstract
In the modern market where consumerism is running higher and the product life span is getting shorter, it is one of the challenges for the marketing and design departments in enterprises to know how to get a thorough grasp of the consumer’s preference and potential target user group. With the wide spread and growth of the internet, a web-based survey is not influenced by time and space factors, making it easier for designers to have an in-depth understanding of the consumer’s preferences towards products. Based upon the 2-dimensional image scale, 120 college students from Taiwan and Japan were invited to evaluate 27 pencil sharpener samples in terms of their preferences and intention of purchase. From the survey, competitive portable pencil sharpeners were identified for the references of new product design and development. The results indicated that such a web-based 2-dimensional image survey system could offer real time help in product segmentation and the selection of competition products as well as the target user group with the output systematic diagrams and tables. Furthermore, morphological analysis for product form elements and quantification type I analysis could help designers and marketing managers set up proper policies for product form design for the target user groups in the design and marketing of new product development. Keywords: Design Decision Tool, Market Segmentation, Target User Group Analysis
1. INTRODUCTION
The development of the internet has made the web an efficient channel for communication. As a result, many scholars construct image analytic tools based upon the internet technology to help designers control the consumer’s feelings of product form so as to develop products that meet the consumer’s preferences and needs. In their systems, data obtained from the survey were used for product image analysis by statistical analyses such as factor analysis or Multidimensional Scaling Analysis (MDS). Because of the variation of consumer behaviors in the market place nowadays, different user groups may vary in their preferences toward products. It causes the segmentation of the market place of the same products. In light of this, it is necessary that

Shih-Yen Huang & Jih-Shyong Lin
International Journal of Business Research and Management (IJBRM), Volume (1): Issue (2) 15
designers consider the market segmentation and preferences of special user groups in the design and development of new products. From this point of view, product design and development is closely related to market segmentation and preferences of the target user group. The web-based design decision tool proposed in this study was mainly based upon the 2-dimensional image scale frequently used in design departments in enterprises. It is a goal-oriented analytic system that could meet the enterprise’s needs in doing specific product image survey. In this study, the distribution patterns of product samples in four quadrants could be specified for market segmentation. The design decision tool proposed in the present study applied SWF for multiple product views, Active Server Pages (ASP), 2-dimensional interactive Flash, and Access for the website survey. The main purpose of this image survey system is to explore the target user groups’ preferences toward product form. Such an image analytical system can efficiently generate graphic output for market segmentation for competition products, preference analysis of target user groups, and quantitative analysis of product form, serving as references for new product design and marketing in enterprises. Through the web-based analytic system proposed by the authors, college students from Huafan University, Taiwan and Kyushu Tokai University Japan were asked to evaluate 27 current portable pencil sharpener samples in terms of their preferences toward product form of portable pencil sharpeners. In this system, the user group’s survey data can be updated in real time and further analyzed in graphics and tables to help researchers investigate product preferences and target user groups. With diagrams and tables from the system, such quantitative data can help designers identify the target user group of the competition product and the proper direction for new product design.
2. LITERATURE REVIEW
Viewpoints and methods regarding product image analysis, web image survey system, consumer behavior and market segmentation were reviewed in this study. In product image analysis, Nagamichi started the so-called emotion engineering or Kansei engineering where consumer’s feeling and image perception were transformed into product design elements in the 1970s. These design elements are the product attributes that meet the consumer’s needs and they are aimed to help reach a harmonic situation of the psychological and physical status when the product is used. Furthermore, the concept of Kansei Engineering System in which a design-oriented database was constructed is based on the consumer survey for designers to control the consumer’s emotional needs and further develop products that meet the requirements in the market [1]. For modern products, products should be endowed with added value (in most cases, this indicates the symbolic values) in addition to their concrete functions. And in the consumerism era, the amount of image and meaning a product can transmit is closely related to its value. In terms of product image, a product could communicate with its users through the form attributes of a product such as lines, color, texture structure and the outer context [2]. And these messages sent out from a product should be based from the consumer’s points of view. In other words, images are the product appearance or verbally imagery designers consider suitable from the user’s needs or feelings. The image of a product might be separated from its functional aspect. Similarly, Tsai and Ho asserted that designers use some sorts of form language to reshape a product image and send out messages to the user, forming an automatic communication model [3]. In such situations, it is due to the designer’s ability in transforming the image in the design course. Differently put, product form elements are the essence to keep the message of an image, enabling users to have the same feelings and understand the designers’ intention as well as how to operate the product. From the above studies, it is clear that product form can transmit image message and that it is an important factor for a successful product whether a designer can grasp the image to transmit and bring users’ needs and feelings into control.

Shih-Yen Huang & Jih-Shyong Lin
International Journal of Business Research and Management (IJBRM), Volume (1): Issue (2) 16
For a designer to get the picture of the image to transmit in a product and control the user’s needs and feelings, the semantic differential method (SD) is a frequently used technique [4]. It is an experimental method specially used for the measurement of the meaning of objects. SD is composed of the concept to measure, the semantic scale, and the subject. The object, image, and subject form a 3-dimension database and the subject can express their feelings toward different stimuli in a more complete way. Moreover, Zeisel maintained that based upon the relationships between design attributes of a product and the user’s perceptions, it is an easy way for subjects to make their choice and show the differences among different products along the scale if some verbal descriptions, i.e., the image word pair, is offered [5]. With the affective factors to product design, systematic data could be generated to help designers grasp the images they endowed in the product [6]. Moreover, the preference or perceptual evaluation of product samples with varying attributes can help designers deal with much uncertain information. With the data obtained, principal factors of the consumers’ abstract emotions or preference can be extracted and feed-backed to conceptual design. This is a widespread application in the design field. Many researchers in product form image domain have used the SD method to explore product images; for example, new product development based on the consumer-oriented techniques [1], the differences of perceptions between real products and photographic images [7], the main dimensions for the evaluation of product form [8]. In the above product image studies, researchers need to collect the subject’s data through SD method and then log in the data for further statistical analyses such as factor analysis, cluster analysis, and MDS. However, it takes training to conduct statistical analysis and the interpretation of the output diagrams and tables. For this reason, such studies are frequently seen in theoretical domain rather than industries and design houses. Besides, to simplify the above emotional survey and statistical analysis and to meet the specific goals in new product design or marketing survey, the semantic differential method was incorporated with the 2-dimensional design decision tool. The frequently used 2-dimensional image scale was proposed by Kobayashi in Nippon Color & Design Research Institute [9]. Since then, it has been a design analytic method frequently used in product development and promotion by the industry and design houses. The titles along X and Y axes can be changed according to the design purposes. It uses a visualized and systematic diagram to reach consensus among participants of a design team and avoid the designer to go astray in the idea development process. Furthermore, the image analysis is the most popular method used in the design houses in Taiwan. From a case study of 70 companies, he found that from the 66 companies that used
image scale, 36 companies (54.5%) adopted the 2-dimensional structure [10]. This demonstrates
that the 2-dimensional analytic tool is so important that it has been widely used in the product design process. According to the importance of 2-dimensional image scale in product design, it is easy to see discrepancy between the real market and the design team because most of such studies are conducted in the design department or R&D team. It is, therefore, essential that we need a 2-dimensional image survey system that is objective and suitable for quantitative analysis in enterprises, design houses, and academic units. In terms of web-based image survey, Roy and Kodkani integrated database and WWW and made it possible for each designer in a team to access the survey data through authorized password [11]. Through a web-based product and process data modeling in concurrent design, the design process can be efficiently integrated to make decisions on line [12]. In recent year, many studies have used the web technique to improve the shortcomings of traditional image scale survey. For example, in a study of the production of Multidimensional Scaling questionnaire, Tu and Chen adopted the world-wide web platform to construct the survey. From the WWW platform, it is possible for designers to generate website questionnaire and conduct the survey on line and automatically collect the data they need in the format of Java Apple or dynamic HTML [13]. In addition, Ikudame and Harada proposed a survey system for image data by Hypercard 2.2. Such a system can be set to compare product images according to some specific images and gather

Shih-Yen Huang & Jih-Shyong Lin
International Journal of Business Research and Management (IJBRM), Volume (1): Issue (2) 17
statistical data like the subject’s basic profile and the raw data of the perception evaluation [14]. Furthermore, a CAKE (Computer Aided Kansei Engineering) system was made to help designers proceed such product image analysis tasks. Through data retrieval technique, CAKE could show the product image samples in a random order and save the subject’s data. On the computer screen, the subject could mark the degrees of styling images regarding all the product samples [15]. More importantly, after the semantic differential test, the image samples could be further tuned to show their differences, bringing forth a more precise image database. Furthermore, it was expanded to offer more functions for designers’ references through the website, including (1) experimental design and survey system, (2) data processing and analysis, (3) database integration and searching system [16]. The above researchers conducted product image analyses through web technique to help designers grasp consumers’ preferences toward product styling images. But the experimental material was limited to single photograph of a fixed perspective angle or the front view; some details of product sample images may not totally be presented, which may affect the subject’s evaluation of the sample images. Besides, although the 2-dimensional image scale is frequently used by the industry and design houses, it is a problem annoying designers how to extend few designers’ subjective data to the major consumers for the objective image database. For these reasons, the authors proposed a web-based 2-dimensional design decision tool that could solve the problems of the presentation of detailed features of product samples and further statistical analyses. Such kind of systems can meet the requirements of designers in their image analysis procedure. Based upon the characteristics of materials studied in web-based image scale system and the interpretation of the output data, the authors proposed an image survey system suitable for designers during the stage of new product design and development. Consumer behavior is an integrated science covering social science, psychology, economics, marketing, and the like domain. Many scholars define consumer behavior from different perspectives. For example, a cognitive and interactive procedure people have in response to different consumption situations and environments in their life and commercial exchange [17], a serial decision-making procedure individual uses money or money substitute to exchange commercial goods or services, including all decisions before or after an action [18]. Schiffman and Kanuk assert that purchasing behavior is a performance an individual has towards the search of products, services, and ideas or the acquisition, evaluation, and disposal of information so as to satisfy his or her needs [19]. Moreover, consumer behavior consists of the activities people have in selection, purchasing, and using products, including mental and contextual process and physical actions to satisfy their needs and desires [20]. It is a way people obtain, consume, and dispose products, services, and ideas [21]. A more in-depth understanding of consumer behaviors will let us realize other rules in the activities. Other researchers think that consumer behavior relates to all sorts of activities people acquire, consume, and dispose products or services [22]. It is a dynamic decision-making procedure where people need to make decisions for the needs recognition, data retrieval, information processing, purchasing action, and evaluation before and after purchasing a product. As we know, a market is composed of consumers and there exist differences in consumers’ behaviors. Therefore, it is necessary that an enterprise is able to separate the differences in consumers and develop a proper marketing policy for specific market sectors so as to reach their goal in new product design and marketing. As a result, in this study, the degree of consumer’s intention of purchasing was adopted as an important index in the marketing survey and analysis. Market segmentation is an important issue in the consumerism era nowadays. It divides a potential market place into several subclasses in each of which the consumers are common in their needs or characteristics; then one or a few subclasses will be selected for the target markets for an enterprise [19]. For an effective marketing planning, a proper section between the extreme segmentation and mass production should be adopted [22]. The purpose of market segmentation is to take consumer’s behaviors into consideration and classify the individuals into user groups so that the differences in the same group are minimal and the differences among different segments are maximal. Furthermore, market segmentation is the clear sections of the market according to the consumers’ needs for products or marketing combination and description of the contour of

Shih-Yen Huang & Jih-Shyong Lin
International Journal of Business Research and Management (IJBRM), Volume (1): Issue (2) 18
each section [23]. In other words, market segmentation is the procedure in which a big market is divided into small groups of consumers [24, 25, 26, 27, 28]. For the marketing of all sorts of business, market segmentation is a important strategic domain [29, 30]. Consumers in the same market sector will have similar consumer behavior and purchasing habit [31]. For strategy makers, the information of market segmentation makes it possible for them to bring the characteristics of each user group under control in the early stage of marketing. More importantly, the result of market segmentation can be efficiently applied to the competitive strategies [32]. When an enterprise faces multiple market sectors, marketing managers need to figure out the characteristics of each segment so as to apply appropriate strategies [33]. Using coffee shops as an example, he divided the market place into four quadrants based on the product usage frequency and preferences for market analysis. From the above studies of consumer behavior and market segmentation, it is clear that for design and marketing, an in-depth understanding of the characteristics and preferences of the target user group can help an enterprise or design house achieve maximum results in the competitive market. From the overview of related studies, it is evident that 2-dimensional image analysis is frequently used by enterprises in and product image analysis at product development stage. In such analyses, the distribution of test samples in four quadrants and the segmented market sectors only by team members may be too subjective or limited. On the contrary, through the combination of web technique and 2-dimensional image analytic tool, the perceptions and preferences of consumers rather than the design team members or marketing personnel can offer an objective views and quantitative references. To enhance the competition ability in the market, the understanding of market needs is a must for an enterprise. However, literature regarding web-based 2-dimensional design decision tool is rare and more attention should be paid attention to such kind of 2-dimensional design decision tool
3. RESEARCH METHOD-The web-based design decision tool From the above discussion, it is clear that 2-dimensional image scale has been frequently used by the industry and design houses. It is an important issue for designers to know how to extend from the few subjective views of personnel in R&D department to an objective image data of the consumers in the market. In a study of the product development of the motorcycle backpack, Huang applied image analytic tool in which a product sample could be placed in some locations on an image scale by many subjects to reflect their perceptions and preferences toward the product form [34]. The subjects’ views could then be analyzed in an objective way from the calculation of the gravitation of all subjects’ coordinates. In this way, the problem frequently seen in traditional image scale was solved. The average coordinates of the product samples in the design decision tool is based on the gravitation center of the locations subjects move the sample image along the axes [35]. Considering the needs of researcher and subjects in using the 2-dimensional design decision tool, an objective and efficient way to present the survey output has been introduced in the proposal system. The digital data of the coordinate subjects have for each product sample and the gravitation centers of product samples in four quadrants can be obtained for the interpretation of the output data for further statistical analysis. Lin, Chang, and Huang combined FLASH, ASP, HTML, and database techniques to extend the function of the web-based 2-dimensional design decision tool for the collection of image data of product form [36]. Firstly, in their model, the subject profile as well as coordinates of the positions subjects place the image sample on the image scale can be obtained. Secondly, the calculation of gravitation is automatically generated and downloaded for the quantitative analysis. Thirdly, the output of statistical analysis can be visually presented for market segmentation from the distribution of the gravitation centers of the test samples. Finally, the distribution pattern for each product sample can be generated in a separated graphic to specify the potential target user groups (gender, profession, or demographic area). When the subjects enter the 2-dimensional design decision tool, they need to fill in personal data for the analysis of target user group in terms of demographic variables. Subjects key in or chose items from pull-down menu to fill in the form. When there are one or more columns left blank, they will be informed to complete the data

Shih-Yen Huang & Jih-Shyong Lin
International Journal of Business Research and Management (IJBRM), Volume (1): Issue (2) 19
before they enter the 2-dimensional image scale test page. In the 2-dimensional design decision tool, the interface of the web-based 2-dimensional analytic tool can be divided into three parts as can be seen in Figure 1. Area 1 on the upper left part shows the dynamic product sample window where different views and texts regarding product features are offered; Area 2 on the lower left part contains the control buttons of the multiple dynamic views of the product samples for the download of the sample image to test; Area 3 in the right side is the test area of the analytic tool where different image words and multiple choices of image analytic tables can be provided for the evaluation according to the design goal or marketing survey. In the evaluation, the subjects are asked to place product sample images on four quadrants of the image scale. And they can remove and adjust the sample images onto the 2-dimensional image scale according to the differences of product images and their relative positions in four quadrants.
FIGURE 1: The test page of the image analytic image system
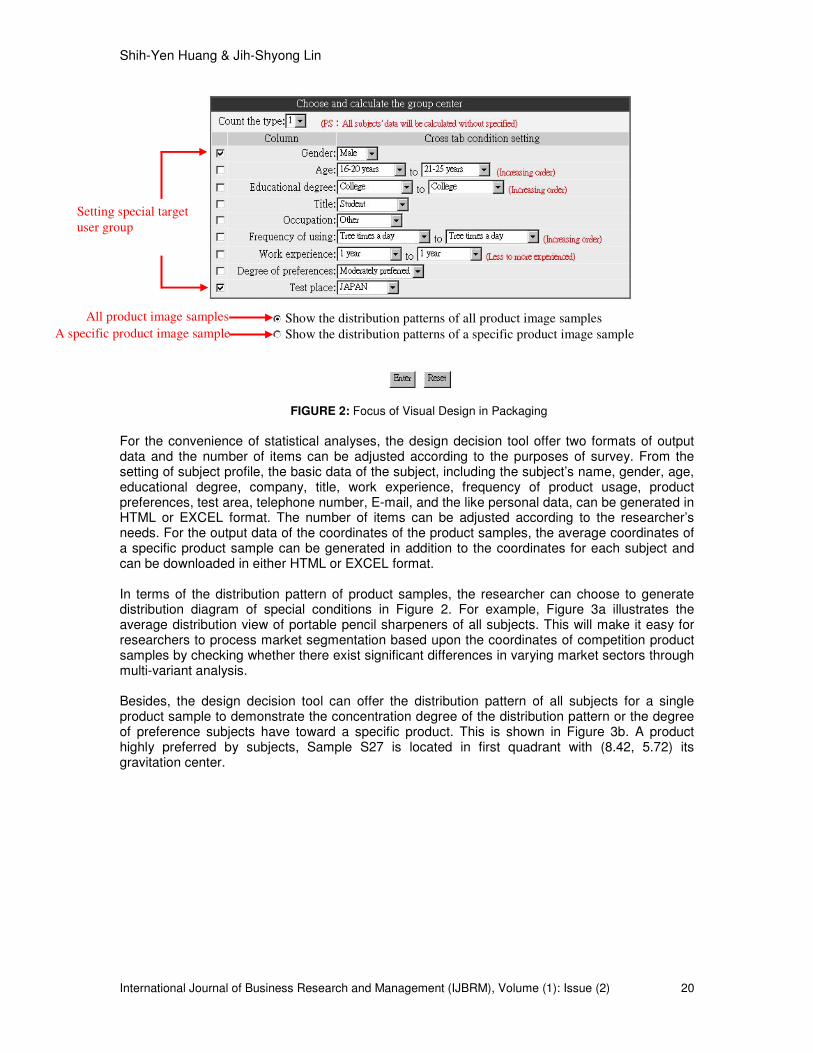
After the subjects enter their personal data and evaluate the product samples, the basic profile and coordinate data can be downloaded. In addition, the design decision tool offers a function for researchers to choose and calculate the group center. As can be seen in Figure 2, items to analyze can be selected from the checker buttons in the left side and the popup columns in the central part for the target user groups. In Figure 7, gender and test area are chosen for the cross tab analysis. It also allows the researcher to choose the specific items of a single target user group for the output data. For example, the gender and demographic items are chosen. Then the pull down menu can be used for the target user group. After the selection of demographic conditions, the researcher can choose to analyze the distribution patterns of all product samples or one specific product sample by clicking at the buttons in the lower part.
1. Dynamic view port
2. Control area for downloaded images
3. 2-dimensional image analytic area
Shih-Yen Huang & Jih-Shyong Lin
International Journal of Business Research and Management (IJBRM), Volume (1): Issue (2) 20
FIGURE 2: Focus of Visual Design in Packaging
For the convenience of statistical analyses, the design decision tool offer two formats of output data and the number of items can be adjusted according to the purposes of survey. From the setting of subject profile, the basic data of the subject, including the subject’s name, gender, age, educational degree, company, title, work experience, frequency of product usage, product preferences, test area, telephone number, E-mail, and the like personal data, can be generated in HTML or EXCEL format. The number of items can be adjusted according to the researcher’s needs. For the output data of the coordinates of the product samples, the average coordinates of a specific product sample can be generated in addition to the coordinates for each subject and can be downloaded in either HTML or EXCEL format. In terms of the distribution pattern of product samples, the researcher can choose to generate distribution diagram of special conditions in Figure 2. For example, Figure 3a illustrates the average distribution view of portable pencil sharpeners of all subjects. This will make it easy for researchers to process market segmentation based upon the coordinates of competition product samples by checking whether there exist significant differences in varying market sectors through multi-variant analysis. Besides, the design decision tool can offer the distribution pattern of all subjects for a single product sample to demonstrate the concentration degree of the distribution pattern or the degree of preference subjects have toward a specific product. This is shown in Figure 3b. A product highly preferred by subjects, Sample S27 is located in first quadrant with (8.42, 5.72) its gravitation center.
Setting special target
user group
All product image samples A specific product image sample
Show the distribution patterns of all product image samples
Show the distribution patterns of a specific product image sample

Shih-Yen Huang & Jih-Shyong Lin
International Journal of Business Research and Management (IJBRM), Volume (1): Issue (2) 21
FIGURE 3a: The distribution pattern of portable pencil sharpeners for all subjects
FIGURE 3b: The distribution pattern of S27 for all
subjects
Moreover, the researcher can choose to generate the distribution pattern of a special target user group to understand the gravitation center and preferences of a special user group. With the coordinates of a specific product sample and the subject demographic data, the preferences of the target user group toward one certain product sample can be verified. In addition, with the gravitation center data and the morphological data of product image samples, the effects of product form elements have on product form preference can be clarified for designer’s references through quantification type I analysis, a multiple regression analysis between user’s preferences and product form elements. Morphological analysis is a method frequently used for the analysis of product form, from which new product forms can be formed from the elements of the product samples. Morphological analysis can be applied in the following four steps: (1) divide the subject into several independent factors, (2) find different patterns for each individual factor, (3) reorganize the different patterns, and (4) evaluate the feasible combination modules [37]. From Quantification Type I analysis, a reference model can be obtained for the product form specification of new product. In this study, the average gravitation coordinates and form factors and categories were used for quantification type I analysis to offer references for new product form design. In processing the web-based image analysis, the researcher should first build up the dynamic views for product samples, set up the survey topics (image words) and columns for subject profile. On the other hand, the subject can process the image evaluation through the tutorial in the Internet or be instructed face-to-face by the researcher. When the subject enters the design decision tool, they need to fill in personal data before they start the image evaluation. After the test, the subject’s data will be transmitted to the database for further calculation through ASP. After the subjects finish the evaluation, the researcher can download the data and distribution patterns on the server. First of all, the research can download the subject profile in the format of Excel or Html. With such data, the target user groups for some specific product samples can be made. In addition, through the coordinates of all subjects and the average coordinates, the preferences and product form analyses can be processed. More importantly, through the selection buttons and target user groups, special distribution patterns for competition product samples or single product sample can be generated (see Figure 4). From this the representative product samples and their form features can be selected for the references for new product design and development. The combination of quantitative data and diagrams makes it more objective to interpret the output of survey. Figure 4 illustrates the conceptual diagram of the web-based design decision tool.

Shih-Yen Huang & Jih-Shyong Lin
International Journal of Business Research and Management (IJBRM), Volume (1): Issue (2) 22
FIGURE 4: The conceptual diagram of the web-based design decision tool Through the web-based design decision tool, the subjects’ preferences toward product samples and major target user groups can be determined. For the design department, market segmentation policies and product form patterns can be offered for product design strategy through the distribution patterns of product samples in four quadrants from the target user group or all of the subjects.
4. RESEARCH RESULTS AND ANALYSIS—A PRACTICAL APPLICATION
OF THE WEB-BASED DESIGN DECISION TOOL 4.1 Selecting product samples and criteria for X and Y axes In this study, 27 portable pencil sharpeners made in Taiwan, Japan, France, and Germany were provided by the client for the web-based image evaluation. The product form images and selling prices are shown in Table 3. The image words along the evaluation axes were decided by the client and related studies. Customers in different user groups will vary in their consumer behaviors and preferences towards products [38, 39]. For example, in a study of mineral water bottle design, salience of product form and intention of purchase were chosen as evaluation criteria for the product form and marketing research. Compared with typical semantic differential experiments where many image words are used, the smaller number of image words would save a lot of time and energy of the survey and further statistical analyses [40]. For this reason, salience of product form and intention of purchase were also chosen in this study. The four quadrants constructed by these two axes, therefore, have their special strategic implications.

Shih-Yen Huang & Jih-Shyong Lin
International Journal of Business Research and Management (IJBRM), Volume (1): Issue (2) 23
TABLE 3: 27 samples of portable pencil sharpeners used in the experiment
4.2 Product image analysis of the portable pencil sharpener Through the web-based 2-dimensional analytic tool, 120 college students from Taiwan and Japan were invited to enter their perceptions of the 27 portable pencil sharpeners. In this study, the first quadrant is chosen as the major competition area in that the subjects’ intention of purchase and product form salience are of higher values. They can set to be the target area for product design appeal in the future. The second quadrant is defined as the product form competition area. Product samples in this area feature attractive product form but unacceptable price range. As a result, it’s a special market area where product prices are to be adjusted. The third quadrant is considered as the rejection area in that the degrees of product form salience and price acceptability are much lower. At last, the fourth quadrant is a competition area for product prices because the samples have acceptable prices but lower salience of product form. Therefore, this area can be a section for product form to be improved. 4.2.1 Selecting product samples in terms of subjects’ preferences From the analytic system, a graphic output for the average coordination of portable pencil samples could be obtained in 10 work days. This is illustrated in Figure 5.

Shih-Yen Huang & Jih-Shyong Lin
International Journal of Business Research and Management (IJBRM), Volume (1): Issue (2) 24
FIGURE 5: The distribution pattern of portable pencil sharpeners for all subjects As mentioned above, the four quadrants of the view of purchase intention and product form salience vary in their strategic implications. In terms of market segmentation, product samples in first quadrant are the important ones to consider for the purpose of highly salient product form design and high purchase intention. They included 16 samples, S1, S2, S6, S8, S9, S11, S12, S15, S17, S19, S20, S21, S22, S23, S25, and S27. Among these 16 samples, 7 of them are from Japan; 6 from France, 2 from Taiwan, and 1 from Germany. These samples are the target for further analyses. The average positions of portable pencil sharpeners for all 120 subjects could be obtained from the system. It is shown in Figure 6.
FIGURE 6: The average positions of 27 portable pencil sharpeners in terms of purchase intention and product form salience
To examine whether there existed significant differences among the above 16 competition product samples in first quadrant, a one-way Manova was conducted. Hypotheses for the
Manova were H0:αip=0, for all (i,p); H1:αip≠0, for some (i,p), in which p is the number of
responding variables; i is the number of single factors. The result of Manova indicated that Wilks' Lambda p value<.0001<0.05, meaning that there existed significant differences among 16 competition samples in first quadrant. Moreover, through marginal tests, it was found that these 16 samples were significantly different along X and Y axes (p value <0.0001<0.05). Furthermore, from Sheffe post hoc test, five competitive samples along X axis, the intention of purchase, were identified. In a descending order, they were S6, S27, S12, S21, S17, significantly higher than the

Shih-Yen Huang & Jih-Shyong Lin
International Journal of Business Research and Management (IJBRM), Volume (1): Issue (2) 25
other eleven samples in intention of purchase. Their product selling prices fall between NT$13 and NT$32, belonging to fair price products. Among them, samples S6, S12, and S21 only sell for NT$20 and can serve as references for the policy of price setting in the future. In terms of Y axis, the product form salience, six representative portable pencil sharpeners, Samples S11, S15, S27, S6, S8, S25, were significantly more salient than the other ten samples. Among them, samples S11, S15, S27, S6, and S25 are of biomorphic styles and can serve as references for styling specification. From the competition analysis along X and Y axes, samples S6 and S27 were more preferred by the subjects. They were made in France and of the selling price of NT$20 and NT$13 respectively. Both of them feature the transparent pencil shaving case and biomorphic form. The oval shape of S6 and iMac-like feature of S27 could serve as references for new product form design. 4.2.2 Target market analysis of the test products From literature review, it is clear that customers in different user groups vary in their preferences and purchasing behaviors. In light of this, an in-depth understanding of the target user group will help with the development of new products. In this study, Sample S6 was used as an example for the preference analysis of target user group because it performed well along both product form salience and purchase intention axes. Through the user interface as shown in Figure 2, gender and geomorphic variables were selected for the potential target user group among male Taiwanese, female Taiwanese, male Japanese and female Japanese students. A click of the lower round button can generate the output distribution graphic of a single product sample and the average coordinates of the target user group.
Taiwanese male Taiwanese female
Japanese male Japanese female
FIGURE 7: The distribution pattern of S6 for 4 target groups
Shih-Yen Huang & Jih-Shyong Lin
International Journal of Business Research and Management (IJBRM), Volume (1): Issue (2) 26
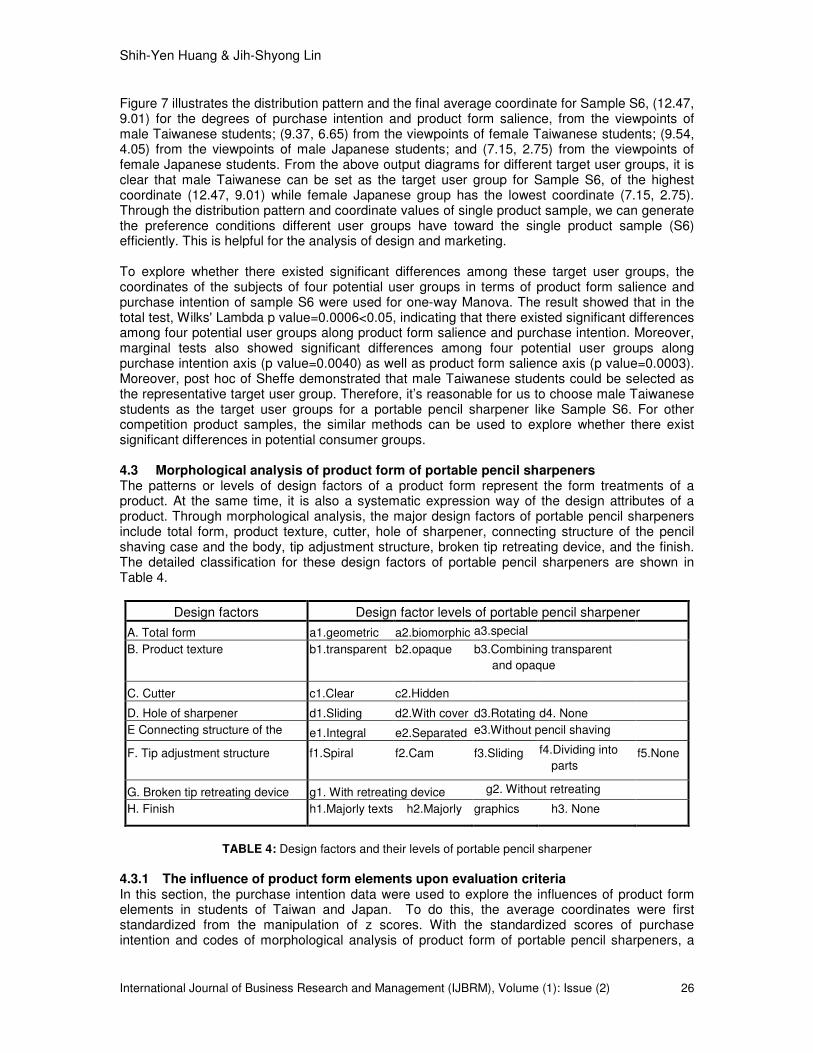
Figure 7 illustrates the distribution pattern and the final average coordinate for Sample S6, (12.47, 9.01) for the degrees of purchase intention and product form salience, from the viewpoints of male Taiwanese students; (9.37, 6.65) from the viewpoints of female Taiwanese students; (9.54, 4.05) from the viewpoints of male Japanese students; and (7.15, 2.75) from the viewpoints of female Japanese students. From the above output diagrams for different target user groups, it is clear that male Taiwanese can be set as the target user group for Sample S6, of the highest coordinate (12.47, 9.01) while female Japanese group has the lowest coordinate (7.15, 2.75). Through the distribution pattern and coordinate values of single product sample, we can generate the preference conditions different user groups have toward the single product sample (S6) efficiently. This is helpful for the analysis of design and marketing. To explore whether there existed significant differences among these target user groups, the coordinates of the subjects of four potential user groups in terms of product form salience and purchase intention of sample S6 were used for one-way Manova. The result showed that in the total test, Wilks' Lambda p value=0.0006<0.05, indicating that there existed significant differences among four potential user groups along product form salience and purchase intention. Moreover, marginal tests also showed significant differences among four potential user groups along purchase intention axis (p value=0.0040) as well as product form salience axis (p value=0.0003). Moreover, post hoc of Sheffe demonstrated that male Taiwanese students could be selected as the representative target user group. Therefore, it’s reasonable for us to choose male Taiwanese students as the target user groups for a portable pencil sharpener like Sample S6. For other competition product samples, the similar methods can be used to explore whether there exist significant differences in potential consumer groups. 4.3 Morphological analysis of product form of portable pencil sharpeners The patterns or levels of design factors of a product form represent the form treatments of a product. At the same time, it is also a systematic expression way of the design attributes of a product. Through morphological analysis, the major design factors of portable pencil sharpeners include total form, product texture, cutter, hole of sharpener, connecting structure of the pencil shaving case and the body, tip adjustment structure, broken tip retreating device, and the finish. The detailed classification for these design factors of portable pencil sharpeners are shown in Table 4.
Design factors Design factor levels of portable pencil sharpener
A. Total form a1.geometric a2.biomorphic a3.special
B. Product texture b1.transparent b2.opaque b3.Combining transparent
and opaque
C. Cutter c1.Clear c2.Hidden
D. Hole of sharpener d1.Sliding d2.With cover d3.Rotating d4. None
E Connecting structure of the
pencil shaving case and the body e1.Integral e2.Separated e3.Without pencil shaving
case
F. Tip adjustment structure
f1.Spiral
f2.Cam
f3.Sliding
f4.Dividing into
parts f5.None
G. Broken tip retreating device g1. With retreating device g2. Without retreating
device
H. Finish h1.Majorly texts h2.Majorly graphics h3. None
TABLE 4: Design factors and their levels of portable pencil sharpener
4.3.1 The influence of product form elements upon evaluation criteria In this section, the purchase intention data were used to explore the influences of product form elements in students of Taiwan and Japan. To do this, the average coordinates were first standardized from the manipulation of z scores. With the standardized scores of purchase intention and codes of morphological analysis of product form of portable pencil sharpeners, a

Shih-Yen Huang & Jih-Shyong Lin
International Journal of Business Research and Management (IJBRM), Volume (1): Issue (2) 27
quantification type I, a kind of regression analysis, was conducted. From this, the influences design factors and design factor levels of portable pencil sharpeners upon subjects’ purchase intention were explored, from which the differences of students of two countries had on the form treatments, the design factor levels were examined. With the output interface of the web-based 2-dimensioal analytical tool, the average coordinates of students from Taiwan and Japan can be obtained for 27 pencil sharpeners. From the above analysis, the subjects from different countries will have different distribution patterns in terms of the average coordinates of 27 pencil sharpeners. The results of Q-type I analysis for the purchase intention (X axis) of Taiwanese students indicate a multiple correlation coefficient (r)= 0.941, the determination power (r2) =0.884, and constant -0.003. For the purchase intention of Japanese students, a multiple correlation coefficient (r)= 0.968, the determination power (r2) =0.937, and constant 0.000.
Design factors Partial correlation Taiwan
Rank order Partial correlation Japan
Rank order
A. Total form 0.512 5 0.892 3
B. Product texture 0.486 0.858 4
C. Cutter 0.007 0.704 7
D. Hole of sharpener 0.685 3 0.809 5
E. Connecting structure of the pencil shaving case and the body
0.612 4 0.905 2
F. Tip adjustment structure 0.715 2 0.777 6
G. Broken tip retreating device
0.184 0.127
H. Finish 0.909 1 0.949 1
TABLE 5: Partial correlations design factors of portable pencil sharpeners have on the purchase intention of
Taiwanese and Japanese students
From Q-type I analysis, different design elements (design factors) would cast different influences on the subject’s purchase intention of portable pencil sharpeners. This is shown by the value of partial correlation coefficients, which reflect the degree of relative importance of design factors or the product form elements. The partial correlations and rank orders of design factors of portable pencil sharpeners have on purchase intention of Taiwanese and Japanese students are shown in Table 5. In this study, the design factors whose partial correlation coefficients were bigger than 0.5 were chosen as important design factors. The rank order of form element’s relative importance on Taiwanese students’ purchase intention of portable pencil sharpeners was Finish (0.909)>Tip adjustment structure (0.715)>Hole of sharpener (0.685)>Connecting structure of the pencil shaving case and the body (0.612)>Total form (0.512). For Japanese students, the rank order of form element’s relative importance on their purchase intention of portable pencil sharpeners was Finish (0.949)>Connecting structure of the pencil shaving case and the body (0.905)>Total form (0.892)>Product texture (0.858)>Hole of sharpener (0.809)>Tip adjustment structure (0.777)>Cutter (0.704). The results of the rank order of relative importance of form elements on subject’s purchase intention demonstrated that there existed differences between Japanese and Taiwanese students. From the viewpoint of marketing, the design elements of the product form of portable pencil sharpeners would cast different degrees of influence upon the subject’s intention of purchase, which is shown in the category scores in Table 6. In terms of total form of pencil sharpeners, special form (a1) is highly suggested and samples S8(0.73), S9(1.61), S10(0.09) can be the

Shih-Yen Huang & Jih-Shyong Lin
International Journal of Business Research and Management (IJBRM), Volume (1): Issue (2) 28
major competition products for references, whereas biomorphic form (a2) is most preferred by Japanese students. Samples S11(10.59), S14(6.38), S15(5.36), S25(2.37),and S27(11.35) can be the major competition products. For the sharpener hole design, Taiwanese students would prefer one with cover (d2) and S1(1.13), S17(4.18), S22(2.39), S24(4.29) can serve as references, while Japanese students would like to have a rotating hole design (d3) and samples S8(5.93) and S20(5.15) can be the major competition products for references. As far as connecting structure, tip adjustment structure and finish of pencil sharpeners, Japanese and Taiwanese students have the same preference in these design factors. For the connecting structure of pencil shaving case and the body, a separated (e2) style is suggested and samples S6, S11, S27 can be referred. For the tip adjustment structure design, sliding style (f3) and sample S6 cab be considered. For the finish design, text labeling (h1) can be the major medium and samples S6, S12, S17, S21, S24, S27 can serve as references for designers. For the purpose of highest intention of purchase, the strategy of product form design should be different for the student market places in Taiwan and Japan.
Taiwanese students Design factor levels of portable pencil sharpeners
Japanese students
Design factors category scores
category scores
Design factors
A. Total form
a1. -0.230 a1. Geometric a1. -0.334
A. Total form a2. 0.030 a2. Biomorphic a2. 0.915
a3. 0.868 a3. Special form a3. -0.264
B. Product texture
b1. -0.223 b1. Transparent b1. -0.325
B. Product texture b2. 0.398 b2. Opaque b2. 0.879
b3. -0.238 b3.Combining transparent and opaque
b3. -0.597
C. Cutter c1. 0.003 c1. Clear c1. 0.324
C. Cutter c2. -0.005 c2. Hidden c2. -0.472
D. Hole of sharpener
d1. -0.755 d1. Sliding d1. -0.683
D. Hole of sharpener d2. 0.195 d2. With cover d2. 0.378
d3. 0.125 d3. Rotating d3. 0.489
d4. 0.100 d4. None d4. -0.064
E. Connecting structure of the pencil shaving case and the body
e1. 0.058 e1. Integral e1. -0.156 E. Connecting structure
of the pencil shaving case and the body
e2. 0.101 e2. Separated e2. 0.436
e3. -2.015 e3.Without pencil shaving
case
e3. -3.041
F. Tip adjustment structure
f1. -0.429 f1. Spiral f1. 0.466
F. Tip adjustment structure
f2. -1.441 f2. Cam f2. 0.003
f3. 1.301 f3. Sliding f3. 1.394
f4. -0.007 f4. Dividing into parts f4. -0.348
f5. 0.092 f5. None f5. -0.073
G. Broken tip retreating device
g1. 0.131 g1. With retreating device g1. 0.076 G. Broken tip retreating
device g2. -0.046 g2. Without retreating device g2. -0.027
H. Finish
h1. 0.785 h1. Majorly texts h1. 0.796
H. Finish h2. -0.898 h2. Majorly graphics h2. -0.854
h3. -1.230 h3. None h3. -1.418
TABLE 6: The category scores of design factor levels of portable pencil sharpeners on the purchase
intention of Taiwanese and Japanese students

Shih-Yen Huang & Jih-Shyong Lin
International Journal of Business Research and Management (IJBRM), Volume (1): Issue (2) 29
5. CONCLUSION AND SUGGESTION
In order to specify the most competitive products from the website survey from the viewpoints of Taiwanese and Japanese college students, portable pencil sharpeners were used as an example to explore the potential user’s preferences and perception of product form salience through a web-based design decision tool. The results indicated that, in ten days of survey, the web-based analytic system could largely reduce the questionnaire survey and data logging of product samples. Furthermore, human errors in data logging could also be avoided. Product market segmentation can be made by the web-based 2-dimensional image analytical system. 16 portable pencil sharpeners in first quadrant could be selected as competition products. And from multivariate analyses of variance, major competition products along intention of purchase (X axis) and product form salience (Y axis) could be identified. As far as the product form features are concerned, there existed some remarkable differences between Taiwan and Japan in terms of their intension of purchase to the combinations of product form elements. Designers therefore, should pay attention to such differences and deal with them subtly. At last, the authors reached the following conclusions: (a) In addition, the application of image scale analysis of products is executed by experts or
designers, which is more subjective. In the analytical tool proposed in this study, the survey is conducted directly by consumers and can reflect the preferences and viewpoints of the target user group in the market. The results of the marketing survey are, therefore, more objective.
(b) The web-based survey can serve as an analytical tool for the policy of market segmentation from competition analysis of the major competition products. From multivariate analyses of variance, there were five major competition products along intention of purchase, with the price range between NT$13 to 32. Among these five competitive products, three of them, Samples S6, S12, S21 only sold for NT$20 and could serve as references for the setting of product prices. In terms of purchase intention, samples S11, S15, S27, S6, S8, and S25 were six major competition products. Among them, samples S11, S15, S27, S6, S25 have biomorphic form features. This analytical tool can help designers and marketing personnel in enterprises take hold of consumer’s preferences and set a proper policy for further product development.
(c) The output diagrams and tables provided in the image analytical system are helpful for the target user group’s preferences. And from the distribution of target user group’s preferences toward a single product, the preferences of different target user groups can be identified. From the study, it is clear that sample S6 is the favorite pencil sharpener for male Taiwanese students. In the proposed analytical system, further analyses can be conducted from the setting of the target user group so as to download the tables and graphics in real time; thus designers or researchers can keep preferences of different target user groups in control.
(d) In enterprises or design consultants, image scale analysis is generally applied for product classification and market segmentation. In this study, its function is extended to the morphological analysis of product form. With the average coordinate data and morphological charts for product form analysis, product form design specifications can be made through quantification type I analysis. It has been found that Taiwanese and Japanese students are different in their preferences toward different combination of product form patterns, which serves as references for the new product form development.
Due to the limitation of time and energy, only portable pencil sharpeners were explored in this study. In the future, more criteria can be surveyed in the 2-dimensional analytic system. Other important demographic variables can be added for the emotional and marketing purposes. Based upon the requirements of survey or goals in product design or marketing analysis, other criteria or concepts can be added in the analytical system. Finally, more life style variables can be used as criteria or put in the AIOs questionnaire survey for market segmentation in new product design and development

Shih-Yen Huang & Jih-Shyong Lin
International Journal of Business Research and Management (IJBRM), Volume (1): Issue (2) 30
6. ACKNOWLEDGMENTS
The authors would like to thank the faculty and students at Huafan University in Taiwan, Kyushu Tokai University and Nagoya Arts and Sciences University in Japan for their helps with the web survey.
7. REFERENCES 1. Nagamachi, M. "Kansei engineering: A new ergonomic consumer-oriented technology for product development". International Journal of Industrial Ergonomics, 15:3-11, 1995.
2. Chuang, M. C., and Kao, C. H. "A study on the image of products made in Taiwan". Journal of Design, 2(2): 37, 1997. 3. Tsai, T. W. and Ho, M. C. "Language of Product Image - Case Study of Vernacular Image".
Journal of National Cheng Kung University, 3(10):99-113, 1995. 4. Osgood, C.E., Suci, C.J. and Tannenbaum, P.H. "The Measurement of Meaning". Urbana:
University of Illinois Press, pp.76-124, 1957. 5. Zeisel, J. "Inquiry by design: tools for environment-behavior research". Cambridge University
Press, 1990. 6. Sugiyama Kazuo. "Departure from doing good design". Indestrial Design 155, pp. 61-66,
1991. 7. Chang, C. C., Hsu, S. H. and Chuang, M. C. "A differential study on product image
perception between real product and photographic images". Chinese Journal of Industrial Engineering, 17(2): 169-179, 2000.
8. Hsiao, K. A. and Chen, L. L. "Fundamental dimensions of affective responses to product
shapes". International Journal of Industrial Ergonomics, 36(6): 553-564, 2006. 9. Kobayashi, Shigenobu. "Color image scale". Published by Kodansya International Ltd,
Japan, 1991. 10. Chen, C. K. "Design methods frequently adopted by local design houses in Taiwan",
unpublished master’s thesis. National Taiwan University of Science and Technology, 2003. 11. U.Roy, S.S. Kodkani. "Collaborative product conceptualization tool using web technology".
Computers in Industry 41, pp195-209, 2000. 12. Huang, G. Q., Lee, S.W. and Mak, K.L. "Web-based product and process data modeling in
concurrent design for X". Robotics & Computer-integrated Manufacturing, pp.53-63, 1999. 13. Tu, C. S. "The development of the web-based global interactive MDS questionnaire survey".
Journal of Design, 2(1):1-15, 1997. 14. Ikudame, Miki and Harada, Akira. "The Tool for Measurement of Visual Image". Bulletin of
JSSD, pp.114, 1997. 15. Chuang, Y. L. and Chen L. L. “Computer Aided Kaisei Engineering with Xml Technology”.
6th Asian Design International Conference, Japan Tsukuba, 2003. 16. Chuang, Y. L., and Chen, L. L. "CAKE: An extensive Kansei image survey and analytical
system". Journal of Design. 12(3): 63~81, 2007.

Shih-Yen Huang & Jih-Shyong Lin
International Journal of Business Research and Management (IJBRM), Volume (1): Issue (2) 31
17. Peter, J.P. and Olson, J.C. "Consumer Behavior and Marketing Strategy". Richard D. Irwin Inc., pp.5-6, 2000.
18. Engel, J.F., D.T. Kollat, and R.D. Blackwell. "Consumer Behavior". 6th ed., Chicago, M.I.:
The Dryden Press, 1990. 19. Schiffman, G.L. and Kanuk, L.L. "Consumer Behavior". 5th ed., Englewood Cliffs, N. J.:
Prentice-Hall, p.47, 1994. 20. Zikmund, G. William and D.A. Michael. "Marketing". N. Y.: West Publishing, 1993. 21. Zaltman, G. "Consumer Researchers: Take a Hike". Journal of Consumer Research, 26:423-
428, 2000. 22. Engel, J. F., R.D. Blackwell and P. W. Miniard. "Consumer Behavior". 9th ed., N.Y.: The
Dryden Press, 2001. 23. Kotler, P. "Marketing Management: Analysis, Planning, Implementation and Control". 11th
ed., N.J.: Prentice-Hall Inc, 2003. 24. Weinstein, A."Market segmentation: Using Niche marketing to exploit new markets".
Chicago: Probus, 1987. 25. Smith, W. R. "Product differentiation and market segmentation as an alternative marketing
strategy". Journal of Marketing, 21(1):3–8, 1956. 26. Kotler, P., & Gordon, M. "Principles of market". Canada: Prentice Hall, 1983. 27. Croft, M. J. "Market segmentation: A step-by-step guide to profitable new business". London,
New York: Routledge, 1994. 28. Myers, J. H. "Segmentation and positioning for strategic marketing decisions". Chicago:
American Marketing Association, 1996. 29. Piercy, N. "Market-Led Strategic Change". Butterworth-Heinemann Ltd, Oxford, UK, 1997. 30. McDonald, M. "Marketing Plans". Butterworth-Heinemann, Oxford, UK, 1995. 31. Anderson, C., & Vinze, J. W. Strategic marketing management. New York: Houghton Mifflin,
2000. 32. Aaker, D. A. "Strategic market managemen"t. New York: John Wiley and Son, 2001. 33. Chow, W. S. "Multivariate Statistical Analysis: with Application of SAS/ STAT". Published by
Best Wise Co., Ltd., Taipei, 2002. 34. Huang, S. Y. "Applying image scale to the product development using the backpack for
motorcycle as an example". Journal of Arts and Design, Huafan University, 1:167-182, 2004.
35. Lin, J. S. and Huang, S. Y. "Developing a web-based 2-dimensional image scale analytical
tool". 1ST International Conference on Digital Interactive Media Entertainment & Art, Rangsit University, Thailand, 2006.

Shih-Yen Huang & Jih-Shyong Lin
International Journal of Business Research and Management (IJBRM), Volume (1): Issue (2) 32
36. Lin, J. S., Chang, C. C. and Huang, S. Y. "Applying web technique in market segmentation and product form feature analysis". The Second International Conference on Innovative Computing, Information and Control, Japan, 2007. 37. Zwicky, F. “The Morphological Approach to Discovery”. Invention, Reearch and Construction, New Method of Though and Procedure: Symposium on Methodologies, Pasadena, 1967. 38. Wind, Y. "Issues and Advances in Segmentation Research". Journal of Marketing Research 15: 317–337, 1978. 39. Green, P. E. "A New Approach to Market Segmentation". Business Horizons, 20, pp.61–73, 1977. 40. Huang, S. Y. "Conducting new mineral water design and development through the lock on of
target market". Chung Yuan Journal of Design, 8(2):1-23, 2005.