
Analyzing Reliability and Validity in Outcomes Assessment (Part 1) Robert W. Lingard and Deborah K....
32
Analyzing Reliability and Validity in Outcomes Assessment (Part 1) Robert W. Lingard and Deborah K. van Alphen California State University, Northridge April 16, 2010 Lingard & van Alphen 1
-
Upload
alban-harris -
Category
Documents
-
view
217 -
download
0
Transcript of Analyzing Reliability and Validity in Outcomes Assessment (Part 1) Robert W. Lingard and Deborah K....
Analyzing Reliability and Validity in Outcomes
Assessment(Part 1)
Robert W. Lingard and Deborah K. van Alphen
California State University, Northridge
April 16, 2010 Lingard & van Alphen 1

April 16, 2010 Lingard & van Alphen
Overview
Introduction Basic statistical measures and concepts Sampling Reliability and Validity
2

April 16, 2010 Lingard & van Alphen
Introduction – Basic Questions
How can we make assessment easier? Minimize the effort required to collect data
How can we design an assessment to provide useful information? Use tools to evaluate the approach
How can we learn more from the assessment results we obtain? Use tools to interpret quantitative data
3

April 16, 2010 Lingard & van Alphen
Making Assessment Easier
Depend on assessments at the College or University level.
Assess existing student work rather than creating or acquiring separate instruments.
Measure only a sample of the population to be assessed.
4

April 16, 2010 Lingard & van Alphen
Designing Assessments to Produce Useful Information
How should the students or student work to be measured be selected?
Is the assessment approach stable and consistent?
Does the assessment instrument measure what is intended to be assessed?
5

Learning More from Assessment Results
Was the sample used representative and large enough?
Were the instrument and process utilized dependable?
Were the results obtained meaningful? Is a difference between two results
significant?
April 16, 2010 Lingard & van Alphen 6
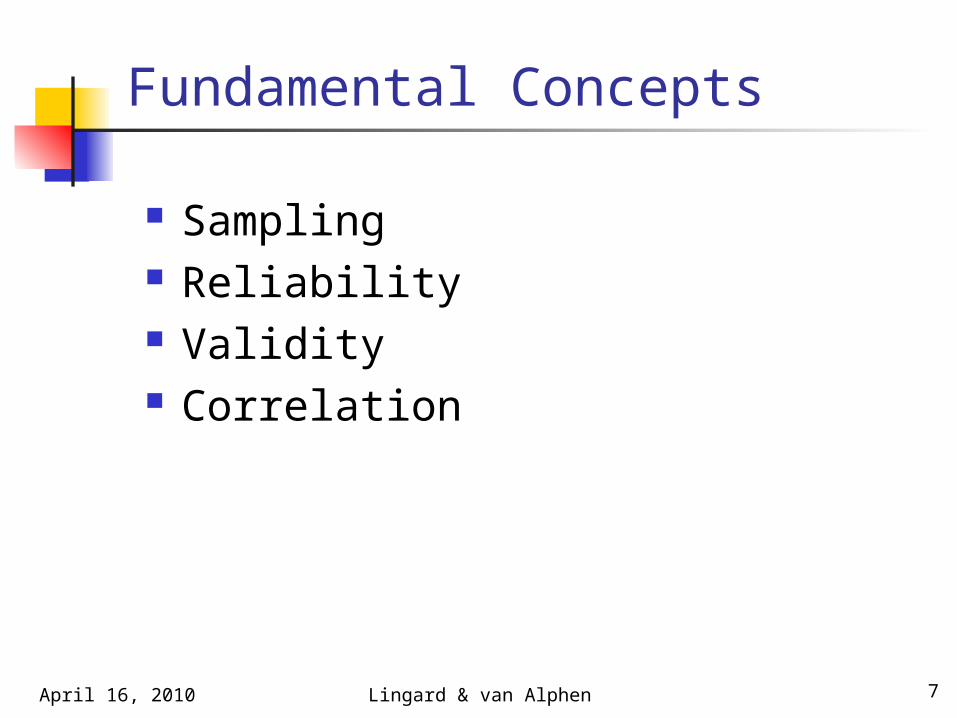
Fundamental Concepts
Sampling Reliability Validity Correlation
April 16, 2010 Lingard & van Alphen 7

April 16, 2010 Lingard & van Alphen 8
Definition of Terms Related to Sampling
Data: Observations (test scores, survey responses) that have been collected
Population: Complete collection of all elements to be studied (e.g., all students in the program being assessed)
Sample: Subset of elements selected from a population
Parameter: A numerical measurement of a population
Statistic: A numerical measurement describing some characteristic of a sample
8

April 16, 2010 Lingard & van Alphen 9
Sampling Example
There are 1000 students in our program, and we want to study certain achievements of these students. A subset of 100 students is selected for measurements.
Population = 1000 students
Sample = 100 students
Data = 100 achievement measurements9

April 16, 2010 Lingard & van Alphen 10
Methods of Sample Selection
Probability Sampling: The sample is representative of the population
Non-Probability Sampling: The sample may or may not represent the population
10

Probability Samples
Random sample: Each member of a population has an equal chance of being selected.
Stratified random sample: The population is divided into sub-groups (e.g., male and female) and a random sample from each sub-group is selected.
Cluster sample: The population is divided into clusters and a random sample of clusters is selected.
April 16, 2010 11Lingard & van Alphen

Non-Probability Samples
Convenience sample: The sample that is easily available at the time.
Network sample: The sample is constructed by finding members of the population through the contacts of a known member.
Quota sample: The sample takes available subjects, but it attempts to ensure inclusion of representatives from certain elements of the population.
April 16, 2010 12Lingard & van Alphen

April 16, 2010 Lingard & van Alphen
Problems with Sampling
The sample may not be representative of the population.
The sample may be too small to provide valid results.
It may be difficult to obtain the desired sample.
13
April 16, 2010 Lingard & van Alphen
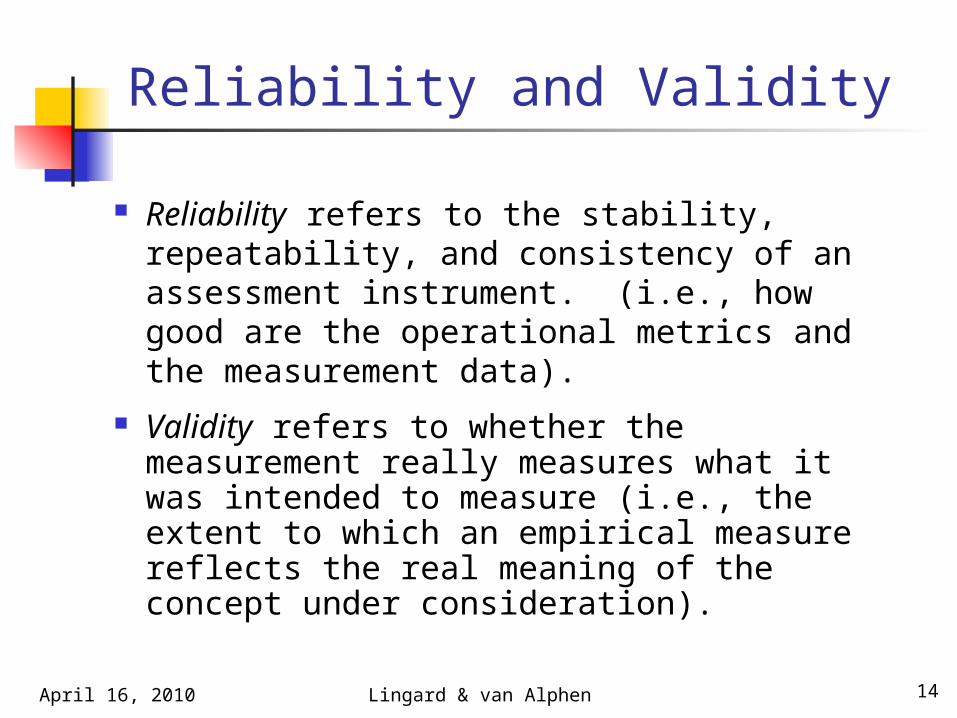
Reliability and Validity
Reliability refers to the stability, repeatability, and consistency of an assessment instrument. (i.e., how good are the operational metrics and the measurement data).
Validity refers to whether the measurement really measures what it was intended to measure (i.e., the extent to which an empirical measure reflects the real meaning of the concept under consideration).
14
April 16, 2010 Lingard & van Alphen
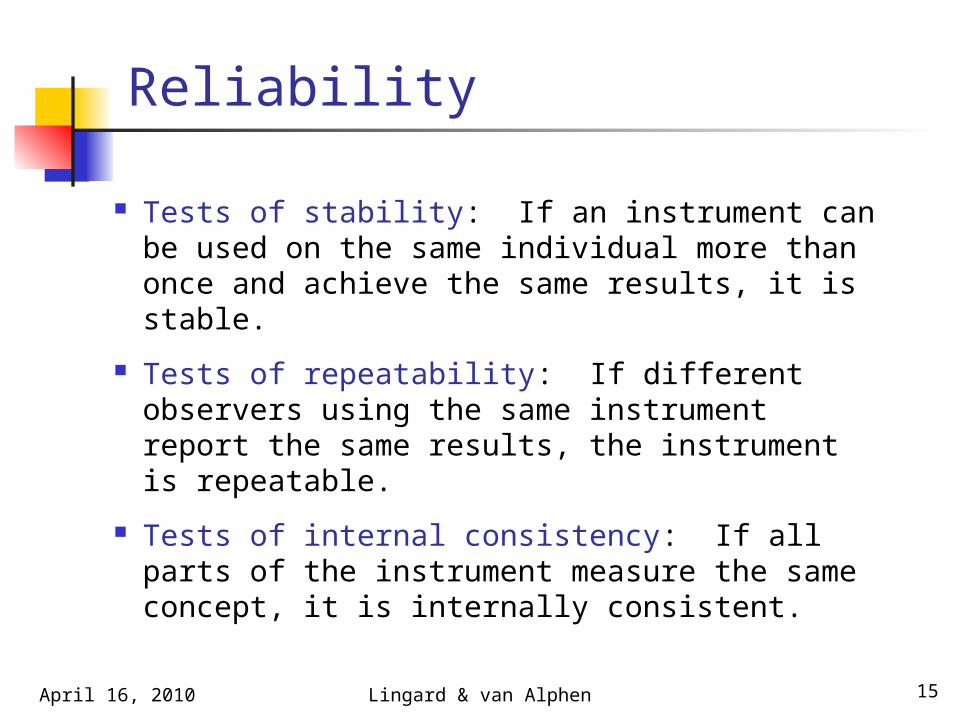
Reliability
Tests of stability: If an instrument can be used on the same individual more than once and achieve the same results, it is stable.
Tests of repeatability: If different observers using the same instrument report the same results, the instrument is repeatable.
Tests of internal consistency: If all parts of the instrument measure the same concept, it is internally consistent.
15

April 16, 2010 Lingard & van Alphen
Validility
Self-evident measures: Does the instrument appear to measure what it is supposed to measure.
Face validity: “It looks all right on the face of it.”
Content validity: The validity is estimated from a review of literature on the topic or through consultation with experts.
16

April 16, 2010 Lingard & van Alphen
Validility (Cont’d)
Pragmatic measures: These test the practical value of a particular instrument.
Concurrent validity: The results have high correlation with an established measurement.
Predictive validity: The results predicted actually occur.
Construct validity: When what you are attempting to measure is not directly observable, and the results correlate with a number of instruments attempting to measure the same construct.
17

April 16, 2010 Lingard & van Alphen
Reliability and Validity
Reliable butnot valid
Valid butnot reliable
Reliable& valid
18

Correlation
Correlation is probably the most widely used statistical method to assess relationships among observational data.
Correlation can show whether and how strongly two sets of observational data are related.
Can be used to show reliability or validity by attempting to correlate the results from different assessments of the same outcome.
April 16, 2010 Lingard & van Alphen 19

Example Correlation
April 16, 2010 Lingard & van Alphen 20

April 16, 2010 Lingard & van Alphen
Group Problem
Assume your goal is to assess the written communication skills of students in your program. (Assume the number of students in the program is large and that you already have a rubric to use in assessing student writing.)
Working with your group devise an approach to accomplish this task.
21
April 16, 2010 Lingard & van Alphen
Group Problem (Cont’d)
Specifically, who would you assess and what student produced work items would you evaluate, i.e., how would you construct an appropriate sample of students (or student work) to assess?
Identify any concerns or potential difficulties with your plan, including issues of reliability or validity.
What questions are you likely to have regarding the interpretation of results once the assessment is completed?
22

April 16, 2010 Lingard & van Alphen
Basic Statistical Concepts
Central tendency for data Frequency distribution of data Variation among data
23

Measure of Central Tendency: Mean
n = number of observations in a sample x1, x2, …, xn denotes these n observations , the sample mean, is the most common measure of
center (a statistic) is the arithmetic mean of the n
observations:
µ represents the population mean, a parameter
x xi
i1
n
n
x
x
April 16, 2010 24Lingard & van Alphen

Frequency Distribution of Data
The tabulation of raw data obtained by dividing the data into groups of some size and computing the number of data elements falling within each pair of group boundaries
April 16, 2010 25Lingard & van Alphen

Frequency Distribution – Tabular Form
Group Interval Frequency Relative Frequency
0.00-9.99 1 1.18%10.00-19.99 2 2.35%20.00-29.99 6 7.06%30.00-39.99 16 18.82%40.00-49.99 22 25.88%50.00-59.99 19 22.35%60.00-69.99 12 14.12%70.00-79.99 6 7.06%80.00-89.99 0 0.00%
90.00-100.00 1 1.18%
April 16, 2010 26Lingard & van Alphen

Histogram
A histogram is a graphical display of statistical information that uses rectangles to show the frequency of data items in successive numerical intervals of equal size. In the most common form of histogram, the independent variable is plotted along the horizontal axis and the dependent variable is plotted along the vertical axis.
April 16, 2010 27Lingard & van Alphen

Frequency Distribution -- Histogram
0
5
10
15
20
25
5 15 25 35 45 55 65 75 85 95
Test Scores
Fre
qu
ency
April 16, 2010 28Lingard & van Alphen

Variation among Data
The following three sets of
data have a mean of 10:
{10, 10, 10}
{5, 10, 15}
{0, 10, 20}
A numerical measure of their variation is needed to describe the data.
The most commonly used measures of data variation are:
Range
Variance
Standard Deviation
April 16, 2010 29Lingard & van Alphen

Measures of Variation: Variance
Sample of size n: x1, x2, …, xn
One measure of positive variation is
Definition of sample variance
(sample size = n):
Definition of population variance
(population size = N):
xi x 2
s2 xi x 2
i1
n
n 1
2 xi 2
i1
N
N
April 16, 2010 30Lingard & van Alphen

Measures of Variation: Standard Deviation
Sample Standard Deviation:
Population Standard Deviation:
The units of standard deviation are the same as the units of the observations
s s2 xi x 2
i1
n
n 1
2 xi 2
i1
n
n
April 16, 2010 31Lingard & van Alphen

The following data sets each have a mean of 10.
Measures of Variation: Variance and Standard Deviation
Data Set Variance Standard Deviation
10, 10, 10 (0+0+0)/2 = 0 0
5, 10, 15 (25 + 0 + 25)/2 = 25 5
0, 10, 20 (100 + 0 + 100)/2 = 100 10
Good measure of variation
April 16, 2010 32Lingard & van Alphen