Analyzing of Public Transport Trip Generation in Developing Countries A Case Study in Yogyakarta,...
5
1. Dept. of Civil and Environmental Engineering Gadjah Mada University, Yogyakarta,, Indonesia. E-mail : [email protected] 2.Ministery of Public Work, Jakarta, E-mail: Ep_friandi@yahoo.com Analyzing of Public Transport Trip Generation in Developing Countries; A Case Study in Yogyakarta, Indonesia S. Priyanto¹ and E.P Friandi² Abstract—Yogyakarta, as the capital city of Yogyakarta Province, has important roles in various sectors that require good provision of public transportation system. Ideally, a good transportation system should be able to accommodate the amount of travel demand. This research attempts to develop a trip generation model to predict the number of public transport passenger in Yogyakarta city. The model is built by using multiple linear regression analysis, which establishes relationship between trip number and socioeconomic attributes. The data consist of primary and secondary data. Primary data was collected by conducting household surveys which randomly selected. The resulted model is further applied to evaluate the existing TransJogja, a new Bus Rapid Transit system serves Yogyakarta and surrounding cities, shelters. Keywords—multiple linear regression, shelter evaluation, travel demand, trip generation. I. INTRODUCTION OGYAKARTA, as the capital city of Yogyakarta Province, has important roles in various sectors such as education, tourism, administration center and commerce. The centralization of those activities has developed Yogyakarta became high density city. In 2009, the number of population that settled in Yogyakarta Province was approximately 1.254.731 people. The population density varied among districts from 1.236 persons/ km 2 to 15.123 persons/ km 2 with average 2.990 persons/km 2 . This population growth is predicted to increase every year that make the provision of good and reliable public transportation become a vital part to support the population activities. The need for transportation is a derived demand, in which the movement emerged as the process to fulfill people’s daily need such as employment, education, health and sport. Transportation demand occurred because all of those daily needs did not available in one place. In other word, the transportation demand is highly related with the land use pattern and the facilities that available in a region or zone that generated or attracted people’s movement. Moreover, the demand for transportation services is qualitative and has different characteristics as a function of time, trip purposes, frequency, etc. The transportation service which does not conform to transportation demand causes the transportation system become inefficient. Thus, the provision of transportation facilities should be made carefully. Currently, Yogyakarta has been served by many routes of public transportation especially buses. According toYogyakarta Governor Decree no. 114/KEP/2005, there were 15 bus’ routes that served Yogyakarta city and surrounding region. The operation of the routes is handed over to four private operators and one government agency. However, the performance of these routes did not seem to be effective. Based on a research conducted by Yogyakarta Transportation Agency (Dinas Perhubungan Yogyakarta) in 2007, the ridership of each route is still low. The load factor ranged from 6.7% to 53.5% with average 31.23%. This condition will be risky for the sustainability of the existing operator since their operation cost highly depends on the ridership rate [1]. In 2008, Yogyakarta’s local government has introduced new concept of public transportation. It adopted Bus Rapid Transit system which has been implemented in Jakarta known as TransJakarta. The system is called TransJogja which provided more convenient and reliable public transportation mode for Yogyakarta citizens. The local government is trying to develop this new kind of public transportation and planning to expand the network with wider coverage area. Therefore, studies related with transportation system planning are needed for creating good system. The changes in land use pattern and the rapid growth of vehicle ownership, especially motorcycle, have shifted the people movement pattern. Thus, new planning should be conducted in order to create reliable and sustainable public transport system. Hence, the trip generation model, as the initial step in four step transportation model, has important role in predicting the travel demand especially for public transport. The relationship among various factors related with people’s trip should be established in order to know how many trips that will be generated or attracted in the interaction between land use and socioeconomic characteristics [2]. This study attempts to develop a trip generation model for public transport passengers. Furthermore, the resulted model is used to evaluate the existing facilities of TransJogja Bus Rapid Transit particularly the shelter location by comparing its position and the number of demand in respective zone. II. METHOD AND DATA COLLECTION The research is conducted in Yogyakarta city, the capital city of Yogyakarta Province, which locates on the southern of Central Java, Indonesia. Yogyakarta city lies between two other cities, which are Bantul on the southern and Sleman on Y World Academy of Science, Engineering and Technology 42 2010 1407
Transcript of Analyzing of Public Transport Trip Generation in Developing Countries A Case Study in Yogyakarta,...

1. Dept. of Civil and Environmental Engineering Gadjah Mada University, Yogyakarta,, Indonesia. E-mail : [email protected] 2.Ministery of Public Work, Jakarta, E-mail: [email protected]
Analyzing of Public Transport Trip Generation in Developing Countries;
A Case Study in Yogyakarta, Indonesia
S. Priyanto¹ and E.P Friandi²
Abstract—Yogyakarta, as the capital city of Yogyakarta Province, has important roles in various sectors that require good provision of public transportation system. Ideally, a good transportation system should be able to accommodate the amount of travel demand. This research attempts to develop a trip generation model to predict the number of public transport passenger in Yogyakarta city. The model is built by using multiple linear regression analysis, which establishes relationship between trip number and socioeconomic attributes. The data consist of primary and secondary data. Primary data was collected by conducting household surveys which randomly selected. The resulted model is further applied to evaluate the existing TransJogja, a new Bus Rapid Transit system serves Yogyakarta and surrounding cities, shelters.
Keywords—multiple linear regression, shelter evaluation, travel
demand, trip generation.
I. INTRODUCTION OGYAKARTA, as the capital city of Yogyakarta Province, has important roles in various sectors such as education, tourism, administration center and commerce.
The centralization of those activities has developed Yogyakarta became high density city. In 2009, the number of population that settled in Yogyakarta Province was approximately 1.254.731 people. The population density varied among districts from 1.236 persons/ km2 to 15.123 persons/ km2 with average 2.990 persons/km2. This population growth is predicted to increase every year that make the provision of good and reliable public transportation become a vital part to support the population activities.
The need for transportation is a derived demand, in which the movement emerged as the process to fulfill people’s daily need such as employment, education, health and sport. Transportation demand occurred because all of those daily needs did not available in one place. In other word, the transportation demand is highly related with the land use pattern and the facilities that available in a region or zone that generated or attracted people’s movement. Moreover, the demand for transportation services is qualitative and has different characteristics as a function of time, trip purposes, frequency, etc. The transportation service which does not conform to transportation demand causes the transportation system become inefficient. Thus, the provision of transportation facilities should be made carefully.
Currently, Yogyakarta has been served by many routes of public transportation especially buses. According toYogyakarta Governor Decree no. 114/KEP/2005, there were 15 bus’ routes that served Yogyakarta city and surrounding region. The operation of the routes is handed over to four private operators and one government agency. However, the performance of these routes did not seem to be effective. Based on a research conducted by Yogyakarta Transportation Agency (Dinas Perhubungan Yogyakarta) in 2007, the ridership of each route is still low. The load factor ranged from 6.7% to 53.5% with average 31.23%. This condition will be risky for the sustainability of the existing operator since their operation cost highly depends on the ridership rate [1].
In 2008, Yogyakarta’s local government has introduced new concept of public transportation. It adopted Bus Rapid Transit system which has been implemented in Jakarta known as TransJakarta. The system is called TransJogja which provided more convenient and reliable public transportation mode for Yogyakarta citizens. The local government is trying to develop this new kind of public transportation and planning to expand the network with wider coverage area. Therefore, studies related with transportation system planning are needed for creating good system.
The changes in land use pattern and the rapid growth of vehicle ownership, especially motorcycle, have shifted the people movement pattern. Thus, new planning should be conducted in order to create reliable and sustainable public transport system. Hence, the trip generation model, as the initial step in four step transportation model, has important role in predicting the travel demand especially for public transport. The relationship among various factors related with people’s trip should be established in order to know how many trips that will be generated or attracted in the interaction between land use and socioeconomic characteristics [2]. This study attempts to develop a trip generation model for public transport passengers. Furthermore, the resulted model is used to evaluate the existing facilities of TransJogja Bus Rapid Transit particularly the shelter location by comparing its position and the number of demand in respective zone.
II. METHOD AND DATA COLLECTION
The research is conducted in Yogyakarta city, the capital city of Yogyakarta Province, which locates on the southern of Central Java, Indonesia. Yogyakarta city lies between two other cities, which are Bantul on the southern and Sleman on
Y
World Academy of Science, Engineering and Technology 42 2010
1407
the northern. The public transportation network, especially bus’ routes, served Yogyakarta region as well as these two nearby cities. According to administrative zones, Yogyakarta city consists of 14 districts. The districts are further used in zoning system while surrounding regencies are considered as external zones. Trip generation model was established using multiple linear regression analysis which provides relationship between socioeconomic attributes of the city with the number of public transport trips. The data consists of primary data and secondary data.
Primary data collection was carried out by household survey. Simple random sampling technique is used to draw samples from the household population. For given number of population (N) and confidence level (e), the number of sample can be determined using formula by [3], as follows:
2)(1 eN
Nn+
=
Using Yogyakarta population as many as 110,005
households and confidence level 5%, the minimum amount of samples required are 399 samples. In this study, this number is extended to 554 samples. These amounts are distributed to each district. Each district is represented by at least 30 samples, and the rest of samples were distributed to district with greater population. The number of collected samples in every district is shown in Table 1.
TABLE 1 SAMPLES DISTRIBUTION AMONG DISTRICTS
No. Districts Number of samples
1 Mergangsan 40 2 Gondomanan 30 3 Danurejan 34 4 Kraton 34 5 Umbulharjo 74 6 Pakualaman 30 7 Ngampilan 30 8 Gondokusuman 69 9 Mantrijeron 41
10 Kotagede 37 11 Tegalrejo 44 12 Wirobrajan 30 13 Gedongtengen 30 14 Jetis 31
Total 554
III. TRIP CHARACTERISTICS
A. Trip Purpose Classification of trips according to its purpose is important
to be carried out since people do the travels for various reasons [4]. In this research, among 863 trips generated by 554 surveyed households, most of the trips (329 trips, 38.12%) are home based school trip where either origin or destination of the trip maker is home or school. Home based shopping, work and university are as many as 170, 163 and 148 trips or
19.70%, 18.89% and 17.15% of the total trips respectively. Complete results for trip purpose classification are shown in Fig. 1
Fig. 1 Classification based on trip purpose
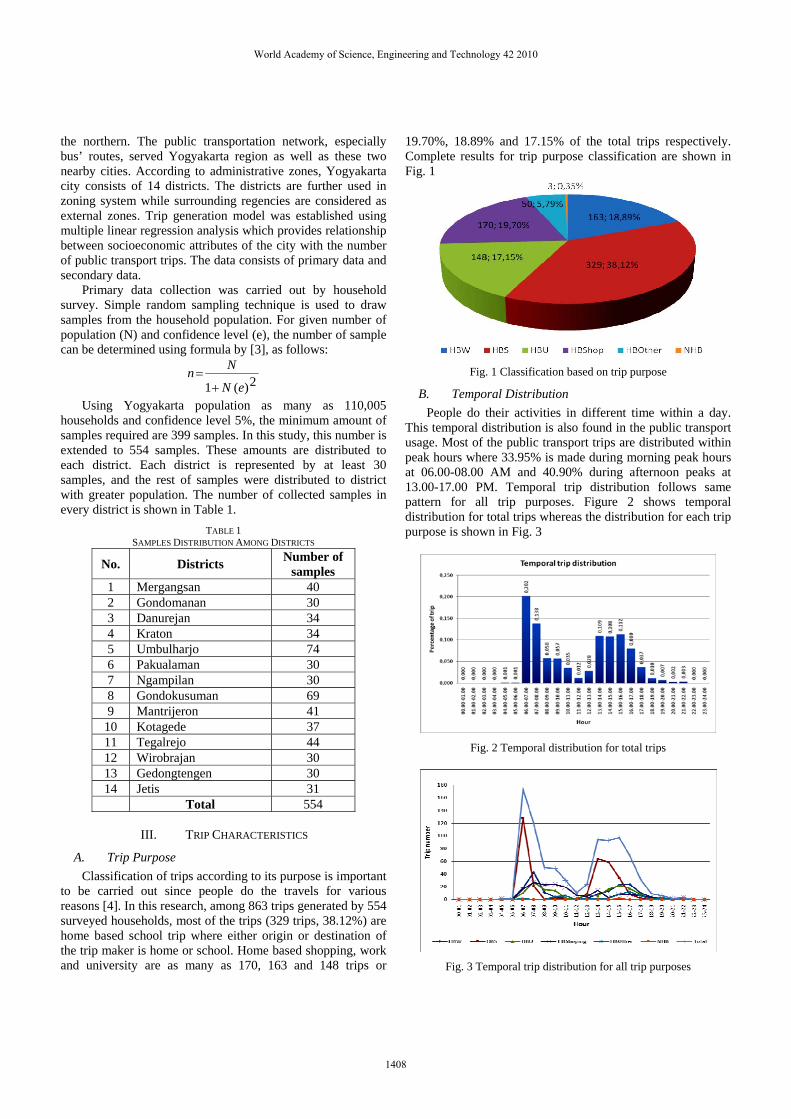
B. Temporal Distribution People do their activities in different time within a day.
This temporal distribution is also found in the public transport usage. Most of the public transport trips are distributed within peak hours where 33.95% is made during morning peak hours at 06.00-08.00 AM and 40.90% during afternoon peaks at 13.00-17.00 PM. Temporal trip distribution follows same pattern for all trip purposes. Figure 2 shows temporal distribution for total trips whereas the distribution for each trip purpose is shown in Fig. 3
Fig. 2 Temporal distribution for total trips
Fig. 3 Temporal trip distribution for all trip purposes
World Academy of Science, Engineering and Technology 42 2010
1408

IV. SOCIOECONOMIC CONDITIONS The decision to make a public transport journey is
influenced by several socioeconomic attributes. This section delivers several relationships between average trip and some socioeconomics attributes such as income, family size, motorcycle ownership and car ownership.
A. Income Fig. 4 shows the relationship between trip makers income
and the average trip. In general, the trip rate declines with the increasing income of the trip makers. The highest trip rate is made by travelers with no income with average 1.24 trips. This value decreases to 0.33 for trip makers with income between 0 to Rp. 1 million and continue to decline with increasing trip makers income.
Fig. 4 Relationship between income and trip rate
B. Family Size Family size tends to give positive relationship with
average trip. The highest average trip is committed by household with 10 family members. The number of average trip declines with reducing the number of family members in household. Fig. 5 depicts the relationship between average trip and family size.
Fig. 5 Relationship between family size and average trip
C. Motorcycle Ownership
The survey results show that motorcycle ownership reduces the average number of trip committed by household. The highest rate (1.74 trips) is made by household with no motorcycle ownership. This value tends to decrease as the
number of motorcycle ownership increase. Fig. 6 shows the relationship between motorcycle ownership and average public transport trip of household.
Fig. 6 Motorcycle ownership vs average trip
D. Car Ownership Relationship between car ownership and average trip conducted by households also shows similar trend with that of motorcycle. The average household trip decreases with the increasing of number of car owned by it. There are 1.60 public transport trips per household made by household with no car ownership. This value declines to 1.30 trips on household with 1 car and continues to decrease as number of car increases. Fig. 7 shows the relationship between average trip and car ownership.
Fig. 7 Car ownership vs average trip
V. ANALYZING TRIP GENERATION
Trip generation can be divided into two parts [5]. The first model is trip production model which provides relationship between socioeconomic attributes and number of trip generated from a zone. Another model concerns with relationship between socioeconomic attributes and trip attracted to a zone which known as trip attraction model.
A. Trip Production Model There are several independent variable candidates which
will be used in trip generation model. These variables were further tested to see their correlation with trip number as dependent variable. Those independent variables are population, car ownership, motorcycle ownership, household income, employee rate, student rate and accessibility of buses.
World Academy of Science, Engineering and Technology 42 2010
1409
Before developing the model, all the variables should be tested to see their relationship with dependent variables. Ideally, the independent variables should have strong relationship with dependent variable that shown by correlation value approaching 1.00. In contrast, there should be low correlation among independent variables. The analysis result shows that most of independent variable candidates have relatively high correlation with dependent variable (TN). The lowest correlation is found in employee rate with 0.101 correlations to trip number (TN). However, there are some independent variables that have high correlation with each other. These variables will be given more attention in the modeling stage.
The model was developed by considering the correlation matrix of variables. Multiple linear regressions were carried out to some combinations of independent variables. The regression analysis was conducted several times. In each stage, the regression equation was evaluated according to statistical measures. The iteration was made by reducing the independent variables which has lowest correlation value to the dependent variable. The selected trip generation model is;
TN = -71,283.21 + 6,133.50 ln PO + 13,610.26 SR
Where TN = trip number per day, PO = number of
population, and SR = average number of student in a household. This model has coefficient determination 0.60. Significant test (t test) of individual variable gives t stat value 2.32 (p value = 0.04) for PO and 2.58 (p value = 0.03) for SR. The t statistic and p value are significant for 5% confident level. Moreover, the heteroscedasticity and multicollinearity tests were also carried out to see the accuracy of the developed model.
B. Trip Attraction Model The number of trip attracted to a zone is influence by
several socioeconomics attributes. These attributes are used as the independent variables in establishing trip attraction model as follows; a. Number of school’s classroom, which are the total
number of classroom in all school in a zone. The schools consist of kindergarten, elementary school and high school.
b. Number of university. It shows the total number of university in a zone.
c. Praying facilities; include all praying facilities in a zone such as mosque, church, vihara, etc.
d. Medical facilities; consist of hospital and other medical clinics in a zone.
e. Recreation facilities; consists of places for the people to spend their leisure time.
f. Hotel; it is stated as the total number of hotel room in a zone.
g. Sport facilities; consist of badminton court, tennis, football field, etc.
h. Market; is stated as the area of market building in m2
i. Office; is the number of government office in a zone j. Accessibility; gives the measure of public transport
accessibility to a zone. Correlation test results reveals that most of independent
variable candidates have relatively high correlation with dependent variable (TN). However, some independent variables have high correlation with each other
Like in trip production model, several trip attraction models were also developed using some combinations of independent variables. The selected trip generation model has coefficient of determination 0.75 and t stat and p value of individual variable 6.40 and 0.00 respectively. The model is;
TN = 1590.97 + 31.59 SC
Where TN = trip attracted, and SC is number of school classroom in a zone. Note that, the heteroscedasticity test was also done to see the accuracy of the model.
VI. APPLICATION OF THE MODEL AND DISCUSSIONS Yogyakarta has tried to restructure its transportation
facilities by providing a more reliable public transportation system. It is actualized with constructing a Bus Rapid Transit System called TransJogja that was first operated in 2008. Ideally, the public transportation facilities should be design in conforms to its demand. This section attempts to assess current transportation facilities of TransJogja. The evaluation is focused on the location of bus shelters. The analysis is conducted by matching between the predicted demands with the location of TransJogja shelters.
A. Demand Estimation The number of passengers that is generated and attracted
to each district in Yogyakarta city is predicted by using the developed model in previous section. Trip generated is predicted by the model TN = -71,283.21 + 6,133.50 ln PO + 13,610.26 SR where TN; trip number, PO; district’s population, and SR is student rate in each household. In the other hand, trip attracted to each district is predicted by using attraction model TN = 1590.97 + 31.59 SC where SC; number of school classroom in respective district. The comparison of trip generation and attraction in each district is shown in Fig. 8. It reveals that the number of trip generated in some districts is greater than the number of trip attracted where the others are vice versa. Gondokusuman and Umbulharjo are the districts with highest number of trip generated and attracted. The lowest number of trip generation is found in Kotagede district while the lowest attraction is in Pakualaman district.
B. Comparison between Shelter Location and Demand TransJogja system only allows the passenger to make
boarding and alighting in the shelters. Therefore, the shelter has an important role to facilitate the passenger to the transportation mode. In this study, the number of shelter in each district is compared with number of public transportation demand in respective district. The demand used in analysis is
World Academy of Science, Engineering and Technology 42 2010
1410

the greater one between the number of production and attraction. Since the demand resulted in the model stated in the number of trips per day, the peak hour demand is found by using factor (0.20) that was obtained in the temporal distribution. The comparison of trip generation and number of shelter in each district is shown in Fig. 9.
Fig. 8 The estimated trip generation and attraction
Fig. 9 Comparison between generation and number of shelter
Fig. 9 reveals that the position of the current shelters still
does not match with the number of demand in the region. Tegal Rejo, and Wirobrajan have relatively high number of trip demand but these area are served by few shelters. In Tegal Rejo, there is only one shelter to accommodate 2,346 passengers per hour. It can be caused by there is only one route of TransJogja served that area which is route 2B. In Wirobrajan, there is no shelter to serve as many as 2,002 passengers demand/hour. The reason of the lack of shelter is that area is not passed by TransJogja route. Perhaps it can be considered to conduct the study with considering additional route to serve that area. The same cases also occur in Pakualaman and Gedongtengen district where there is no shelter to facilitate 1,427 and 1,297 peak hour demand respectively. Unlike in Wirobrajan and Tegal Rejo district, these areas are passed by two and three TransJogja routes respectively. Pakualaman district is served by route 1A and 1B while Gedongtengen served by 1B, 2A, 3A. As the comparison, Kotagede and Gondomanan which have approximately same demand with Pakualaman and Gedongtengen are served by eight and three shelters respectively.
VII. CONCLUSIONS This study aims to develop trip generation model for
public transport passenger in Yogyakarta by using multiple linear regression analysis. The analysis was based on the household survey and some conclusions can be drawn as follows: a. Public transportation trip seems to have negative
correlation with income, motorcycle ownership and car ownership. It means that the number of trip made by the people decreases with the increasing in income, the number of motorcycle and car owned. It is different with the general trip generation model (the trip is modeled for all trip either private or public transportation) where the number of trip commonly rises with the increasing of income, motorcycle and car ownership.
b. The number of public transport trip is increase with the increasing of the number of family size. Commonly, the higher is the number of family member; more public transport trips will be conducted.
c. The application of the model to shelter evaluation shows that the location of current shelters does not appropriate to accommodate the demand in each district. Some of the districts which have relatively high demand, such as Tegal Rejo and Wirobrajan, are not served by enough shelters.
ACKNOWLEDGMENT
The authors express gratitude their sincere thanks to the Senior Vice Rector for Administration Gadjah Mada University for their support to conduct the study and to finance the presentation of this paper. Thank is also extended to colleagues in Transport Laboratory, Dept. of Civil and Environmental Engineering Gadjah Mada University, Yogyakarta Indonesia.
REFERENCES
[1] Yogyakarta Transportation Agency, (2007)., The evaluation of urban
public transportation performance in Yogyakarta Province. [2] Button, K., (2000) Handbook of Transport Modeling, Pergamon. [3] Aczel., Amir, D., (1999) Complete Business Statistics, Mc Graw-Hill. [4] Meyer, D.M, Miller, J.E., (2001), Urban Transportation Planning,
McGraw-Hill [5] Ortuzar, J.D., Wilumsen, L.G., (1994) Modelling Transport, John Wiley
& Sons.
World Academy of Science, Engineering and Technology 42 2010
1411