Analyzing Food Security in Worcester
78
i Analyzing Food Security in Worcester An Interdisciplinary Qualifying Project Submitted to the faculty of Worcester Polytechnic Institute In partial fulfillment of the requirements for the Degree of Bachelor of Science Submitted By: David Allen James Filice Neel Patel Brandy Warner Advised By: Prof. Robert Hersh Sponsor: Liz Sheehan Castro (Worcester Food and Active Living Policy Council) May 15, 2012
Transcript of Analyzing Food Security in Worcester

i
Analyzing Food Security in Worcester
An Interdisciplinary Qualifying Project
Submitted to the faculty of Worcester Polytechnic Institute
In partial fulfillment of the requirements for the Degree of Bachelor of Science
Submitted By: David Allen James Filice Neel Patel
Brandy Warner
Advised By: Prof. Robert Hersh
Sponsor: Liz Sheehan Castro (Worcester Food and Active Living Policy Council)
May 15, 2012

i
Abstract
Our study, sponsored by the Worcester Food Policy and Active Living Council (WFPALC),
assessed community food security in the City of Worcester. Quantitative data from the city’s food
retail outlets, including location, price, and food quality were examined against race, income, and
ethnicity census data using a Geographic Information System (GIS). Qualitative data from
interviews with local residents were synthesized to gain a nuanced perspective of how the city’s low
income residents negotiate the food system. This study demonstrated that food insecurity is more
likely to affect ethnic minority and lower income residents.

ii
Acknowledgements
The Community Food Assessment team would like to express its sincere gratitude to
everyone who helped us during the IQP process.
Specifically we would like to thank Prof. Robert Hersh for his immense contribution to this
project. Without his constant guidance and support this project would never have been possible.
We would like to further thank Liz Sheehan Castro of the Worcester Food and Active Living
Policy Council (WFALP) for giving us the opportunity to work on an emerging problem in the city
of Worcester and for providing contact information for numerous interviews.
We would also like to thank Prof. Suzanne LePage for her considerable help and guidance in
the use of the Geographic Information System.
Finally, we would like to thank all participants interviewed during the course of this project.

iii
Authorship
David Allen led the effort to collect quantitative data from stores around the City of
Worcester. In addition to this he was responsible for researching data collection methods and
adapting them to our project. He was the primary author of the abstract and introduction. He
authored the background sections concerning the causes of food insecurity and its consequences as
well as the methodology section establishing a means of measuring food availability, quality, and
price.
James Filice assisted in representing collected data as maps using GIS. He authored the
background section considering approaches to community food assessments taken in previous
studies. He also conducted research on how to best estimate access to food retail outlets in addition
to conducting GIS analyses. He was the primary author of the findings section for spatial analyses of
food access, availability, quality, and price.
Neel Patel was in charge of all project GIS work. Neel gained proficiency with ArcMap 10
and used it to create maps and generated tables to represent collected data. He researched food
security issues in Worcester, wrote analyzing spatial dimensions of food security in the Methodology,
and formatted and edited the report. Neel also assisted in writing GIS findings and analyses.
Brandy Warner conducted resident interviews and authored the interview findings. She also
researched methods for conducting interviews and wrote the corresponding methodology section.

iv
Table of Contents
Abstract ................................................................................................................................................... i
Acknowledgements .............................................................................................................................. ii
Authorship ........................................................................................................................................... iii
List of Figures ...................................................................................................................................... vi
List of Tables ...................................................................................................................................... vii
1. Introduction ............................................................................................................................... 1
2. Background ................................................................................................................................ 4
2.1 Towards a Definition of Community Food Security ...................................................... 4
2.2 Causes of Food Insecurity ................................................................................................... 4
2.3 Consequences of Food Insecurity ...................................................................................... 5
2.4 Approaches to Community Food Assessments (CFAs) ................................................. 9
2.5 Worcester Food & Active Living Policy Council .......................................................... 14
3. Methodology ............................................................................................................................ 16
3.1 Analyzing Spatial Dimensions of Food Security ............................................................ 16
Identifying target neighborhoods ........................................................................................... 16
Estimating Access to Retail Outlets ....................................................................................... 17
3.2 Measuring of Food Availability, Quality and Price ........................................................ 17
Classifying Food Sources ......................................................................................................... 17
Establishing a Healthy Food Index ........................................................................................ 19
Collecting Food Availability and Pricing Data ...................................................................... 21
3.3 Conducting Interviews to Understand Perceptions ...................................................... 21
4. Findings .................................................................................................................................... 23
4.1 Spatial analyses of food access, availability, quality and price ...................................... 23
4.2 Household Strategies to Address Food Security ............................................................ 41
5. Recommendations .................................................................................................................. 47

v
6. Reference .................................................................................................................................. 49
Appendix A: Interview Transcriptions ........................................................................................... 55
A1: Great Brook Valley:................................................................................................................ 55
A2: Plumley Village: ...................................................................................................................... 56
A3: Main South: ............................................................................................................................. 57
Appendix B: Interview Survey ......................................................................................................... 60
Appendix C: How to transfer Excel data (Lat, Long) to ArcGIS 10 ......................................... 62
Appendix D: Create Shapefile from Data you just imported ...................................................... 63
Appendix E: Additional Maps .......................................................................................................... 64
Appendix F: Pricing Data Collection Form ................................................................................... 68
Appendix G: Culturally Adapted HFAI ......................................................................................... 69

vi
List of Figures Figure 1: Prevalence of Obesity in the United States ..................................................................... 6
Figure 2: Prevalence of Diabetes in the United States .................................................................... 7
Figure 3: Heart Disease Mortality Rate in the United States ......................................................... 9
Figure 4: Block Group Ethnic Composition and Supermarket Locations in Worcester ........ 25
Figure 5: Block Group Composition and Ethnic Grocery Locations in Surveyed
Neighborhoods ................................................................................................................................................ 27
Figure 6: Block Group Household Median Income and Supermarket Locations in Worcester
............................................................................................................................................................................ 29
Figure 7: Block Group Household Median Income and Ethnic Grocery Locations in
Surveyed Neighborhoods ............................................................................................................................... 31
Figure 8: Block Group Ethnic Composition and Fast Food Restaurant Locations in
Worcester .......................................................................................................................................................... 35
Figure 9: Supermarket Locations in Worcester with Walkability Buffers .................................. 37
Figure 10: Block Group Ethnic Composition and Gas/Convenience Store Locations .......... 64
Figure 11: Block Group Median Household Income and Gas/Convenience Store Locations
............................................................................................................................................................................ 65
Figure 12: Block Group Ethnic Composition and Miscellaneous Retail Locations ................ 66
Figure 13: Block Group Median Household Income and Miscellaneous Retail Locations .... 67

vii
List of Tables Table 1: Commonalities Between Los Angeles, Berkeley, and Somerville CFAs (Synthesized
from Porthukuchi (2004 ................................................................................................................................. 10
Table 2: Average Food Retail Outlet HFAI Scores by SIC Code ............................................... 23
Table 3: Distribution of Supermarkets in Worcester with Respect to Block Group Ethnic
Composition ..................................................................................................................................................... 26
Table 4: Distribution of Ethnic Groceries and Non-Ethnic Corner Stores in Worcester with
Respect to Block Group Ethnic Composition ............................................................................................ 28
Table 5: Supermarket Distribution with Respect to Block Group Median Household Income
............................................................................................................................................................................ 30
Table 6: Ethnic Grocery Distribution with Respect to Block Group Median Household
Income ............................................................................................................................................................... 32
Table 7: Food Retail Outlet HFAI Distribution with Respect to Block Group Ethnic
Composition ..................................................................................................................................................... 33
Table 8: Food Retail Outlet HFAI Distribution with Respect to Block Group Median
Household Income .......................................................................................................................................... 34
Table 9: Fast Food Restaurant Distribution with Respect to Block Group Ethnic
Composition ..................................................................................................................................................... 36
Table 10: Average Market Basket Prices of Corner Stores in Comparison to Supermarkets . 39
Table 11: Summary Table of Worcester ......................................................................................... 40

1
1. Introduction
Community food security has become a major concern on the national scale and can be
defined as “the underlying social, economic, and institutional factors within a community that affect
the quantity and quality of available food and its affordability or price…” (Cohen, Andrews &
Kantor, 2002) Most people would assume that the U.S.A. has very food secure communities,
however “11.1 percent of United States households and 12.2 percent of all individuals, representing
more than 36.2 million people, were food insecure at one or more times in 2007” (Nord, Andrews &
Carlson, 2008p.16). Community food insecurity does affect certain groups more than others. In fact
of African American and Hispanic households, 22.2 percent and 20.1 percent, respectively, were
considered food insecurity at some time of the year and 37.7 percent of households with incomes
below the Federal Poverty Level (FPL) were food insecure. (Nord, Andrews & Carlson, 2008, p.18)
While community food security is a multifaceted issue, it is most notably “correlated with the state
of the economy. When the economy is expanding and unemployment is low, the amount of food
insecurity declines; when the economy is contracting and unemployment is rising, food insecurity
increases.” (Cook, 2002, p.12) As expected, food insecurity can have devastating and wide spread
consequences. These consequences can range from increased thoughts of suicide or depression
(Alaimo, Olson & Frongillo, 2002), risk of obesity (C. M. Olson, 1999), malnutrition, and even
tendency to act violently and commit crimes (Kleinman et al., 1998).
Ideally community food security could be improved and sustained through a wide range of
policies and programs designed to address food inequalities of the community. In the United States
Department of Agriculture (USDA) Community Food Assessment Toolkit it states that the USDA
has implemented food stamp outreach programs, farmers’ markets, community gardens, food-
buying cooperatives, community supported agriculture, farm to school initiatives, and community
kitchens in order to combat food insecurity. While these programs have improved the security of
many communities, many of them are not properly funded, staffed or maintained leading to only a
relatively small success from the potential they possess. The small success of these programs may
have reduced overall food inequalities in the U.S but poor neighborhoods (neighborhoods defined
as below the poverty line) still grapple with food inequality daily. In a study of four communities it

2
was found that “persons living in lower-income neighborhoods consumed less fruits, vegetables, and
fish but more meat than those living in higher-income neighborhoods.” (Diez Roux et al., 1999)
Another similar study found that there was “over 3 times as many supermarkets in wealthier
neighborhoods compared to the lowest wealth areas.” (Morland, Wing, Diez Roux & Poole, 2002).
This dietary inequality combined with the availability of less food in poor neighborhoods illustrates
the limits of USDA’s policies and programs to meet the community’s needs.
Food insecurity is a problem for many residents of Worcester. l. According to a recent study
by the Worcester Food and Active Living Policy Council (WFALPC), out of the 14 low-income
neighborhoods in Worcester, one child in three lives in a family that cannot meet its basic nutritional
requirements. Between 2001 and 2005 there was a 40% increase the in number of people served by
various soup kitchens and food panties associated with Worcester County Food Bank (Hunger in
America 2006) and that number has grown since the economic crisis of 2008. The link between food
security and health are highlighted in a 2006 study which showed that “Among adults reporting
health problems, 65 percent were food insecure” (Nord, Andrews & Carlson, 2005) and over 24%
of Worcester residents are obese (WFALPC, 2006). Clearly food security has become a pressing
issue in Worcester.
This project’s sponsor the WFALPC has initiated programs to help reduce food insecurity
among Worcester residents, particularly children, and low income and minority residents. From
2006 to the present they have overhauled the public school meal system, signed up 344 people for
Supplemental Nutrition Assistance Program (SNAP), worked to increase state wide SNAP
participation, established two farmers’ markets in USDA classified food deserts, created an
educational garden at a local school, developed a program to teach healthy cooking skills and has
advocated for several policy changes on the local and federal level. In the next phase of its work, the
WFALPC wants to gain a better understanding in broad terms of the workings of the local food
system—where food is produced in the city and in the region, the distribution of food outlets across
the city, how ethnicity and income affect access and availability of healthy food, and how local
residents address barriers to food access and define their local food environment.
Our project intended to aid the Worcester Food and Active Living Policy Council better
understand food access availability among low-income residents in specific neighborhoods of
Worcester. The project provides food policy-makers with resources such as maps and spatial

3
analyses of Worcester’s food system, analysis of residents’ perceptions of the local food system, and
a set of recommendations for addressing food.

4
2. Background
2.1 Towards a Definition of Community Food Security
There is no one simple definition of community food security. In a well know article, Hamm
and Bellows (2003, p.37) define it as “…a condition in which all community residents obtain a safe,
culturally acceptable, nutritionally adequate diet through a sustainable food system that maximizes
community self reliance, social justice, and democratic decision-making.”
This definition of community food security is built on the notion of closer regional
connections between growers, distributors, wholesalers, retail outlets and consumers. In this way it
poses a challenge to the more established systems by which food flows through communities:
market based corporate food production; food relief (food pantries, etc.) and the federal nutrition
safety net. Despite this challenge a community food system guided by the framework of community
food security and supported by community food assessments (CFAs) has many benefits. Pothukuchi
(2004) states that some of these benefits that affect the whole community include greater
participation in local food planning, greater connection between food security and community goals
and reduced costs to some segments of society. Even at the household and individual level benefits
can be seen such as greater knowledge of the local food system, increase in job opportunities,
greater say in the planning of the local food system and greater possibility for social accountability
(Pothukuchi, 2004). Aside from those specifically stated a food system guided by the framework of
community food security and supported by CFAs would be able to identify problems earlier, use
knowledge gained from previous CFAs to address the root causes of problems quickly and provide
recommendations based on unique qualities of the community.
2.2 Causes of Food Insecurity
The primary causes of food insecurity are numerous and as complex as the issue of food
security itself. Nord, Andrews and Carlson (2003) state the causes of food insecurity to be “…low
and unstable income, unemployment and unstable employment, disability, family disruption, and
lack of community and extended family support.” Cook states that food insecurity, like poverty, is
directly connected to the state of the economy and notes that “...when the economy is expanding

5
and unemployment is low, the amount of food insecurity declines; when the economy is contracting
and unemployment is rising, food insecurity increases” (Cook, 2002, p. 153). The common theme is
that income or financial stability is directly related to access to healthy food. Generally, as income
increases, the barriers to accessing healthy food such as transportation or pricing tend to diminish in
size. Nord, Andrew and Carlson (2003, pp.2-19) support this by showing that in 1995 the “U.S.
Government set a goal for the Nation—expressed in the Department of Health and Human
Services' Healthy People 2010 objectives—of reducing the prevalence of food insecurity from 12
percent (as measured in 1995) to 6 percent or less by 2010” (Nord et al, 2003, pp.2-19). Initially
“…food insecurity declined by 1.7 percentage points and the prevalence of hunger fell 1.2
percentage points…” (Nord et al., 2003, pp.2-19) however, as the economy entered the recession in
2001 food security and hunger increased, reversing the progress made by the Healthy People 2010
Program.
2.3 Consequences of Food Insecurity
The evidence or effects of food insecurity are prevalent in many aspects of society. A study
by the United States Department of Agriculture (USDA) showed that 11.1 percent of United States
households and 12.2 percent of all individuals, representing more than 36.2 million people, were
food insecure at one or more times in 2007 (Nord, Andrews & Carlson, 2008, p.4). This meant that
there were “…a total of 691,000 children living in ‘very low food security’ households in 2007…”
(Nord et al., 2008, p.14). This shows that not only is food insecurity affecting a significant portion of
the U.S but that it has been increasing in magnitude since 1998 when it was estimated that only
about 2.75% of the U.S. population had inadequate caloric intake ( Kramer-LeBlanc & Carol, 1998,
pp.49-78). In 14 years the percentage of people in the U.S that are food insecure has quadrupled.
The prevalence of nutrition related diseases has also skyrocketed; obesity, diabetes and heart disease
are among the most serious.
Obesity, a rising national concern, is defined as maintaining a Body Mass Index (BMI) higher
than 30 kg/m3. In 1994, sixteen states had an obesity rate of between 15-19%, yet in 2009 those
same sixteen states had obesity rates ranging from 25-32% (CDC, 2009). Currently the Center for
Disease Control and Prevention (CDC) estimates that over one-third of U.S. adults (35.7%) are
obese and approximately 17% (or 12.5 million) of children and adolescents aged 2-19 years are

6
obese. Below is a map provided by the CDC, that shows the prevalence of obesity in the U.S by
county for 2009. When examining the root causes of obesity we found that weight gain can only take
place “…when a person consumes more calories than they burn. For many people this boils down
to eating too much and exercising too little” (Nazario, 2011). Proper diet coupled with an active
lifestyle can greatly reduce the chances of becoming obese. Therefore, if a community had a high
level of food security, residents would be at reduced risk for becoming obese because of availability
and access of healthy foods.
When examining Figure 1 below, a couple trends are easily identifiable. A majority of the
map is represented by the two darkest colors, indicating high levels of obesity. It is also clear that the
state with the least obesity is Colorado and the state with the most obesity is Mississippi. The South,
especially the area surrounding Mississippi, contains a very high percentage of the total dark red area,
which denotes over a 30.8% obesity rate by county population
Figure 1: Prevalence of Obesity in the United States

7
Diabetes has also grown common in the U.S. Today over an estimated 25.8 million children
and adults, or 8.3% of the total population have diabetes (Diabetes Basics, 2011). In 2010 alone 1.9
million cases of diabetes in people 20 years or older were diagnosed (Diabetes Basics, 2011) and it is
extrapolated that by 2030 this number will continue to rise past 30.3 million Americans (Wild,
Roglic, Green, Sicree & King, 2010). In fact, the most shocking statistic regarding diabetes in the
United States is that a whopping 79 million people are estimated to have pre-diabetes, a condition
where some but not all criteria for diagnosing diabetes is met ("Diabetes Basics," 2011). Common
risk factors for diabetes include high-fat diet, obesity, high blood pressure, and a sedimentary
lifestyle (Ferry, 2012). It is clear that diabetes like obesity is largely controlled by diet. If a person
maintained a USDA “food plate” diet they would lower the risk of developing diabetes. In that
respect, a secure community food system would be able to significantly influence the population’s
risk of developing diabetes by providing healthy food choices equally to all people.
Figure 2 represents the spatial distribution of prevalence of diabetes by county. Figure 2’s
layout closely resembles Figure 1, which is reasonable because as obesity greatly increases a person’s
chance of developing diabetes. Therefore, the same trends from Figure 1 are present in Figure 2, but
to a lesser extent. While a majority of Figure 1displayed the two darkest colors, Figure 2 is more
balanced with a relatively equal match between the two darkest and the two lightest colors. This
indicates that obesity affects more people that diabetes.
Figure 2: Prevalence of Diabetes in the United States

8
Heart disease is a severe problem in the United States. It is estimated that over 27.1 million
adults or 11.8% of the population is diagnosed with some form of heart disease (CDC, 2009). Heart
disease is also the leading cause of death in the U.S. The CDC found that “…in 2008, over 616,000
people died of heart disease…” which consisted of almost 25% of the total national deaths. Heart
disease has many similar risk factors as diabetes which includes high cholesterol, high blood
pressure, obesity, diabetes, lack of exercise and a high-fat diet (Singh, Forker, Talavera & Zevitz,
2012). Therefore it is already established that nutrition and diet can impact heart disease if it already
directly controls diabetes and obesity which are heart diseases largest risk factors. It also must follow
that if a community’s food environment could provide adequate amounts of healthy food to the
entire population through socially acceptable means then that community would be at significantly
small risk for heart disease.
Figure 3 compares spatial location and rate of heart disease mortality. In areas with the
highest morality rate (747 out of 100,000), there is 1 death per 134 people from heart disease
annually. Figures 3 as well as Figure 2 correlate heavily to the distribution displayed by Figure 1. This
denotes that obesity, diabetes and heart disease must have commonalities, one of which is diet or
nutrition. The same trends can be seen from Figure 3 as well as Figure 1 however they are to a much
lesser extent. Figure 3, however, displays the majority of the map as the lightest two colors indicating
less severity. This map also represents deaths from heart disease and not reported cases like obesity
and diabetes. Lastly it is notable that for all three maps that Mississippi maintains the highest level of
obesity, diabetes, and deaths from heart disease, which is most likely due to food insecurity.

9
There is a clear connection between food security and the health of a population. A person
consuming an appropriate amount of food relative to their caloric output using the USDA’s “food
plate” as a guide is proportionality at a substantial lower risk for developing any nutrition related
disease such as obesity, diabetes or heart disease. Acknowledging that a community’s food
environment directly impacts the food choices of anyone living within leads to the understanding
that a secure community food system not only positively impacts the way people eat, but save lives.
In order to understand all the mechanisms of a specific food environment and of a secure food
system, a community food assessment must be conducted.
2.4 Approaches to Community Food Assessments (CFAs) Communities wishing to evaluate weaknesses in their food systems are tasked with gathering
information and analyzing it with the goal of improving residents’ access to nutritious food. This is
the purpose of a community food assessment. In essence, the methods employed for conducting a
Figure 3: Heart Disease Mortality Rate in the United States

10
CFA can be classified as one of two broad categories: qualitative or quantitative. Both approaches
are necessary to reach well-informed conclusions about the food environment in a target area.
Quantitative data include things such as Census demographic data and food pricing data. Qualitative
data include interview and survey responses meant to gauge resident attitudes towards food.
A common shortcoming of CFAs is a deficiency of resident interviews for the purpose of
gaining a more nuanced perspective on a community’s food security. Descriptive statistics are used
in most every study with Franco et al. (2008) taking a more rigorous statistical approach. Statistics,
however, provide an incomplete picture of the community food environment. Interviews with
residents are recommended by Cohen (2002) to fill in these gaps in knowledge for the purpose of
conducting a successful CFA.
The goal of a successful CFA is to equip policy makers with the information they need to
enact laws and take actions that will aid in making a community’s food supply healthier and more
accessible while reducing the degree of food injustice experienced by minority and low-income
residents. Each CFA has a unique approach to this problem, but there are elements that are
common across many of them. Porthukuchi (2004) provides a synopsis of several seminal
community food assessments. Table 1 offers an overview of the commonalities between these
studies.
Table 1: Commonalities Between Los Angeles, Berkeley, and Somerville CFAs (Synthesized from
Porthukuchi (2004

11
Table 1 shows that while the LA, Berkeley, and Somerville share similarities in their results
and in establishing community outreach programs, they achieve these means in different way. The
LA and Somerville studies make extensive use of Census data for the purpose of assessing
community food security levels. This is a theme that is also common to several more recent CFAs as
well.
More recent studies such as Lopex-Class and Hosler (2010), Haering and Franco (2010),
and Franco et al. (2008) chose to represent socio-economic variables from the U.S. Census spatially
in the form of maps generated in a geographic information system (GIS). Representing information
visually makes it more intuitive. Haering and Franco (2010) use this method in mapping the
locations of different store types in the city of Baltimore. In addition to simply acting as a visual aid,
GIS acts as a powerful tool for examining socio-economic variables with respect to location.
Furthermore, GIS can be used to perform spatial-statistical analyses ranging from simple percentage
calculations using U.S. Census demographic data to more complicated statistical tests. Using these
analytical methods, previous reports were able to establish clear trends and relationships between
race/ethnicity, income, and food insecurity.
Unequal food retail outlet distribution and social inequalities in the food systems were the
two clearest patterns we found in reviews of the seminal literature. Haering and Franco (2010) in
their CFA of Baltimore looked at resident race and its relationship to neighborhood food availability
and access. In the same study, Hearing and Franco (2010) classified the U.S. Census 2000 tracts
comprising the city of Baltimore as predominantly white (≥ 60% of tract population reported as
white), predominantly black (≥ 60% reported as black), or racially mixed (block groups which did
not fit into the previous two categories). This focus on racial characteristics of the city arose out of
“…racial health disparities typical of many modern US cities” (Haering and Franco, 2010, p. 4).
In a study of Latino neighborhoods in upstate New York, Lopez-Class and Hosler (2010)
strongly emphasized the importance of the rapidly growing Latino demographic. According to
Lopez-Class and Hosler (2010, p. 1), “Many low-income Latino communities experience significant
food insecurity…” This is significant to our study because the United States Census Bureau reported
that 20.9% of Worcester residents claimed Hispanic or Latino origin in the 2010 Census—a
significant portion of the overall population.

12
In addition to ethnicity and race, another factor which significantly affects community food
security is poverty. In an earlier CFA of Baltimore, Franco et al. (2008) took into consideration the
racial characteristics of neighborhoods within the city as well as the income of those neighborhoods.
According to Franco et al. (2008, p. 561), “Prior research has documented the associations of
neighborhood racial and socioeconomic characteristics with neighborhood food availability.”
Household median income data from the 2000 Census was used as an indicator of the
socioeconomic well-being of a neighborhood in this study. Lopez-Class and Hosler (2010, p.1) state
that “Additional contributors to food insecurity stem from the food purchasing pattern for many
low-income families…” These studies acknowledge that food insecurity in a community arises from
a combination factors amongst which racial/ethnic composition and income are the most significant
contributors.
Many CFAs also examine the availability of healthy foods in neighborhood retail outlets—to
do so researchers have devised various systems for numerically evaluating the healthiness of a given
food retail outlet. In their study assessing the Baltimore city food environment, Haering and Franco
(2010) used a system called the Healthy Food Availability Index (HFAI) to assess the quality of the
produce and food in a given store. The HFAI system assigns point values to food offerings based on
the importance of those food items to the USDA’s recommended daily nutritional requirements.
Franco et al. in their 2008 Baltimore CFA also utilize this system as it offers a standard means of
categorizing stores based on the quality of their food offerings. This would otherwise be a very
difficult task given that foods of the same general type can vary widely in quality based on storage (in
the case of fruits and vegetables) or brand (in the case of processed foods).
One of the themes in these CFAs is that there is a discrepancy between the quantity, quality,
and price of foods in different store types. This investigating this pattern, like evaluating food
quality, is a difficult and nuanced task. However, Haering and Franco (2010) and Franco et al. (2008)
use the Standard Industrial Classification (SIC) codes as a basis for their store classifications.
Haering and Franco (2010, p.3) state that, “[The SIC] taxonomy does not, however, adequately
describe features unique to groups of stores that heavily influence the Baltimore City food
environment.”
Haering and Franco (2010), Lopez-Class and Hosler (2010), Franco et al. (2008), and Short,
Guthman, and Raskin (2007) all found that low-income areas containing a majority of racial/ethnic

13
minority residents were more prone to food insecurity. In their San Francisco study Short,
Guthman, and Raskin (2007, p.362) were careful to point out about stores in these areas, “…the fact
that these stores sell food that is relatively affordable compared to other stores does not necessarily
mean that they sell food that is affordable to all low-income residents.” These themes echoed
repeatedly through the CFAs that we examined and suggest that a successful CFA of Worcester
should focus on the connections between income and ethnicity and community food security.
Worcester, Massachusetts is the second largest city in New England and is a well-developed
primary transportation hub connecting central Massachusetts to Boston. It is often referred to as
“the heart of the Commonwealth” due to its large population and location. This has led to a diverse
range of people from different ethnicities, religions and economic backgrounds in a relatively small
area. Worcester maintains notable populations of Asians, South Americans, Spanish, Arabic and
African Americans. Intermixed with Worcester’s 12 undergraduate schools are small businesses,
parks, major highways and both urban and suburban communities. Worcester also boasts an
estimated 1200 food sources within its boundaries that are supported by both small local farms and
large suppliers. Worcester’s diverse population, both urban and suburban communities, and complex
food system make food security an important issue.
According to the Worcester Food and Active Living Policy Council, “7.1 percent of all
households in Massachusetts were food insecure and 2.7 percent reported food insecurity with
hunger. This represented an increase from the 1999-2001 reported numbers, when 6.7 percent of
households statewide were food insecure and 2.0 percent were food insecure with hunger”
(WFALPC, 2006, p. 9). In Worcester, specifically, diet-related diseases suggest food insecurity. The
adult obesity rate surpasses the national average and diabetes prevalence is high with 27% of adults
in the city obese and 9% of the adult population diabetic (Magee, 2012). Worcester residents also
suffer from high rates of other diet-related diseases with 26% of Worcester’s adult’s hypertensive
and 35% reported as having elevated cholesterol. Health problems even more acutely affect the
ethnic minority population of Worcester.
The unavailability or high costs of foods used in traditional diets, changes in lifestyle and
working conditions, and pressures for integration into a new culture result in dietary modifications,
often with negative impacts on health. According to Fitzgerald, “… acculturation and
socioeconomic factors are closely related to nutrition and health outcomes. Greater acculturation

14
among Hispanics (e.g., Mexican Americans) in the United States has been linked to less healthful
food intake patterns … and increases in the prevalence of cigarette smoking, alcohol intake, and
obesity” (Fitzgerald, 2010, p. 12). Worcester Food & Active Living Policy Council (WFALPC), “…
between 2001 and 2005, there was a 40% increase in number of people served by the food pantries
and soup kitchens associated with Worcester County Food Bank” (WFALPC, 2006, p. 9). This
indicates that food insecurity has been increasing throughout the years. This is not the only method
with which Worcester is trying to combat food insecurity. Worcester has been attempting to initiate
numerous policy changes to address this matter, but more information is required by the WFALPC
to achieve its goals.
2.5 Worcester Food & Active Living Policy Council
The mission of the Worcester Advisory Food Policy Council is, “To work with the
Worcester community to reduce hunger and increase food security and the overall health of
residents of Worcester.” (Castro, Landers & Man, 2012, p.11) They currently focus on the issues of
hunger, food security and nutrition center on increasing SNAP enrollment, improving the quality of
nutrition in the Worcester Public Schools and initiatives to support farmers’ market food gardens
and nutrition classes.
Hunger Free and Healthy is a project of the Worcester Food and Active Living Policy
Council. Hunger Free and Healthy was established in 2007, and has developed into a thriving
program, helping residents acquire knowledge of healthy food as well as assistance in receiving
SNAP benefits. Within the Worcester Public Schools, Hunger Free and Healthy has taken leaps in
bounds in improvements when it comes to food. They have improved the schools meals, ensuring
that bread products are 90% wheat, and offering a fruit or vegetable at least four days a week.
Childhood hunger is a main concern of the Hunger Free and Healthy initiative. 2005 census data
states that about 1 in 3 children in the Worcester area lives in a household that at times does not
have enough food. (USDA 2011) 80% of children in the Worcester public school system met
requirements for free or reduced lunch. (Castro, Landers & Man, 2012, p.9)
Hunger Free and Healthy (HFH) has increased the number of school garden programs
within the public school system. This initiative hopes to reconnect teens and young adults back to
their food, and to instill a sense of importance of maintaining a healthy diet.

15
Within the adult community of Worcester, HFH has increased the SNAP participation rate
by means of outreach and assisting in filing of application forms. They also have increased the
number of farmer markets available to low income neighborhoods, and offered free nutrition-based
cooking classes for low-income families (Castro, Landers & Man, 2012, p.17). The farmers’ markets
are a way to bring healthy and nutritious food into the low-income neighborhoods that otherwise
has a difficult time accessing the food they need. In 2011, two new farmers’ markets were
developed, one in Main South and one in Great Brook Valley.
Much of WFALPC’s work has been premised on a hunger-relief model with an emphasis on
food assistance and social welfare programs. It is now interested in looking more broadly at access
to and availability of food at the community level, which focuses on food flows into communities,
the connections between consumption and the local and regional food system, and social inequalities
in the system.

16
3. Methodology The goal of our project was to aid the Worcester Food and Active Living Policy Council in
assessing the food security of low-income residents in specific neighborhoods of Worcester in order
to help policy makers understand how low-income residents are affected and cope with food access
and availability. The project provided food policy-makers with resources such as maps and spatial
analyses of Worcester’s food security, residents’ perceptions of the local food system, and a set of
recommendations for addressing food insecurity.
Our primary objectives are as follows:
a) Analyzing spatial and social dimensions of food security.
b) Devising an appropriate measure of healthy food availability, quality and price.
c) Understanding the perceptions of local residents about the workings of the food
system and steps to improve it.
3.1 Analyzing Spatial Dimensions of Food Security
Our study utilized a geographic information system (GIS) to represent and analyze the
spatial characteristics of food security in Worcester. The issues considered in this analysis were:
location of food sources by type (e.g. supermarkets, corner stores, and fast food), availability of
healthy foods, food prices, available transportation options, as well as socioeconomic variables from
the 2010 census, such as household income, race, and ethnicity. We utilized GIS to depict this
information as point data, choropleth maps, and layers.
Identifying target neighborhoods
With the help of our sponsor we initially identified four neighborhoods for our food
assessment: Grafton Hill, South Main Street, Lincoln Street, and Great Brook Valley. Of these
neighborhoods, Lincoln Street and Great Brook Valley form a continuous geographical area, but will
be treated separately in analysis of socio-economic data due to ethnic differences. To determine if
these neighborhoods were among Worcester’s most disadvantaged, we used Census 2000 median
household income. Our spatial analysis was focused on food access and availability issues in the four
neighborhoods. We define food availability as having sufficient quantities of healthy and culturally
appropriate foods available on a consistent basis. Food access was defined as having sufficient

17
means (money, child care for leaving the house, access to transportation) to obtain appropriate and
nutritious foods based on the location of houses to retail food outlets within a reasonable distance.
Variables that influence food access and availability include income level, distance from food retail
outlets, food pricing at those outlets, and access to healthy and culturally appropriate foods
Estimating Access to Retail Outlets
Access to healthy food was determined by drawing a ½ and one mile buffer around block
group centroids of the four surveyed neighborhoods. The buffer radii represent walkable distances
for food shopping. Following Ver Ploeg (2009, p.19) walkability is characterized as: high (distance
less than 0.5 miles), medium (distance from 0.5-1 mile), or low (distance greater than 1 mile—we
used a radius of 0.5 miles.
The locations of supermarkets in the city, widely seen as the most reliable sources of healthy
food, were plotted in GIS. This spatial relationship was used to judge food access. Buffers were
established around each supermarket in the city corresponding to the walkability evaluation
discussed by Ver Ploeg (2009). The supermarkets considered were not restricted solely to the
neighborhood block groups, but also included one supermarket outside of the city for the purposes
of comparing it to other supermarkets within the city.
3.2 Measuring of Food Availability, Quality and Price
In order to gain an understanding of how food quality, availability and pricing influence
Worcester’s local food security, we examined the following questions.
1) How do we classify food outlets in Worcester?
2) How can we devise an index that would enable us to assess healthy food availability in
retail outlets and what would a Healthy Food Availability Index (HFAI) of Worcester
look like?
3) How should general food availability and pricing be collected?
Classifying Food Sources
In order to classify different food retail outlets, we chose to use the Department of Labor’s
Occupational Safety and Health Administration’s two digit Standard Industrial Classification (SIC)

18
system (SIC Division Structure). This system offers concrete classifications for food outlets and
explanations as to their classifications. Below are the SIC codes we used in this study:
• 5399- Miscellaneous Retail: Establishments primarily engaged in the retail sale of a general
line of apparel, dry goods, hardware, house wares or home furnishings, groceries, and other
lines in limited amounts. Stores selling commodities covered in the definition for department
stores, but normally having less than 50 employees, and stores usually known as country
general stores are included in this industry. Establishments primarily engaged in the retail
sale of merchandise by television, catalog and mail-order are classified in Industry 5961.
• 5411- Supermarkets: Defined as stores, commonly known as supermarkets, food stores, and
grocery stores, primarily engaged in the retail of all sorts of canned foods and dry goods,
such as tea, coffee, spices, sugar and flour, fresh fruits and vegetables; and fresh prepared
meats, fish and poultry.
• 5499- Ethnic Food Stores and Non-Ethnic Corner Stores: Establishments primarily engaged
in the retail sale of specialized foods, not elsewhere classified, such as eggs, poultry, health
foods, spices, herbs, coffee and tea. The poultry stores may sell live poultry, slaughter and
clean poultry of their own account, and sell dressed fowls, or sell fowls cleaned and dressed
by others
• 5541- Gas/Convenience Service Stations: Gasoline service stations primarily engaged in
selling gasoline and lubricating oils. These establishments frequently sell other merchandise
such as tires, batteries, other automobile parts and perform minor repair work. Gasoline
stations combined with other activities, such as grocery stores, convenience stores, or
carwashes, are classified according to the primary activity.
• 5812- Restaurants/Fast Food Places: Establishments primarily engaged in the retail of
prepared food and drinks for on-premise or immediate consumption, to include fast food
restaurants. Caterers and industrial food service establishments are also included in this
industry.
This system of classifying sources along with the addresses of all places in Worcester that have
food permits, allowed us to locate and classify any source. The addresses of all food sources in
Worcester were provided by the Department of Health and Human Services for a small fee.

19
According to this data there were over 1250 food sources in Worcester that were registered with the
local government. After filtering the data by eliminating seasonal sources, fraternities, food suppliers
such as Sysco and other extraneous food outlets, we isolated the outlets that fell within our selected
boundaries. Over 120 food outlets remained within Main South, Grafton Hill, Lincoln Street and
Great Brook Valley. The addresses of the remaining food outlets were converted to latitude and
longitude via Google Maps and imputed into Microsoft Excel for GIS interpretation. Of the food
outlets mapped, every location was verified and approximately 47 outlets were surveyed for healthy
food availability index and pricing. Every food outlet that wasn’t a restaurant with in our sponsor’s
areas of interest was surveyed.
Establishing a Healthy Food Index
This project chose to measure the availability of healthy food with the Nutritional
Environment Measurement Survey’s (NEMS) Healthy Food Availability Index (HFAI) (Glanz,
Clawson & Carvalho, 2006). This index uses certain standards of healthy food and a point system to
establish a clear-cut, numerical evaluation of each food source’s availability of healthy food. NEMS
provided a very detailed HFAI that included many foods not common to Worcester or were
seasonal. Our study created a HFAI uniquely tailored to Worcester to provide a better measure and
receive more accurate results. Our HFAI was modified to prefer foods common to Worcester and
favor healthy foods based on the composition of a healthy diet as recommended by the USDA’s
healthy food plate. As an example healthy grains carried more numerical weight than healthy dairy
options because they should be a larger percentage of a healthy diet as recommended by the USDA
than dairy. Located on the next page is an example of a store evaluation.

20
Food Group Healthy Score Availability Score
Dairy:
A) Milk
B) Cheese
C) Yogurt
A) 1% or Skim Milk=1pt
B) Organic/Low Fat=1pt
C) Organic Brand=1pt
A) >25% =1pt, >50%=2pts
B) >2 Brands=1pt
C) >2 Brands=1pt
Fresh Fruits:
A) All Fruits
A) Seasonal or Organic Fruit
=1pt
A) >20 types=1pts,
>40 types=2pts,
>50 types=3pts
Fresh Vegetables:
A) All Vegetables
A) Seasonal or Organic
Vegetables=1pt
A) >20 types=1pts,
>40 types=2pts,
>50 types=3pts
Meats:
A) Chicken
B) Ground Beef
A) Skinless Breast=1pt
B) 90% Lean Beef=2pts
A) >20%=1pt, >35%=2pts
B) >20%=1pt, >35%=2pts
Grains:
A) Bread
B) Pasta
C) Rice
D) Cereal
A) Whole Grain Bread=2pts
B) Whole Grain Pasta=2pts
C) Brown Rice=2pts
D) Whole Grain Cereal=2pts
A) >2 Brands=2pts
B) >3Brands=2pts
C) >2Brands=2pts
D) >4 Brands=2pts
Beverages:
A) Soda
B) Juice
A) Diet Soda=1pt
B) 100% Fruit Juice=1pt
A) Eye/Chest Level=1pt
B) Eye/Chest Level=1pt
Healthy Alternative:
A) Bacon
B) Potato Chips
A) Turkey Bacon=2pt
B) Baked Potato Chips=2pts
A) >2 Brands=1pt
B) Eye/Chest Level=1pt
Source Name: Store “X”
Source SIC: ex.9999
Total Score:48 (MAX)
Healthy Score: 22 (MAX)
Availability Score: 26 (MAX)

21
Collecting Food Availability and Pricing Data
Collecting food availability and pricing data was done with a simple checklist. This checklist
contained a line for each food specified above with a “yes” box indicating the food can be
purchased from that source, a “no” box indicating that the food could not be purchased from that
source and a “price” line that has the price per unit of measurement specified in the chart above.
This checklist method allow for multiple types of data to be collected at the same time, is easy to
understand and repeat. Appendix F contains the checklist used to collect pricing data at each source.
We will supplement our numerical data with qualitative interview data from resident interviews.
3.3 Conducting Interviews to Understand Perceptions
Understanding the social aspects of food justice and food security is vital to our project so
that we may be able to see how residents think about options and make decisions concerning where
they shop, what they buy and how they cook. We also can see in what ways their perceptions,
decisions, actions, and routines are shaped in response to resources and neighborhood contexts.
We focused on low-income residents of the Worcester area. According to Nord (Nord,
2005) and Cohen (Cohen, 2010) residents of low-income neighborhoods are likely to be more
vulnerable to food insecurity. Our sponsor, the Worcester Food Policy and Active Living Council,
identified low income and ethnic minority interviewees. We conducted 10 semi-structured interviews
in both English and Spanish (see Appendix A for a list of our questions). We asked the interviewees
to discuss how they navigate the local food system and to tell us how they make decisions about
where they shop, what they buy, and if they have access to culturally appropriate foods. “The
purpose of such interviews is not to identify what is ‘the truth’ but to help the researcher understand
the experiences and lives of the participants and the conclusions the participants themselves have
drawn from them.”(Doyle, 2006, p.239) The biggest advantage of qualitative interviews is the ability
to get to know the people our project is about, and the rich information we can acquire through
their personal experiences.
The specific issues we targeted were: understanding obstacles to obtaining desired ethnic
foods, the social and psychological distance to acceptable sources of food; the amount of available
healthy foods; and how residents address these issues. Secondary issues that we considered are:
residents’ safety concerns, the efficacy of government assistance programs, and access to food banks

22
and soup kitchens. Following suggestions from sources such as the Community Food Assessment
Toolkit we developed the following interview questions and data collection form (Cohen 2002 pp.
15-19, 56).

23
4. Findings 4.1 Spatial analyses of food access, availability, quality and price
Our project examined the spatial relationships between food retail outlets1 and ethnicity and
income at the block group level in selected Worcester neighborhoods—Grafton Hill, Great Brook
Valley, Lincoln St., and Main South. Here, we use the term food retail outlets as stores which
specialize in selling food ingredients (restaurants are excluded from this definition). The findings
below reveal both the spatial variation in the availability of healthy food in Worcester as well as the
accessibility to retail outlets
FINDING 1: Compared to corner stores, bodegas, and convenience stores, Worcester supermarkets offer a greater variety of healthy foods
Our HFAI data was obtained for 43 of the 145 food stores in Worcester. Using our data we
calculated average HFAIs for each of the store types and imputed those values for stores that we did
1 Gas and convenience stores and stores from the miscellaneous food retail store category were not
crucial food sources in our study. We created ethnic composition maps as well as median household
income maps with respect to store locations for these categories as well. Those maps can be found
in Appendix E.
Table 2: Average Food Retail Outlet HFAI Scores by SIC Code

24
not survey. HFAI scores were broken into three equal intervals and block groups were classified
according to average HFAI value of the stores contained within. Our results suggest that the
majority of block groups in Worcester have a low HFAI score. We also investigated the relationship
between fast food restaurant locations and ethnicity and income of block groups.
Using SIC code classifications, we categorized all licensed food retail outlets in the city of
Worcester. Since not every food retail outlet in the city could be surveyed given time and resource
constraints, HFAI scores for non-surveyed food retail outlets were imputed. To do this, average
HFAI scores for each classification were found within our sample and these values were then
applied to stores that were not surveyed. Table 2 contains the previously mentioned average scores.
As Table 2 shows supermarkets in Worcester have an average HFAI score of 36, compared
to 8.8 for an ethnic or corner store. Other store types scored roughly the same with gas and
convenience stores scoring lower than all other types. Stores that were part of the same chain tended
to score similarly regardless of their location.

25
FINDING 2: Neighborhoods that are predominantly white (>60%) are more likely to have
access to food retail outlets that sell high quality and nutritious food.
Figure 4: Block Group Ethnic Composition and Supermarket Locations in Worcester

26
% Supermarkets
Total 17
Block Group Ethnic
Composition*
White 94.12%Hispanic 0%Mixed 5.88%
Type of Food Store
*Ethnic composition of block groups determined as white if ≥60% of the
residents were white, Hispanic if ≥60% of residents where Hispanic. All
remaining neighborhoods classified as mixed.
Table 3: Distribution of Supermarkets in Worcester with Respect to Block Group Ethnic Composition
Following Haering and Franco (2010) we defined predominantly Hispanic block groups as
those where ≥ 60% of the population is Hispanic, predominantly non-Hispanic white block groups
are those where ≥ 60% of the population is white, and ethnically mixed block groups as those which
do not fit into the other two categories. We found that supermarkets in the city of Worcester were
far more likely to earn a high HFAI score than any other type of store. Figure 4 shows the
distribution of supermarkets with respect to ethnic composition of block groups. It is clear that
most Worcester supermarkets lie within block groups that are predominantly white. Out of the 17
supermarkets in the city, 5 lie within the neighborhoods that we surveyed. Only one supermarket lies
in a mixed block group and no supermarkets lie within Hispanic block groups. This is significant
because it tells us that supermarkets, which have large selections of healthy foods, are most
frequently located in white block groups as opposed to Hispanic or mixed ethnicity block groups.
As Table 3 indicates, 94.12% of all supermarkets in the city are located in block groups that
are predominantly non-Hispanic white2. Ethnically mixed block groups contain 5.88% of the total
number of supermarkets in the city. Hispanic block groups do not contain any supermarkets, nor do
they contain any stores which are classified as having a high HFAI.
2 Census data classifies white and white Hispanic groups separately.

27
FINDING 3: Hispanic and ethnically mixed neighborhoods have access to some 50 ethnic
groceries and corner stores, with much of this variety centered in Main South.
Figure 5: Block Group Composition and Ethnic Grocery Locations in Surveyed Neighborhoods

28
% Ethnic Groceries and Non-Ethnic Corner
StoresTotal 49
Block Group Ethnic
Composition* White 46.94%Hispanic 10.2%Mixed 42.86%
*Ethnic composition of block groups determined as white if ≥60% of the
residents were white, Hispanic if ≥60% of residents where Hispanic. All
remaining neighborhoods classified as mixed.
Type of Food Store
Table 4: Distribution of Ethnic Groceries and Non-Ethnic Corner Stores in Worcester with Respect to Block Group Ethnic Composition
Ethnic groceries are a source of culturally appropriate foods for many of Worcester’s ethnic
minority residents, offering items that would otherwise be unavailable. We plotted locations for
ethnic groceries only within the four neighborhoods surveyed by our study. This decision was made
to ensure that all food retail outlets classified as ethnic groceries were properly categorized. For the
entirety of Worcester, corner stores and ethnic groceries were combined into a single classification.
Figure 5 shows that the Main South neighborhood contains the largest number and variety
of ethnic groceries out of the four neighborhoods surveyed. Grafton Hill contains a single ethnic
grocery despite its relatively large size. The Lincoln Street neighborhood contains two ethnic
groceries, as does Great Brook Valley. Figure 5 also shows that block groups within the
neighborhoods that we surveyed that were either Hispanic or of mixed ethnicity were much more
likely to contain an ethnic grocery. For example in the Main South neighborhood, the most
ethnically diverse of the neighborhoods that we surveyed, there is an equally diverse selection of
ethnic groceries.

29
FINDING 4: Supermarkets in Worcester are more likely to be located in high and low
income neighborhoods, suggesting a higher degree of food availability in those areas
Figure 6: Block Group Household Median Income and Supermarket Locations in Worcester
30
% Supermarkets
Total 17Block Group Income* *
Low 35.29%Medium 17.65%High 47.06%
Type of Food Store
**Block group income was broken up into tertiles. Those is the lowest third
were classified as low, those in the middle third as medium, and those in
the highest third as high.
Table 5: Supermarket Distribution with Respect to Block Group Median Household Income
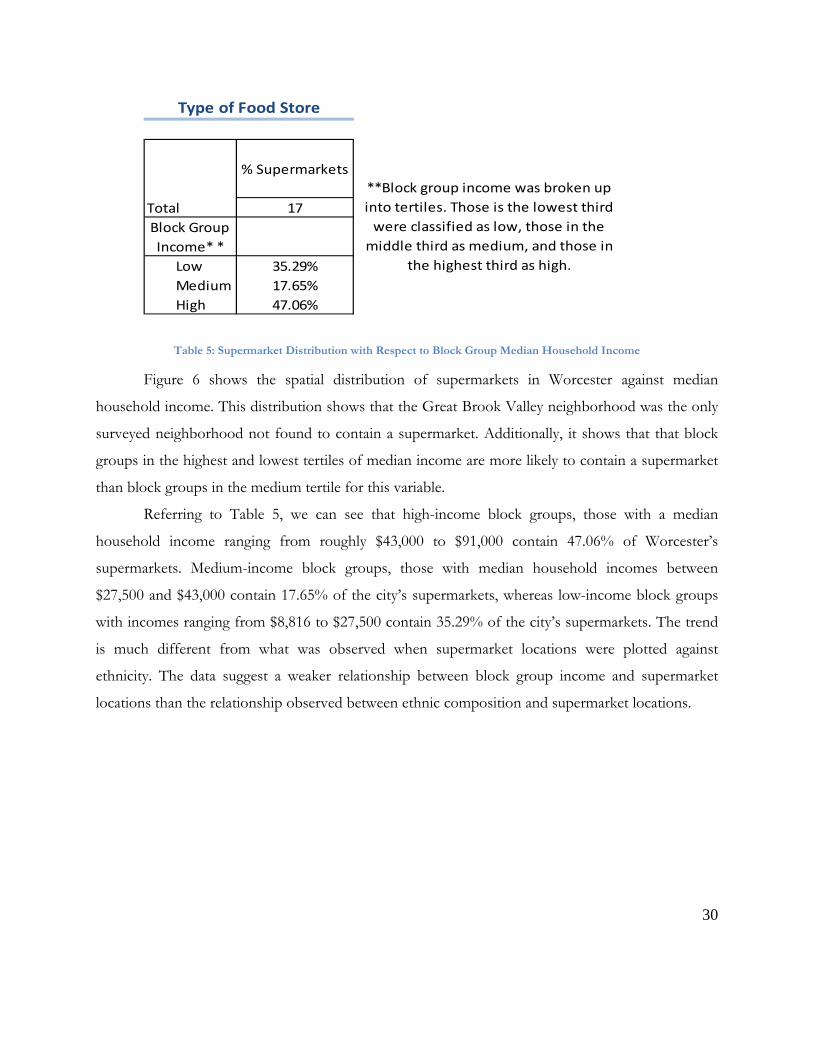
Figure 6 shows the spatial distribution of supermarkets in Worcester against median
household income. This distribution shows that the Great Brook Valley neighborhood was the only
surveyed neighborhood not found to contain a supermarket. Additionally, it shows that that block
groups in the highest and lowest tertiles of median income are more likely to contain a supermarket
than block groups in the medium tertile for this variable.
Referring to Table 5, we can see that high-income block groups, those with a median
household income ranging from roughly $43,000 to $91,000 contain 47.06% of Worcester’s
supermarkets. Medium-income block groups, those with median household incomes between
$27,500 and $43,000 contain 17.65% of the city’s supermarkets, whereas low-income block groups
with incomes ranging from $8,816 to $27,500 contain 35.29% of the city’s supermarkets. The trend
is much different from what was observed when supermarket locations were plotted against
ethnicity. The data suggest a weaker relationship between block group income and supermarket
locations than the relationship observed between ethnic composition and supermarket locations.
31
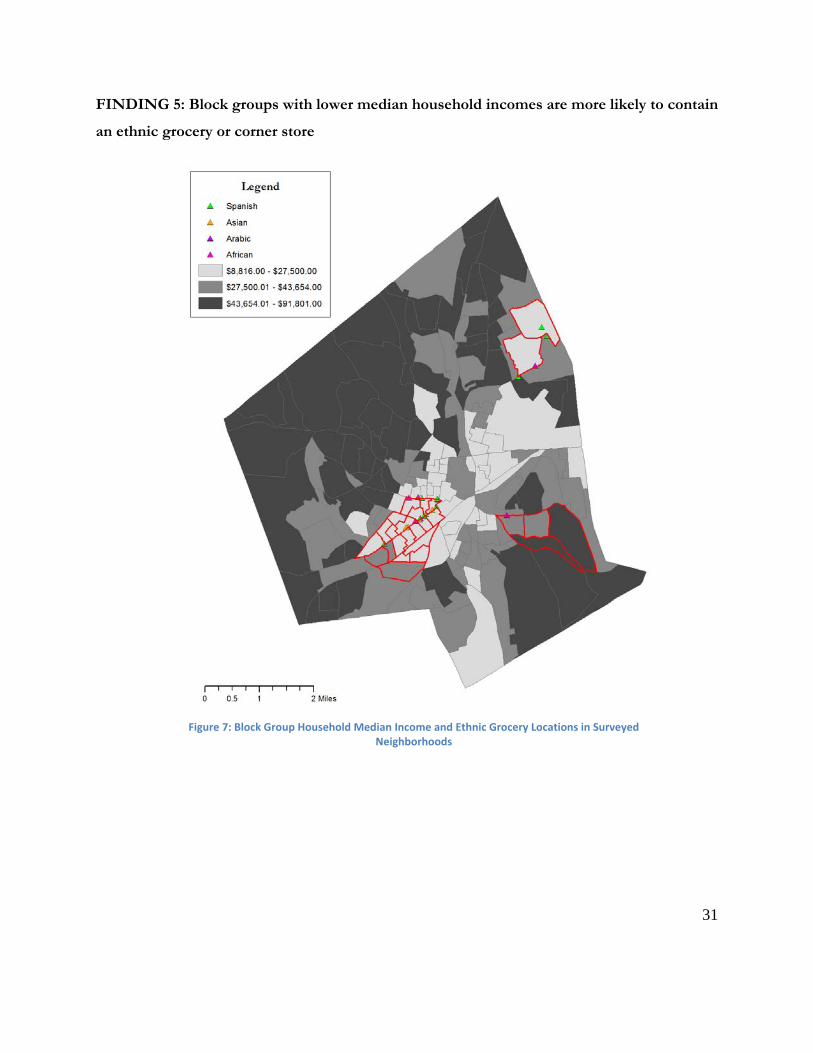
FINDING 5: Block groups with lower median household incomes are more likely to contain
an ethnic grocery or corner store
Figure 7: Block Group Household Median Income and Ethnic Grocery Locations in Surveyed Neighborhoods

32
% Ethnic Groceries and Non-Ethnic Corner
StoresTotal 49Block Group Income* *
Low 59.18%Medium 20.41%High 20.41%
**Block group income was broken up into tertiles. Those is the lowest third
were classified as low, those in the middle third as medium, and those in
the highest third as high.
Type of Food Store
Table 6: Ethnic Grocery Distribution with Respect to Block Group Median Household Income
In Figure 7 we plotted ethnic grocery locations in the four neighborhoods we surveyed, in
relation to household median income.
Figure 7 shows that that within the neighborhoods that we surveyed, only one ethnic grocery
in Grafton Hill is not located in a block group belonging to the lowest tertile of median household
income. In every other instance, these stores are located in low-income block groups.
Table 6 depicts the distribution of ethnic groceries and non-ethnic corner stores in the city.
Low-income block groups, on the other hand, contain 59.18% of the total number of these stores.
This establishes a clear connection between the income level of a block group and the likelihood of
that block group to contain an ethnic grocery or non-ethnic corner store.

33
FINDING 6: White block groups are more likely to contain food retail outlets with a high
HFAI score
% low%
medium% high
Total 126 4 15Block Group
Ethnic Composition
White 65.33% 50% 93.33%Hispanic 7.69% 25% 0%Mixed 26.98% 25% 6.67%
Healthy Food Availability Index
Table 7: Food Retail Outlet HFAI Distribution with Respect to Block Group Ethnic Composition
We categorized food retail outlets as having either a high HFAI score, a medium HFAI
score, or a low HFAI score by breaking the range of scores into three equal intervals. Table 7 shows
the results. Of the 15 high HFAI outlets, we found that 93.33% are located in predominantly white
block groups. Predominantly Hispanic and ethnically mixed block groups contain 0% and 6.67% of
these outlets, respectively. Few outlets fell into the medium HFAI score category, while 126 fell into
the low score category. Of the 126 outlets which earned low HFAI scores, we found that 65.33% are
located in white block groups, 7.69% are located in Hispanic block groups, and 26.98% are located
in ethnically mixed block groups.
From this we can see that this is a disparity between the number of high HFAI outlets
located in white block groups compared to the number of low HFAI outlets found in these block
groups. This difference suggests that white block groups host a disproportionately large number of
high HFAI outlets whereas Hispanic block groups contain no outlets of this type and ethnically
mixed block groups contain a much higher percentage of low scoring outlets compared to their
share of high scoring outlets.

34
FINDING 7: Block groups with high median household incomes are more likely to contain
food retail outlets with high HFAI scores and less likely to contain ones with low HFAI
scores
Worcester % low%
medium% high
Total 145 126 4 15Block Group
IncomeLow 73 51.11% 100% 20%Medium 40 28.57% 0% 26.67%High 32 19.84% 0% 53.33%
Healthy Food Availability Index
Table 8: Food Retail Outlet HFAI Distribution with Respect to Block Group Median Household Income
We classified block groups in Worcester according median household income tertile and
examined the distribution of food retail outlet HFAI scores as shown in Table 8. We found that
53.33% of the outlets classified as having a high HFAI are located in high income block groups
while 19.84% of the outlets classified as having a low HFAI score are located in these block groups.
We found that low income block groups contain 51.11% of the low HFAI outlets in the city while
they contain only 20% of the high HFAI outlets.
The trend shown in Table 8 suggests that block group income affects the HFAI scores of
food retail outlets within a given block group with a disproportionately high percentage of high
HFAI score outlets being located in high income block groups and a disproportionately high
percentage of low HFAI score outlets being located in low income block groups meaning people
living in low income block groups have a lower degree of access to healthy foods.

35
FINDING 8: Most fast food restaurants in Worcester are located along major transportation
routes and in neighborhoods that are predominantly white
.
Figure 8: Block Group Ethnic Composition and Fast Food Restaurant Locations in Worcester

36
Table 9: Fast Food Restaurant Distribution with Respect to Block Group Ethnic Composition
Figure 8 shows the distribution of fast food restaurants in the city with respect to ethnicity at
the census block group level. The majority of fast food restaurants are located in predominantly
white block groups with a total of two located in Hispanic block groups. Table 9 shows that of the
133 fast food restaurants in the city 87.21% of them are located in white block groups. Ethnically
mixed block groups contain only 12.03% while only one fast food restaurant is located in a
predominantly Hispanic block group.
Figure 8 shows clustering of fast food restaurants occurs around major thoroughfares such
as I-290. This distribution suggests that Hispanic and mixed block groups are not inherently more
vulnerable to fast food consumption patterns based on restaurant location alone.
% Fast Food
Total 133Block Group
Ethnic Composition*
White 87.21%Hispanic 0.76%Mixed 12.03%
Type of Food Store
*Ethnic composition of block groups determined as white if ≥60% of the
residents were white, Hispanic if ≥60% of residents where Hispanic. All
remaining neighborhoods classified as mixed.
37
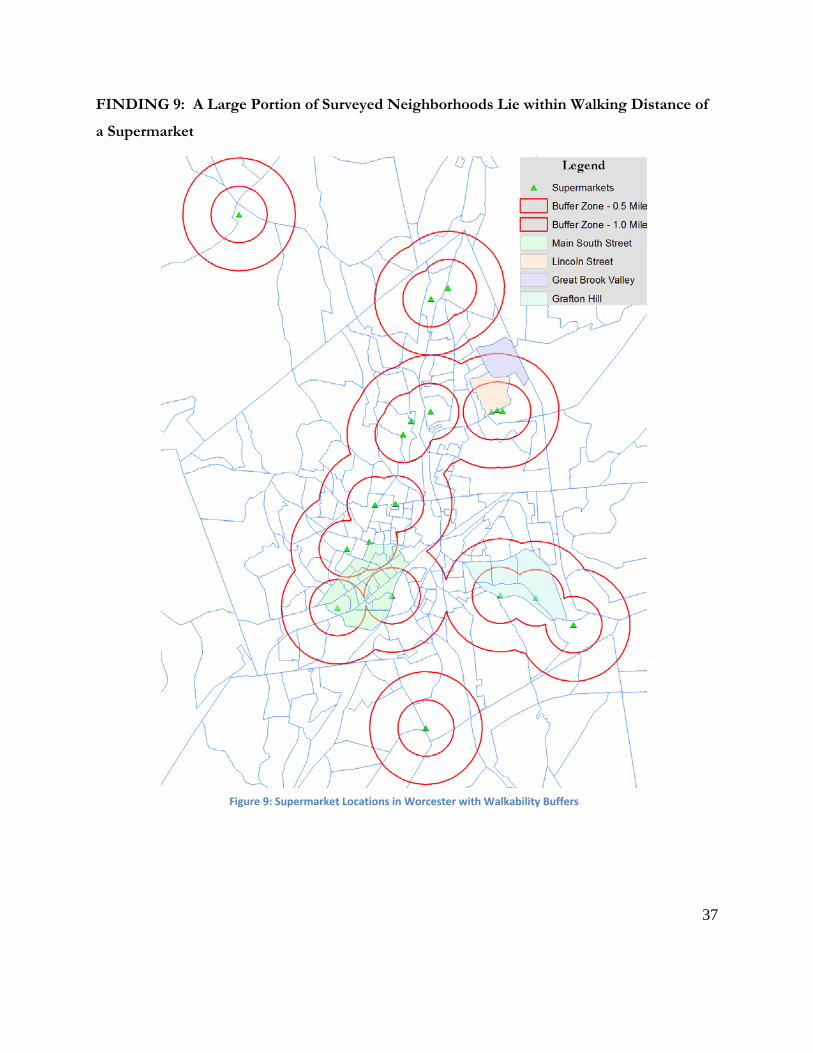
FINDING 9: A Large Portion of Surveyed Neighborhoods Lie within Walking Distance of
a Supermarket
Figure 9: Supermarket Locations in Worcester with Walkability Buffers

38
An important factor in assessing food access in a city is whether or not residents are located
within walking distance of food retail outlets offering a wide selection of healthy foods of a
reasonable quality. Previous studies, as mentioned in our methods section, have employed a
definition of walkability to help analyze this situation. Given how cumbersome it can be to carry
shopping on foot, residents are generally unwilling to walk more than 1 mile each way to shop for
food and prefer to walk less than 0.5 miles. For our purposes, high walkability means that residents
live less than 0.5 miles from a supermarket, medium walkability is 0.5 mile and 1 mile from a
supermarket and low walkability refers to supermarkets greater than 1 mile away.
Figure 9 shows that three of the four surveyed neighborhoods lie in areas of either medium
or high walkability in regard to supermarkets. The one exception, Great Brook Valley, lies mostly
within a medium walkability range. Figure 9 suggests that the surveyed neighborhoods have good
access to supermarkets, the food retail outlets with the highest HFAI scores. However, other factors
must be considered in examining access to healthy foods. For example, elderly residents and
residents with physical disabilities are not accounted for by a simple study of walkability. A high
walkability implies only that residents have an additional transportation method available.

39
FINDING 10: Supermarkets offer lower overall average prices than corner stores
CategoriesBeef per lb.Breast per lb.Bread per loaf White RicePastaCerealCornPotatoes BroccoliCarrotsApplesBananasOrangesGrapesEggsMilkCheeseYogurt
$3.53 $3.31$4.52 $3.62$1.59 $1.61
$1.62 $1.02$3.29 $2.57$2.05 $2.13
$1.72 $1.06$1.80 $1.44$1.12 $0.73
$3.29 $2.99$2.60 $1.03$1.59 $1.71
$1.80 $0.86$1.61 $1.35$4.18 $2.00
$3.99 $3.87$3.14 $3.26$2.89 $2.15
Avg. Market Basket PricesCost
Corner Stores Supermarkets
Table 10: Average Market Basket Prices of Corner Stores in Comparison to Supermarkets
Using the pricing data collected from the supermarkets and corner stores that we surveyed,
we calculated average prices for common foods and compared these averages between the corner
stores and supermarkets as shown in Table 10. We found that neither type of food retail outlet sold
food at lower prices overall. Corner stores prices were found to be slightly lower for a number of
foods; for example the average price for a pound of chicken breast in the corner stores surveyed was
$3.14 compared to an average price of $3.26 at the supermarkets we surveyed. However, the average
supermarket price, when it was lower, was found to be significantly lower. An example of this
pattern is the difference seen with potatoes. Potatoes cost an average of $2.60 per pound in the
corner stores we surveyed. The supermarket price was less than half this at $1.03 per pound. White

40
rice was also significantly less expensive in supermarkets than in corner stores with supermarkets
charging an average of $0.86 per pound and corner stores charging an average of $1.80 per pound.
Overall, prices in surveyed supermarkets were lower than those in surveyed corner stores for
the food items that comprise our market basket. Food prices are prices are an important
consideration because they affect the ability of a family to adequately feed itself. The average price
results from our market basket suggest that supermarkets provide a better overall shopping
environment than corner stores for city residents given the variety of foods available and the
generally lower prices of these foods.
FINDINGS SUMMARY & CONCLUSIONS
Table 11 summarizes the distribution of food retail outlets in the city as well as the HFAI
scores for those outlets. We can conclude from Table 11 that predominantly white block groups
contain the vast majority of high HFAI stores with 93.33% of the total. However, white block
groups contain only 65.33% of the total number of low HFAI stores in the city. This disparity can
be mostly attributed to the fact that white block groups contain 94.12% of the supermarkets in the
Table 11: Summary Table of Worcester

41
city and supermarket form the bulk of high HFAI food retail outlets with, looking at Table 11, an
average HFAI score of 36.
Hispanic block groups contain 0% of the high HFAI outlets in the city, 25% of the medium
HFAI outlets and 7.69% of the low HFAI outlets. This suggests that Hispanic block groups have
lower immediate access to healthy foods. This in turn makes it more likely that residents living in
Hispanic block groups will be forced to cope with overcoming more barriers to obtaining healthy
food when compared to residents living in predominantly white block groups.
Ethnically mixed block groups contain 26.98% of low HFAI outlets, 25% of medium HFAI
outlets, and 6.67% of all high HFAI outlets. This implies that, like ethnically Hispanic block groups,
ethnically mixed block groups experience a lower degree of immediate food access when compared
to white block groups. A similar trend emerged where low income block groups tend to experience a
lower degree of immediate food access compared to other block groups.
It must be added that the presence of high HFAI stores in a block group or neighborhood
does not guarantee food security. To guarantee food security, residents must not only be proximate
to food retail outlets, but must have the time and flexibility to shop for necessary healthy foods. For
example, residents living in areas without a nearby supermarket may not have the option of walking
to purchase groceries, but they may have a higher income and, as a result, more flexibility to find
child care, drive to other outlets inside of and outside of the city, etc.
4.2 Household Strategies to Address Food Security
Our interviews complement our quantitative analysis on food access and availability. The
interviews focused on the factors residents take into account when they shop for food—price,
proximity, quality, time. Throughout our interviews, we were able to connect with low income and
minority Worcester residents in order to understand the workings of the food system from their
perspectives. In broad terms we discussed challenges to buying desired ethnic foods, how notions of
safety and the built environment influenced their choices as to where to shop, their use of buses and
private transportation to increase access to more attractive shops, and issues related to cost versus
food quality. We also discussed the efficacy of the Supplemental Nutrition Assistance Program
(SNAP).

42
We conducted 3 semi-structured group interviews, one in the Worcester Advisory Food
Policy Council office, one in Plumley Village health care center, and one in Great Brook Valley’s
Boy’s and Girl’s club. The interviews were recorded for strictly note-taking purposes and will never
be used for republication. The group sizes ranged from 2-5. Our interviewees were representative of
a very large immigrant population. The ethnicities included Hispanic, Vietnamese, Sudanese, and
Caribbean. We were connected with our interviewees through the Worcester Advisory Food Policy
Council, as well as through connections from our sponsor Liz Castro. All interviewees were able to
speak English; however one interview was conducted in part in Spanish. After introductions and a
discussion about the project, the interviews began with a short questionnaire (see Appendix B:
Questionnaire), followed by a series of questions. Since these were semi-structured interviews
participants were encouraged, through our probing, to expand on their answers
Our findings are grouped into three categories, the individual, social, and physical
environments in order to explore different factors that affect food security. Individual-level factors
are related to food choices and eating behaviors, including attitudes and preferences; the social
environment includes interactions with family, friends, peers, and others in the community which
can impact food choices through mechanisms such as role modeling and social support; the physical
environment includes the multiple settings where people eat or buy food. The physical settings
within the community influence what foods are available and accessible.
INDIVIDUAL LEVEL FACTORS
FINDING 1: Most of the Interviewees Actively Sought to Find the Best Prices among Stores
and Used Private Transportation to Obtain the Best Price
Most of the interviewees were aware of pricing differences among stores and used private
transportation to obtain the best price. Almost all of the interviewees had a car of their own. Those
who did not would typically shop with a family or friend, and they would drive to the stores with the
best sales. The interviewees looked at store flyers to see where the best sales were located and if it
was worth the travel. The women shopped at convenient times, which was different per household.
Convenient times included weekdays since weekends are often too busy, or, after work for those
who are employed. The women would also shop when their spouse was home from work and could
watch the kids. If they had no one to watch the kids, they would either shop during the school day,

43
or simply take their children with them. On average our interviewees traveled to the grocery store
two or three times a month, and spent on average $500.00.
FINDING 2: Use of SNAP/EBT Has Improved, However Many Families Do Not Like to
Talk About its Use
Some families were eligible for the SNAP program, which gives them assistance in buying
food items like milk, eggs, bread, and other similar goods, for their family. The SNAP program
distributes different amounts of government funds depending on the assessed level of need. The
level of need is determined by a case-by-case basis. The interviewees like that they no longer need to
use coupons at the check-out till but can use a plastic card, indistinguishable from a credit card. The
women enjoyed using their SNAP benefits at the seasonal Farmer’s Markets. However, the women
would like to see a year-round farmers’ market, or a similar option allowing them healthier options
year round in place of the farmers’ markets.
FINDING 3: Interviewees Try to Avoid Shopping at Convenience Stores Due to High
Pricing
Most interviewees will not shop at convenience stores if they can help it. They are not
willing to spend more money for the sake of convenience, unless they’re pressed for time. One
woman stated, “If I need milk I’ll stop. I would never say I shop there, only ‘pick up’ things. Quick.”
A general consensus of interviewees is that convenience stores are actually a great place to buy milk
because they noted, “it is usually cheaper than the grocery stores.”
FINDING 4: Residents Are Able to Find Ethnic Foods but Are Unwilling to Pay High
Prices for Them
Many of the interviewees could buy ethnic foods, such as platanos, rice, and beans at their
local bodega, or Spanish corner store, however the price, in their view, tends to be very expensive.
While they look for cultural foods everywhere they shop, they usually can only find it at high end
supermarkets such as Shaw’s or Big Y, or at the area’s Spanish store, Compare Foods. Most of the
interviewee can find Hispanic foods at Compare foods or smaller groceries, but would like to see
such food sold a reasonable price at larger grocery stores. The interviewees spent time and extra

44
money looking for ethnic foods, allowing them to pass the culture of their food and meals within
their family as much as possible. All of the interviewees knew where to go if they wanted ethnic
food. No one complained that they could not buy ethnic food. However, they all would like to see it
more frequently and offered at better prices.
THE SOCIAL ENVIRONMENT
FINDING 5: All of the Interviewees Cook at Home Rather Than Go Out to Eat
Every parent interviewed was very proud that they still cook at home every night, even
though they would like to see more cultural foods in local stores. All of the interviewees who we
talked to about this subject were women, and all would be considered to be the head of the
household. Many of these women did not work, and were living on unemployment and SNAP
benefits. The others who worked full time would cook dinner when they got home from work. One
of the interviewees ran a daycare. She cooked for the small children every day, and made sure to
bake the snacks or use fresh veggies rather than fried or processed foods. This woman was born in
America. Other women who immigrated tried to visit their ethnic stores as much as possible;
however simply Americanizing their meals to frozen foods or deli sandwiches was clearly easier.
They would cook traditional dished from their countries of origin from time to time. For example
rice, beans and plantains for the family from the Caribbean, or for the family from Vietnam, ‘Pho’ a
traditional Vietnamese soup. Differences in food vary greatly from the interviewees’ countries of
origin to here in the United States. Some of the differences include the level of freshness and aroma.
THE PHYSICAL ENVIRONMENT
FINDING 7: Interviewees Do Not Enjoy, nor Go to Fast Food Restaurants
Interviewees did not like fast food. There was only one mother who claimed she let her child
eat at fast food restaurants. They stated how they did not like how they didn’t have control of what
was in the fast food. Another reason was that they simply couldn’t afford it. The women explained
how in the past, after a meal at a fast food restaurant her kids were hungry shortly after.
Furthermore she felt that the poor quality of fast food was unhealthy and only provided short term
hunger relief, in comparison to a home cooked meal. The women continued to explain how her

45
family never goes out to a sit-down restaurant unless it is a special occasion due to extremely high
prices.
FINDING 8: Public Transportation, such as Buses, is Adequate; however More Frequent
Service to Supermarkets Would Make Healthy Food More Accessible
Ease of access to grocery stores is an important factor for our interviewees. Being able to get
to a store influences the choice of where to shop. In our interviews we found that residents who
take public buses to the grocery stores are generally very happy with the routes available and the
close proximity of bus stops to grocery stores. By contrast, the interviewees noted that taking a bus
only allows for a limited amount of groceries to be bought, since one person only has two hands to
carry groceries, making the number of trips to the grocery store more frequent. In winter, when
public transportation is less reliable, snowstorms can change the bus routes, making it less
convenient to use them to get to grocery stores. This causes people to shop at their neighboring
convenience store or as some interviewees noted, to just “go without” when the bus schedules are
few and few between. Another option would be the use of private taxi cabs; however this option is
usually tossed aside due to the high price of taxi travel.
FINDING 9: Very Few Interviewees Walk to the Grocery Stores
Few interviewees walk to grocery stores due to a number of reasons. Distance to the store is
an important factor. Some neighborhoods have a grocery store within a mile, but others like Plumley
Village, a public housing project in Worcester, do not have a grocery store within a 1.5-mile radius.
Those who do walk sometimes walk up to 20 minutes to the store, or take the bus to the nearest bus
stop and walk the rest of the way. Since many of the women interviewed are single parents with
young children, it is difficult for them to walk that distance to the stores and back. Some of the
interviewees noted that if they wanted to walk to the grocery store on their own, finding and paying
for a reliable babysitter was too expensive.
FINDING 10: Many Interviewees Feel Safe in Their Respective Neighborhoods
Many researchers have argued that residents’ perceptions of neighborhood safety will affect
their decisions where to shop. The interviewees noted that there are not many areas where they do

46
not feel safe walking at night. A few women noted particular streets or storefronts where it,
“Smelled like drunks, it’s close to the liquor stores where the bums hang out.” The reason for this
could be due to the time spent living in the area and the social network the women have in place.
The perceptions of dangerous neighborhoods seem to come from those who lived outside the
neighborhoods, not from the residents who themselves live in the neighborhood.
FINDING 11: Interviewees Wanted More Ethnic Grocery Stores and Cleaner Shops
The primary concerns among those interviewed were having the opportunity to shop for
larger variety of groceries, specifically ethnic food and cleaner areas to shop. When provided with
the idea of how to get good food into the neighborhoods, a couple women brought up the idea of a
veggie delivery truck, instead of an ice cream truck. This truck would bring healthy fruits and
vegetables into the low-income neighborhoods in order to push healthy foods and make them more
readily available. This paired with the healthy cooking classes provided by the Worcester Food
Advisory and Active Living Policy Council would lead to a better education about healthy food and
more options to eat more nutritional meals.

47
5. Recommendations Recommendation 1: Improving supermarket accessibility
Bus routes provided by the Worcester Regional Transit Authority do go from Great Brook
Valley, Grafton Hill, and Lincoln St, and Main South to supermarkets, such as Price Rite and Price
Chopper, however, the buses do not run to intercity supermarkets that are of interest to low income
families, such as BJs which is on Rte. 20 in Auburn. In addition to new stops, there is a need for
more frequent bus times during the winter. Another idea would be for stores to offer return
transportation for shoppers who spend over a specific amount. For example Compare Foods on
Main St offers a free taxi ride for patrons who spend over $50.
Recommendation 2: Informing the immigrant community
The food assistance programs, such as SNAP, are well known in the Worcester area;
however some immigrant and refugee families new to the area do not know all of the available
options for them, such as the cooking class, or food pantries. A clearinghouse to better spread the
message of the Worcester Food and Active Living Policy Council (WFALPC) would help get their
work out to more of the Worcester area. As of right now, the WFALPC has a website and uses
word of mouth to spread knowledge about these programs. However, flyers in English, Spanish and
other languages would be helpful, especially at local Laundromats, bodegas, and grocery stores. One
other recommendation would be that supermarkets in Worcester gather better information about
the food preferences of the diverse communities in Worcester.
Recommendation 3: Bringing fresh food to food insecure areas
We recommend delivering fresh fruits and vegetables to low-income areas. One idea that has
already been mentioned, and should be developed is the Fruit and Veggie truck, in place of the ice
cream truck. This could increase healthy options for families in low-income areas, and allow them to
get to healthy foods without having to take the bus or find a way to the grocery store. Another way
to do this would be to have a type of bicycle delivery program where a bicycle contains a large cargo
full of fresh fruits and vegetables, similar to the veggie truck idea, and delivers the food throughout
the neighborhood. This idea is much more sustainable and wouldn’t cost as much money to
maintain.

48
Recommendation 4: Implementing a Worcester healthy corner store initiative
When we collected HFAI and food pricing data from corner stores in Worcester, we found
that they were often lacking fresh foods and healthy processed food alternatives. The Boston Public
Health Commission has begun a pilot program called The Corner Store Initiative which aims at
improving corner store food quality throughout the city of Boston. Participating corner stores are
required to, with the assistance of The Corner Store Initiative, stock fresh produce and healthier
food options as well as advertise these healthier options. Assistance from The Corner Store Initiative
comes in the form of incentives and technical assistance as well as product placement and marketing
assistance.
We recommend that Worcester establish a program similar to The Corner Store Initiative
which aids corner stores throughout the city in stocking a wider variety of healthy food merchandise
through the use of incentives, marketing and technical assistance, and product placement while
holding corner store owners ultimately responsible for expanding the amount of shelf space
dedicated to healthy foods.

49
6. Reference
Aiking, H., & de Boer, J. (2004). Food sustainability: Diverging interpretations. British Food Journal,
106(5), 359-359-365. Retrieved from
http://ezproxy.wpi.edu/login?url=http://search.proquest.com/docview/225138098?accountid
=29120
Akresh, I. R. (2007). Dietary assimilation and health among hispanic immigrants to the united states.
Journal of Health and Social Behavior, 48(4), 404-417. doi:10.1177/002214650704800405
Alaimo, K., Olson, C. M., & Frongillo, E. A. (2002). Family food insufficiency, but not low family
income, is positively associated with dysthymia and suicide symptoms in adolescents. The
Journal of Nutrition, 132(4), 719–725.
Aldrich, L., & Variyam, J. N. (2000; 2000). Acculturation erodes the diet quality of U.S. hispanics.
FoodReview, 23(1), 51-51-55. Retrieved from
http://ezproxy.wpi.edu/login?url=http://search.proquest.com/docview/200319980?accountid
=29120
Armstrong, D. (2000). A survey of community gardens in upstate new york: Implications for health
promotion and community development. Health & Place, 6(4), 319-327. doi:DOI:
10.1016/S1353-8292(00)00013-7
Beni, L. H., Villeneuve, S., LeBlanc, D. I., & Delaquis, P. (2011). A GIS-based approach in support
of an assessment of food safety risks. Transactions in GIS, 15, 95-108. doi:10.1111/j.1467-
9671.2011.01264.x
Born, B., & Purcell, M. (2006). Avoiding the local trap scale and food systems in planning research.
Journal of Planning Education and Research, 26(195)
Born, B., & Purcell, M. (2006). Avoiding the local trap. Journal of Planning Education and Research,
26(2), 195-207. doi:10.1177/0739456X06291389
Castro, S. (n.d.). Worcester Food Advisory Policy Council: Hunger-free and healthy. Retrieved from
http://www.worcesterfoodpolicy.org/index.php?option=com_content&task=view&id=43&Ite
mid=35
Center for Disease Control and Prevention, (n.d.). Faststats. Retrieved from website:
http://www.cdc.gov/nchs/fastats/heart.htm

50
Centers for Disease Control and Prevention: National Diabetes Surveillance System. Retrieved from
http://apps.nccd.cdc.gov/DDTSTRS/default.aspx.
Chanhda, H., Wu, C., Ye, Y., & Ayumi, Y. (2010). GIS based land suitability assessment along laos-
china border. Journal of Forestry Research, 21(3), 343-349. doi:10.1007/s11676-010-0080-5
Cohen, B. E., United States. Dept. of Agriculture. Economic Research Service. & IQ Solutions, I.
(2002). Community food security assessment toolkit. Retrieved
Cohen, B., Andrews, M., & Kantor, L. United States Department of Agriculture, Food Assistance
and Nutrition Research Program. (2002). Community Food Security Assessment Toolkit.
Cohen, M. J., & Garrett, J. L. (2010). The food price crisis and urban food (in)security. Environment
and Urbanization, 22(2), 467-482. doi:10.1177/0956247810380375
Contento, I., Balch, G. I., Bronner, Y. L., Lytle, L., Maloney, S., Olson, C., & Swadener, S. (1995).
The effectiveness of nutrition education and implications for nutrition education policy,
programs, and research: A review of research. Journal of Nutrition Education (USA),
Cook, J. T. (2002). Clinical implications of household food security: Definitions, monitoring, and
policy. Nutrition in Clinical Care. 5(4), 152–167.
Cook, J. T., & Frank, D. A. (2008). Food security, poverty, and human development in the united
states. Annals of the New York Academy of Sciences, 1136(1), 193-209.
doi:10.1196/annals.1425.001
Dept. of Agriculture, United States, & Economic Research Service. (2009). Access to affordable and
nutritious food: Measuring and understanding food deserts and their consequences : Report to
congress. (). Washington, D.C.: U.S. Dept. of Agriculture, Economic Research Service.
Diabetes basics. (2011, January 26). Retrieved from http://www.diabetes.org/diabetes-
basics/diabetes-statistics/
Diez Roux, A. V., Nieto, F. J., Caulfield, L., Tyroler, H. A., Watson, R. L., & Szklo, M. (1999).
Neighbourhood differences in diet: The atherosclerosis risk in communities (ARIC) study.
Journal of Epidemiology and Community Health, 53(1), 55–63.
Dooley, E. E. (2009). A more granular look at food deserts.(the beat)(brief article). Environmental
Health Perspectives, 117(9), A392(1).
Eckert, J., & Shetty, S. (2011). Food systems, planning and quantifying access: Using GIS to plan for
food retail. Applied Geography, 31(4), 1216-1223. doi:DOI: 10.1016/j.apgeog.2011.01.011

51
Farley, T., Rice, J., Bodor, J., Cohen, D., Bluthenthal, R., & Rose, D. (2009). Measuring the food
environment: Shelf space of fruits, vegetables, and snack foods in stores. Journal of Urban
Health, 86(5), 672-682. doi:10.1007/s11524-009-9390-3
Feagan, R. (2007). The place of food: Mapping out the ‘local’ in local food systems. Progress in
Human Geography, 31(1), 23-42. doi:10.1177/0309132507073527
Fitzgerald, N. (2010). ACCULTURATION, SOCIOECONOMIC STATUS, AND HEALTH
AMONG HISPANICS. NAPA Bulletin, 34(1), 28-46. doi:10.1111/j.1556-4797.2010.01050.x
Franco, M., Diez Roux, A. V., Glass, T. A., Caballero, B., & Brancati, F. L. (2008). Neighborhood
characteristics and availability of healthy foods in baltimore. American Journal of Preventive
Medicine, 35(6), 561-567.
Gebauer, H., & Laska, M. (2011). Convenience stores surrounding urban schools: An assessment of
healthy food availability, advertising, and product placement. Journal of Urban Health, 88(4),
616-622. doi:10.1007/s11524-011-9576-3
Glanz K, Clawson M, Young M, Carvalho M. Nutrition Environment Measures Training Manual.
Atlanta: Emory University, 2006.
Haering, S. A., & Franco, M. (Fall). Retrieved from
http://www.jhsph.edu/clf/PDF_Files/BaltimoreCityFoodEnvironment.pdf
Hamm, M. W., & Bellows, A. C. (2003). Community food security: Background and future
directions. Journal of Nutrition Education and Behavior, 35(1), 37–43.
Helms, M. (2004). Food sustainability, food security and the environment. British Food Journal,
106(5), 380-380-387. Retrieved from
http://ezproxy.wpi.edu/login?url=http://search.proquest.com/docview/225149256?accountid
=29120
Jensen, H. (2002). Food insecurity and the food stamp program. American Journal of Agricultural
Economics, 84(5), 1215-1228.
Kantor, L. S. (2001). Community food security programs improve food access. FoodReview, 24(1),
20-20-26. Retrieved from
http://ezproxy.wpi.edu/login?url=http://search.proquest.com/docview/200309210?accountid
=29120;
http://au4sb9ax7m.search.serialssolutions.com/?SS_Source=3&genre=article&sid=ProQ:&atit

52
le=Community food security programs improve food access&title=FoodReview&issn=1056-
327X&date=2001-01-
01&volume=24&issue=1&spage=20&SS_docid=78476624&author=Kantor, Linda Scott
Kasturi, P. (2009). Technology and food security. Humanomics, 25(2), 163-163-168.
doi:10.1108/08288660910964210
Kleinman, R. E., Murphy, J. M., Little, M., Pagano, M., Wehler, C. A., Regal, K., et al. (1998).
Hunger in children in the United States: Potential behavioral and emotional correlates.
Pediatrics, 101(1), E3.
Kramer-LeBlanc, C., & McMurry, K. (1998). Discussion paper on domestic food security. Family
Economics and Nutrition Review, 11(1), 49-49-78. Retrieved from
http://ezproxy.wpi.edu/login?url=http://search.proquest.com/docview/219380232?accountid
=29120
Kremer, P., & DeLiberty, T. L. (2011). Local food practices and growing potential: Mapping the case
of philadelphia. Applied Geography, 31(4), 1252-1261. doi:10.1016/j.apgeog.2011.01.007
Lopez-Class, M., & Hosler, A. S. (2010). Assessment of community food resources: A latino
neighborhood study in upstate NewYork. Journal of Poverty, 14(4, 13p), 369-381.
doi:10.1080/10875549.2010.517070
Magee, B. D. Retrieved from website:
http://www.worcesterma.gov/uploads/88/76/8876150daa6d86a6ac9bfd6b93b7ddf3/health-
of-worcester-report.pdf
Maria Lopez-Class, Felipe González Castro, Amelie G. Ramirez, (2011) Conceptions of
acculturation: A review and statement of critical issues. Social Science & Medicine 72:9, pages
1555-1562.
Mathematica Policy Research, Inc., Hunger in America 2006: Local Report Prepared for the
Worcester County Food Bank, 2000
Mendes, W., Balmer, K., Kaethler, T., & Rhoads, A. (2008). Using land inventories to plan for urban
agriculture: Experiences from portland and vancouver. Journal of the American Planning
Association, 74(4), 435-449. doi:10.1080/01944360802354923

53
Morland, K., Wing, S., Diez Roux, A., & Poole, C. (2002). Neighborhood characteristics associated
with the location of food stores and food service places. American Journal of Preventive
Medicine, 22(1), 23–29.
Morrison, K. T., Nelson, T. A., & Ostry, A. S. (2011). Mapping spatial variation in food
consumption. Applied Geography, 31(4), 1262-1267. doi:10.1016/j.apgeog.2010.11.020
Nord, M. (2005). Measuring U.S. household food security. Amber Waves, 3(2), 10-10-11. Retrieved
from
http://ezproxy.wpi.edu/login?url=http://search.proquest.com/docview/204849374?accountid
=29120;
http://au4sb9ax7m.search.serialssolutions.com/?SS_Source=3&genre=article&sid=ProQ:&atit
le=Measuring U.S. Household Food Security&title=Amber Waves&issn=1545-
8741&date=2005-04-
01&volume=3&issue=2&spage=10&SS_docid=822722221&author=Nord, Mark
Nord, M., & Andrews, M. (2003, February). Putting food on the table: Household food security in
the united states. Retrieved from
http://www.ers.usda.gov/AmberWaves/Feb03/Features/PuttingFood.htm
Nord, M., Andrews, M. and Carlson, S., Household Food Security in the United States, 2004, U.S.
Department of Agriculture, Economic Research Report No. 11, 2005.
Nord, M., Andrews, M., & Carlson, S. (2008). Household food security in the United States, 2007
(No. ERR-66).Washington, DC: US Dept of Agriculture. Retrieved December 28, 2008, from
www.ers.usda.gov/Publications/ERR66
Park, Y., Neckerman, K., Quinn, J., Weiss, C., Jacobson, J., & Rundle, A. (2011). Neighbourhood
immigrant acculturation and diet among hispanic female residents of new york city RID A-
5282-2009. Public Health Nutrition, 14(9), 1593-1600. doi:10.1017/S136898001100019X
Parker, L. (2002). The role of clinicians in helping patients achieve food security. Nutrition in
Clinical Care, 5(4), 149–151.
Pothukuchi, K. (2004). Community food assessment : A first step in planning for community food
security. Journal of Planning Education and Research, 23(356)

54
Powell, L. M., Slater, S., Mirtcheva, D., Bao, Y., & Chaloupka, F. J. (2007). Food store availability
and neighborhood characteristics in the united states. Preventive Medicine, 44(3), 189-195.
doi:DOI: 10.1016/j.ypmed.2006.08.008
Raja, S., Changxing Ma, , & Yadav, P. (Summer 2008). Beyond food deserts. Journal of Planning
Education and Research, 27(4), 469-482. doi:10.1177/0739456X08317461
Schafft, K. A., Jensen, E. B., & Hinrichs, C. C. (2009). Food deserts and overweight schoolchildren:
Evidence from pennsylvania*. Rural Sociology, 74(2), 153-177. doi:10.1111/j.1549-
0831.2009.tb00387.x
Short, A., Guthman, J., & Raskin, S. (2007). Food deserts, oases, or mirages? Journal of Planning
Education and Research, 26(3), 352-364. doi:10.1177/0739456X06297795
Tchumtchoua, S., & Lopez, R. A. (2005). A town-level assessment of community food security in
connecticut. Research Monographs, , 1.
Ver Ploeg, Michelle; Access to affordable and nutritious food: Measuring and understanding food
deserts and their Consequences June 2010
Wild, S., Roglic, G., Green, A., Sicree, R., & King, S. (2010). Global prevalence of diabetes.
Epidemiology/HealthServices/Psychosocial Research, Retrieved from
http://www.who.int/diabetes/facts/en/diabcare0504.pdf
Wilde, P. E., McNamara, P. E., & Ranney, C. K. (1999). The effect of income and food programs on
dietary quality: A seemingly unrelated regression analysis with error components. American
Journal of Agricultural Economics, 81(4), pp. 959-971. Retrieved from
http://www.jstor.org/stable/1244338
Winne, M., Joseph, H., & Fisher, A. (1997). Community food security; A guide to concept, design
and implementation. (Unpublished Tufts University, School of Nutrition and Policy,
Winne, M., Joseph, H., & Fisher, A. (2000). Community food security : A guide to concept, design
and implementation. Venice, CA: Community Food Security Coalition.
World Health Organization , Trade, foreign policy, diplomacy and health. (2012). Food security.
Retrieved from website: http://www.who.int/trade/glossary/story028/en/

55
Appendix A: Interview Transcriptions
A1: Great Brook Valley:
On March 5th 2012, we conducted an interview with two women who live in Great Brook
Valley, Worcester MA. We interviewed them in order to see their grocery shopping patterns, and in
order to study their relationship with food within that area. One of the women has lived in Great
Brook Valley for most of her life; the other has been living there for a year.
One popular shopping place for the residents of Great Brook Valley is the Great Brook
Valley Market, commonly called Manerva’s. This market has great variety. It is a good place for the
simple weekly market visits, such as milk and bread. The owner of the market is well known, and
will order specialty food items if is asked to do so. The two women both do their larger purchases at
the Stop and Shop on Lincoln St. Both women either use the bus or other means of transportation
(friend or family member) to get to the grocery store, since neither one has a car of their own. The
women spend about 450-600 dollars a month on average, and both use the EBT/ SNAP program.
One of the women was very adamant about only shopping at Stop and Shop or the GBV
Market. She was not concerned with clipping coupons or following the sale. This is mostly due to
the fact that the bus goes to Stop and Shop directly and is fast and easy. Sometimes she will simply
shop at GBV Market due to the fact it may be even quicker and the money she saves by not taking
the bus is about equal to the extra spent at the market. She wasn’t concerned with healthy food
either. This is due to the fact that her son and herself were both naturally skinny. “I buy what taste
good and is fast to make,” she said. She brought up how her son always wants to ‘eat on the go’ and
how sometimes he would skip dinner because he wanted to go out. It was much easier to get him to
eat something quick like a sandwich or a hot pocket.
The other woman was the exact opposite. She was willing to follow the sales, since she did
most of her grocery shopping with a family member. She clipped coupons when necessary. She runs
a day care in GBV during the day so she sometimes has to buy in bulk for the larger number of
children and is very concerned with the heath level of the food. She likes to bake her food rather
than fry it. She has tried to grow her own vegetables once in the soil in GBV but the ground is very
dirty and unclean, causing a poor and uneatable quality of produce. However, she is able to enjoy
fresh fruits and vegetables at the farmer’s markets that are offered during the summer time.

56
The wintertime proves to be more difficult for getting food. Mostly because the bus
schedules change to every other hour, and sometimes the routes change to the snow routes, which
make them more difficult to maneuver and get where you need to go. Safety used to pose a concern
for those living in the GBV area, however with a greater police presence, the area had offered itself
to be one of more promise than before.
Both women have shopped at other locations before, Compare foods, Walmart etc, and
however have only found not so great prices at a further distance, so they would rather just stay in
the area at Stop and Shop. They have both gone into Aldi once before and neither had returned for
a second visit due to the price and poor selection in their store.
A2: Plumley Village:
This interview was conducted with four women who live in the Plumley Village Complex,
and one woman who worked there in Wellness center. We began with a survey that was passed out
amongst the women, which talked about their shopping patterns, spending patterns, and family
breakdown. A few questions were asked regarding income and such things that were on the survey
for anonymity reasons; other questions were simply to get their minds flowing with ideas for the
interview questions to follow. We chose to do this survey method for privacy reasons.
All of the women were the primary shoppers in their households. Many of them only had
one dependent, making the average amount spent per month, anywhere from 40-200 dollars a
month; seem much lower than other areas in Worcester. Some women had their own car; two took
buses or walked to the stores. They were very satisfied with the bus routes, seeing that they were
dropped off about 100 feet from the store. The only problem was they had to frequent the store
more often since they can’t carry a lot of bags at once. Women who drove their own car did not
seem to have this problem.
Price Rite was a top name for all of the women for their groceries. However, once again, all
the women said they would not buy their meat from there. “The prices are great at Price Rite, but I
think there’s something up with their meat department,” one woman said. Another popular choice
was Price Chopper on Highland St. However when mapping these stores distances, both fall over
one mile away, making their walkability a little unrealistic.

57
All of the women were very against shopping at convenience stores. “Only for milk, and
sometimes for emergencies,” all the women agreed. Even though there is a tiny convenience store
inside of the complex, which is the only walkable market, so that is what is their only option is when
it’s an emergency. Other than that, they must drive or wait for the bus to get to the supermarkets for
the reasonably priced goods. The women who were able to drive would go find the sales, or even go
to Sam’s club to buy in bulk if that was the cheaper option.
All of the women generally cook at home, unless it is a special occasion. They were not big
fans of McDonalds or fast food restaurants. When the women were looking for cultural foods, they
would head down to the Main South area to go to Compare Foods or the Vietnamese market for
fish.
When asked what would they like to see changed in the Plumley area, the women all agreed
that they would like to see a grocery store closer to the complex, a walkable distance. “Imagine if
you had two children, and had to take the bus to the grocery store, how hard is that!” This is a very
good point, since childcare can be very expensive, it may be cheaper to take your children shopping,
but when you don’t have a car, you have to maneuver around Worcester the best you can. It would
make life much better for the families of Plumley if there was a grocery store available.
A3: Main South:
When the women first walked into the room, we introduced ourselves and asked where
everyone’s country of origin was. The four women represented four different countries; Sudan,
Vietnam, the Caribbean and Puerto Rico. We began with a survey that was passed out amongst the
women, which talked about their shopping patterns, spending patterns, and family breakdown. A
few questions were asked regarding income and such things that were on the survey for anonymity
reasons; other questions were simply to get their minds flowing with ideas for the interview
questions to follow. We chose to do this survey method for privacy reasons.
They all showed to be the primary grocery shopper in their households. On average they said
to shop once a week, spending between 100-200 dollars per trip. When it came to the question of
whether or not they brought children or spouses with them varied. None of the women brought
spouses with them while shopping; however two of the four were single moms. I wish I had
prodded more about the reasons why the women did or did not bring the children.

58
We opened the interview with talking about convenience stores, and if the women bought
their groceries there. They all felt very strongly about not purchasing their groceries at a convenience
store, except milk, which has shown to be cheaper and name brand at the convenience stores, rather
than Price Rite and Stop and Shop which sold the generic brands for cheap. I agreed with this. It is
a common observation that prices in convenience stores are higher, and the reason is in the name,
you are paying for convenience.
The women’s top store choices were all very similar. Price Rite, Price Chopper and Stop and
Shop were three of the most popular choices. Two women agreed on Compare foods, while at least
one large chain appeared on every woman’s list; Wal-Mart, Target, Sam’s club. When we talked
about why they chose these stores, there were a variety of different reasons they shopped there.
The main and most important reason was quality. Price was of course a close second, but all
of the women agreed that groceries were not worth any money if the product was not good. This
was especially relevant when it came to the topic of Price Rite. It is known as one of the cheapest
grocery stores in the Worcester Area, however with this cheapness it is also noticed that you
sacrifice freshness. The women were unanimous with the statement that they would not buy their
meat or seafood there, only vegetables and non-perishables. This also coincided with the cleanliness
of the store. Price Rite was spoken of as dirty and not well maintained. They were very specific
about the meat section at Price Rite, which it is not fresh and has a certain bad odor that is
synonymous with poor refrigeration and non-fresh meat. Another store that was brought up in this
category of dirty and unkempt is Compare foods. It also is a holder of cheap prices and ethnic
foods. The woman also felt badly about Santiago’s market. Also, one woman claimed to see a rat
and droppings in the store. One of the worst descriptions was for Pennywise markets; they
illustrated it as “uncomfortable while shopping there due to the smell of alcohol seeping off all of
the bums.”
The women chose the ‘buy in bulk’ stores for large events. For example, they would shop
there if they needed to buy a large quantity of items for holidays, or large quantities of non-
perishables. However, the women thought it was impracticable to shop in bulk, due to high waste.
They would never buy their vegetables or fruits from these brand of stores, simply because there is
no way they could make it last without having to throw away half of it. Even items you can freeze
can eventually go bad and get freezer burn.

59
The Compare Food Store, and Macon Market were shown to sell more ethnic types of food.
Patel Brothers in Westborough was also a good place named for good ethnic food. The women all
generally disliked Shaw’s due to their high priced shelves, however they were attracted to the
“Around the World” aisles, which followed suit in expense, but they have items that they cannot
find elsewhere.
When we stayed on the topic of Shaw’s, it was said that they used to be one of the cheapest
stores around, however in recent years they have become more and more overpriced. The “sales at
Shaw’s aren’t even sales”, one woman said in reference to the fact that other stores carry items
cheaper than what Shaw’s offers at a ‘sale’ price. At times they do have to succumb to the high
prices supermarkets charge for the ethnic foods that they want, but other than that they would not
even consider Shaw’s as a shopping option.
All of the woman besides one had a vehicle to use for grocery shopping. They said that if the
grocery store is local that it is a nice addition, but they tend to follow the sales wherever they may
be. Even the woman who took the bus to certain stores said she would rather travel farther for the
sales, because the money she spends on the taxi home is not too bad in comparison to the money
she saves by shopping where the sales are. She also mentioned how the Compare Foods store used
to, and may still; offer a free taxi ride home when you spend 50 dollars or more on the groceries.
The question of the differences between the food here and the food in their home country
was answered unanimously. Back in their countries, the food is fresh. It is not picked while unripe
and sent around the world with preservatives and chemicals before you buy it like in America. They
described the bananas as big and full of flavor, and their mangoes tasted blew the mangoes here out
of the water. One woman asked, “How come at home when I cut an apple or fruit, you can smell it
everywhere! But here, you smell nothing.” The answer is between the nutrient deprived soil, unripe
picking, and chemicals that cause the problems with the fruit.
We asked the women what they thought needed to be changed; the first answer was to make
the bus routes close to the grocery stores. One woman who takes the bus has to take the bus to the
closet stop, then walk ½ a mile, then call a cab home. Another suggestion was to have the farmer’s
market in Crystal Park, instead of the YMCA’s parking lot. They think it’s a much better place; more
relaxing and clean to sell fruits, also easier to bring children to in the park. One last idea which was
great was a “Vegetable truck”, similar to what we know as an ice cream truck!

60
Appendix B: Interview Survey
Interviewee Name:_______________ Date:_______________
Interviewer Name:_______________ Method of Contact:_______________
Questions:
1) Introduction Questions
• What do you think about the quality of food that is available in corner stores,
convenience stores, and supermarkets?
• Are there foods that you would like to buy which are not available in any store?
• Who does the shopping in your household?
2) What are Worcester resident’s food shopping patterns?
• Where do you do your grocery shopping and why?
• How many times a month do you grocery shop?
• How much on average a month do you spend on groceries?
• Do you make use of the EBT Card or WIC programs?
3) What are the transportation trends amongst Worcester residents?
• How do you get to your food source of choice?
• Do you feel safe walking through your neighborhood?
4) Do Worcester residents have the food available that they want?
• How many times a week do you cook dinner at home?
• How is the food different here than your country of origin?
• How are eating patterns different?
5) How do Worcester residents perceive their local food system?
• As of now, what do you think the main ‘food issues’ are in your community?
• What would you change about the stores you shop in?
• What do you think of the kinds of foods that are available, what would you like
to see added to the shelves?

61
Nombre de Entrevistado:_______________ Fecha:_______________
Nombre de Entrevistador:_______________ Método de Contacto:_____________
Preguntas:
1) Preguntas de Introducción
• ¿Qué piensa usted acerca de la calidad de los alimentos que está disponible en
tiendas de abarrotes, tiendas de conveniencia y supermercados?
• ¿Hay alimentos que desea comprar, que no están disponibles en cualquier tienda
• ¿Quién hace las compras en su hogar?
2) ¿Cuáles son los patrones de residente de Worcester compra de alimentos?
• ¿De dónde hacer sus compras de comestibles y por qué?
• ¿Cuántas veces al mes en el que se tienda de comestibles?
• ¿Cuánto en promedio al mes se gasta en alimentos?
• ¿Hace uso de la tarjeta de EBT o los programas de WIC?
3) ¿Cuáles son las tendencias del transporte entre los residentes de Worcester?
• ¿Cómo llegar a su fuente de alimento de elección?
• ¿Se siente seguro caminando por el vecindario?
4) Los residentes de Worcester tiene la disponibilidad de alimentos que ellos
quieren?
• ¿Cuántas veces a la semana a cocinar la cena en casa?
• ¿Cómo es la comida diferente aquí, entonces, su país de origen?
• ¿Cómo son los patrones de alimentación diferente?
5) ¿Cómo perciben los residentes de Worcester su sistema local de alimentos?
• A partir de ahora, ¿qué crees que los principales "problemas alimentarios" están
en su comunidad?
• ¿Qué cambiarías de las tiendas a comprar en el?
• ¿Qué piensa usted de los tipos de alimentos que están disponibles, ¿qué le
gustaría ver añadido a las estanterías?

62
Appendix C: How to transfer Excel data (Lat, Long) to ArcGIS 10
1) File – Add Data – Add X-Y Data
2) Browse for your Excel Data file
a) X-Field = Longitude
b) Y-Field = Latitude
3) Coordinate System of Input Coordinate’s:
a) *In your Excel your coordinate points must be in Decimal Degree’s
b) Click Edit -- Clear the current coordinate system
c) Click Select – Click Geographic Coordinate Systems – Click World –Select WGS
1984.prj
d) Click Ok at bottom
4) Click Ok at the bottom of original window and your data will appear on your map

63
Appendix D: Create Shapefile from Data you just imported
1. Left-Click under the Table of Contents of the data you just imported. 2. Go to Data – Export Data
i) Make sure it says-
(1) Export: All Features
ii) Use the same coordinate system as:
iii) This layer’s source data
3. Save this file to your choosing
4. Click Ok and the data you imported will become a shapefile on your map
5. You can then delete the data you imported before under the Table of Contents

64
Appendix E: Additional Maps
Figure 10: Block Group Ethnic Composition and Gas/Convenience Store Locations

65
Figure 11: Block Group Median Household Income and Gas/Convenience Store Locations

66
Figure 12: Block Group Ethnic Composition and Miscellaneous Retail Locations

67
Figure 13: Block Group Median Household Income and Miscellaneous Retail Locations

68
Appendix F: Pricing Data Collection Form Source Name:_______________ Source Type:_______________
Source Address:_______________ Surveyor:_______________
Meats:
90% Lean Ground Beef Available: Yes____ No____ Price(per lb) ________
Chicken Breast Available: Yes____ No____ Price(per lb) ________
Grains:
Wheat Bread Available: Yes____ No____ Price(per loaf) ________
White Rice Available: Yes____ No____ Price(per lb) ________
Dry Pasta Available: Yes____ No____ Price(per lb) ________
Dry Cereal Available: Yes____ No____ Price(per lb) ________
Vegetables/Starches:
Corn Available: Yes____ No____ Price(per lb) ________
Potatoes Available: Yes____ No____ Price(per lb) ________
Broccoli Available: Yes____ No____ Price(per lb) ________
Carrots Available: Yes____ No____ Price(per lb) ________
Fruits:
Apples Available: Yes____ No____ Price(per lb) ________
Bananas Available: Yes____ No____ Price(per lb) ________
Oranges Available: Yes____ No____ Price(per lb) ________
Grapes Available: Yes____ No____ Price(per lb) ________
Dairy:
Eggs Available: Yes____ No____ Price(per dozen) ______
Skim Milk Available: Yes____ No____ Price(per gallon) ______
American Cheese Available: Yes____ No____ Price(per lb) ________
Yogurt Available: Yes____ No____ Price(per lb) ________

69
Appendix G: Culturally Adapted HFAI
While the HFAI fulfilled its purpose, several aspects of it could be addressed to provide
better results. One short coming of the HFAI was the lack of cultures it represented. Worcester
being a diverse city has large African, Hispanic and Asian populations, which were under
represented with this method. The HFAI’s other flaw was the point distribution, which needed
more scientific justification and more numerical weight.
On the next page is an example of a new culturally adapted HFAI. The points are now
assigned proportionally to the respective food’s percentage of daily consumption. Therefore grains,
being largest portion of the USDA’s food plate, have the highest numerical weight. The new HFAI
also attempts to address the cultural flaw of the previous HFAI by trying to represent Asian cultural
foods. The next step would be to add sections to represent the other various cultures in Worcester
such as African and Hispanic however, more research would need to be done to fully understand the
difference between cultural food and healthy cultural food.

70
Food Group Healthy Score Availability Score
Dairy:
A) Milk
B) Cheese
C) Yogurt
A) Skim/Soy/ 1% =2 pts Each
B) Organic/Low Fat=1pt
C) Organic Brand=2pts
A) >50% =1pt, >75%= 3pts
B) >2 Brands=1pt
C) >2 Brands=1pt
Fresh Fruits:
A) All Fruits
A) Seasonal or Organic Fruit =3pts
B) Cultural Fruits=3pts
A) >20 types=1pts, >40types=3pts,
B) >5 types=2pts,
>10 types= 4pts
Fresh Vegetables:
A) All Vegetables
A) Seasonal/Organic Vegetables=2pts
B) Cultural Vegetables=2pts
A) >20 types=1pts, >40types=3pts,
B) >5 types=2pts,
>10 types= 4pts
Meats:
A) Chicken
B) Ground Beef
C) Turkey
D) Fish
A) Skinless Breast =2pts
B) 93% Lean Beef=3pts
C) Fresh Turkey=3pts
D) Fresh Fish=3pts
A) >30%=2pts, >40% =4pts
B) >30%=2pts, >40% =4pts
C) >3 types=2pts, >6 types= 4pts
D) >3 types=2pts, >6 types= 4pts
Grains:
A) Bread
B) Pasta
C) Cereal
A) Whole Grain Bread=4pts
B) Whole Grain Pasta=4pts
C) Brown Rice=4pts
D) Whole Grain Cereal=4pts
A) >3 Brands=5pts
B) >3Brands=5pts
C) >3Brands=5pts
D) >3 Brands=5pts
Asian Cultural Foods:
A) Rice
B) Sea Food
C) Soy
A) White Rice= 3pts
B) Calamari/Shrimp/Fresh Fish=2pts
C) Soy Beans/Tofu=3pts
A) >3 Brands=3pts
B) Recently Prepared=3pts
C) >3 Brands=3pts
Source Name:
Type:
Overall Score:
Healthy Score: MAX(64pts)
Availability Score: MAX(77pts)