Analyzing and Mapping Census and Student Data 2006 PNAIRP Conference Welches, OR.
57
-
Upload
erika-carter -
Category
Documents
-
view
218 -
download
2
Transcript of Analyzing and Mapping Census and Student Data 2006 PNAIRP Conference Welches, OR.
Analyzing and Mapping Census and Student Data
2006 PNAIRP ConferenceWelches, OR
Acknowledgements
The State Board for Community Colleges wishes to thank the Ford Foundation’s Bridges to Opportunity Program and the Washington State College Spark Foundation for their support for this project.
Presenters
David Prince, State Board for Community & Technical CollegesBeth Hartsoch, Research & Information Analyst, Skagit Valley CollegeMaureen Pettitt, Director Institutional Research, Skagit Valley College
Workshop Topics
Project BackgroundData StructureApplications
StatewideCollege – SVC Example
Sample Questions Next Steps
What will colleges get?How can you use the data?
Q & A
Project Background
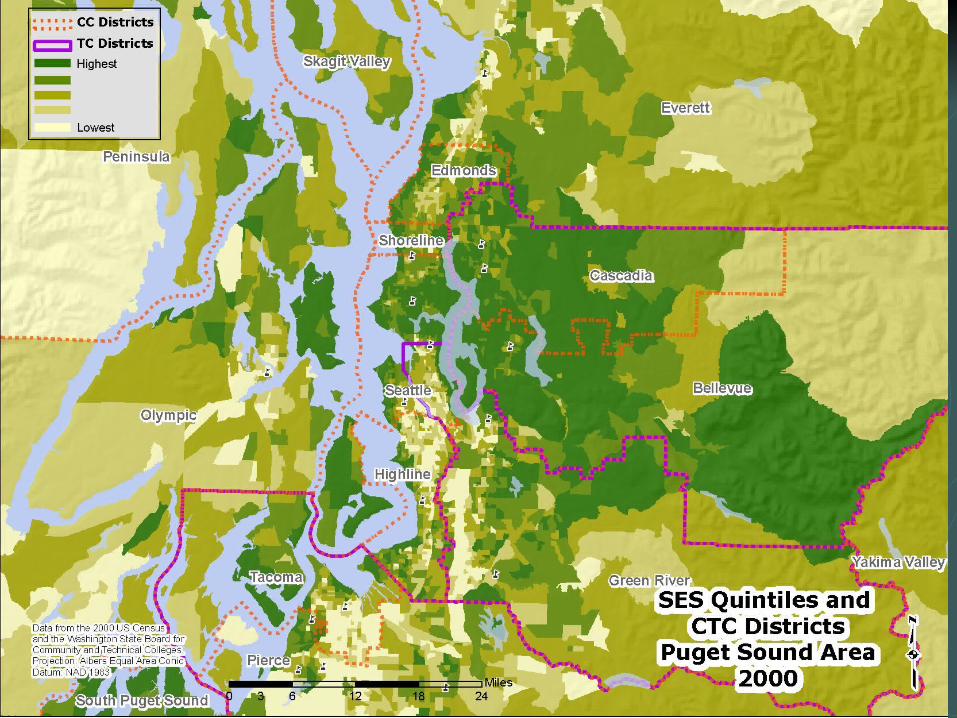
A Census Based Proxy for Student Socioeconomic Status and Income
Based on census data for income, education (BA or higher) and occupation (professional/managerial)
Student address matched to census
Student assigned median household income and SES for area mapped
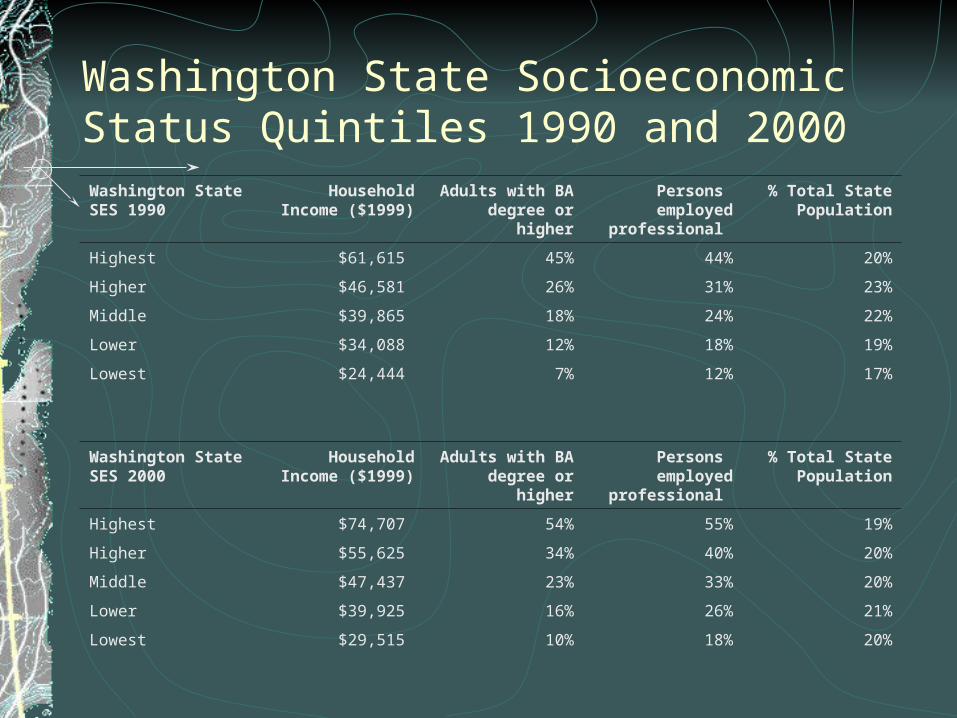
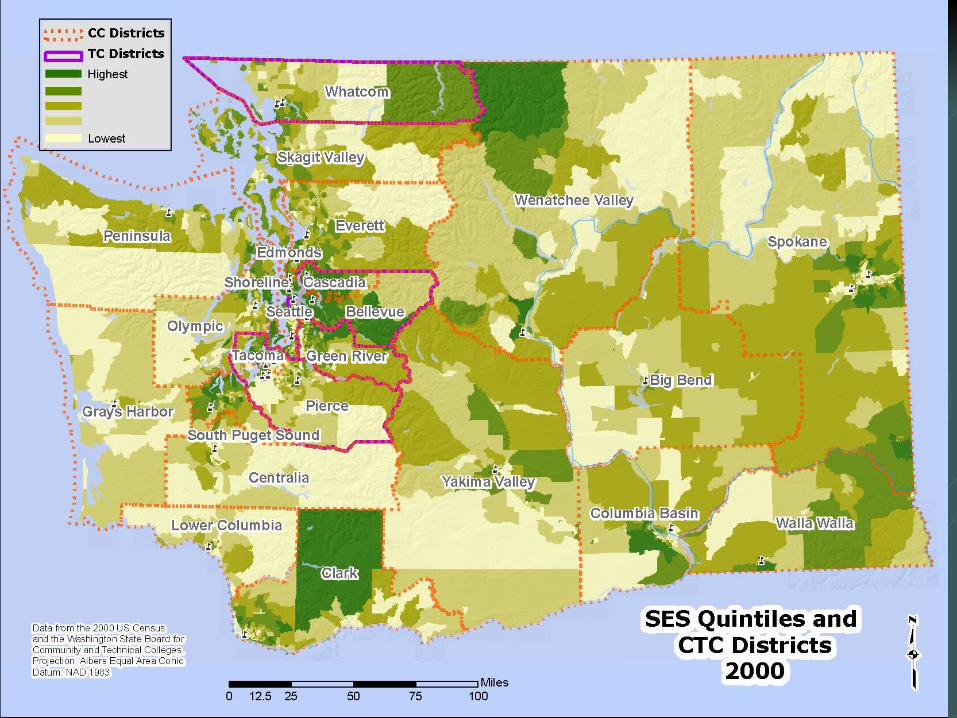
Washington State Socioeconomic Status Quintiles 1990 and 2000
Washington State SES 1990
Household Income ($1999)
Adults with BA degree or higher
Persons employed professional
% Total State Population
Highest $61,615 45% 44% 20%
Higher $46,581 26% 31% 23%
Middle $39,865 18% 24% 22%
Lower $34,088 12% 18% 19%
Lowest $24,444 7% 12% 17%
Washington State SES 2000
Household Income ($1999)
Adults with BA degree or higher
Persons employed professional
% Total State Population
Highest $74,707 54% 55% 19%
Higher $55,625 34% 40% 20%
Middle $47,437 23% 33% 20%
Lower $39,925 16% 26% 21%
Lowest $29,515 10% 18% 20%
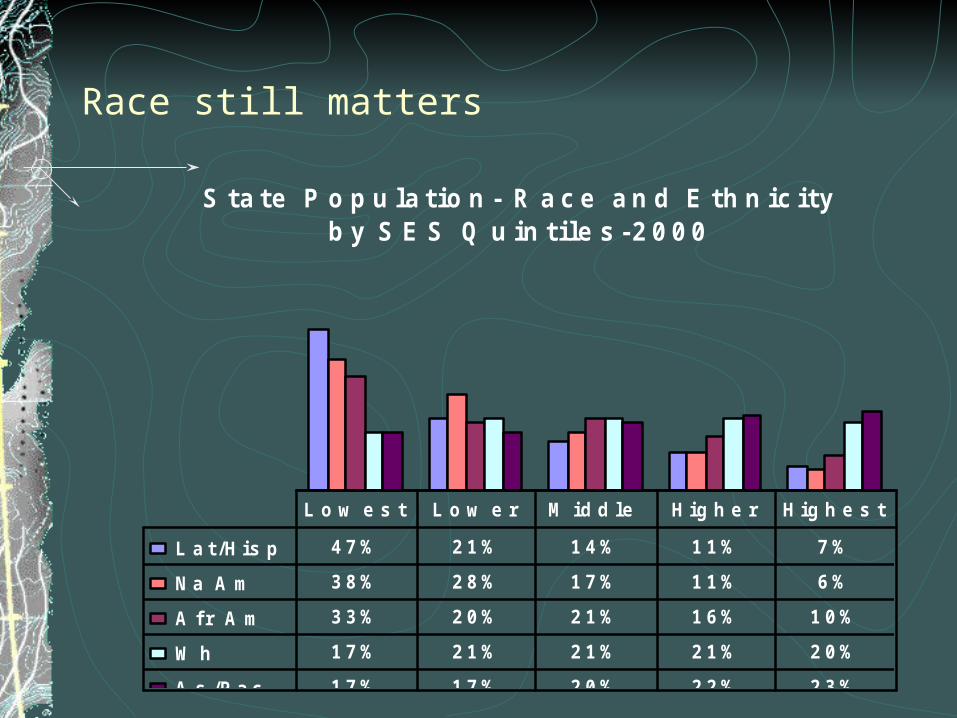
Race still matters
S t a t e P o p u l a t i o n - R a c e a n d E t h n i c i t y b y S E S Q u i n t i l e s - 2 0 0 0
L a t / H i s p 4 7 % 2 1 % 1 4 % 1 1 % 7 %
N a A m 3 8 % 2 8 % 1 7 % 1 1 % 6 %
A f r A m 3 3 % 2 0 % 2 1 % 1 6 % 1 0 %
W h 1 7 % 2 1 % 2 1 % 2 1 % 2 0 %
A s / P a c 1 7 % 1 7 % 2 0 % 2 2 % 2 3 %
L o w e s t L o w e r M i d d l e H i g h e r H i g h e s t
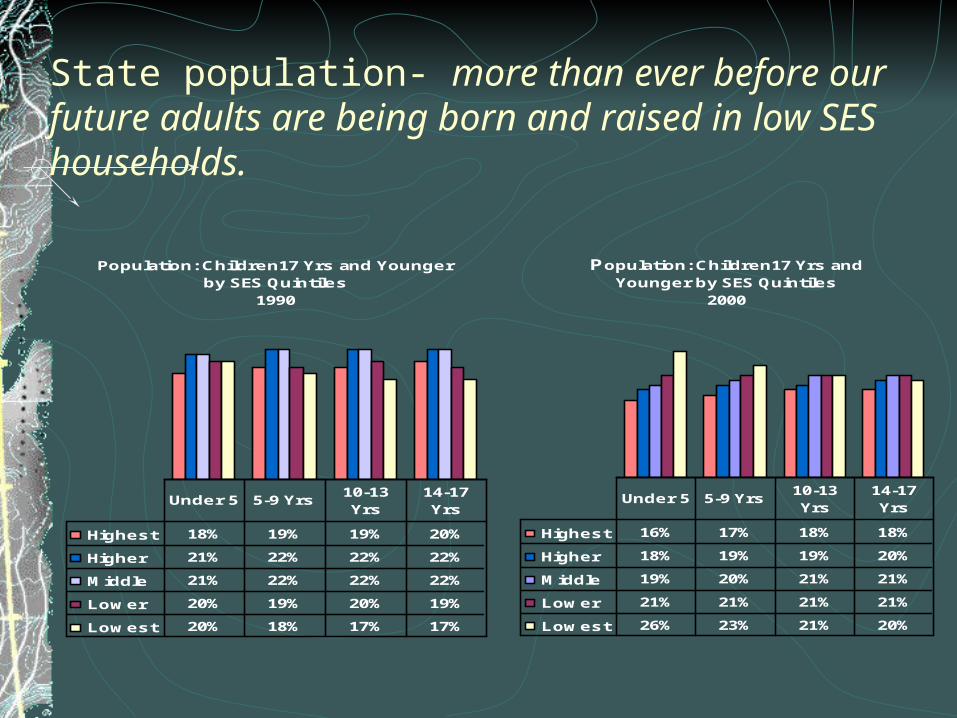
State population- more than ever before our future adults are being born and raised in low SES households.
Population: Children17 Yrs and Younger by SES Quintiles
1990
Highest 18% 19% 19% 20%
Higher 21% 22% 22% 22%
Middle 21% 22% 22% 22%
Lower 20% 19% 20% 19%
Lowest 20% 18% 17% 17%
Under 5 5-9 Yrs10-13 Yrs
14-17 Yrs
Population: Children17 Yrs and Younger by SES Quintiles
2000
Highest 16% 17% 18% 18%
Higher 18% 19% 19% 20%
Middle 19% 20% 21% 21%
Lower 21% 21% 21% 21%
Lowest 26% 23% 21% 20%
Under 5 5-9 Yrs10-13 Yrs
14-17 Yrs
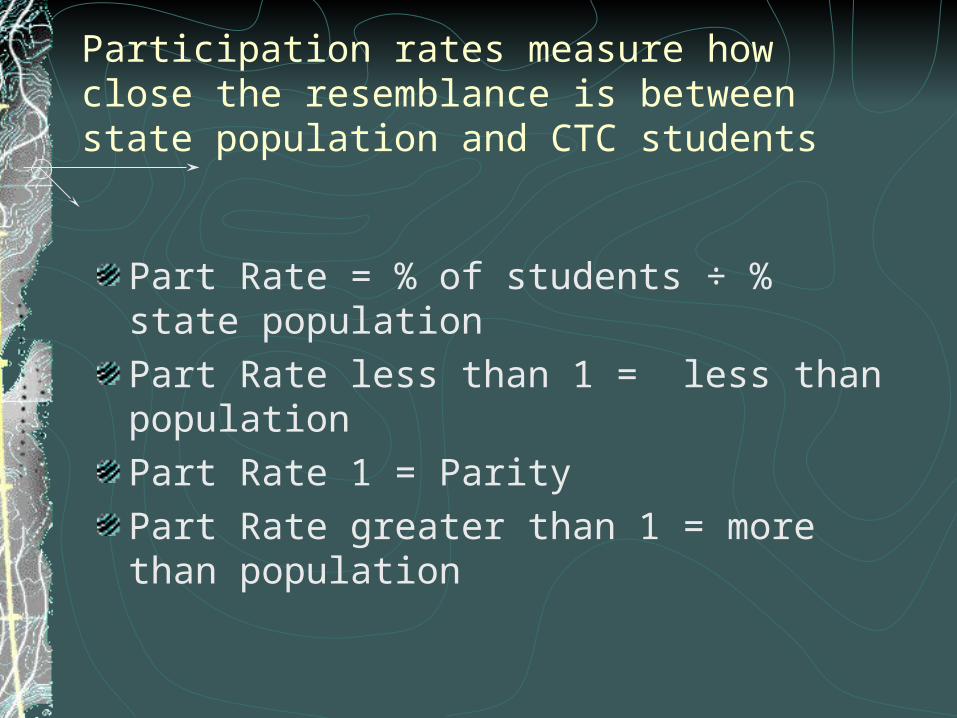
Participation rates measure how close the resemblance is between state population and CTC students
Part Rate = % of students ÷ % state populationPart Rate less than 1 = less than populationPart Rate 1 = Parity Part Rate greater than 1 = more than population
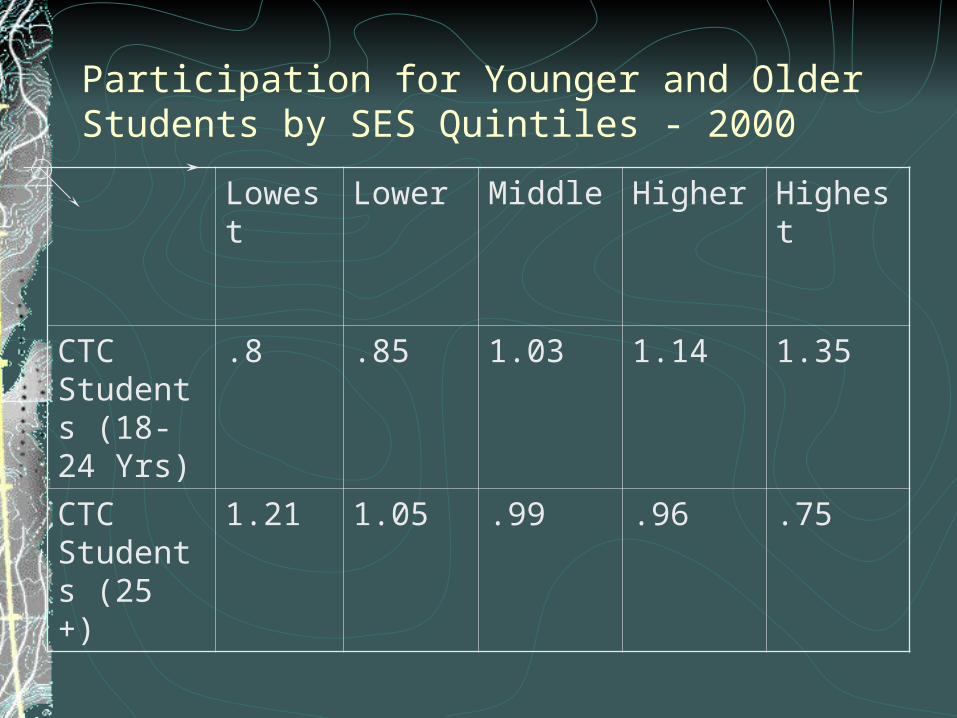
Participation for Younger and Older Students by SES Quintiles - 2000
Lowest Lower Middle Higher Highest
CTC Students (18-24 Yrs)
.8 .85 1.03 1.14 1.35
CTC Students (25 +)
1.21 1.05 .99 .96 .75
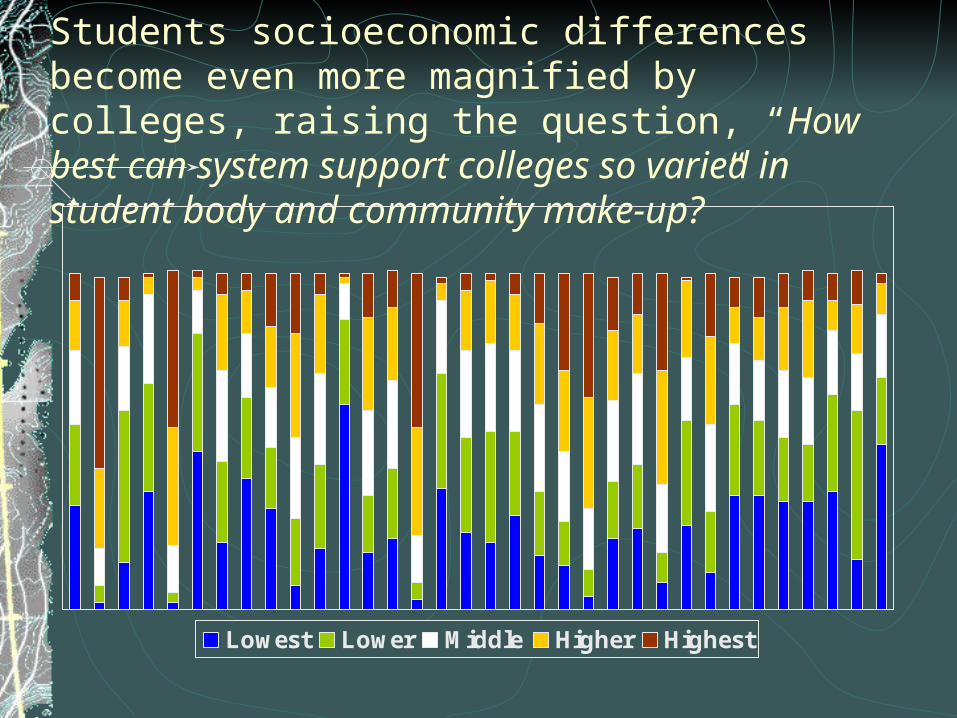
Students socioeconomic differences become even more magnified by colleges, raising the question, “How best can system support colleges so varied in student body and community make-up?”
Lowest Lower Middle Higher Highest
Additional information
For the full research report: Socioeconomic Well-Being of Washington State: Who Attends Community and Technical Colleges (Sept 2006) link to:http://www.sbctc.ctc.edu/data/rsrchrpts/resh_06-4.doc
Data Structure
Relational Database (MS Access)SBCTC Data Warehouse & Census Data tables
Spatial DataGIS
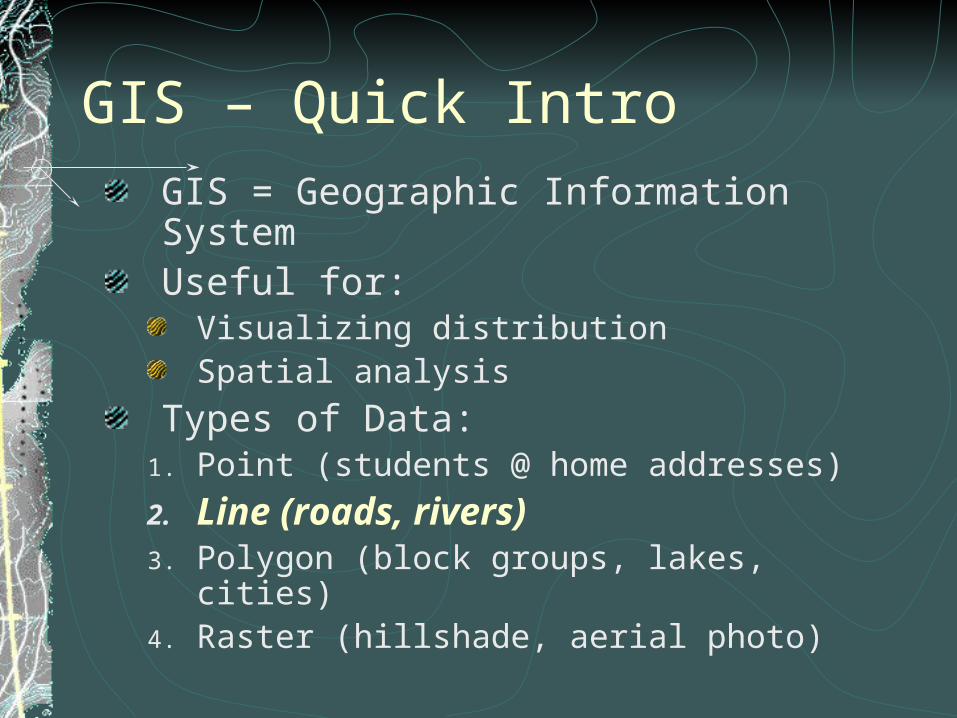
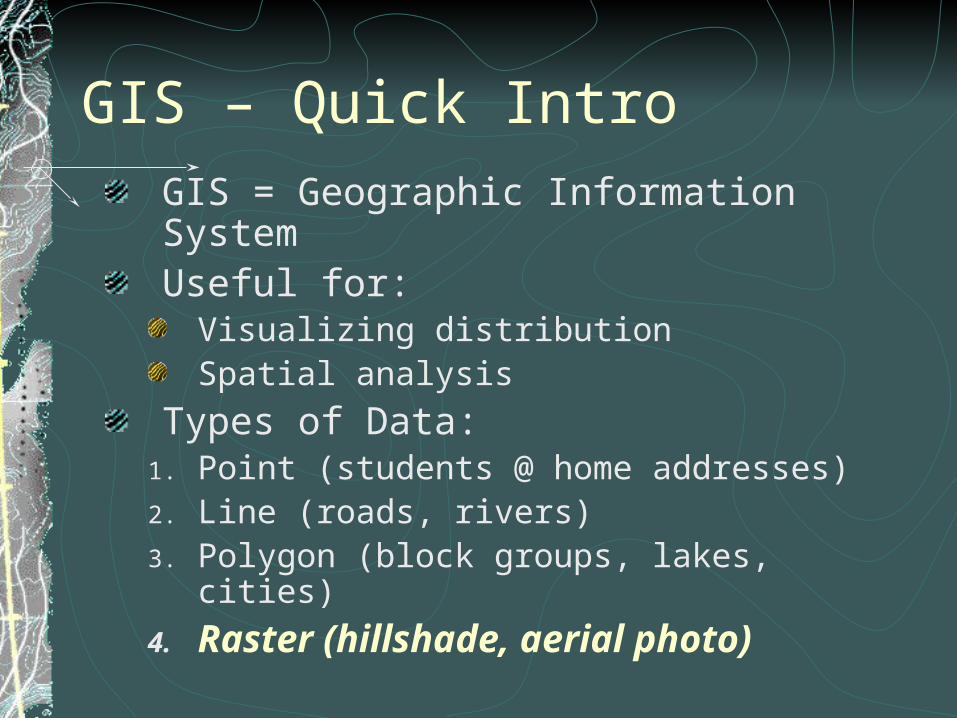
GIS – Quick IntroGIS = Geographic Information SystemUseful for:
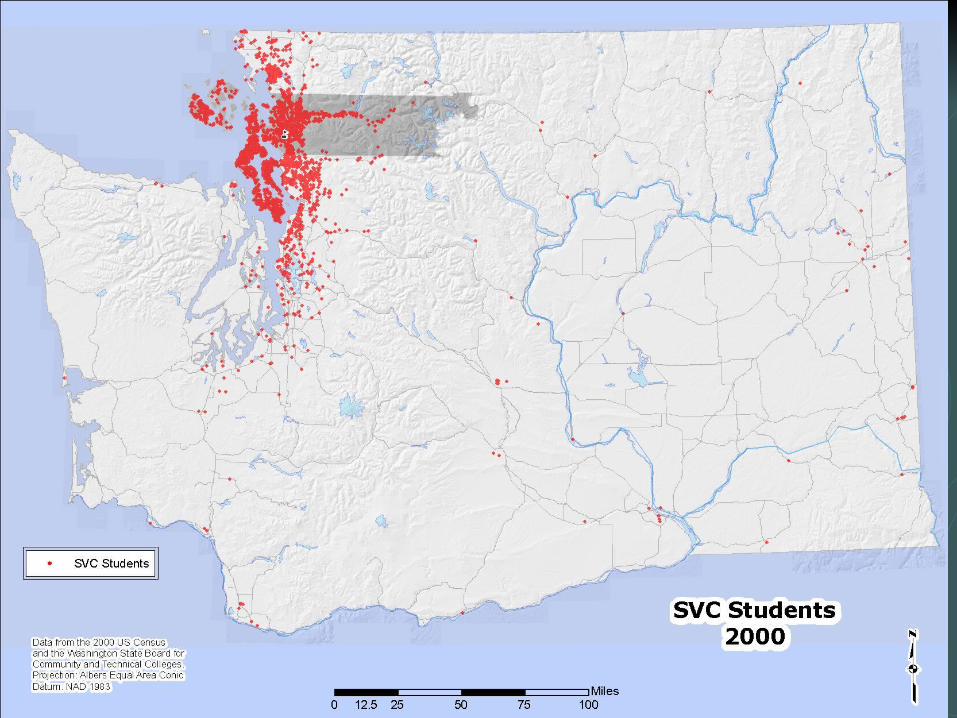
Visualizing distributionSpatial analysis
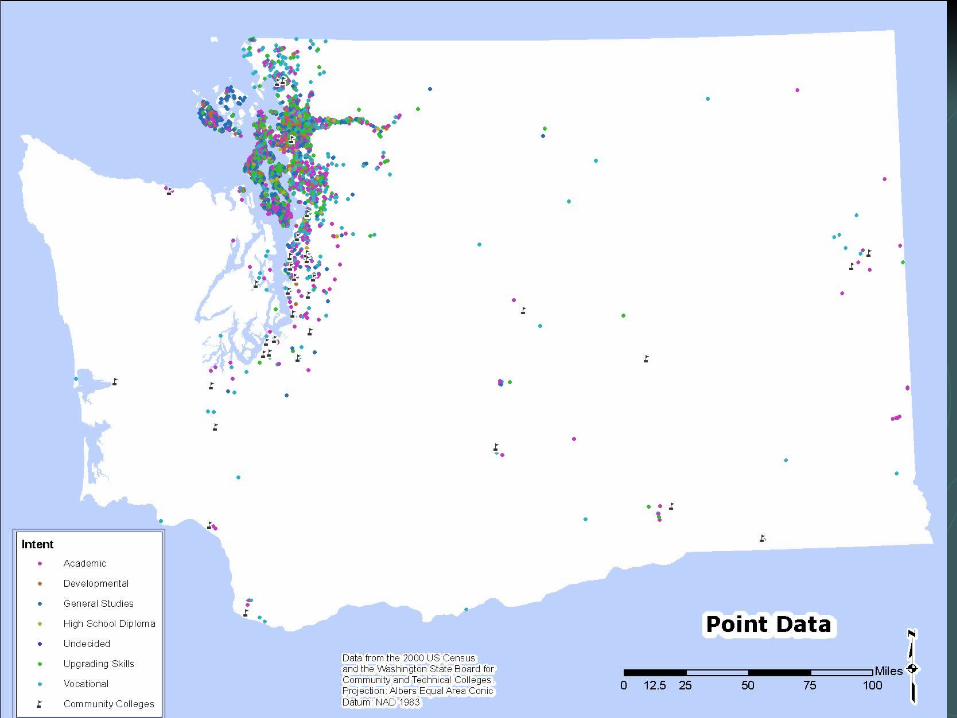
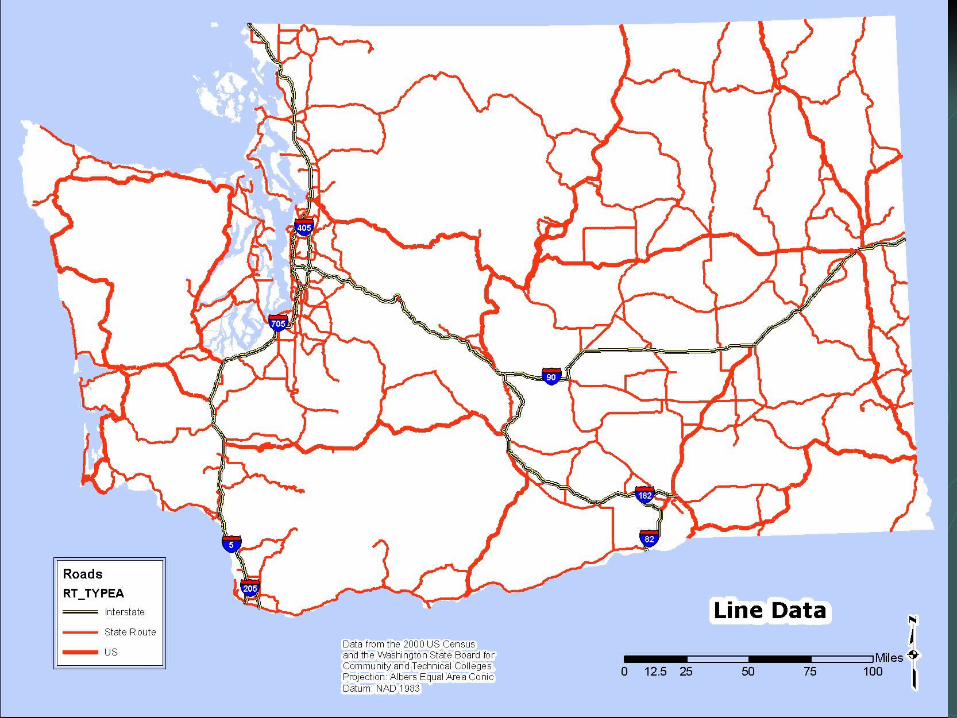
Types of Data:1. Point (students @ home addresses)2. Line (roads, rivers)3. Polygon (block groups, lakes, cities)4. Raster (hillshade, aerial photo)
GIS – Quick IntroGIS = Geographic Information SystemUseful for:
Visualizing distributionSpatial analysis
Types of Data:1. Point (students @ home addresses)2. Line (roads, rivers)3. Polygon (block groups, lakes, cities)4. Raster (hillshade, aerial photo)
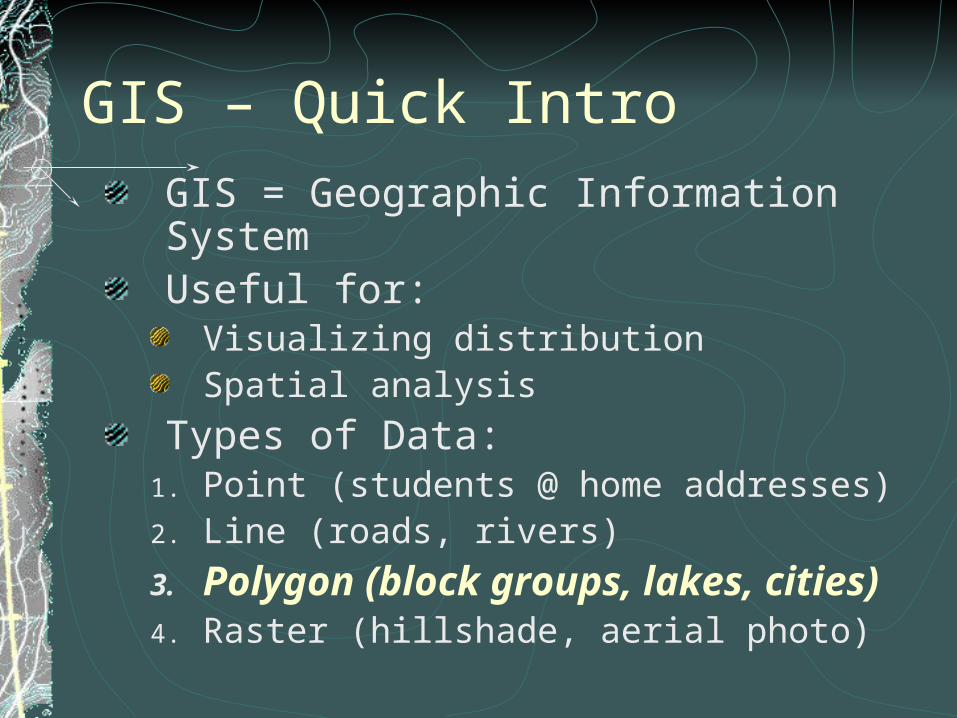
GIS – Quick IntroGIS = Geographic Information SystemUseful for:
Visualizing distributionSpatial analysis
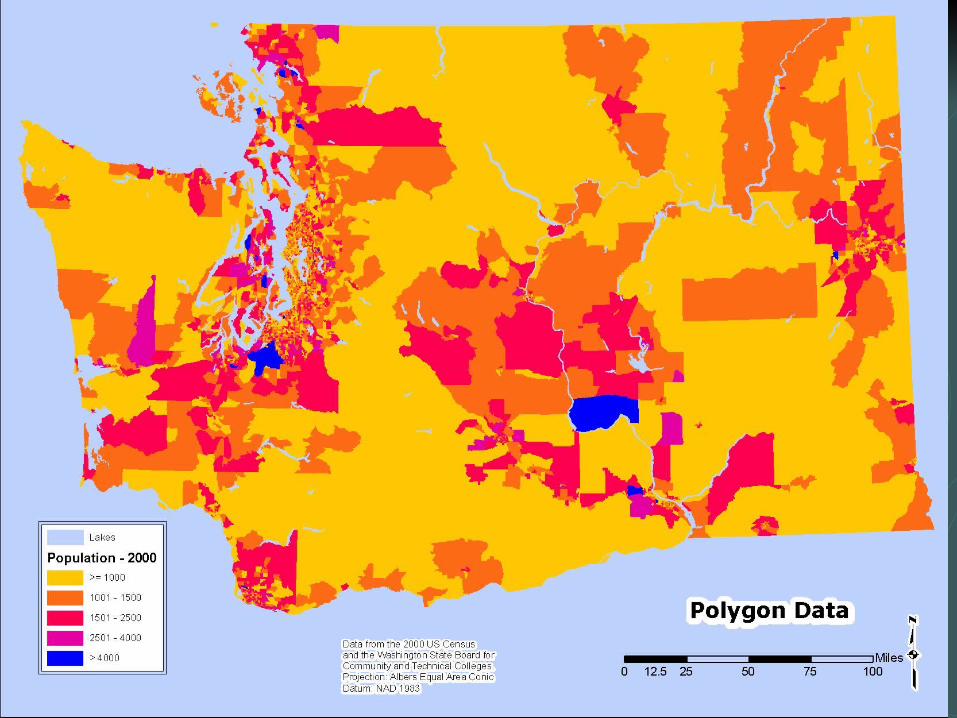
Types of Data:1. Point (students @ home addresses)2. Line (roads, rivers) 3. Polygon (block groups, lakes, cities)4. Raster (hillshade, aerial photo)
GIS – Quick IntroGIS = Geographic Information SystemUseful for:
Visualizing distributionSpatial analysis
Types of Data:1. Point (students @ home addresses)2. Line (roads, rivers)3. Polygon (block groups, lakes, cities)4. Raster (hillshade, aerial photo)
GIS – Quick IntroGIS = Geographic Information SystemUseful for:
Visualizing distributionSpatial analysis
Types of Data:1. Point (students @ home addresses)2. Line (roads, rivers)3. Polygon (block groups, lakes, cities)4. Raster (hillshade, aerial photo)
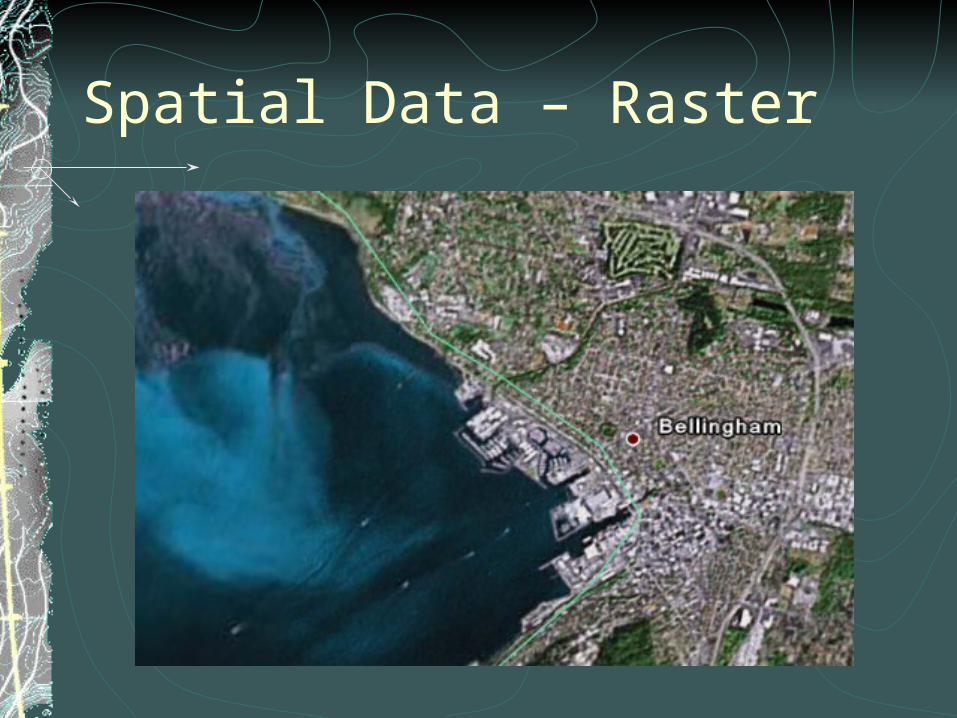
Spatial Data – Raster
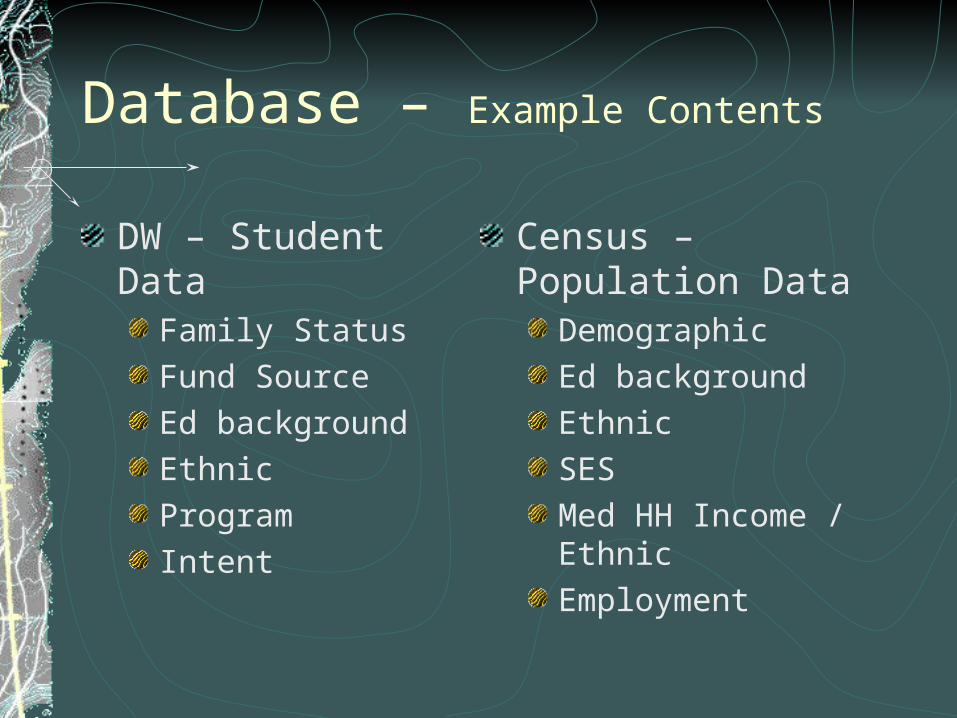
Database – Example Contents
DW – Student DataFamily StatusFund SourceEd backgroundEthnicProgramIntent
Census – Population DataDemographicEd backgroundEthnicSESMed HH Income / EthnicEmployment
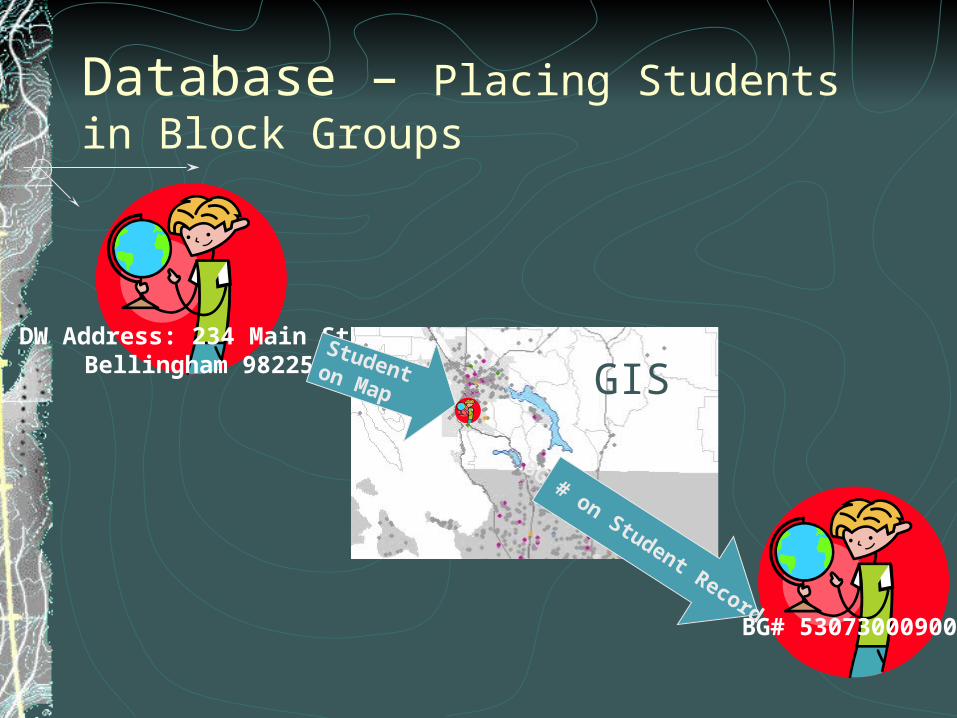
Database – Placing Students in Block Groups
GIS
BG# 530730009003
DW Address: 234 Main St, Bellingham 98225
Student on Map
BG # on Student Record
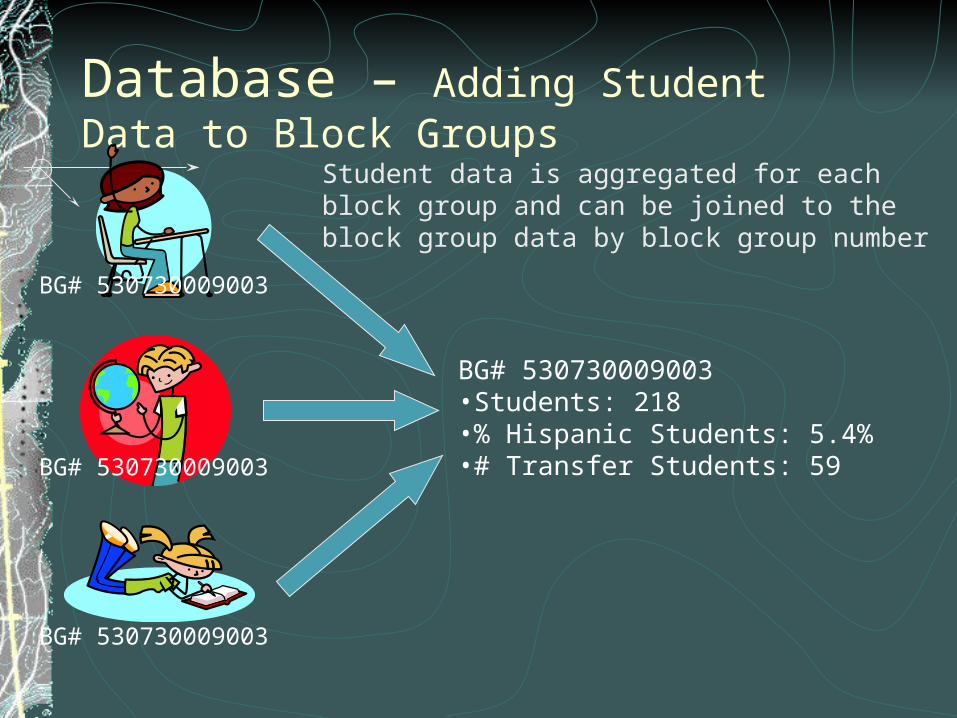
Database – Adding Student Data to Block Groups
BG# 530730009003
BG# 530730009003
BG# 530730009003
Student data is aggregated for each block group and can be joined to the block group data by block group number
BG# 530730009003•Students: 218•% Hispanic Students: 5.4%•# Transfer Students: 59
Applications
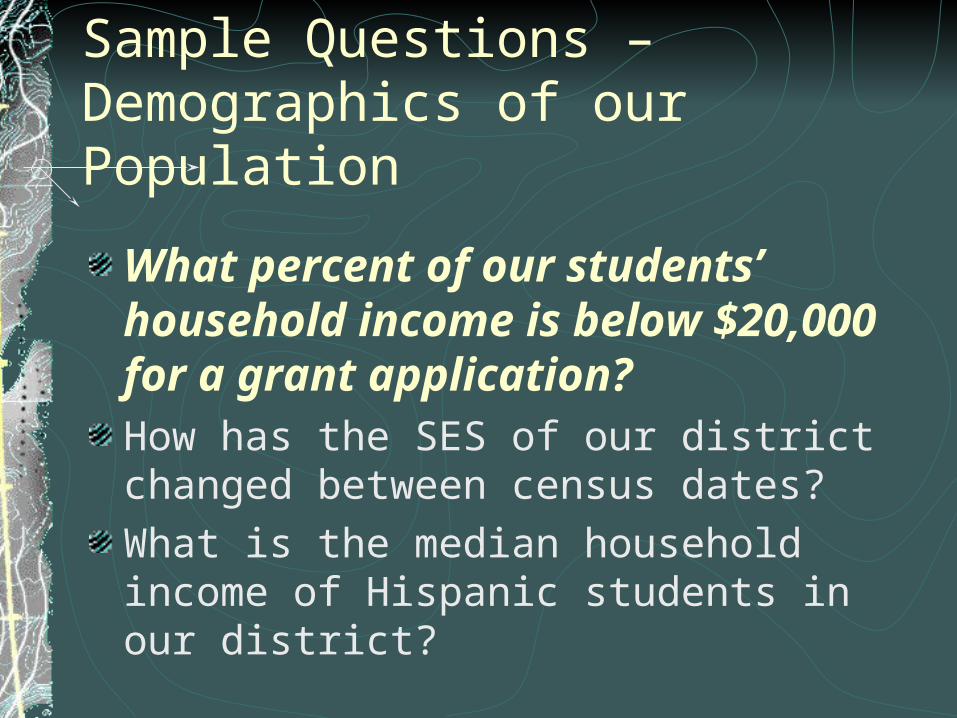
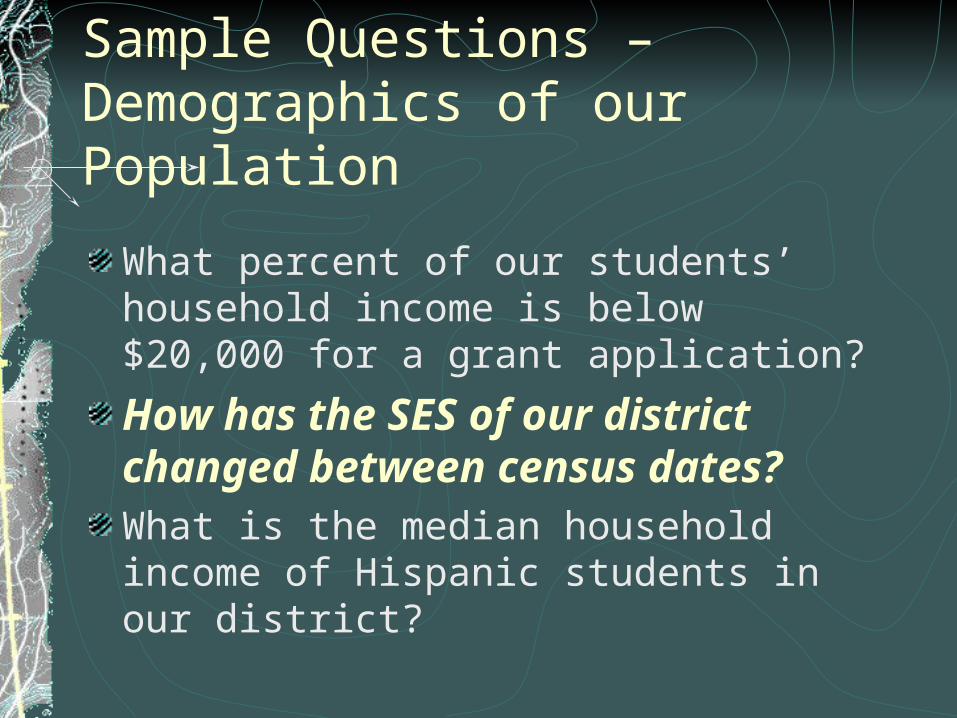
Sample Questions – Demographics of our Population
What percent of our students’ household income is below $20,000 for a grant application?How has the SES of our district changed between census dates?What is the median household income of Hispanic students in our district?
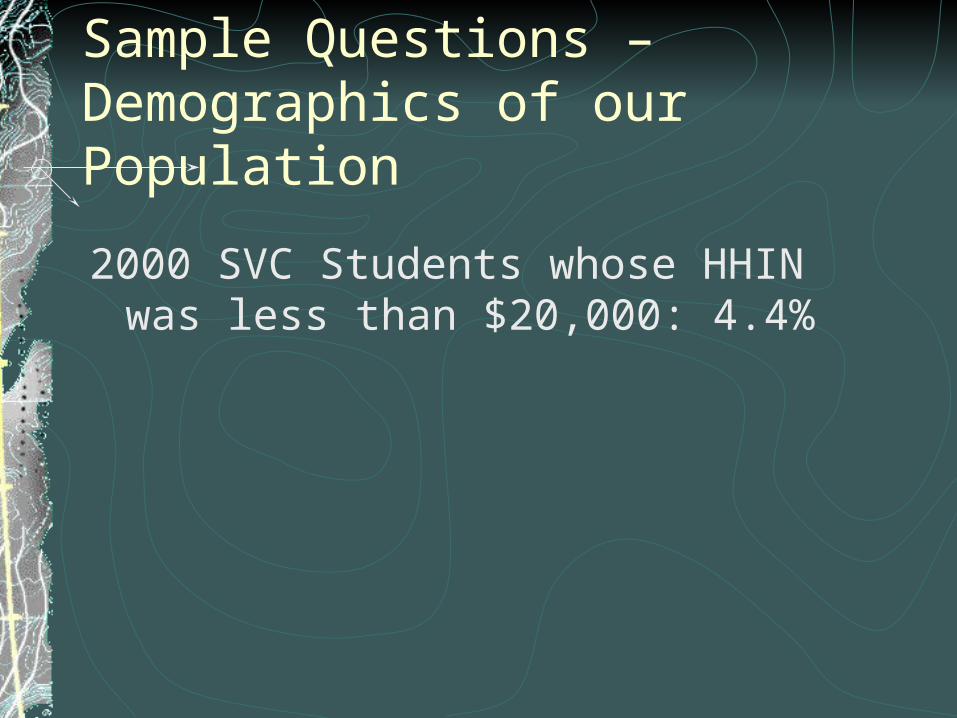
Sample Questions – Demographics of our Population
2000 SVC Students whose HHIN was less than $20,000: 4.4%
Sample Questions – Demographics of our Population
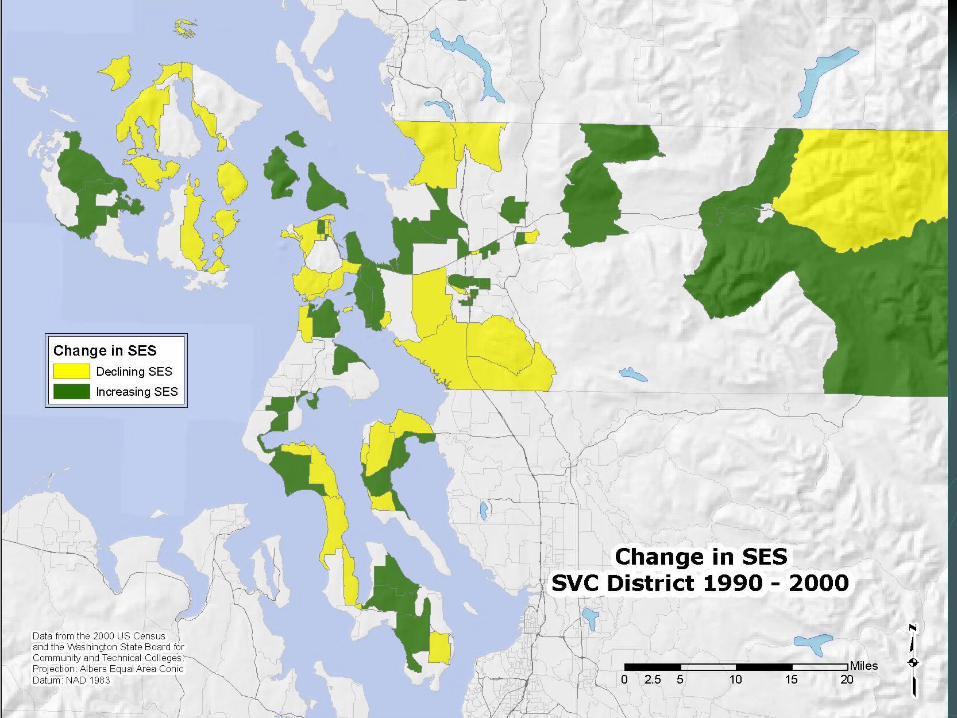
What percent of our students’ household income is below $20,000 for a grant application?
How has the SES of our district changed between census dates?What is the median household income of Hispanic students in our district?
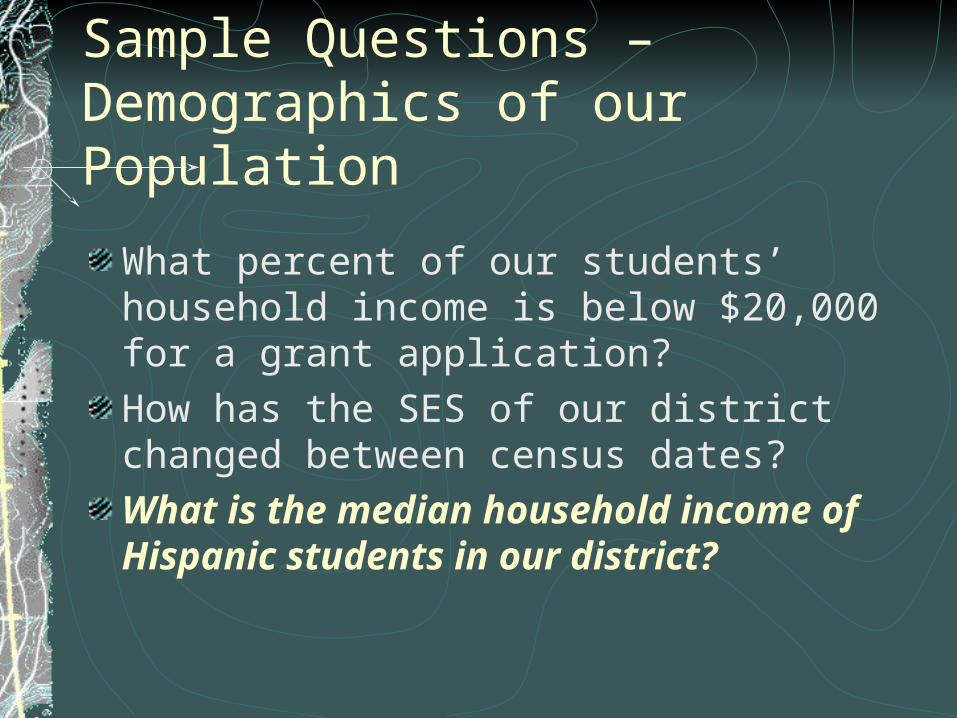
Sample Questions – Demographics of our Population
What percent of our students’ household income is below $20,000 for a grant application?How has the SES of our district changed between census dates?What is the median household income of Hispanic students in our district?
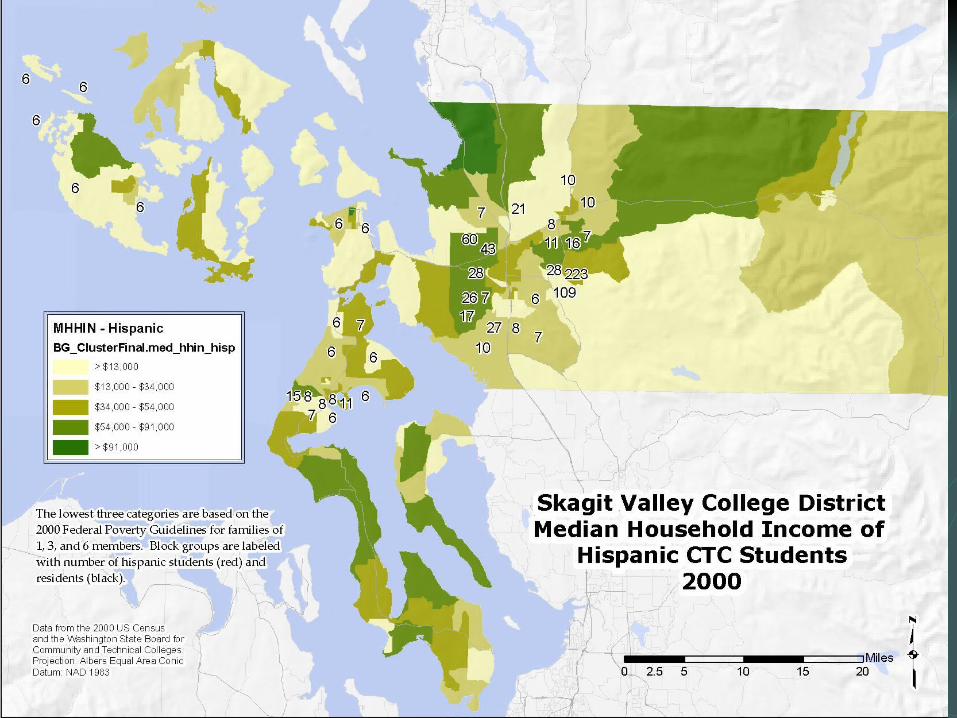
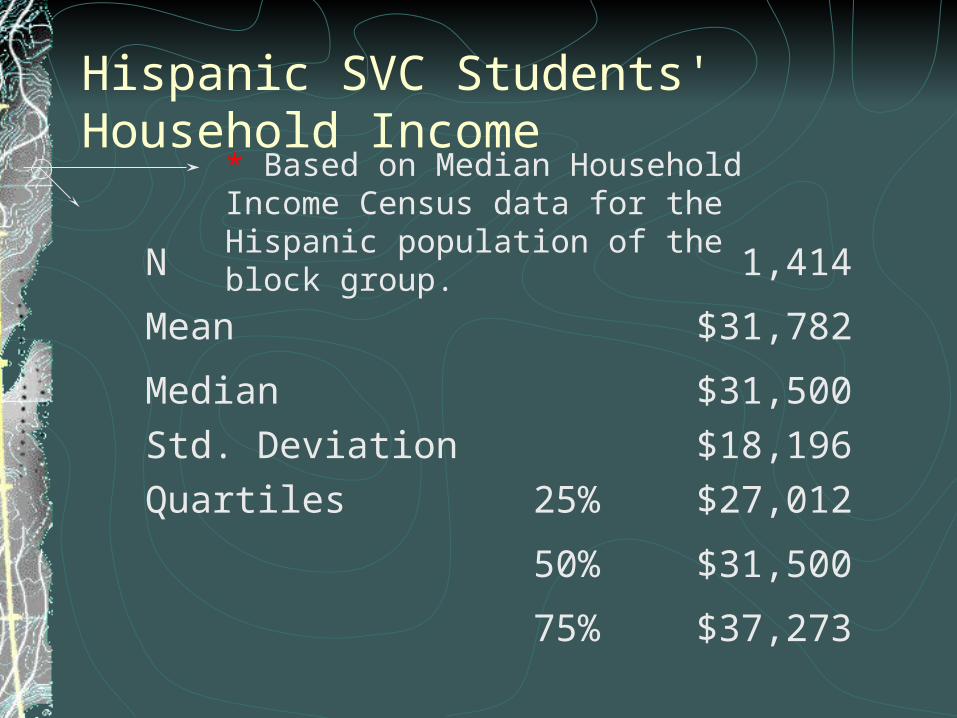
Hispanic SVC Students' Household Income
N 1,414
Mean $31,782
Median $31,500
Std. Deviation $18,196
Quartiles 25% $27,012
50% $31,500
75% $37,273
* Based on Median Household Income Census data for the Hispanic population of the block group.
Sample Questions – Serving Our Minority Population
Where are minority groups concentrated within our district? Where are these groups underrepresented in the student population?Should we extend our ESL program to a remote location?
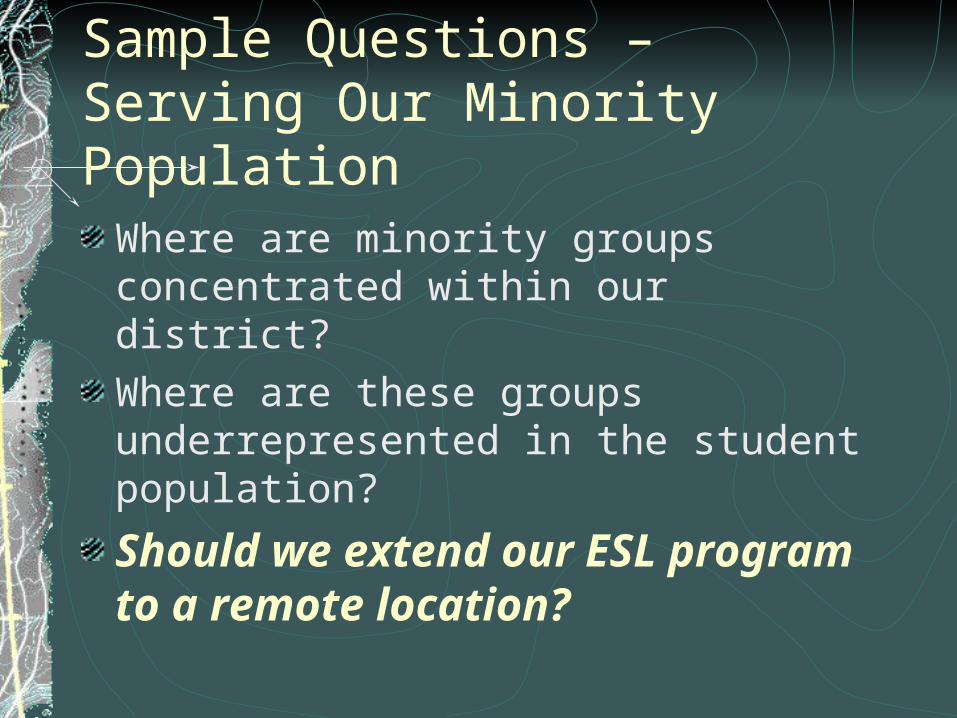
Sample Questions – Serving Our Minority Population
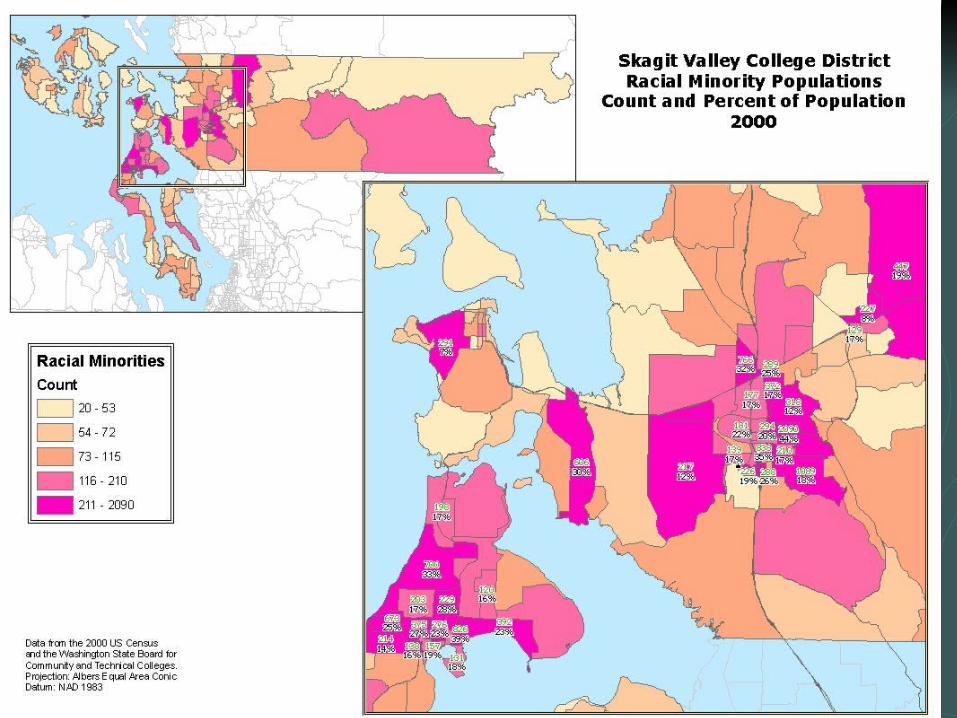
Where are minority groups concentrated within our district?
Where are these groups underrepresented in the student population?Should we extend our ESL program to a remote location?
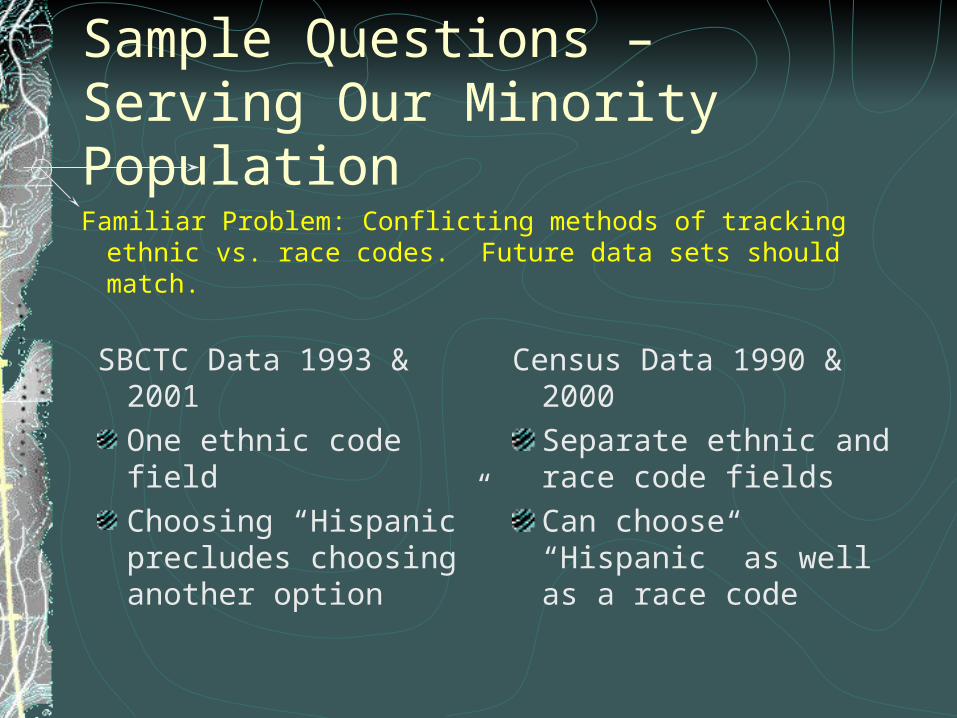
Sample Questions – Serving Our Minority Population
Familiar Problem: Conflicting methods of tracking ethnic vs. race codes. Future data sets should match.
Census Data 1990 & 2000Separate ethnic and race code fieldsCan choose “Hispanic” as well as a race code
SBCTC Data 1993 & 2001One ethnic code fieldChoosing “Hispanic” precludes choosing another option
Sample Questions – Serving Our Minority Population
Where are minority groups concentrated within our district? Where are these groups underrepresented in the student population?
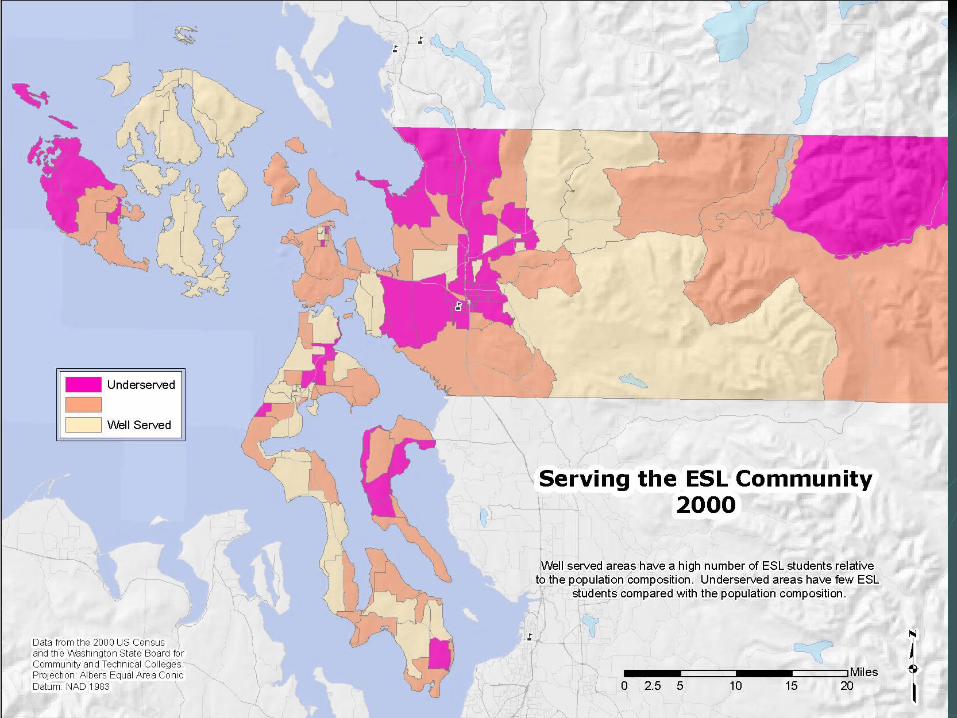
Should we extend our ESL program to a remote location?
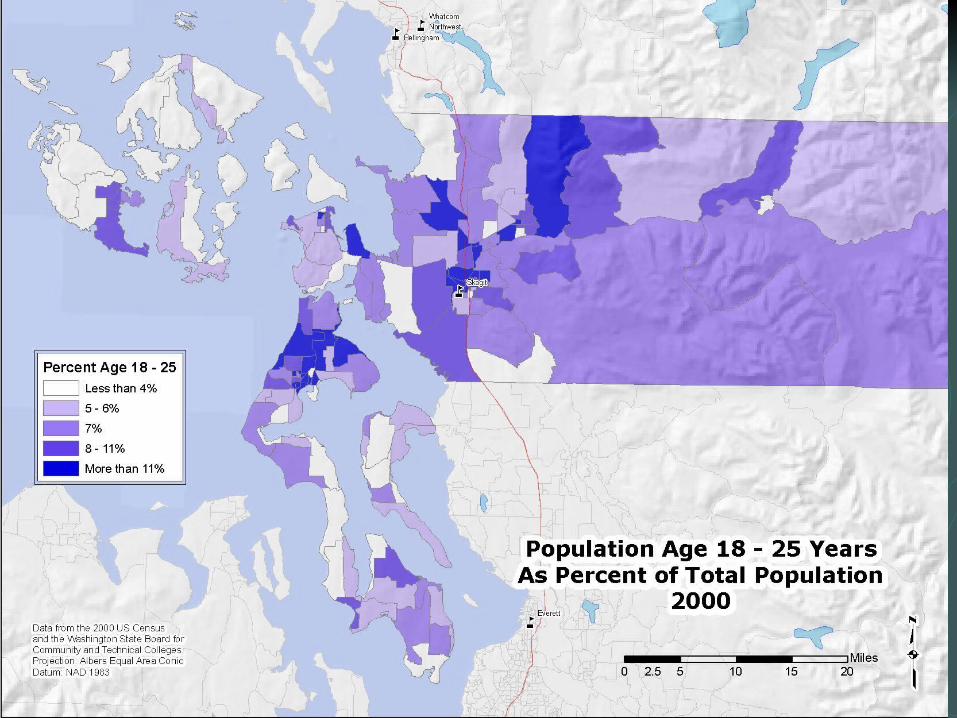
Sample Questions – Improving our Marketing Efforts
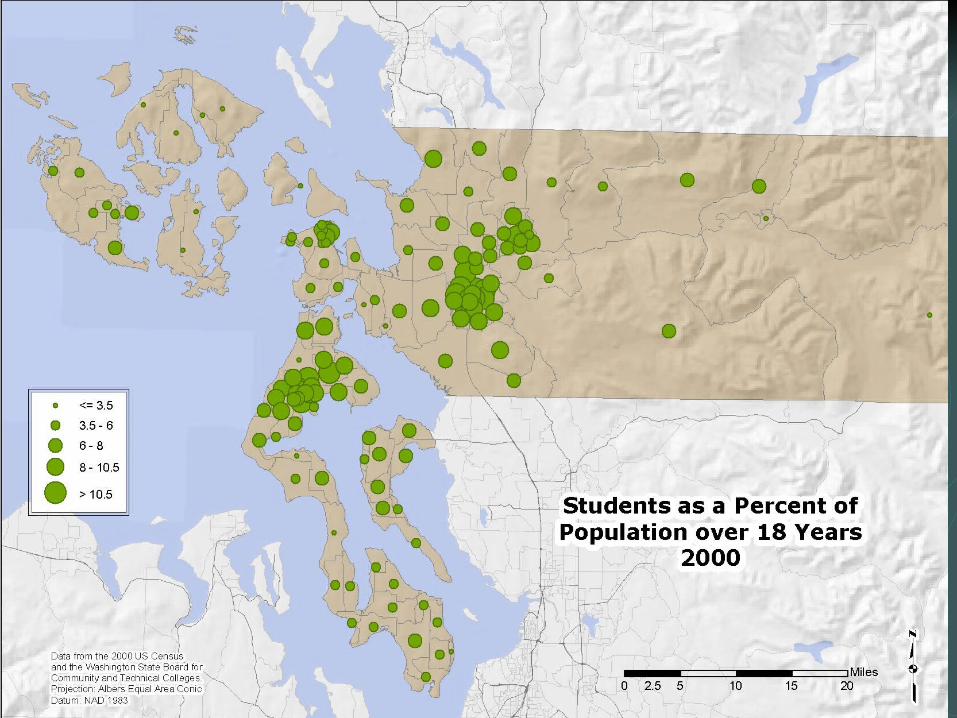
What percent of the population is between 18 and 25 years of age?What is the geographic distribution of the population older than 25 years who have less than an Associate’s Degree?What percent of the population attends a community or technical college?
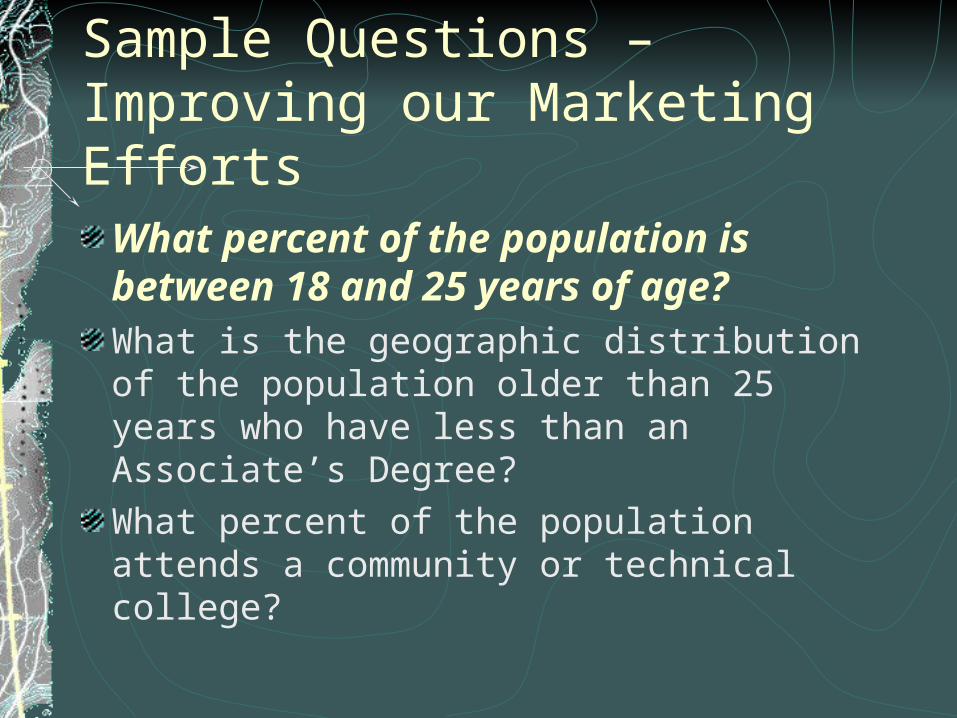
Sample Questions – Improving our Marketing Efforts
What percent of the population is between 18 and 25 years of age?
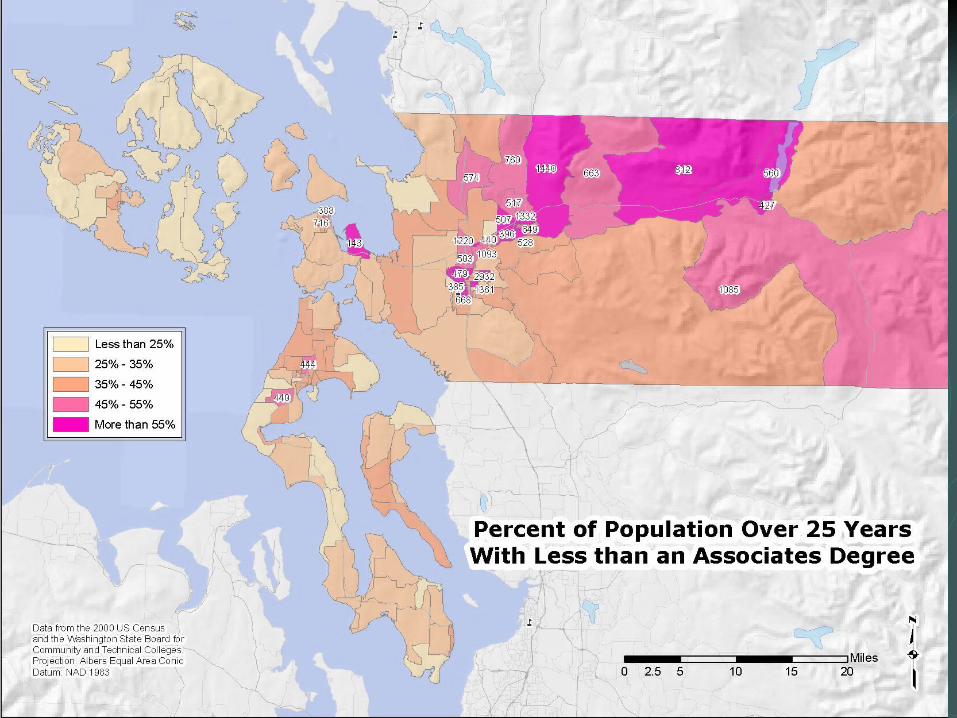
What is the geographic distribution of the population older than 25 years who have less than an Associate’s Degree? What percent of the population attends a community or technical college?
Sample Questions – Improving our Marketing Efforts
What percent of the population is between 18 and 25 years of age?What is the geographic distribution of the population older than 25 years who have less than an Associate’s Degree?
What percent of the population attends a community or technical college?
What will the colleges get?
Access DatabaseStatewide Map ImagesMaps that can be displayed on Google Earth
How can you use this data?
Google EarthFree software (with upgrade options)
http://earth.google.com
View data provided by SBCTC
GIS SoftwareData compatible with ESRI GIS – ArcGISSBCTC ArcGIS license
Google Earth
Interactive mapping product of Google License levels
Free – view data$20 Upgrade – speed, high res printing, annotation$400 Upgrade – more speed, import spreadsheets, measurement tools
View data from this project, provided as *.kml files by SBCTCSee handout “Using Google Earth…” for more
Questions
What questions do you have about the data?What limitations are there for proxy SES and income data?How do you think your college might use this information?