Analyzing and Debugging Designs with System Console · Analyzing and Debugging Designs with System...
42
10 Analyzing and Debugging Designs with System Console 2014.06.30 QII53028 Subscribe Send Feedback About System Console System Console provides visibility into your system. This visibility allows faster debugging and time to market for your FPGA. System Console is both a platform and an application for interacting with the debug-enabled portions of your design. You can perform the following high-level tasks with System Console and tools built on top of System Console: • Perform board bring-up, with both finalized and partially complete designs. • Remote debug from anywhere with internet access. • Automate complex run-time verification solutions through scripting across multiple devices in your system. • Test serial links with point-and-click configuration tuning in the Transceiver Toolkit. • Debug memory interfaces with the External Memory Interface Toolkit. • Integrate your own debug IP into the debugging platform. Related Information System Console Online Training Use Cases for System Console You can leverage System Console for multiple debugging use-cases. You can access tutorials, application notes, and design examples to learn more about debugging with System Console. Related Information • Board Bring-Up with System Console Tutorial on page 10-8 • Debugging Transceiver Links Documentation • External Memory Interface Documentation • Application Note 693: Remote Hardware Debugging over TCP/IP for Altera SoC • Application Note 624: Debugging with System Console over TCP/IP ISO 9001:2008 Registered © 2014 Altera Corporation. All rights reserved. ALTERA, ARRIA, CYCLONE, ENPIRION, MAX, MEGACORE, NIOS, QUARTUS and STRATIX words and logos are trademarks of Altera Corporation and registered in the U.S. Patent and Trademark Office and in other countries. All other words and logos identified as trademarks or service marks are the property of their respective holders as described at www.altera.com/common/legal.html. Altera warrants performance of its semiconductor products to current specifications in accordance with Altera's standard warranty, but reserves the right to make changes to any products and services at any time without notice. Altera assumes no responsibility or liability arising out of the application or use of any information, product, or service described herein except as expressly agreed to in writing by Altera. Altera customers are advised to obtain the latest version of device specifications before relying on any published information and before placing orders for products or services. www.altera.com 101 Innovation Drive, San Jose, CA 95134
Transcript of Analyzing and Debugging Designs with System Console · Analyzing and Debugging Designs with System...

10Analyzing and Debugging Designs with SystemConsole
2014.06.30
QII53028 Subscribe Send Feedback
About System ConsoleSystem Console provides visibility into your system. This visibility allows faster debugging and time tomarket for your FPGA. System Console is both a platform and an application for interacting with thedebug-enabled portions of your design.
You can perform the following high-level tasks with SystemConsole and tools built on top of SystemConsole:
• Perform board bring-up, with both finalized and partially complete designs.• Remote debug from anywhere with internet access.• Automate complex run-time verification solutions through scripting across multiple devices in your
system.• Test serial links with point-and-click configuration tuning in the Transceiver Toolkit.• Debug memory interfaces with the External Memory Interface Toolkit.• Integrate your own debug IP into the debugging platform.
Related InformationSystem Console Online Training
Use Cases for System ConsoleYou can leverage System Console for multiple debugging use-cases. You can access tutorials, applicationnotes, and design examples to learn more about debugging with System Console.
Related Information
• Board Bring-Up with System Console Tutorial on page 10-8
• Debugging Transceiver Links Documentation
• External Memory Interface Documentation
• Application Note 693: Remote Hardware Debugging over TCP/IP for Altera SoC
• Application Note 624: Debugging with System Console over TCP/IP
ISO9001:2008Registered
© 2014 Altera Corporation. All rights reserved. ALTERA, ARRIA, CYCLONE, ENPIRION, MAX, MEGACORE, NIOS, QUARTUS and STRATIX wordsand logos are trademarks of Altera Corporation and registered in the U.S. Patent and Trademark Office and in other countries. All otherwords and logos identified as trademarks or service marks are the property of their respective holders as described atwww.altera.com/common/legal.html. Altera warrants performance of its semiconductor products to current specifications in accordance withAltera's standard warranty, but reserves the right to make changes to any products and services at any time without notice. Altera assumesno responsibility or liability arising out of the application or use of any information, product, or service described herein except as expresslyagreed to in writing by Altera. Altera customers are advised to obtain the latest version of device specifications before relying on any publishedinformation and before placing orders for products or services.
www.altera.com
101 Innovation Drive, San Jose, CA 95134

Using Debug AgentsSystem Console runs on your host computer and communicates with your running design through debugagents. These debug agents are soft-logic added to particular IP cores to enable debug communication withthe host computer. Some debug agents have this single-purpose function, while others such as the Nios IIprocessor with debug enabled, are for both debugging the hardware in your design as well as doing softwaredebug of the code running on the Nios II processor.
By including debugging IP cores in your design, you can make large portions of a design debug-accessible.The IP allows reading of memory and altering peripheral registers from a host computer. For example,adding a JTAG to Avalon Master Bridge instance to a Qsys system enables you to read and write to memory-mapped slaves connected to the bridge. Other types of debug agents are also available.
You can instantiate debug IP cores using the IP Catalog.
The following IP cores in the IP Catalog do not support VHDL simulation generation in the currentversion of the Quartus II software.
• JTAG Debug Link
Note:
• SLD Hub Controller System• USB Debug Link
System Console Flow1. Add required component(s) to Qsys.2. Generate and compile design.3. Connect board and program FPGA.4. Start System Console.5. Locate and open service path.6. Perform desired operation(s) with service.7. Close the service.
Application and InterfacesUse the Tcl scripting language to interact with your running design in both the graphical and command-lineinterface modes. The System Console GUI provides additional panes to make important design informationavailable.
System Console understands the particulars of the communication channel because of design informationembedded in the programmable SRAM Object File (.sof). When System Console launches from the QuartusII software or Qsys while your design is open, any existing programmable file is automatically found andlinked to the detected running device if they are compatible. In more complicated systems, the designs anddevices may need to be linked manually.
Related Information
• API
Analyzing and Debugging Designs with System ConsoleAltera Corporation
Send Feedback
QII53028Using Debug Agents10-2 2014.06.30

• Quartus II Scripting Reference ManualInformation about Tcl scripting support
• Introduction to Tcl Online Training
Starting System ConsoleThere are several different ways to launch System Console.
Starting System Console from Quartus II
• Click Tools > System Debugging Tools > System Console.
Starting System Console from Qsys
• Click Tools > System Console.
Starting System Console from Nios II Command Shell
1. On the Windows Start menu, click All Programs > Altera > Nios II EDS <version> > Nios II <version>Command Shell.
2. Type the following command:
system-console
To get help information, type the command system-console --helpNote:
Customizing StartupYou can customize your System Console environment by adding commands to the system_console_rcconfiguration file. You can locate this file in the following location:
• <$HOME>/system_console/system_console_rc.tcl, the file in this location is known as the user configurationfile, which only affects the owner of that home directory.
You can alternatively specify your own design specific startup configuration file by using the command-lineargument --rc_script=<path_to_script>, when you launch System Console from the Nios II commandshell.
You can use the system_console_rc.tcl file in combination with your custom rc_script.tcl file. In this capacity,the system_console_rc.tcl file performs actions that System Console always needs and the local rc_script.tclfile performs actions for particular experiments.
On startup, System Console automatically runs any Tcl commands in these files. The commands in thesystem_console_rc.tcl file run first, then the commands in the rc_script.tcl file run.
Command-Line ArgumentsThe --cli command-line argument runs System Console in command-line mode.
The --project_dir=<project dir> command-line argument directs System Console to the location ofyour hardware project. Ensure that you are working with the project you intend—the JTAG chain detailsand other information depend on the specific project.
The --script=<your script>.tcl command-line argument directs SystemConsole to run yourTcl script.
Altera CorporationAnalyzing and Debugging Designs with System Console
Send Feedback
10-3Starting System ConsoleQII530282014.06.30

The System Console GUIThe System Console GUI consists of a main window with four separate panes:
• The SystemExplorer pane displays the hierarchy of the System Console virtual file system in your design,including board connections, devices, designs, and scripts.
• The Tools pane displays the Transceiver Toolkit, GDB Server Control Panel, and Bus Analyzer. Clickthe Tools menu to launch the applications.
• TheTclConsole is where the design interactions take place. Common actions are sourcing scripts, writingprocedures, and using the System Console API.
• TheMessages pane displays status, warning, and errormessages regarding connections and debug actions.
Figure 10-1: System Console GUI
Related InformationSystem Console Online Help
System Explorer PaneThe System Explorer pane displays the virtual file system for all connected debugging components. Thisvirtual file system contains the following information:
• The devices folder contains information about each device connected to System Console.
Analyzing and Debugging Designs with System ConsoleAltera Corporation
Send Feedback
QII53028The System Console GUI10-4 2014.06.30

• The scripts folder stores scripts for easy execution.• The connections folder displays information about the board connections which are visible to System
Console, such as USB Blaster. Multiple connections are possible.• The designs folder displays information about Quartus II project designs connected to System Console.
Within the devices folder is a folder for each device currently connected to System Console. Each devicefolder contains a (link) folder and sometimes contains a (files) folder.
The (link) folder shows debug agents (and other hardware) that System Console is able to access. The (files)folder is a copy of the tree under the designs folder for the project that is currently linked to this device.
Figure 10-2: System Explorer Pane
• The figure above shows that under the devices folder there is the EP4SGX230 folder which contains a(link) folder. The (link) folder contains a JTAG folder. The JTAG folder contains folders that describethe debug pipes (i.e. JTAG, USB, Ethernet, etc) and agents that are connected to the EP4SGX230 devicevia a JTAG connection.
• The (files) folder contains information about the design files loaded from the Quartus II project for thedevice.
• Folders that have a context menu available show a small context menu icon. Right-click these folders toview a context menu. For example, the connections folder in Figure 10-2 shows a context menu icon.
• Folders that have informational messages available display a small informational message icon. Hoverover these folders to see the informational message. For example, the scripts folder in Figure 10-2 showsan informational message icon.
• Debug agents that sense the clock and reset state of the target show a informational or error messagewith a clock status icon. The icon indicates whether the clock is running (info, green), stopped (error,red), or running but in reset (error, red). For example, the trace_system_jtag_link.h2t folder in Figure10-2 has a running clock.
Altera CorporationAnalyzing and Debugging Designs with System Console
Send Feedback
10-5System Explorer PaneQII530282014.06.30
Interactive HelpTyping help help into the Tcl Console lists all available commands. Typing help <command name>provides the syntax of commands. System Console provides command completion if you type the beginningletters of a command and then press the Tab key.
ServicesSystem Console services allow you to access different parts of your running design. For example, the masterservice provides access to memory-mapped slave interfaces and the processor service provides access tofine-grained processor controls. The services do not intermix, but a single IP core can provide multipleservices. For example, the Nios II processor contains a debug core. It is a processor and it has amemory-mapped master interface that can connect to slaves. The master service can access thememory-mapped slaves that connect to the Nios II processor. Also, the processor service can be used to dosoftware debugging.
Common ServicesEach common service exposes a separate API. By adding the appropriate debug agent to your design, SystemConsole services can use the associated capabilities in a running design.
Table 10-1: Common Services for System Console
Debug Agent Providing ServiceFunctionService
• Nios II with debug• JTAG to Avalon Master Bridge• USB Debug Master
Access memory-mapped (Avalon-MM orAXI) slaves connected to themaster interface.
master
• Nios II with debug• JTAG to Avalon Master Bridge
Allows the host to access a single slavewithout needing to know the location of theslave in the host's memory map. Any slavethat is accessible to a System Console mastercan provide this service.
slave
Nios II with debug• Start, stop, or step the processor.• Read/write processor registers.
processor
Related Information
• System Console Examples on page 10-8
• API
Locating Available ServicesSystemConsole uses a virtual file system to organize the available services, which is similar to the /dev locationon Linux systems. Board connection, device type, and IP names are all part of a service path. Instances of
Analyzing and Debugging Designs with System ConsoleAltera Corporation
Send Feedback
QII53028Interactive Help10-6 2014.06.30

services are referred to by their unique service path in the file system. You can retrieve service paths for aparticular service with the command get_service_paths <service-type>.
Locating a Service Path Example
#We are interested in master services.set service_type "master"
#Get all the paths as a list.set master_service_paths [get_service_paths $service_type]
#We are interested in the first service in the list.set master_index 0
#The path of the first master.set master_path [lindex $master_service_paths $master_index]
#Or condense the above statements into one statement:set master_path [lindex [get_service_paths master] 0]
System Console commands require service paths to identify the service instance you want to access. Thepaths for different components can change between runs of the tool and between versions. Useget_service_paths to obtain service paths rather than hard coding them into your Tcl scripts.
The string values of service paths change with different releases of the tool, so you should not infer meaningfrom the actual strings within the service path. Use marker_node_info to get information from the path.
System Console automatically discovers most services at startup. System Console automatically scans for allJTAG and USB-based service instances and retrieves their service paths. System Console does not automat-ically discover some services, such as TCP/IP. Use add_service to inform System Console about thoseservices.
Marker_node_info Example
You can also use the marker_node_info command to get information about the discovered services so youcan choose the right one.
foreach m [get_service_paths master] { array set minfo [marker_node_info $m] if {[string match {*myhpath} $minfo(full_hpath)]} { set master_path $m break }}
Opening and Closing ServicesAfter you have a service path to a particular service instance, you can access the service for use.
The claim_service command tells System Console to start using a particular service instance. Theclaim_service command claims a service instance for exclusive use.
Opening a Service Example
set service_type "master"set claim_path [claim_service $service_type $master_path mylib];#Claims service.
You can pass additional arguments to the claim_service command to direct System Console to startaccessing a particular portion of a service instance. For example, if you use the master service to access
Altera CorporationAnalyzing and Debugging Designs with System Console
Send Feedback
10-7Opening and Closing ServicesQII530282014.06.30
memory, then use claim_service to only access the address space between 0x0 and 0x1000. SystemConsolethen allows other users to access other memory ranges, and denies access to the claimed memory range. Theclaim_service command returns a newly created service path that you can use to access your claimedresources.
You can access a service after you open it.When you finish accessing a service instance, use the close_servicecommand to direct System Console to make this resource available to other users.
Closing a Service Example
close_service master $claim_path; #Closes the service.
System Console ExamplesAltera provides examples for performing board bring-up, creating a simple dashboard, and programminga Nios II processor. The System_Console.zip file contains design files for the board bring-up example. TheNios II Ethernet Standard .zip files contain the design files for the Nios II processor example.
The instructions for these examples assume that you are familiar with the Quartus II software, Tclcommands, and Qsys.
Note:
Related InformationOn-Chip Debugging Design Examples WebsiteContains the design files for the example designs that you can download.
Board Bring-Up with System Console TutorialYou can perform low-level hardware debugging ofQsys systemswith SystemConsole. You can debug systemsthat include IP cores instantiated in your Qsys system or perform initial bring-up of your PCB. This boardbring-up tutorial uses a Nios II Embedded Evaluation Kit (NEEK) board and USB cable. If you have adifferent development kit, you need to change the device and pin assignments to match your board and thenrecompile the design.
Related Information
• Use Cases for System Console on page 10-1
• Faster Board Bring-Up with System Console Demo Video
Board Bring-Up Flow1. Set up the board bring-up example.2. Verify clock and reset signals.3. Verify memory and other peripheral interfaces.
Analyzing and Debugging Designs with System ConsoleAltera Corporation
Send Feedback
QII53028System Console Examples10-8 2014.06.30
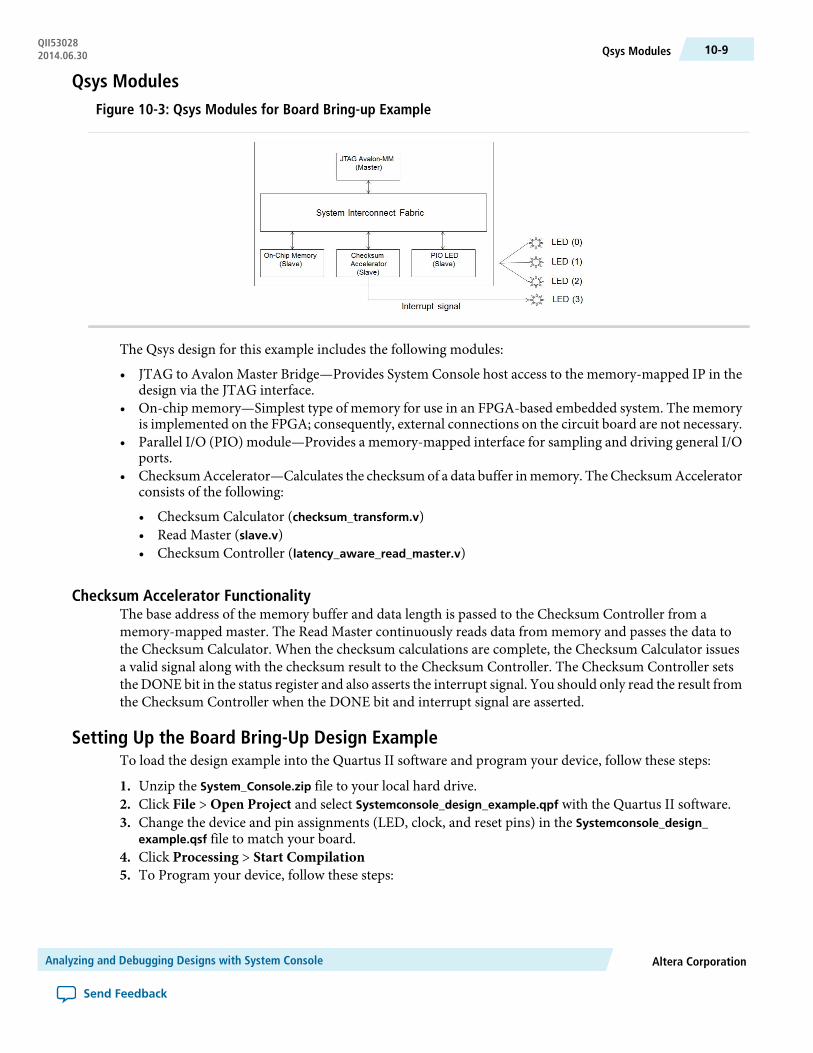
Qsys ModulesFigure 10-3: Qsys Modules for Board Bring-up Example
The Qsys design for this example includes the following modules:
• JTAG to Avalon Master Bridge—Provides System Console host access to the memory-mapped IP in thedesign via the JTAG interface.
• On-chip memory—Simplest type of memory for use in an FPGA-based embedded system. The memoryis implemented on the FPGA; consequently, external connections on the circuit board are not necessary.
• Parallel I/O (PIO) module—Provides a memory-mapped interface for sampling and driving general I/Oports.
• ChecksumAccelerator—Calculates the checksumof a data buffer inmemory. TheChecksumAcceleratorconsists of the following:
• Checksum Calculator (checksum_transform.v)• Read Master (slave.v)• Checksum Controller (latency_aware_read_master.v)
Checksum Accelerator FunctionalityThe base address of the memory buffer and data length is passed to the Checksum Controller from amemory-mapped master. The Read Master continuously reads data from memory and passes the data tothe Checksum Calculator. When the checksum calculations are complete, the Checksum Calculator issuesa valid signal along with the checksum result to the Checksum Controller. The Checksum Controller setsthe DONE bit in the status register and also asserts the interrupt signal. You should only read the result fromthe Checksum Controller when the DONE bit and interrupt signal are asserted.
Setting Up the Board Bring-Up Design ExampleTo load the design example into the Quartus II software and program your device, follow these steps:
1. Unzip the System_Console.zip file to your local hard drive.2. Click File > Open Project and select Systemconsole_design_example.qpf with the Quartus II software.3. Change the device and pin assignments (LED, clock, and reset pins) in the Systemconsole_design_
example.qsf file to match your board.4. Click Processing > Start Compilation5. To Program your device, follow these steps:
Altera CorporationAnalyzing and Debugging Designs with System Console
Send Feedback
10-9Qsys ModulesQII530282014.06.30

Click Tools >Programmer.a.b. Click Hardware Setup.c. Click the Hardware Settings tab.d. Under Currently selected hardware, click USB-Blaster, and click Close.
If you do not see the USB-Blaster option, then your device was not detected. Verify that theUSB-Blaster driver is installed, your board is powered on, and the USB cable is intact.
Note:
This design example has been validated using a USB-Blaster cable. If you do not have a USB-Blastercable and you are using a different cable type, then select your cable from the Currently selectedhardware options.
e. Click Auto Detect, and then select your device.f. Double-click your device under File.g. Browse to your project folder and click Systemconsole_design_example.sof in the subdirectory
output_files.h. Turn on the Program/Configure option.i. Click Start.j. Close the Programmer.
6. Click Tools > System Debugging Tools > System Console.
Related InformationSystem_Console.zip fileContains the design files for this tutorial.
Verifying Clock and Reset SignalsYou can use the SystemExplorer pane to verify clock and reset signals. Open the appropriate node and checkfor either a green clock icon or a red clock icon.
Related InformationSystem Explorer Pane on page 10-4
Verifying Memory and Other Peripheral InterfacesThe Avalon-MM service accesses memory-mapped slaves via a suitable Avalon-MM master, which can becontrolled by the host. You can use Tcl commands to read andwrite tomemorywith amaster service.Masterservices are provided by System Console master components such as the JTAG Avalon master.
Locating and Opening the Master Service
#Select the master service type and check for available service paths.set service_paths [get_service_paths master]
#Set the master service path.set master_service_path [lindex $service_paths 0]
#Open the master service.set claim_path [claim_service master $master_service_path mylib]
Avalon-MM SlavesThe Address Map tab shows the address range for every Qsys component. The Avalon-MM mastercommunicates with slaves using these addresses.
Analyzing and Debugging Designs with System ConsoleAltera Corporation
Send Feedback
QII53028Verifying Clock and Reset Signals10-10 2014.06.30

The register maps for all Altera components are in their respective Data Sheets.
Figure 10-4: Address Map
Related InformationData Sheets Website
Testing the PIO componentIn this example design, the PIO connects to the LEDs of the board. Test if this component is operatingproperly and the LEDs are connected, by driving the outputs with the Avalon-MM master.
Figure 10-5: Register Map for the PIO Core
#Write the driver output values for the Parallel I/O component.set offset 0x0; #Register address offset.set value 0x7; #Only set bits 0, 1, and 2.master_write_8 $claim_path $offset $value
#Read back the register value.set offset 0x0set count 0x1master_read_8 $claim_path $offset $count
master_write_8 $claim_path 0x0 0x2; #Only set bit 1.
master_write_8 $claim_path 0x0 0xe; #Only set bits 1, 2, 3.
master_write_8 $claim_path 0x0 0x7; #Only set bits 0, 1, 2.
#Observe the LEDs turn on and off as you execute these Tcl commands.#The LED is on if the register value is zero and off if the register value is one.
Altera CorporationAnalyzing and Debugging Designs with System Console
Send Feedback
10-11Testing the PIO componentQII530282014.06.30

#LED 0, LED 1, and LED 2 connect to the PIO.#LED 3 connects to the interrupt signal of the CheckSum Accelerator.
Testing On-chip MemoryTest the memory with a recursive function that writes to incrementing memory addresses.
#Load the design example utility procedures for writing to memory.source set_memory_values.tcl
#Write to the on-chip memory.set base_address 0x80set write_length 0x80set value 0x5a5a5a5afill_memory $claim_path $base_address $write_length $value
#Verify the memory was written correctly.#This utility proc returns 0 if the memory range is not uniform with this value.verify_memory $claim_path $base_address $write_length $value
#Check that the memory is re-initialized when reset.#Trigger reset then observe verify_memory returns 0.set jtag_debug_path [lindex [get_service_paths jtag_debug] 0]set claim_jtag_debug_path [claim_service jtag_debug $jtag_debug_path mylib]jtag_debug_reset_system $claim_jtag_debug_path; #Reset the connected on-chip memory#peripheral.close_service jtag_debug $claim_jtag_debug_pathverify_memory $claim_path $base_address $write_length $value
#The on-chip memory component was parameterized to re-initialized to 0 on reset.#Check the actual value.master_read_8 $claim_path 0x0 0x1
Testing the Checksum AcceleratorThe Checksum Accelerator calculates the checksum of a data buffer in memory. It calculates the value fora specified memory buffer, sets the DONE bit in the status register, and asserts the interrupt signal. Youshould only read the result from the controller when both the DONE bit and the interrupt signal are asserted.The host should assert the interrupt enable control bit in order to check the interrupt signal.
Figure 10-6: Register Map for Checksum Component
Analyzing and Debugging Designs with System ConsoleAltera Corporation
Send Feedback
QII53028Testing On-chip Memory10-12 2014.06.30

1. #Pass the base address of the memory buffer Checksum Accelerator.set base_address 0x20set offset 4set address_reg [expr {$base_address + $offset}]set memory_address 0x80master_write_32 $claim_path $address_reg $memory_address
#Pass the memory buffer to the Checksum Accelerator.set length_reg [expr {$base_address + 12}]set length 0x20master_write_32 $claim_path $length_reg $length
#Write clear to status and control registers.#Status register:set status_reg $base_addressmaster_write_32 $claim_path $status_reg 0x0#Control register:set clear 0x1set control_reg [expr {$base_address + 24}]master_write_32 $claim_path $control_reg $clear
#Write GO to the control register.set go 0x8master_write_32 $claim_path $control_reg $go
#Cross check if the checksum DONE bit is set.master_read_32 $claim_path $status_reg 0x1
#Is the DONE bit set?#If yes, check the result and you are finished with the board bring-up design example.set result_reg [expr {$base_address + 28}]master_read_16 $claim_path $result_reg 0x1
2. If the result is zero and the JTAG chain works properly, the clock and reset signals work properly, andthe memory works properly, then the problem is the Checksum Accelerator component.
#Confirm if the DONE bit in the status register (bit 0)#and interrupt signal are asserted.#Status register:master_read_32 $claim_path $status_reg 0x1#Check DONE bit should return a one.
#Enable interrupt and go:set interrupt_and_go 0x18master_write_32 $claim_path $control_reg $interrupt_and_go
3. Check the Control Enable to see the interrupt signal. LED 3 (MSB) should be off. This indicates theinterrupt signal is asserted.
4. You have narrrowed down the problem to the data path. View the RTL to check the data path.5. Open the Checksum_transform.v file from your project folder.
• <unzip dir>/System_Console/ip/checksum_accelerator/checksum_accelerator.v
6. Notice that the data_out signal is grounded in Figure 10-7 (uncommented line 87 and comment line88). Fix the problem.
7. Save the file and regenerate the Qsys system.8. Re-compile the design and reprogram your device.9. Redo the above steps, starting with Verifying Memory and Other Peripheral Interfaces on page 10-10
or run the Tcl script included with this design example.
source set_memory_and_run_checksum.tcl
Altera CorporationAnalyzing and Debugging Designs with System Console
Send Feedback
10-13Testing the Checksum AcceleratorQII530282014.06.30

Figure 10-7: Checksum.v File
Dashboard ServiceThe dashboard service enables you to construct GUIs for visualizing and interacting with debug data. Thedashboard service provides graphical widgets such as buttons and text fields. The dashboard is a graphicalpane for the layout of your widgets. Widgets can be set with data retrieved through other System Consoleservices. Similarly, widgets can leverage user input to act on debug logic in your design through services.
Properties
Widget properties can set information into the user interface and get information from the user interface.Widgets have properties specific to their type. For example, the button property onClick performs an actionwhen the button is clicked. A label widget does not have the same property because it does not perform anaction when clicked. However, both the button and label widgets have the text property for the string theydisplay.
Layout
The dashboard service creates a widget hierarchy where the dashboard is at the top-level. The dashboardservice can implement group-type widgets that contain child widgets. Layout properties dictate layoutperformed by a parent on its children.
An example layout property is expandableX: if true, the widget expands horizontally to encompass all thespace available to it. Another property is visible: a widget is only laid out when this property is true.
User Input
Some of the available widgets allow user interaction. For example, the textFieldwidget is a box that allowsyou to type text. For this widget, the contents of the box are accessible through the text property. A Tclscript can either get or set the contents of the field by accessing this property.
Callbacks
Somewidgets can performuser-specified actions, referred to as callbacks, upon certain events. The textFieldwidget has the onChange property, which is called anytime the text contents have changed. The buttonwidget has the onClick property, which is called when the button is clicked. These callbacks may updatewidgets or interact with services based on the contents of the text field or the state of any other widget.
Related InformationDashboard Commands on page 10-30
Analyzing and Debugging Designs with System ConsoleAltera Corporation
Send Feedback
QII53028Dashboard Service10-14 2014.06.30
Dashboard Example
Adding the Service
The dashboard is not initialized by default. You must add the service before it can be used.
set dash [add_service dashboard dashboard_example "Dashboard Example" "Tools/Example"]
Showing the Dashboard
Once instantiated, you must explicitly make the dashboard visible. Use the dashboard_set_propertycommand to modify the visible property of the root dashboard:
dashboard_set_property $dash self visible true
In this command, $dash represents the dashboard service. self is the name of the root dashboard widget.visible is the property being set. true is the value to set. Executed as a single command, it causes the rootdashboard to be made visible.
Adding Widgets
Use the dashboard_add command to add widgets:
set name "my_label"set widget_type "label"set parent "self"dashboard_add $dash $name $widget_type $parent
The following commands add a label widget named "my_label" to the root dashboard. In the GUI, it appearsas the text "label." Change the text:
set content "Text to display goes here"dashboard_set_property $dash $name text $content
This command sets the text property to that string. In the GUI, the displayed text changes to the new value.Add one more label:
dashboard_add $dash my_label_2 label selfdashboard_set_property $dash my_label_2 text "Another label"
Notice the new label appears to the right of the first label. Cause the layout to put the label below instead:
dashboard_set_property $dash self itemsPerRow 1
Gathering Input
Incorporate user input into our dashboard:
set name "my_text_field"set widget_type "textField"set parent "self"dashboard_add $dash $name $widget_type $parent
Altera CorporationAnalyzing and Debugging Designs with System Console
Send Feedback
10-15Dashboard ExampleQII530282014.06.30
The widget appears, but it is very small. Make the widget fill the horizontal space:
dashboard_set_property $dash my_text_field expandableX true
Now the text field is fully visible. Text can be typed into it once clicked. Type a sentence. Now, retrieve thecontents of the field:
set content [dashboard_get_property $dash my_text_field text]puts $content
This prints the contents into the console.
Updating Widgets Upon User Events
The dashboard is significantly more useful when actions are performed without having to interactively typeTcl. Use callbacks to accomplish this. Start by defining a procedure that updates the first label with the textfield contents:
proc update_my_label_with_my_text_field {dash} { set content [dashboard_get_property $dash my_text_field text] dashboard_set_property $dash my_label text $content}
Run the update_my_label_with_my_text_field $dash command in the Tcl Console. Notice that the firstlabel nowmatches the text field contents.Have theupdate_my_label_with_my_text_field $dash commandcalled whenever the text field changes:
dashboard_set_property $dash my_text_field onChange "update_my_label_with_my_text_field $dash"
The onChange property is executed each time the text field changes. The effect is the first field changes tomatch what is typed.
Buttons
Buttons can also be used to trigger actions. Create a button that changes the second label:
proc append_to_my_label_2 {dash suffix} { set old_text [dashboard_get_property $dash my_label_2 text] set new_text "${old_text}${suffix}" dashboard_set_property $dash my_label_2 text $new_text}set text_to_append ", and more"dashboard_add $dash my_button button selfdashboard_set_property $dash my_button onClick [list append_to_my_label_2 $dash \$text_to_append]
When the button is clicked, the second label has some text appended to it.
Groups
The property itemsPerRow dictates how widgets are laid out in a group. For more complicated layouts wherethe number of widgets per row is different per row, nested groups should be used. Add a new group withmore widgets per row:
dashboard_add $dash my_inner_group group selfdashboard_set_property $dash my_inner_group itemsPerRow 2dashboard_add $dash inner_button_1 button my_inner_groupdashboard_add $dash inner_button_2 button my_inner_group
Analyzing and Debugging Designs with System ConsoleAltera Corporation
Send Feedback
QII53028Dashboard Example10-16 2014.06.30

There is now a row with a group of two buttons. The border with the group name can be removed to makethe nested group more seamless.
dashboard_set_property $dash inner_group title ""
The title property can be set to any other string to have the border and title text show up.
Tabs
GUIs do not require all the widgets to be visible at the same time. Tabs accomplish this.
dashboard_add $dash my_tabs tabbedGroup selfdashboard_set_property $dash my_tabs expandableX truedashboard_add $dash my_tab_1 group my_tabsdashboard_add $dash my_tab_2 group my_tabsdashboard_add $dash tabbed_label_1 label my_tab_1dashboard_add $dash tabbed_label_2 label my_tab_2dashboard_set_property $dash tabbed_label_1 text "in the first tab"dashboard_set_property $dash tabbed_label_2 text "in the second tab"
This adds a set of two tabs, each with a group containing a label. Clicking on the tabs changes the displayedgroup/label.
Nios II Processor ExampleThis example programs the Nios II processor on your board to run the count binary software exampleincluded in the Nios II installation. This is a simple program that uses an 8-bit variable to repeatedly countfrom 0x00 to 0xFF. The output of this variable is displayed on the LEDs on your board. After programmingthe Nios II processor, you use System Console processor commands to start and stop the processor.
To run this example, perform the following steps:
1. Download the Nios II Ethernet Standard Design Example for your board from the Altera website.2. Create a folder to extract the design. For this example, use C:\Count_binary.3. Unzip the Nios II Ethernet Standard Design Example into C:\Count_binary.4. In a Nios II command shell, change to the directory of your new project.5. Program your board. In a Nios II command shell, type the following:
nios2-configure-sof niosii_ethernet_standard_<board_version>.sof
6. Using Nios II Software Build Tools for Eclipse, create a new Nios II Application and BSP from Templateusing the Count Binary template and targeting the Nios II Ethernet Standard Design Example.
7. To build the executable and linkable format (ELF) file (.elf) for this application, right-click the CountBinary project and select Build Project.
8. Download the .elf file to your board by right-clicking Count Binary project and selecting Run As, NiosII Hardware.
• The LEDs on your board provide a new light show.
9. Type the following:
system-console; #Start System Console.
#Set the processor service path to the Nios II processor.set niosii_proc [lindex [get_service_paths processor] 0]
Altera CorporationAnalyzing and Debugging Designs with System Console
Send Feedback
10-17Nios II Processor ExampleQII530282014.06.30
set claimed_proc [claim_service processor $niosii_proc mylib]; #Open the service.
processor_stop $claimed_proc; #Stop the processor.#The LEDs on your board freeze.
processor_run $claimed_proc; #Start the processor.#The LEDs on your board resume their previous activity.
processor_stop $claimed_proc; #Stop the processor.
close_service processor $claimed_proc; #Close the service.
• The processor_step, processor_set_register, and processor_get_register commands provideadditional control over the Nios II processor.
Related Information
• Processor Commands on page 10-39
• Nios II Ethernet Standard Design Example
• Nios II Software Build Tools User Guide
Additional Services
Design ServiceYou can use design service commands to work with Quartus II design information.
Load
When you open SystemConsole fromQuartus II orQsys, the current project's debug information is sourcedautomatically if the .sof has been built. In other situations, you can load manually.
set sof_path [file join project_dir output_files project_name.sof]set design [design_load $sof_path]
System Console is now aware that this particular .sof has been loaded.
Linking
Once a .sof is loaded, System Console automatically links design information to the connected device. Theresultant link persists and you can choose to unlink or reuse the link on an equivalent device with the same.sof.
You can perform manual linking.
set device_index 0; # Device index for our targetset device [lindex [get_service_paths device] $device_index]design_link $design $device
Manually linking fails if the target device does not match the design service.
Linking succeeds even if the .sof programmed to the target is not the same as the design .sof.
Analyzing and Debugging Designs with System ConsoleAltera Corporation
Send Feedback
QII53028Additional Services10-18 2014.06.30
Related InformationDesign Service Commands on page 10-26
Device ServiceThe device service supports device-level actions.
Programming
You can use the device service with Tcl scripting to perform device programming.
set device_index 0 ; #Device index for targetset device [lindex [get_service_paths device] $device_index]set sof_path [file join project_path output_files project_name.sof]device_download_sof $device $sof_path
To program, all you need are the device service path and the filesystem path to a .sof. Ensure that no service(e.g. master service) are open on the target device or else the command fails. Afterwards, you may do thefollowing to check that the design linked to the device is the same one programmed:
device_get_design $device
Related InformationDevice Commands on page 10-27
Monitor ServiceThe monitor service builds on top of the master service to allow reads of Avalon-MM slaves at a regularinterval. The service is fully software-based. The monitor service requires no extra soft-logic. This servicestreamlines the logic to do interval reads, and it offers better performance than exercising the master servicemanually for the reads.
Monitor Service Example
Start by determining a master and a memory address range that you are interested in polling continuously.
set master_index 0set master [lindex [get_service_paths master] $master_index]set address 0x2000set bytes_to_read 100set read_interval_ms 100
You can use the first master to read 100 bytes starting at address 0x2000 every 100 milliseconds. Open themonitor service:
set monitor [lindex [get_service_paths monitor] 0]set claimed_monitor [claim_service monitor $monitor mylib]
Notice that the master service was not opened. The monitor service opens the master service automatically.Register the previously-defined address range and time interval with the monitor service:
monitor_add_range $claimed_monitor $master $address $bytes_to_readmonitor_set_interval $claimed_monitor $read_interval_ms
Altera CorporationAnalyzing and Debugging Designs with System Console
Send Feedback
10-19Device ServiceQII530282014.06.30

More ranges can be added. Define what happens at each interval:
global monitor_data_bufferset monitor_data_buffer [list]proc store_data {monitor master address bytes_to_read} { global monitor_data_buffer set data [monitor_read_data $claimed_monitor $master $address $bytes_to_read] lappend monitor_data_buffer $data}
The code example above, gathers the data and appends it with a global variable. monitor_read_data returnsthe range of data polled from the running design as a list. In this example, data will be a 100-element list.This list is then appended as a single element in the monitor_data_buffer global list. If this procedure takeslonger than the interval period, the monitor service may have to skip the next one or more calls to theprocedure. In this case, monitor_read_datawill return the latest data polled. Register this callback with theopened monitor service:
set callback [list store_data $claimed_monitor $master $address $bytes_to_read]monitor_set_callback $claimed_monitor $callback
Use the callback variable to call when the monitor finishes an interval. Start monitoring:
monitor_set_enabled $claimed_monitor 1
Immediately, the monitor reads the specified ranges from the device and invoke the callback at the specifiedinterval. Check the contents of monitor_data_buffer to verify this. To turn off the monitor, use 0 insteadof 1 in the above command.
Related InformationMonitor Commands on page 10-36
Bytestream ServiceThe bytestream service provides access to modules that produce or consume a stream of bytes. You can usethe bytestream service to communicate directly to the IP core that provides bytestream interfaces, such asthe Altera JTAG UART of the Avalon-ST JTAG interface.
Bytestream Service Example
The following code finds the bytestream service for your interface and opens it.
set bytestream_index 0set bytestream [lindex [get_service_paths bytestream] $bytestream_index]set claimed_bytestream [claim_service bytestream $bytestream mylib]
To specify the outgoing data as a list of bytes and send it through the opened service:
set payload [list 1 2 3 4 5 6 7 8]bytestream_send $claimed_bytestream $payload
Incoming data also comes as a list of bytes.
set incoming_data [list]while {[llength $incoming_data] ==0} { set incoming_data [bytestream_receive $claimed_bytestream 8]}
Analyzing and Debugging Designs with System ConsoleAltera Corporation
Send Feedback
QII53028Bytestream Service10-20 2014.06.30

Close the service when done.
close_service bytestream $claimed_bytestream
Related InformationBytestream Commands on page 10-40
SLD ServiceThe SLD Service shifts values into the instruction and data registers of SLD nodes and captures the previousvalue.When interactingwith a SLDnode, start by acquiring exclusive access to the node on a opened service.
SLD Service Example
set timeout_in_ms 1000set lock_failed [sld_lock $sld_service_path $timeout_in_ms]
This code attempts to lock the selected SLD node. If it is already locked, sld_lock waits for the specifiedtimeout. Confirm the procedure returned non-zero before proceeding. Set the instruction register andcapture the previous one:
if {$lock_failed} { return}set instr 7set delay_us 1000set capture [sld_access_ir $sld_service_path $instr $delay_us]
The 1000 microsecond delay guarantees that the following SLD command executes least 1000 microsecondslater. Data register access works the same way.
set data_bit_length 32set delay_us 1000set data_bytes [list 0xEF 0xBE 0xAD 0xDE]set capture [sld_access_dr $sld_service_path $data_bit_length $delay_us $data_bytes]
Shift count is specified in bits, but the data content is specified as a list of bytes. The capture return value isalso a list of bytes. Always unlock the SLD node once finished with the SLD service.
sld_unlock $sld_service_path
Related Information
• SLD Commands on page 10-25
• Virtual JTAG Megafunction documentation
In-System Sources and Probes ServiceThe In-System Sources and Probes (ISSP) service provides scriptable access to the altsource_probe IP corein a similar manner to using the In-System Sources and Probes Editor in Quartus II.
Altera CorporationAnalyzing and Debugging Designs with System Console
Send Feedback
10-21SLD ServiceQII530282014.06.30

ISSP Service Example
Before you use the ISSP service, ensure your design works in the In-System Sources and Probes Editor. InSystem Console, open the service for an ISSP instance.
set issp_index 0set issp [lindex [get_service_paths issp] 0]set claimed_issp [claim_service issp $issp mylib]
View information about this particular ISSP instance.
array set instance_info [issp_get_instance_info $claimed_issp]set source_width $instance_info(source_width)set probe_width $instance_info(probe_width)
Probe data is read as a single bitstring of length equal to the probe width.
set all_probe_data [issp_read_probe_data $claimed_issp]
As an example, you can define the following procedure to extract an individual probe line's data.
proc get_probe_line_data {all_probe_data index} { set line_data [expr { ($all_probe_data >> $index) & 1 }] return $line_data}set initial_all_probe_data [issp_read_probe_data $claim_issp]set initial_line_0 [get_probe_line_data $initial_all_probe_data 0]set initial_line_5 [get_probe_line_data $initial_all_probe_data 5]# ...set final_all_probe_data [issp_read_probe_data $claimed_issp]set final_line_0 [get_probe_line_data $final_all_probe_data 0]
Similarly, source data is written as a single bitstring of length equal to the source width.
set source_data 0xDEADBEEFissp_write_source_data $claimed_issp $source_data
The currently set source data can also be retrieved.
set current_source_data [issp_read_source_data $claimed_issp]
As an example, you can invert the data for a 32-bit wide source by doing the following:
set current_source_data [issp_read_source_data $claimed_issp]set inverted_source_data [expr { $current_source_data ^ 0xFFFFFFFF }]issp_write_source_data $claimed_issp $inverted_source_data
Related InformationIn-System Sources and Probes Commands on page 10-40
System Console InfrastructureServices associated with debug agents in the running design can be directly opened and closed. Behind thescenes, SystemConsole is responsible for determining and using the lower level protocol for communicationwith the debug agent. As part of this, the System Console infrastructure finds the best board connection touse for command and data transmission.
Analyzing and Debugging Designs with System ConsoleAltera Corporation
Send Feedback
QII53028System Console Infrastructure10-22 2014.06.30

Related InformationWP-01170 System-Level Debugging and Monitoring of FPGA Designs white paperDetailed information about the architecture for system level debugging.
On-Board USB Blaster II SupportSystem Console supports an On-Board USB-BlasterTM II circuit via the USB Debug master IP component.This IP core supports the master service.
Not all Stratix V boards support the On-Board USB-Blaster II. For example, the transceiver signal integrityboard does not support the On-Board USB-Blaster II.
API
Console Commands
The console commands enable testing. Use console commands to identify a module by its path, and to openand close a connection to it. The path that identifies amodule is the first argument tomost of SystemConsolecommands.
Table 10-2: Console Commands
FunctionArgumentsCommand
Returns a list of service types that System Consolemanages. Examples of service types include master,bytestream, processor, sld, jtag_debug, device, anddesign.
N/Aget_service_types
Returns a list of paths to nodes that implement therequested service type.
<service_type>get_service_paths
Provides finer control of the portion of a service youwant to use.
The return value from claim_service is the path ofthe claimed service which should be used to access andfinally close the service.
Run help claim_service to get a <service-type> list.
Then run help claim_service <service-type> to getspecific help on that service.
<service-type>
<service-path>
<claim-group><claims>
claim_service
Closes the specified service type at the specified path.<service_type>
<service_path>
close_service
Returns 1 if the service type provided by the path isopen, 0 if the service type is closed.
<service_type>
<service_path>
is_service_open
Altera CorporationAnalyzing and Debugging Designs with System Console
Send Feedback
10-23On-Board USB Blaster II SupportQII530282014.06.30

FunctionArgumentsCommand
Returns a list of all services that are instantiable withthe add_service command.
—get_services_to_add
Adds a service of the specified service type with thegiven instance name. Run get_services_to_add toretrieve a list of instantiable services. This commandreturns the path where the service was added.
Run help add_service <service-type> to get specifichelp about that service type, including any parametersthat might be required for that service.
<service-type><instance-name><optional-parameters>
add_service
Creates a new GUI dashboard in System Consoledesktop.
<name> <title><menu>
add_service dashboard
Instantiates a gdbserver.<Processor Service><port number>
add_service gdbserver
Instantiates a tcp service.<instance_name>
<ip_addr>
<port number>
add_service tcp
Instantiates a Transceiver Toolkit receiver channel.<data_pattern_checkerpath>
<transceiver path>
<transceiver channeladdress>
<reconfig path>
<reconfig channeladdress>
add_service
transceiver_channel_rx
Instantiates a Transceiver Toolkit transmitter channel.<data_pattern_generator path>
<transceiver path>
<transceiver channeladdress>
<reconfig path>
<reconfig channeladdress>
add_service
transceiver_channel_tx
Analyzing and Debugging Designs with System ConsoleAltera Corporation
Send Feedback
QII53028API10-24 2014.06.30

FunctionArgumentsCommand
Instantiates a Transceiver Toolkit debug link.<transceiver_channel_tx path>
<transceiver_channel_rx path>
add_service
transceiver_debug_link
Returns the current System Console version and buildnumber.
—get_version
For the given claim group, returns a list of servicesclaimed. The returned list consists of pairs of paths andservice types. Each pair is one claimed service.
<claim-group>get_claimed_services
Scans for available hardware and updates the availableservice paths if there have been any changes.
—refresh_connections
Sends a message of the given level to the messagewindow. Available levels are info, warning, error, anddebug.
<level>
<message>
send_message
SLD Commands
Table 10-3: SLD Commands
FunctionArgumentsCommand
Shifts the instruction value intothe instruction register of thespecified node. Returns theprevious value of the instruction.
If the <delay> parameter is non-zero, then the JTAG clock ispaused for this length of time afterthe access.
<service-path>
<ir-value>
<delay> (in µs)
sld_access_ir
Shifts the byte values into the dataregister of the SLD node up to thesize in bits specified.
If the <delay> parameter is non-zero, then the JTAG clock ispaused for this length of time afterthe access.
Returns the previous contents ofthe data register.
<service-path>
<size_in_bits>
<delay-in-µs>,
<list_of_byte_values>
sld_access_dr
Altera CorporationAnalyzing and Debugging Designs with System Console
Send Feedback
10-25SLD CommandsQII530282014.06.30

FunctionArgumentsCommand
Locks the SLD chain to guaranteeexclusive access.
Returns 0 if successful. If the SLDchain is already locked by anotheruser, tries for<timeout>msbeforethrowing a Tcl error. You can usethe catch command if youwant tohandle the error.
<service-path>
<timeout-in-milliseconds>
sld_lock
Unlocks the SLD chain.<service-path>sld_unlock
Related InformationSLD Service on page 10-21
Design Service CommandsDesign service commands load and work with your design at a system level.
Table 10-4: Design Service Commands
FunctionArgumentsCommand
Loads a model of a Quartus IIdesign into System Console.Returns the design path.
For example, if your Quartus IIProject File (.qpf) file is in c:/projects/loopback, type thefollowing command:design_load{c:\projects\loopback\}
<quartus-project-path>,
<sof-file-path>,
or <qpf-file-path>
design_load
Links a Quartus II logical designwith a physical device.
For example, you can link aQuartus II design called 2c35_quartus_design to a 2c35 device.After you create this link, SystemConsole creates the appropriatecorrespondences between thelogical and physical submodulesof the Quartus II project.
<design-instance-path>
<device-service-path>
design_link
Extracts debug files from a SRAMObject File (.sof) to a zip file whichcan be emailed to Altera Supportfor analysis.
<design-path>
<zip-file-name>
design_extract_debug_files
Analyzing and Debugging Designs with System ConsoleAltera Corporation
Send Feedback
QII53028Design Service Commands10-26 2014.06.30

FunctionArgumentsCommand
Gets the list of warnings for thisdesign. If the design loadscorrrectly, then an empty listreturns.
<design-path>design_get_warnings
Related InformationDesign Service on page 10-18
Device CommandsThe device commands provide access to programmable logic devices on your board. Before you use thesecommands, identify the path to the programmable logic device on your board using the get_service_paths.
Table 10-5: Device Commands
FunctionArgumentsCommand
Loads the specified .sof file to thedevice specified by the path.
<service_path>
<sof-file-path>
device_download_sof
Returns all connections which goto the device at the specified path.
<service_path>device_get_connections
Returns the design this device iscurrently linked to.
<device_path>device_get_design
Related InformationDevice Service on page 10-19
Avalon-MM CommandsUsing the 8, 16, or 32 versions of the master_read or master_write commands is less efficient than usingthe master_write_memory or master_read_memory commands. Master commands can also be used onslave services. If you are working on a slave service, the address field can be a register (if the slave definesregister names). (1)
Table 10-6: Avalon-MM Commands
FunctionArgumentsCommand
Writes the list of byte values,starting at the specified baseaddress.
<service-path>
<address>
<list_of_byte_values>
master_write_memory
(1) Transfers performed in 16- and 32-bit sizes are packed in little-endian format.
Altera CorporationAnalyzing and Debugging Designs with System Console
Send Feedback
10-27Device CommandsQII530282014.06.30

FunctionArgumentsCommand
Writes the list of byte values,starting at the specified baseaddress, using 8-bit accesses.
<service-path>
<address>
<list_of_byte_values>
master_write_8
Writes the list of 16-bit values,starting at the specified baseaddress, using 16-bit accesses.
<service-path>
<address>
<list_of_16_bit_words>
master_write_16
Writes the entire contents of thefile through the master, starting atthe specified address. The file istreated as a binary file containinga stream of bytes.
<service-path>
<file-name>
<address>
master_write_from_file
Writes the list of 32-bit values,starting at the specified baseaddress, using 32-bit accesses.
<service-path>
<address>
<list_of_32_bit_words>
master_write_32
Returns a list of<size> bytes. Readfrom memory starts at thespecified base address.
<service-path>
<address>
<size_in_bytes>
master_read_memory
Returns a list of<size> bytes. Readfrom memory starts at thespecified base address, using 8-bitaccesses.
<service-path>
<address>
<size_in_bytes>
master_read_8
Returns a list of <size> 16-bitvalues. Read from memory startsat the specified base address, using16-bit accesses.
<service-path>
<address>
<size_in_multiples_of_16_bits>
master_read_16
Returns a list of <size> 32-bitvalues. Read from memory startsat the specified base address, using32-bit accesses.
<service-path>
<address>
<size_in_multiples_of_32_bits>
master_read_32
Reads the number of bytesspecified by <count> from thememory address specified andcreates (or overwrites) a filecontaining the values read. Thefile is written as a binary file.
<service-path>
<file-name>
<address>
<count>
master_read_to_file
When a register map is defined,returns a list of register names inthe slave.
<service-path>master_get_register_names
Analyzing and Debugging Designs with System ConsoleAltera Corporation
Send Feedback
QII53028Avalon-MM Commands10-28 2014.06.30

JTAG Debug Commands
Table 10-7: JTAG Commands
FunctionArgumentsCommand
Loops the specified list of bytesthrough a loopback of tdi and tdoof a system-level debug (SLD)node. Returns the list of bytevalues in the order that they werereceived. Blocks until all bytes arereceived. Byte values are givenwith the 0x (hexadecimal) prefixand delineated by spaces.
<service-path>
<list_of_byte_values>
jtag_debug_loop
Issues a reset request to thespecified service. Connectivitywithin your device determineswhich part of the system is reset.
<service-path>jtag_debug_reset_system
Clock and Reset Signal Commands
Table 10-8: Clock and Reset Commands
FunctionArgumentCommand
Returns the value of the clocksignal of the system clock thatdrives the module's systeminterface. The clock value issampled asynchronously;consequently, you may need tosample the clock several times toguarantee that it is toggling.
<service-path>jtag_debug_sample_clock
Returns the value of the reset_nsignal of the Avalon-ST JTAGInterface core. If reset_n is low(asserted), the value is 0 and ifreset_n is high (deasserted), thevalue is 1.
<service-path>jtag_debug_sample_reset
Altera CorporationAnalyzing and Debugging Designs with System Console
Send Feedback
10-29JTAG Debug CommandsQII530282014.06.30

FunctionArgumentCommand
Returns the result of a sticky bitthat monitors for system clockactivity. If the clock has toggledsince the last execution of thiscommand, the bit is 1. Returnstrue if the bit has ever toggled andotherwise returns false. Thesticky bit is reset to 0 on read.
<service-path>jtag_debug_sense_clock
Dashboard CommandsDashboard commands create graphical tools that seamlessly integrate into System Console. This sectiondescribes the supported dashboard Tcl commands and the properties that you can assign to the widgets onyour dashboard. The dashboard allows you to create tools that interact with live instances of an IP core onyour device.
Table 10-9: Dashboard Commands
DescriptionArgumentsCommand
Adds a specified widget to yourGUI dashboard.
<service-path>
<id>
<type>
<group id>
dashboard_add
Removes a specified widget fromyour GUI dashboard.
<service-path>
<id>
dashboard_remove
Sets the specified properties of thespecified widget that has beenadded to your GUI dashboard.
<service-path>
<property>
<id>
<value>
dashboard_set_property
Determines the existing propertiesof a widget added to your GUIdashboard.
<service-path>
<id>
<type>
dashboard_get_property
Returns a list of all possiblewidgets that you can add to yourGUI dashboard.
—dashboard_get_types
Returns a list of all possibleproperties of the specified widgetsin your GUI dashboard.
<widget type>dashboard_get_properties
Analyzing and Debugging Designs with System ConsoleAltera Corporation
Send Feedback
QII53028Dashboard Commands10-30 2014.06.30

Related InformationDashboard Service on page 10-14
Specifying WidgetsYou can specify the widgets that you add to your dashboard.
Note that dashboard_add performs a case-sensitive match against the widget type name.Note:
Table 10-10: Dashboard Widgets
DescriptionWidget
Adds a collection of widgets and control the general layout of the widgets.group
Adds a button.button
Allows you to group tabs together.tabbedGroup
Defines button actions.fileChooserButton
Adds a text string.label
Displays text.text
Adds a text field.textField
Adds a list.list
Adds a table.table
Adds an LED with a label.led
Adds the shape of an analog dial.dial
Adds a chart of historic values, with the X-axis of the chart representing time.timeChart
Adds a bar chart.barChart
Adds a check box.checkBox
Adds a combo box.comboBox
Adds a line chart.lineChart
Adds a pie chart.pieChart
Customizing WidgetsYou can changewidget properties. Use dashboard_set_property to interact with thewidgets you instantiate.This functionality is most useful when you change part of the execution of a callback.
Assigning Dashboard Widget PropertiesThe following tables list the various properties that you can apply to the widgets on your dashboard.
Altera CorporationAnalyzing and Debugging Designs with System Console
Send Feedback
10-31Specifying WidgetsQII530282014.06.30

Table 10-11: Properties Common to All Widgets
DescriptionProperty
Enables or disables the widget.enabled
Allows the widget to be expanded.expandable
Allows the widget to be resized horizontally if there's space available inthe cell where it resides.
expandableX
Allows the widget to be resized vertically if there's space available in thecell where it resides.
expandableY
If the widget's expandableY is set, this is the maximum height in pixelsthat the widget can take.
maxHeight
If the widget's expandableY is set, this is the minimum height in pixelsthat the widget can take.
minHeight
If the widget's expandableX is set, this is the maximum width in pixelsthat the widget can take.
maxWidth
If the widget's expandableX is set, this is the minimum width in pixelsthat the widget can take.
minWidth
The height of the widget if expandableY is not set.preferredHeight
The width of the widget if expandableX is not set.preferredWidth
Implements a mouse-over tooltip.toolTip
The value of the checkbox, whether it is selected or not.selected
Displays the widget.visible
Registers a callback function to be called when the value of the boxchanges.
onChange
Allows you to list available options.options
Table 10-12: button Properties
DescriptionProperty
A Tcl command to run, usually a proc, every time the button is clicked.onClick
The text on the button.text
Table 10-13: fileChooserButton Properties
DescriptionProperty
The text on the button.text
Analyzing and Debugging Designs with System ConsoleAltera Corporation
Send Feedback
QII53028Assigning Dashboard Widget Properties10-32 2014.06.30
DescriptionProperty
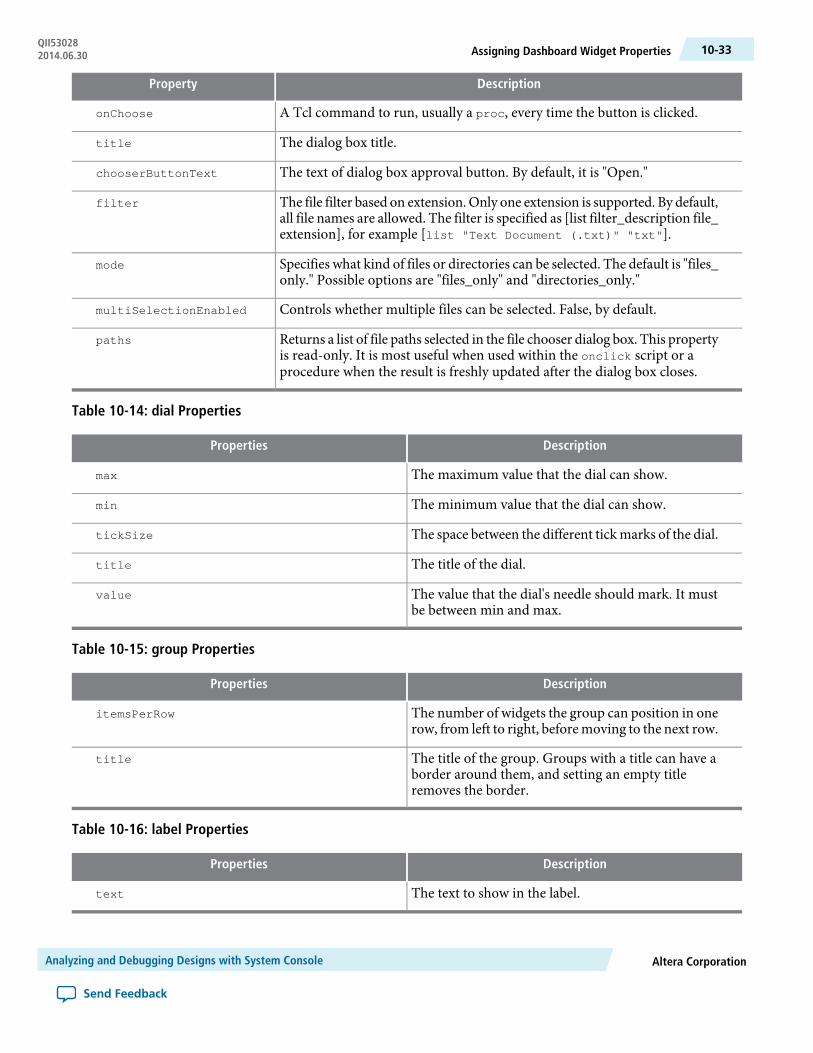
A Tcl command to run, usually a proc, every time the button is clicked.onChoose
The dialog box title.title
The text of dialog box approval button. By default, it is "Open."chooserButtonText
The file filter based on extension.Only one extension is supported. By default,all file names are allowed. The filter is specified as [list filter_description file_extension], for example [list "Text Document (.txt)" "txt"].
filter
Specifies what kind of files or directories can be selected. The default is "files_only." Possible options are "files_only" and "directories_only."
mode
Controls whether multiple files can be selected. False, by default.multiSelectionEnabled
Returns a list of file paths selected in the file chooser dialog box. This propertyis read-only. It is most useful when used within the onclick script or aprocedure when the result is freshly updated after the dialog box closes.
paths
Table 10-14: dial Properties
DescriptionProperties
The maximum value that the dial can show.max
The minimum value that the dial can show.min
The space between the different tick marks of the dial.tickSize
The title of the dial.title
The value that the dial's needle should mark. It mustbe between min and max.
value
Table 10-15: group Properties
DescriptionProperties
The number of widgets the group can position in onerow, from left to right, beforemoving to the next row.
itemsPerRow
The title of the group. Groups with a title can have aborder around them, and setting an empty titleremoves the border.
title
Table 10-16: label Properties
DescriptionProperties
The text to show in the label.text
Altera CorporationAnalyzing and Debugging Designs with System Console
Send Feedback
10-33Assigning Dashboard Widget PropertiesQII530282014.06.30

Table 10-17: led Properties
DescriptionProperties
The color of the LED. The options are: red_off, red,yellow_off, yellow, green_off, green, blue_off, blue,and black.
color
The text to show next to the LED.text
Table 10-18: text Properties
DescriptionProperties
Controls whether the text box is editable.editable
Controls whether the text box can format HTML.htmlCapable
The text to show in the text box.text
Table 10-19: timeChart Properties
DescriptionProperties
The label for the X axis.labelX
The label for the Y axis.labelY
The latest value in the series.latest
The number of sample points to display in the historicrecord.
maximumItemCount
The title of the chart.title
Table 10-20: table Properties
DescriptionProperties
Table-wide Properties
The number of columns (Mandatory) (0, by default).
columnCount
The number of rows (Mandatory) (0, by default).rowCount
Controls whether you can drag the columns (false, bydefault).
headerReorderingAllowed
Controls whether you can resize all column widths.(false, by default). Note, each column can be individ-ually configured to be resized by using thecolumnWidthResizable property.
headerResizingAllowed
Analyzing and Debugging Designs with System ConsoleAltera Corporation
Send Feedback
QII53028Assigning Dashboard Widget Properties10-34 2014.06.30

DescriptionProperties
Controls whether you can sort the cell values in acolumn (false, by default).
rowSorterEnabled
Controls whether to draw both horizontal and verticallines (true, by default).
showGrid
Controls whether to draw horizontal line (true, bydefault).
showHorizontalLines
Controls whether to draw vertical line (true, bydefault).
showVerticalLines
Current row index. Zero-based. This value affectssome properties below (0, by default).
rowIndex
Current column index. Zero-based. This value affectsall column specific properties below (0, by default).
columnIndex
Specifies the text to be filled in the cell specified thecurrent rowIndex and columnIndex (Empty, bydefault).
cellText
Control or retrieve row selection.selectedRows
Column-specific Properties
The text to be filled in the column header.columnHeader
The cell text alignment in the specified column.Supported types are "leading"(default), "left", "center","right", "trailing".
columnHorizontalAlignment
The type of sorting method used. This is applicableonly if rowSorterEnabled is true. Each column has itsown sorting type. Supported types are "string"(default), "int", and "float".
columnRowSorterType
The number of pixels used for the column width.columnWidth
Controls whether the column width is resizable byyou (false, by default).
columnWidthResizable
Table 10-21: barChart Properties
DescriptionProperties
Chart title.title
X axis label text.labelX
Y axis label text.labelY
Altera CorporationAnalyzing and Debugging Designs with System Console
Send Feedback
10-35Assigning Dashboard Widget PropertiesQII530282014.06.30

DescriptionProperties
Y axis value range. By default, it is auto range. Rangeis specified in a Tcl list, for example [list lower_numerical_value upper_numerical_value].
range
Item value. Value is specified in a Tcl list, for examplelist bar_category_str numerical_value.
itemValue
Table 10-22: lineChart Properties
DescriptionProperties
Chart title.title
Axis X label text.labelX
Axis Y label text.labelY
Axis Y value range. By default, it is auto range. Rangeis specified in a Tcl list, for example list lower_numerical_value upper_numerical_value.
range
Item value. Value is specified in a Tcl list, for examplelist bar_category_str numerical_value.
itemValue
Table 10-23: pieChart Properties
DescriptionProperties
Chart title.title
Item value. Value is specified in a Tcl list, for examplelist bar_category_str numerical_value.
itemValue
Monitor CommandsYou can use the Monitor commands to read many Avalon-MM slave memory locations at a regular interval.
Under normal load, the monitor service reads the data after each interval and then calls the callback. If thevalue you read is timing sensitive, your can use the monitor_get_read_interval command to read theexact time between the intervals at which the data was read.
Under heavy load, or with a callback that takes a long time to execute, the monitor service skips somecallbacks. If the registers you read do not have side effects (for example, they read the total number of eventssince reset), skipping callbacks has no effect on your code. The monitor_read_data command andmonitor_get_read_interval command are adequate for this scenario.
If the registers you read have side effects (for example, they return the number of events since the last read),you must have access to the data that was read, but for which the callback was skipped. Themonitor_read_all_data and monitor_get_all_read_intervals commands provide access to this data.
Analyzing and Debugging Designs with System ConsoleAltera Corporation
Send Feedback
QII53028Monitor Commands10-36 2014.06.30
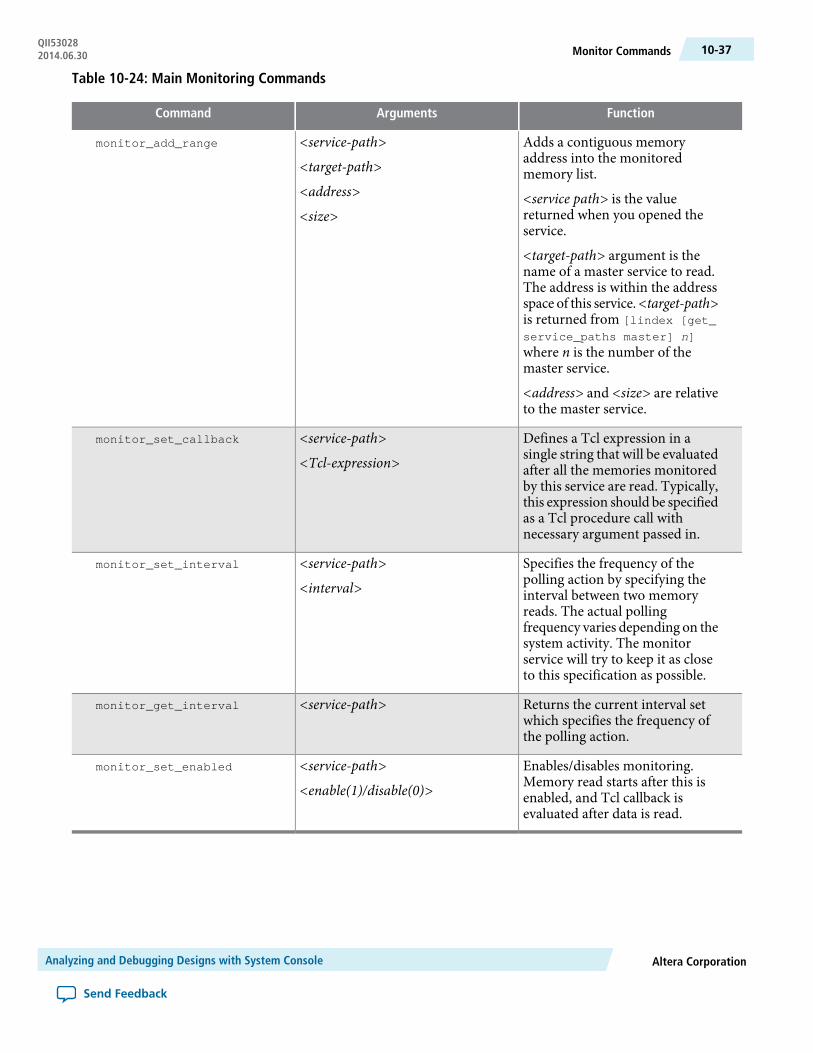
Table 10-24: Main Monitoring Commands
FunctionArgumentsCommand
Adds a contiguous memoryaddress into the monitoredmemory list.
<service path> is the valuereturned when you opened theservice.
<target-path> argument is thename of a master service to read.The address is within the addressspace of this service.<target-path>is returned from [lindex [get_
service_paths master] n]
where n is the number of themaster service.
<address> and <size> are relativeto the master service.
<service-path>
<target-path>
<address>
<size>
monitor_add_range
Defines a Tcl expression in asingle string that will be evaluatedafter all the memories monitoredby this service are read. Typically,this expression should be specifiedas a Tcl procedure call withnecessary argument passed in.
<service-path>
<Tcl-expression>
monitor_set_callback
Specifies the frequency of thepolling action by specifying theinterval between two memoryreads. The actual pollingfrequency varies depending on thesystem activity. The monitorservice will try to keep it as closeto this specification as possible.
<service-path>
<interval>
monitor_set_interval
Returns the current interval setwhich specifies the frequency ofthe polling action.
<service-path>monitor_get_interval
Enables/disables monitoring.Memory read starts after this isenabled, and Tcl callback isevaluated after data is read.
<service-path>
<enable(1)/disable(0)>
monitor_set_enabled
Altera CorporationAnalyzing and Debugging Designs with System Console
Send Feedback
10-37Monitor CommandsQII530282014.06.30

Table 10-25: Monitor Callback Commands
FunctionArgumentsCommand
Adds contiguous memoryaddresses into the monitoredmemory list.
The<target-path> argument is thename of a master service to read.The address is within the addressspace of this service.
<service-path> <target-path><address> <size>
monitor_add_range
Defines a Tcl expression in asingle string that will be evaluatedafter all the memories monitoredby this service are read. Typically,this expression should be specifiedas a Tcl procedure call withnecessary argument passed in.
<service-path>
<Tcl-expression>
monitor_set_callback
Returns a list of 8-bit values readfrom the most recent values readfrom device. The memory rangespecified must be the same as themonitored memory range asdefined by monitor_add_range.
<service-path> <target-path><address> <size>
monitor_read_data
Returns a list of 8-bit values readfrom all recent values read fromdevice since last Tcl callback. Thememory range specified must bewithin the monitored memoryrange as defined by monitor_add_range.
<service-path> <target-path><address> <size>
monitor_read_all_data
Returns the number of millisec-onds between last two data readsreturned by monitor_read_data.
<service-path> <target-path><address> <size>
monitor_get_read_interval
Returns a list of intervals inmilliseconds between two readswithin the data returned bymonitor_read_all_data.
<service-path> <target-path><address> <size>
monitor_get_all_read_
intervals
Returns the number of callbackevents missed during theevaluation of last Tcl callbackexpression.
<service-path>monitor_get_missing_event_
count
Related InformationMonitor Service on page 10-19
Analyzing and Debugging Designs with System ConsoleAltera Corporation
Send Feedback
QII53028Monitor Commands10-38 2014.06.30

Processor Commands
Table 10-26: Processor Commands
FunctionArgumentsCommand(2)
Downloads the given Executableand Linking Format File (.elf) tomemory using the master serviceassociatedwith the processor. Setsthe processor's program counterto the .elf entry point.
<service-path>
<elf-file-path>
processor_download_elf
Returns a non-zero value if theprocessor is in debug mode.
<service-path>processor_in_debug_mode
Resets the processor and places itin debug mode.
<service-path>processor_reset
Puts the processor into run mode.<service-path>processor_run
Puts the processor into debugmode.
<service-path>processor_stop
Executes one assembly instruction.<service-path>processor_step
Returns a list with the names of allof the processor's accessibleregisters.
<service-path>processor_get_register_names
Returns the value of the specifiedregister.
<service-path>
<register_name>
processor_get_register
Sets the value of the specifiedregister.
<service-path>
<value>
<register_name>
processor_set_register
Related InformationNios II Processor Example on page 10-17
(2) If your system includes a Nios II/f core with a data cache, it may complicate the debugging process. If yoususpect the Nios II/f core writes to memory from the data cache at nondeterministic intervals; thereby,overwriting data written by the System Console, you can disable the cache of the Nios II/f core while debugging.
Altera CorporationAnalyzing and Debugging Designs with System Console
Send Feedback
10-39Processor CommandsQII530282014.06.30

Bytestream Commands
Table 10-27: Bytestream Commands
FunctionArgumentsCommand
Sends the list of bytes to thespecified bytestream service.Values argument is the list of bytesto send.
<service-path>
<values>
bytestream_send
Returns a list of bytes currentlyavailable in the specified servicesreceive queue, up to the specifiedlimit. Length argument is themaximum number of bytes toreceive.
<service-path>
<length>
bytestream_receive
Related InformationBytestream Service on page 10-20
In-System Sources and Probes CommandsThe valid values for probe claims include read_only, normal, and exclusive.Note:
Table 10-28: In-System Sources and Probes Tcl Commands
FunctionArgumentsCommand
Returns a list of the configurationsof the In-System Sources andProbes instance, including:
instance_index
instance_name
source_width
probe_width
<service-path>issp_get_instance_info
Retrieves the current value of theprobe input. A hex string isreturned representing the probeport value.
<service-path>issp_read_probe_data
Retrieves the current value of thesource output port. A hex stringis returned representing the sourceport value.
<service-path>issp_read_source_data
Analyzing and Debugging Designs with System ConsoleAltera Corporation
Send Feedback
QII53028Bytestream Commands10-40 2014.06.30

FunctionArgumentsCommand
Sets values for the source outputport. The value can be either a hexstring or a decimal valuesupported by System Console Tclinterpreter.
<service-path>
<source-value>
issp_write_source_data
Related InformationIn-System Sources and Probes Service on page 10-21
Deprecated CommandsThe table lists commands that have been deprecated. These commands are currently supported, but aretargeted for removal from System Console.
Table 10-29: Deprecated Commands
FunctionArgumentsCommand
Opens the specified service typeat the specified path.
Calls to open_service may bereplaced with calls to claim_
service providing that the returnvalue from claim_service isstored and used to access and closethe open service.
<service_type>
<service_path>
open_service
Document Revision History
Table 10-30: Document Revision History
ChangesVersionDate
Updated design examples for the following: board bring-up,dashboard service, Nios II processor, design service, deviceservice, monitor service, bytestream service, SLD service,and ISSP service.
14.0.0June 2014
Re-organization of sections. Added high-level informationwith block diagram, workflow, SLD overview, use-cases, andexample Tcl scripts.
13.1.0November 2013
Updated Tcl command tables. Added board bring-up designexample. Removed SOPC Builder content.
13.0.0June 2013
Re-organization of content.12.1.0November 2012
Altera CorporationAnalyzing and Debugging Designs with System Console
Send Feedback
10-41Deprecated CommandsQII530282014.06.30

ChangesVersionDate
MovedTransceiverToolkit commands toTransceiverToolkitchapter.
12.0.1August 2012
Maintenance release. This chapter adds new SystemConsolefeatures.
12.0.0June 2012
Maintenance release. This chapter adds new SystemConsolefeatures.
11.1.0November 2011
Maintenance release. This chapter adds new SystemConsolefeatures.
11.0.0May 2011
Maintenance release. This chapter adds new commands andreferences for Qsys.
10.1.0December 2010
Initial release. Previously released as the System ConsoleUser Guide, which is being obsoleted. This new chapter addsnew commands.
10.0.0July 2010
For previous versions of the Quartus II Handbook , refer to the Quartus II Handbook Archive.
Related InformationQuartus II Handbook Archive
Analyzing and Debugging Designs with System ConsoleAltera Corporation
Send Feedback
QII53028Document Revision History10-42 2014.06.30