Analyze Your Inventory to Maximize Used-Vehicle Profits
13
Analyze Your Inventory to Maximize Used-Vehicle Profits An NADA White Paper
Transcript of Analyze Your Inventory to Maximize Used-Vehicle Profits
Analyze Your Inventory to Maximize Used-Vehicle Profits An NADA White Paper
The National Automobile Dealers Association (NADA) has prepared this white paper to assist its dealer members in being as efficient as possible in the operation of their dealerships. The presentation of this information is not intended to encourage concerted action among competitors or any other action on the part of dealers that would in any manner fix or stabilize the price or any element of the price of any good or service.
TABLE OF CONTENTSUsed Cars Are More Profitable for Dealers Than New Cars ......... 1
Used-Vehicle Sources: A Laundry List .................................... 2
Turn Time .............................................................................. 3
Inventory Quick Analysis Form ............................................... 5
Sample Inventory Quick Analysis Form................................... 6
Calendar-Year Inventory Turn Rate ......................................... 8
Net Return on Inventory Investment ....................................... 9
Analyze Your Inventory to Maximize Used-Vehicle Profits An NADA White Paper
A n a l y z e Y o u r I n v e n t o r y t o M a x i m i z e U s e d - V e h i c l e P r o f i t s A n N A D A W h i t e P a p e r 1 A n a l y z e Y o u r I n v e n t o r y t o M a x i m i z e U s e d - V e h i c l e P r o f i t s A n N A D A W h i t e P a p e r 2
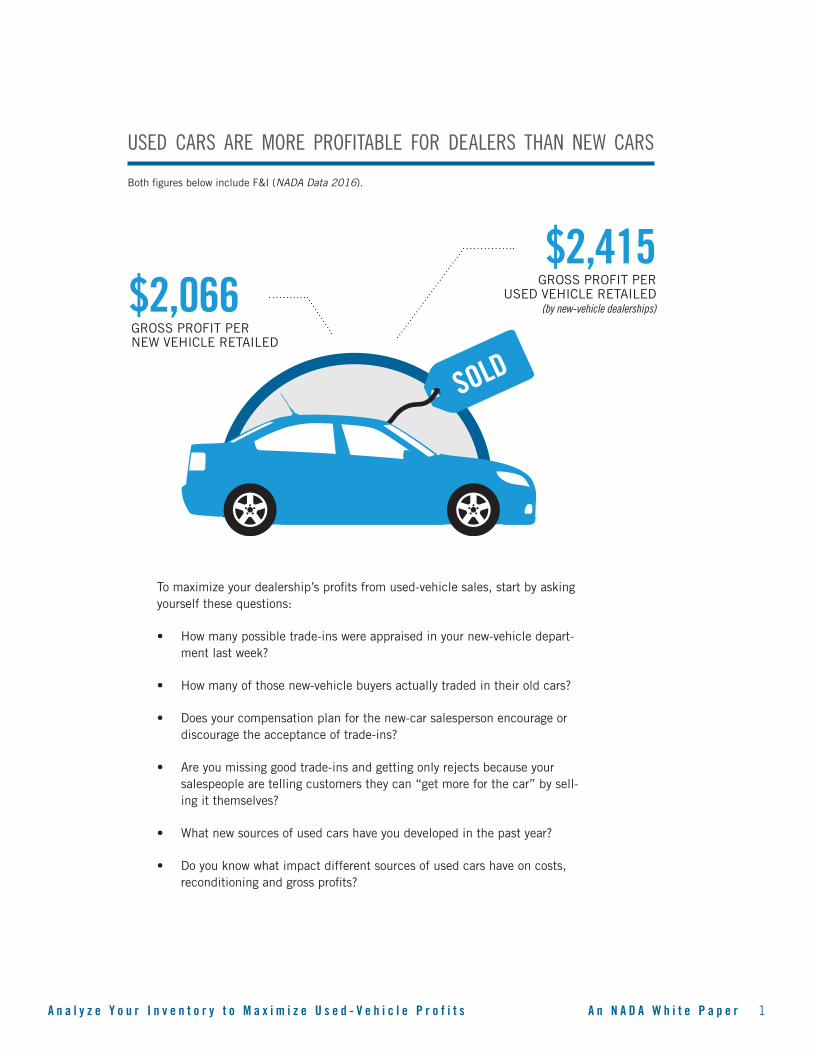
USED CARS ARE MORE PROFITABLE FOR DEALERS THAN NEW CARS
Both figures below include F&I (NADA Data 2016).
SOLD
$2,066GROSS PROFIT PER NEW VEHICLE RETAILED
$2,415GROSS PROFIT PER
USED VEHICLE RETAILED(by new-vehicle dealerships)
To maximize your dealership’s profits from used-vehicle sales, start by asking yourself these questions:
• How many possible trade-ins were appraised in your new-vehicle depart-ment last week?
• How many of those new-vehicle buyers actually traded in their old cars?
• Does your compensation plan for the new-car salesperson encourage or discourage the acceptance of trade-ins?
• Are you missing good trade-ins and getting only rejects because your salespeople are telling customers they can “get more for the car” by sell-ing it themselves?
• What new sources of used cars have you developed in the past year?
• Do you know what impact different sources of used cars have on costs, reconditioning and gross profits?
A n a l y z e Y o u r I n v e n t o r y t o M a x i m i z e U s e d - V e h i c l e P r o f i t s A n N A D A W h i t e P a p e r 1 A n a l y z e Y o u r I n v e n t o r y t o M a x i m i z e U s e d - V e h i c l e P r o f i t s A n N A D A W h i t e P a p e r 2
USED-VEHICLE SOURCES: A LAUNDRY LIST
When acquiring your used-vehicle inventory, consider all the sources available to you:
• New-vehicle trade-ins
• Used-vehicle trade-ins
• Street purchases
• Off-lease purchases
• Wholesalers
• Other dealers
• Digital media
• Rental fleets (consider dealer-direct purchase options)
• Front line (you can search online local auctions to buy front-line-ready inventory)
• Newspapers, trade papers
• Networking
• Auction purchases, including:
~ Factory “brass hats” (vehicles used for factory demos)
~ Dealer consignments
~ Major financial companies
~ Repossessions
~ Program units
~ Risk units
~ National fleet accounts
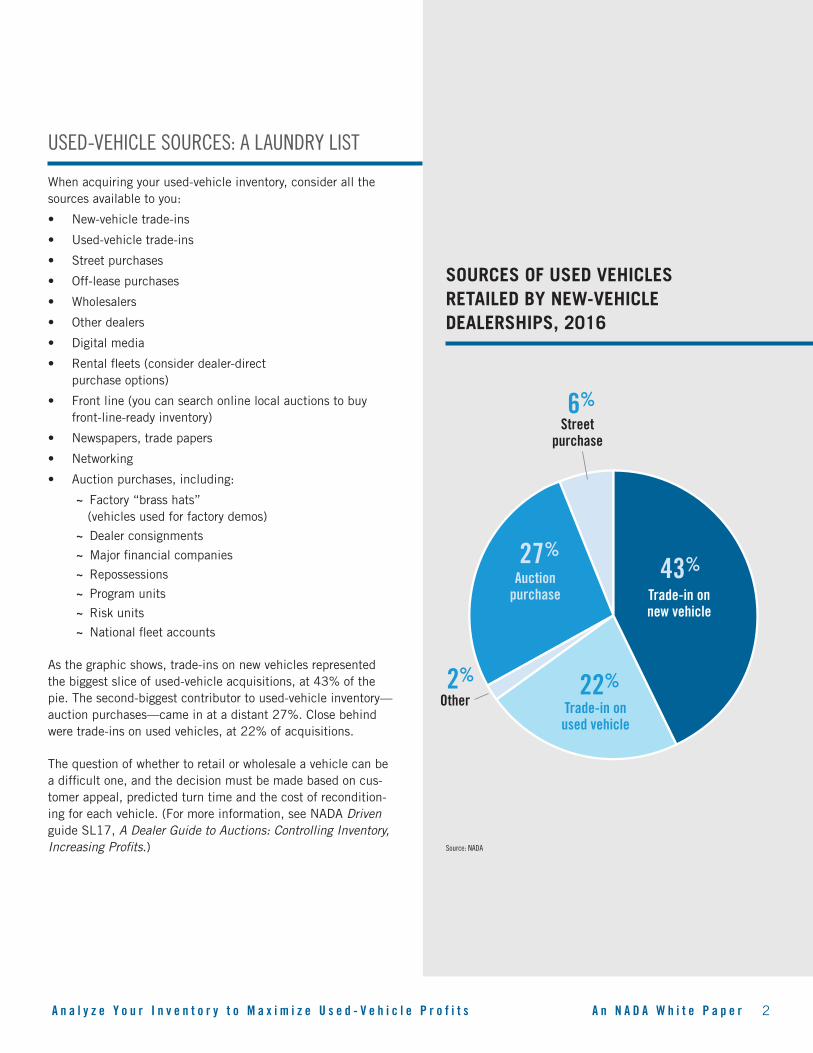
As the graphic shows, trade-ins on new vehicles represented the biggest slice of used-vehicle acquisitions, at 43% of the pie. The second-biggest contributor to used-vehicle inventory—auction purchases—came in at a distant 27%. Close behind were trade-ins on used vehicles, at 22% of acquisitions.
The question of whether to retail or wholesale a vehicle can be a difficult one, and the decision must be made based on cus-tomer appeal, predicted turn time and the cost of recondition-ing for each vehicle. (For more information, see NADA Driven guide SL17, A Dealer Guide to Auctions: Controlling Inventory, Increasing Profits.)
Trade-in onnew vehicle
Trade-in onused vehicle
Auctionpurchase
Streetpurchase
Other
43%
22%
27%
6%
2%
SOURCES OF USED VEHICLES RETAILED BY NEW-VEHICLE DEALERSHIPS, 2016
Source: NADA
A n a l y z e Y o u r I n v e n t o r y t o M a x i m i z e U s e d - V e h i c l e P r o f i t s A n N A D A W h i t e P a p e r 3 A n a l y z e Y o u r I n v e n t o r y t o M a x i m i z e U s e d - V e h i c l e P r o f i t s A n N A D A W h i t e P a p e r 4
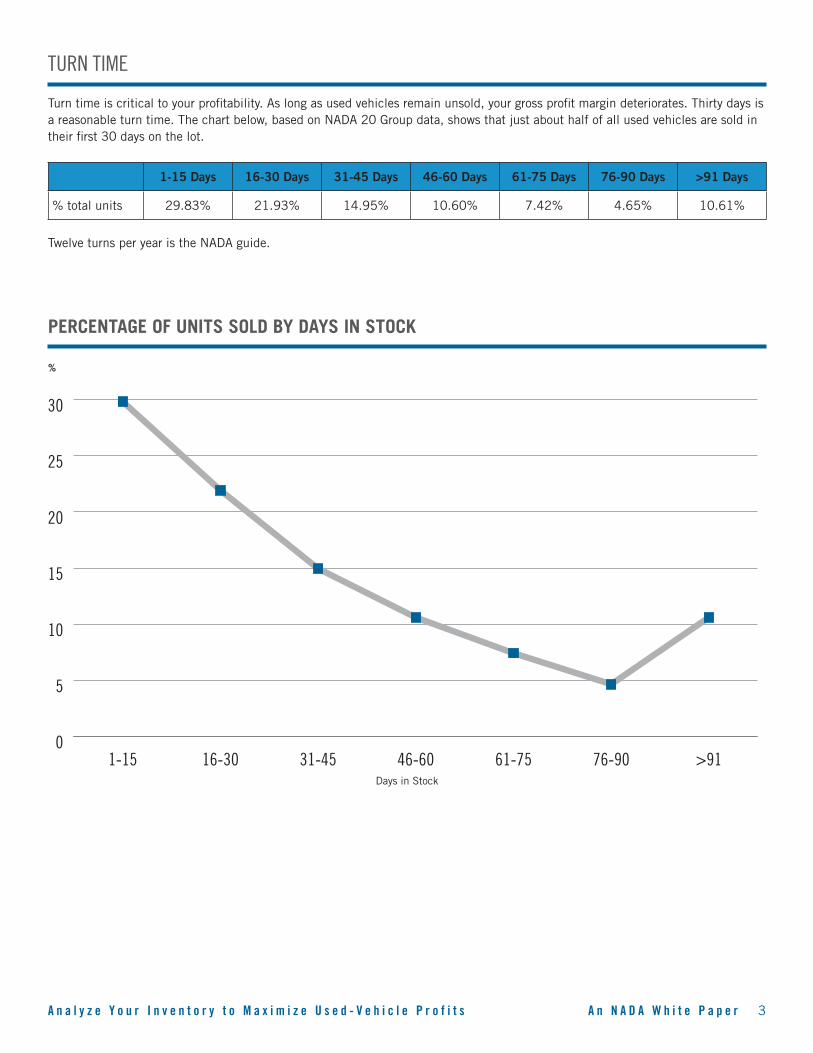
TURN TIME
Turn time is critical to your profitability. As long as used vehicles remain unsold, your gross profit margin deteriorates. Thirty days is a reasonable turn time. The chart below, based on NADA 20 Group data, shows that just about half of all used vehicles are sold in their first 30 days on the lot.
1-15 Days 16-30 Days 31-45 Days 46-60 Days 61-75 Days 76-90 Days >91 Days
% total units 29.83% 21.93% 14.95% 10.60% 7.42% 4.65% 10.61%
Twelve turns per year is the NADA guide.
0
5
10
15
20
25
30
>9176-9061-7546-6031-4516-301-15
0
5
10
15
20
25
30
35
40
>9176-9061-7546-6031-4516-301-15
PERCENTAGE OF UNITS SOLD BY DAYS IN STOCK
%
Days in Stock
A n a l y z e Y o u r I n v e n t o r y t o M a x i m i z e U s e d - V e h i c l e P r o f i t s A n N A D A W h i t e P a p e r 3 A n a l y z e Y o u r I n v e n t o r y t o M a x i m i z e U s e d - V e h i c l e P r o f i t s A n N A D A W h i t e P a p e r 4
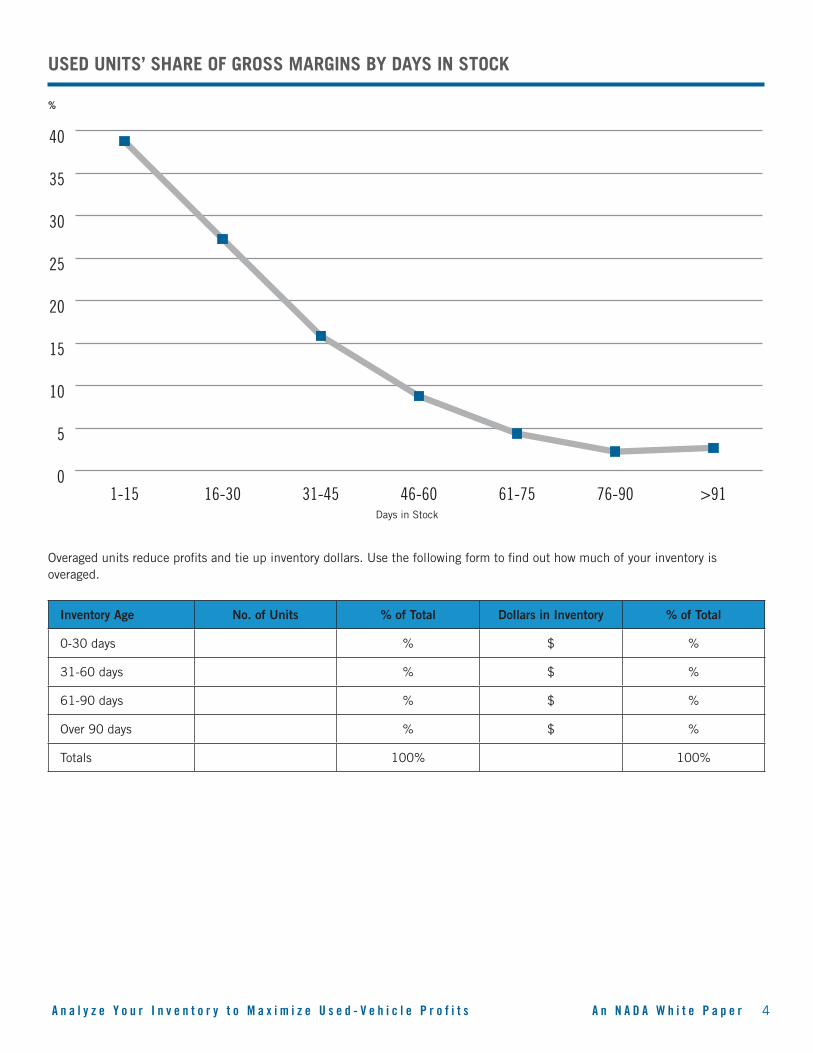
Overaged units reduce profits and tie up inventory dollars. Use the following form to find out how much of your inventory is overaged.
Inventory Age No. of Units % of Total Dollars in Inventory % of Total
0-30 days % $ %
31-60 days % $ %
61-90 days % $ %
Over 90 days % $ %
Totals 100% 100%
0
5
10
15
20
25
30
>9176-9061-7546-6031-4516-301-15
0
5
10
15
20
25
30
35
40
>9176-9061-7546-6031-4516-301-15
USED UNITS’ SHARE OF GROSS MARGINS BY DAYS IN STOCK
%
Days in Stock
A n a l y z e Y o u r I n v e n t o r y t o M a x i m i z e U s e d - V e h i c l e P r o f i t s A n N A D A W h i t e P a p e r 5 A n a l y z e Y o u r I n v e n t o r y t o M a x i m i z e U s e d - V e h i c l e P r o f i t s A n N A D A W h i t e P a p e r 6
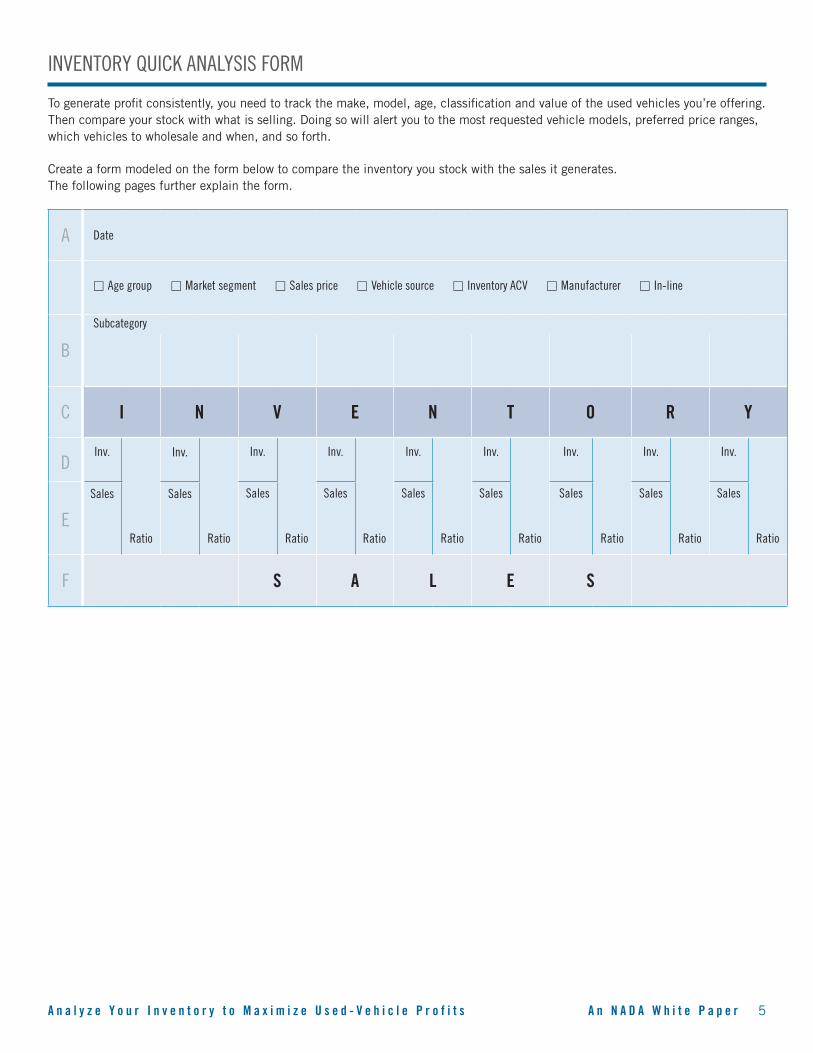
INVENTORY QUICK ANALYSIS FORM
To generate profit consistently, you need to track the make, model, age, classification and value of the used vehicles you’re offering. Then compare your stock with what is selling. Doing so will alert you to the most requested vehicle models, preferred price ranges, which vehicles to wholesale and when, and so forth.
Create a form modeled on the form below to compare the inventory you stock with the sales it generates. The following pages further explain the form.
A Date
□ Age group □ Market segment □ Sales price □ Vehicle source □ Inventory ACV □ Manufacturer □ In-line
B
Subcategory
C I N V E N T O R Y
DInv.
Ratio
Inv.
Ratio
Inv.
Ratio
Inv.
Ratio
Inv.
Ratio
Inv.
Ratio
Inv.
Ratio
Inv.
Ratio
Inv.
RatioE
Sales Sales Sales Sales Sales Sales Sales Sales Sales
F S A L E S
A n a l y z e Y o u r I n v e n t o r y t o M a x i m i z e U s e d - V e h i c l e P r o f i t s A n N A D A W h i t e P a p e r 5 A n a l y z e Y o u r I n v e n t o r y t o M a x i m i z e U s e d - V e h i c l e P r o f i t s A n N A D A W h i t e P a p e r 6
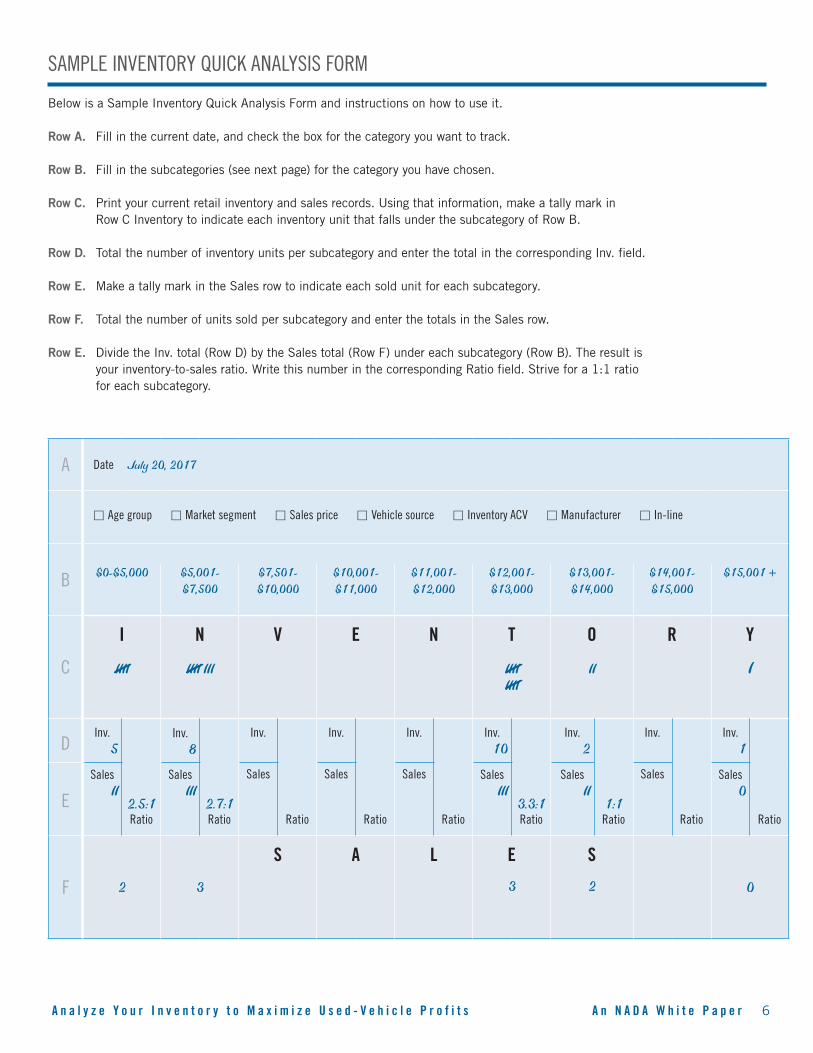
SAMPLE INVENTORY QUICK ANALYSIS FORM
Below is a Sample Inventory Quick Analysis Form and instructions on how to use it.
Row A. Fill in the current date, and check the box for the category you want to track.
Row B. Fill in the subcategories (see next page) for the category you have chosen.
Row C. Print your current retail inventory and sales records. Using that information, make a tally mark in Row C Inventory to indicate each inventory unit that falls under the subcategory of Row B.
Row D. Total the number of inventory units per subcategory and enter the total in the corresponding Inv. field.
Row E. Make a tally mark in the Sales row to indicate each sold unit for each subcategory. Row F. Total the number of units sold per subcategory and enter the totals in the Sales row.
Row E. Divide the Inv. total (Row D) by the Sales total (Row F) under each subcategory (Row B). The result is your inventory-to-sales ratio. Write this number in the corresponding Ratio field. Strive for a 1:1 ratio for each subcategory.
A Date July 20, 2017
□ Age group □ Market segment □ Sales price □ Vehicle source □ Inventory ACV □ Manufacturer □ In-line
B $0-$5,000 $5,001-$7,500
$7,501-$10,000
$10,001-$11,000
$11,001-$12,000
$12,001-$13,000
$13,001-$14,000
$14,001-$15,000
$15,001 +
C
I
IIII
N
IIII III
V E N T
IIII IIII
O
II
R Y
I
DInv.
5
2.5:1 Ratio
Inv.8
2.7:1 Ratio
Inv.
Ratio
Inv.
Ratio
Inv.
Ratio
Inv.10
3.3:1 Ratio
Inv.2
1:1 Ratio
Inv.
Ratio
Inv.1
RatioE
SalesII
SalesIII
Sales Sales Sales SalesIII
SalesII
Sales Sales0
F 2 3
S A L E
3
S
2 0
/ / //
A n a l y z e Y o u r I n v e n t o r y t o M a x i m i z e U s e d - V e h i c l e P r o f i t s A n N A D A W h i t e P a p e r 7 A n a l y z e Y o u r I n v e n t o r y t o M a x i m i z e U s e d - V e h i c l e P r o f i t s A n N A D A W h i t e P a p e r 8
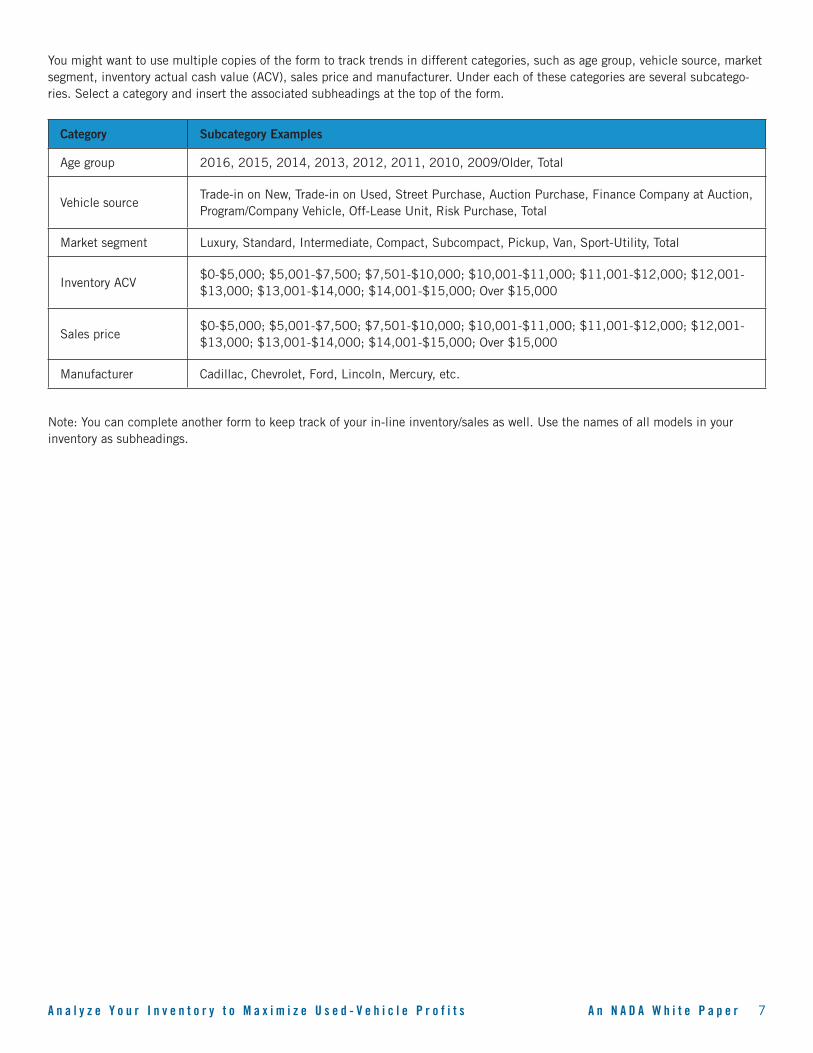
You might want to use multiple copies of the form to track trends in different categories, such as age group, vehicle source, market segment, inventory actual cash value (ACV), sales price and manufacturer. Under each of these categories are several subcatego-ries. Select a category and insert the associated subheadings at the top of the form.
Category Subcategory Examples
Age group 2016, 2015, 2014, 2013, 2012, 2011, 2010, 2009/Older, Total
Vehicle sourceTrade-in on New, Trade-in on Used, Street Purchase, Auction Purchase, Finance Company at Auction, Program/Company Vehicle, Off-Lease Unit, Risk Purchase, Total
Market segment Luxury, Standard, Intermediate, Compact, Subcompact, Pickup, Van, Sport-Utility, Total
Inventory ACV$0-$5,000; $5,001-$7,500; $7,501-$10,000; $10,001-$11,000; $11,001-$12,000; $12,001-$13,000; $13,001-$14,000; $14,001-$15,000; Over $15,000
Sales price$0-$5,000; $5,001-$7,500; $7,501-$10,000; $10,001-$11,000; $11,001-$12,000; $12,001-$13,000; $13,001-$14,000; $14,001-$15,000; Over $15,000
Manufacturer Cadillac, Chevrolet, Ford, Lincoln, Mercury, etc.
Note: You can complete another form to keep track of your in-line inventory/sales as well. Use the names of all models in your inventory as subheadings.
A n a l y z e Y o u r I n v e n t o r y t o M a x i m i z e U s e d - V e h i c l e P r o f i t s A n N A D A W h i t e P a p e r 7 A n a l y z e Y o u r I n v e n t o r y t o M a x i m i z e U s e d - V e h i c l e P r o f i t s A n N A D A W h i t e P a p e r 8
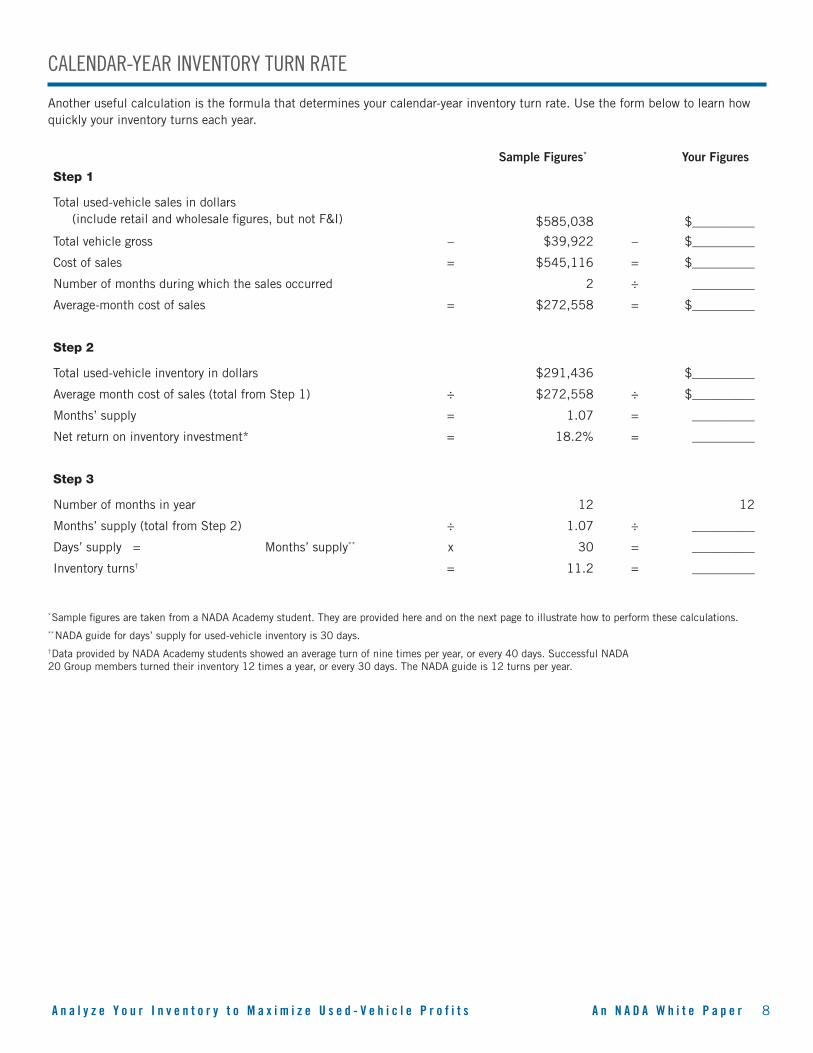
CALENDAR-YEAR INVENTORY TURN RATE
Another useful calculation is the formula that determines your calendar-year inventory turn rate. Use the form below to learn how quickly your inventory turns each year.
Sample Figures* Your Figures
Step 1
Total used-vehicle sales in dollars (include retail and wholesale figures, but not F&I) $585,038 $__________
Total vehicle gross – $39,922 – $__________
Cost of sales = $545,116 = $__________
Number of months during which the sales occurred 2 ÷ __________
Average-month cost of sales = $272,558 = $__________
Step 2
Total used-vehicle inventory in dollars $291,436 $__________
Average month cost of sales (total from Step 1) ÷ $272,558 ÷ $__________
Months’ supply = 1.07 = __________
Net return on inventory investment* = 18.2% = __________
Step 3
Number of months in year 12 12
Months’ supply (total from Step 2) ÷ 1.07 ÷ __________
Days’ supply = Months’ supply** x 30 = __________
Inventory turns† = 11.2 = __________
* Sample figures are taken from a NADA Academy student. They are provided here and on the next page to illustrate how to perform these calculations. ** NADA guide for days’ supply for used-vehicle inventory is 30 days.† Data provided by NADA Academy students showed an average turn of nine times per year, or every 40 days. Successful NADA 20 Group members turned their inventory 12 times a year, or every 30 days. The NADA guide is 12 turns per year.
A n a l y z e Y o u r I n v e n t o r y t o M a x i m i z e U s e d - V e h i c l e P r o f i t s A n N A D A W h i t e P a p e r 9 A n a l y z e Y o u r I n v e n t o r y t o M a x i m i z e U s e d - V e h i c l e P r o f i t s A n N A D A W h i t e P a p e r 10
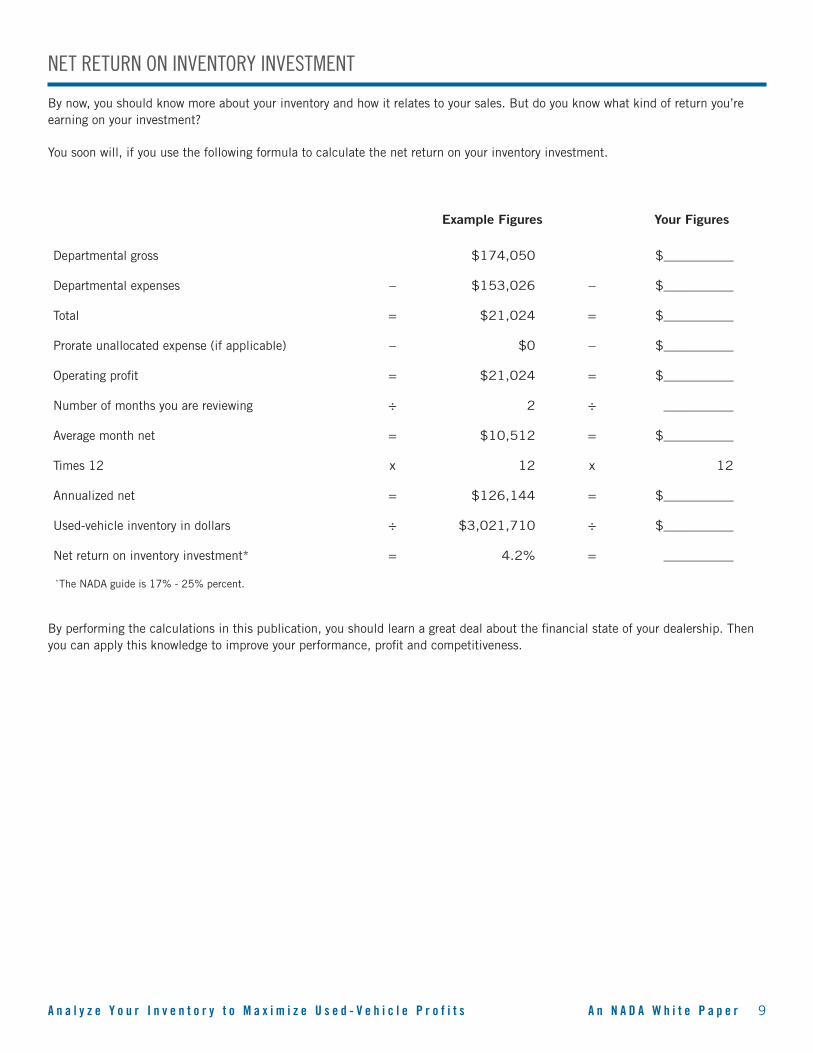
NET RETURN ON INVENTORY INVESTMENT
By now, you should know more about your inventory and how it relates to your sales. But do you know what kind of return you’re earning on your investment?
You soon will, if you use the following formula to calculate the net return on your inventory investment.
Example Figures Your Figures
Departmental gross $174,050 $__________
Departmental expenses – $153,026 – $__________
Total = $21,024 = $__________
Prorate unallocated expense (if applicable) – $0 – $__________
Operating profit = $21,024 = $__________
Number of months you are reviewing ÷ 2 ÷ __________
Average month net = $10,512 = $__________
Times 12 x 12 x 12
Annualized net = $126,144 = $__________
Used-vehicle inventory in dollars ÷ $3,021,710 ÷ $__________
Net return on inventory investment* = 4.2% = __________
By performing the calculations in this publication, you should learn a great deal about the financial state of your dealership. Then you can apply this knowledge to improve your performance, profit and competitiveness.
* The NADA guide is 17% - 25% percent.
A n a l y z e Y o u r I n v e n t o r y t o M a x i m i z e U s e d - V e h i c l e P r o f i t s A n N A D A W h i t e P a p e r 9 A n a l y z e Y o u r I n v e n t o r y t o M a x i m i z e U s e d - V e h i c l e P r o f i t s A n N A D A W h i t e P a p e r 10
ACKNOWLEDGMENTS
David Alexander Online Composite Specialist, NADA 20 Group [email protected]
Joel Dalbo Instructor, NADA Academy [email protected]
Patrick Manzi Senior Economist, NADA [email protected]
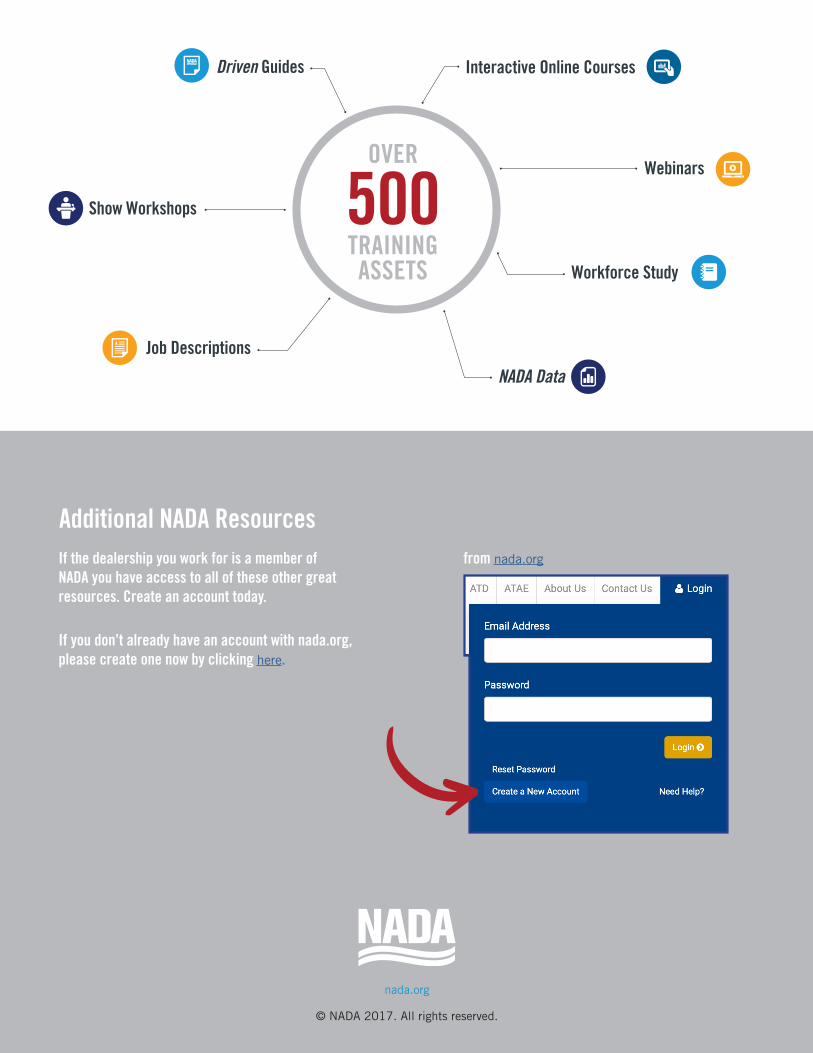
OVER
500 TRAINING ASSETS
Driven Guides Interactive Online Courses
Webinars
Show Workshops
Job Descriptions
NADA Data
Workforce Study
If the dealership you work for is a member of NADA you have access to all of these other great resources. Create an account today.
If you don’t already have an account with nada.org, please create one now by clicking here.
from nada.org
Additional NADA Resources
nada.org
© NADA 2017. All rights reserved.