
Analytical comparison between the performances of Field Oriented Control and Direct ... (81).pdf ·...
10
International Journal of Applied Engineering Research ISSN 0973-4562 Volume 12, Number 15 (2017) pp. 5289-5298 © Research India Publications. http://www.ripublication.com 5289 Analytical comparison between the performances of Field-Oriented Control and Direct Torque Control for Induction Motor Drives Nassira Medjadji 1 , Abdelkader Chaker 2 , Meabet Alia 3 1 Laboratory SCAMRE Department of Electrical Engineering, E.N.P Oran BP 1742 El’ M’naouer, Oran, Algeria. 2 Laboratory SCAMRE Department of Electrical Engineering, E.N.P Oran BP 1742 El’ M’naouer, Oran, Algeria. 3 Laboratory SCAMRE Department of Electrical Engineering, E.N.P Oran BP 1742 El’ M’naouer, Oran, Algeria. Abstract This study is a contribution to the field of high performance Induction Motor control , so we have done a deep comparative study between two famous Sensorless control systems: the first is the (D.T.C) and the second is the (F.O.C) , where we put the engine and the type of system controlled by the same conditions, ie the same operating conditions with simulations, we can fair between the two control systems mentioned earlier, by reaching the Pros and Cons for each method, through schemes of direct torque control and field- oriented control. Through the results obtained from schemas showing that both methods are very close in relation to the torque and the response speed to the tracking of the reference imposed by us, and we have observed that the (D.T.C) is somewhat better than (F.O.C) in terms of flow control and complexity Performance, and yet a we can't preference one of control systems from other, since the choice of any of the two methods is according to its agreement with the needs of the user. Keywords: Engine, DTC, FOC, microelectronic, power electronic, speed. INTRODUCTION Due to the large and rapid progress of the microelectronics in general and power electronics in particular, it has been possible to know many of the problems encountered by motors, with vector control strategies[1]. The basic plan in most scientific research is to control the speed of the engine by using the adjustable frequency transducer obtained by the transformers, so as to make the engines able to withstand the dynamic torque response that is often experienced while actually operating[2]. And since the advent of induction engines in 1985 they accompanied by the use of D.T.C direct torque control[3]. If the torque is rely and accurate, D.T.C is able to produce a rapid torque and control the flow, despite being considered a simple control system. D.T.C can also control the flow estimation. With respect to the two commands (D.T.C) and (F.O.C), many studies have been conducted concerning the comparison between them[4], the comparison results in simulations represented in the study graphs, showing that the (D.T.C) system Provides a better response torque under the same operating conditions. With (F.S.T.P) inverter statement instead of (S.S.T.P) inverter statement, an article contained an investigate of the differences parameters between the two strategies (D.T.C) and (F.O.C) is made by Mohamed[5]. The second method (S.S.T.P) is worse than other (F.S.T.P) due to the high cost, note that (F.S.T.P) mean four switch three phase and (S.S.T.P) mean six switch three phase The difference between the two methods was based on some of the criteria used frequently in the reality of engine operation of which: Normal operating conditions, sudden torque, reverse direction of rotation, variation of resistance motor. In this paper, we have conducted a comparative study between the two methods, (D.T.C) and (F.O.C), by incorporating new characteristics of motor, to verify the durability of the two methods against abrupt operating conditions changes, And whether, it is possible to maintain the permanent advantage of (F.O.C), if it is placed in these different conditions.
Transcript of Analytical comparison between the performances of Field Oriented Control and Direct ... (81).pdf ·...

International Journal of Applied Engineering Research ISSN 0973-4562 Volume 12, Number 15 (2017) pp. 5289-5298
© Research India Publications. http://www.ripublication.com
5289
Analytical comparison between the performances of Field-Oriented Control
and Direct Torque Control for Induction Motor Drives
Nassira Medjadji1, Abdelkader Chaker2, Meabet Alia3
1Laboratory SCAMRE Department of Electrical Engineering, E.N.P Oran BP 1742 El’ M’naouer, Oran, Algeria.
2Laboratory SCAMRE Department of Electrical Engineering, E.N.P Oran BP 1742 El’ M’naouer, Oran, Algeria.
3Laboratory SCAMRE Department of Electrical Engineering, E.N.P Oran BP 1742 El’ M’naouer, Oran, Algeria.
Abstract
This study is a contribution to the field of high performance
Induction Motor control , so we have done a deep
comparative study between two famous Sensorless control
systems: the first is the (D.T.C) and the second is the (F.O.C) ,
where we put the engine and the type of system controlled by
the same conditions, ie the same operating conditions with
simulations, we can fair between the two control systems
mentioned earlier, by reaching the Pros and Cons for each
method, through schemes of direct torque control and field-
oriented control.
Through the results obtained from schemas showing that both
methods are very close in relation to the torque and the
response speed to the tracking of the reference imposed by us,
and we have observed that the (D.T.C) is somewhat better
than (F.O.C) in terms of flow control and complexity
Performance, and yet a we can't preference one of control
systems from other, since the choice of any of the two
methods is according to its agreement with the needs of the
user.
Keywords: Engine, DTC, FOC, microelectronic, power
electronic, speed.
INTRODUCTION
Due to the large and rapid progress of the microelectronics in
general and power electronics in particular, it has been
possible to know many of the problems encountered by
motors, with vector control strategies[1].
The basic plan in most scientific research is to control the
speed of the engine by using the adjustable frequency
transducer obtained by the transformers, so as to make the
engines able to withstand the dynamic torque response that is
often experienced while actually operating[2].
And since the advent of induction engines in 1985 they
accompanied by the use of D.T.C direct torque control[3].
If the torque is rely and accurate, D.T.C is able to produce a
rapid torque and control the flow, despite being considered a
simple control system. D.T.C can also control the flow
estimation.
With respect to the two commands (D.T.C) and (F.O.C),
many studies have been conducted concerning the comparison
between them[4], the comparison results in simulations
represented in the study graphs, showing that the (D.T.C)
system Provides a better response torque under the same
operating conditions.
With (F.S.T.P) inverter statement instead of (S.S.T.P) inverter
statement, an article contained an investigate of the
differences parameters between the two strategies (D.T.C) and
(F.O.C) is made by Mohamed[5].
The second method (S.S.T.P) is worse than other (F.S.T.P)
due to the high cost, note that (F.S.T.P) mean four switch
three phase and (S.S.T.P) mean six switch three phase
The difference between the two methods was based on some
of the criteria used frequently in the reality of engine
operation of which:
Normal operating conditions, sudden torque, reverse direction
of rotation, variation of resistance motor.
In this paper, we have conducted a comparative study
between the two methods, (D.T.C) and (F.O.C), by
incorporating new characteristics of motor, to verify the
durability of the two methods against abrupt operating
conditions changes,
And whether, it is possible to maintain the permanent
advantage of (F.O.C), if it is placed in these different
conditions.

International Journal of Applied Engineering Research ISSN 0973-4562 Volume 12, Number 15 (2017) pp. 5289-5298
© Research India Publications. http://www.ripublication.com
5290
APPLICATION M.R.A.S WITH THE TWO
STRATEGIES (F.O.C) AND (D.T.C)
The mathematical model of induction engine
sqesd
sdssd dtdiRv
(1)
sdesq
sqssq dtd
iRv
(2)
rqslrd
rdr dtdiR
0 (3)
rdslrq
rqr dtd
iR
0 (4)
The flow in the two main engine parts is as follows:
rdmsdssd iLiL (5)
rqmsqssq iLiL (6)
sdmrdrrd iLiL (7)
sqmrqrrq iLiL (8)
The model of the two main engine sections is written by the
following factors:
sq
sd
s
s
rq
rd
sq
sd
rr
r
m
rrr
m
rrs
mr
rs
m
rs
s
rrs
m
rrs
m
rs
s
rq
rd
sq
sd
vv
L
L
ii
Tp
TL
pTT
LTLL
LLL
LTL
RLL
LTLL
LTL
R
dtddtd
idtd
idtd
00
00
10
01
10
10
.1
0
.01
(9)
Electromagnetic momentum and speed of rotor can be written
with the following relationships:
)(2
3sdrqsqrd
r
mem ii
JLLpT (10)
lremr T
Jp
JBT
Jp
dtd
(11)
The roll resistance of the two main motor parts in the
mathematical relationship is represented by the following
symbols respectively: sR and rR ;
L , sL and rL are the stator, mutual and rotor inductances;
p : Number of pole pairs;
e , r and sl are the synchronous, rotor and slip speed in
electrical rad/s;
sdv , sqv , sdi , sqi , rd and rq are stator voltage, stator
current and rotor flux d-q components in the rotor flux
oriented reference frame; emT and lT are the electromagnetic
torque and the load torque;
J and B are the motor inertia and viscous friction
coefficient.
Under the rotor flux orientation conditions the rotor flux is
aligned to the d-axis of the d-q rotor flux oriented frame
calculated by:
0rd (12)
sdmrq iL (13)
The slip frequency can be defined as[6]:
*
*1
sd
sq
rresl i
iT
(14)
The electromagnetic torque calculate by:
sqtsqrr
mem iKi
LLpT
2
3 (15)
tK is the torque constant.
Figure 1: A diagram showing the composition of the control
components used in the study.
International Journal of Applied Engineering Research ISSN 0973-4562 Volume 12, Number 15 (2017) pp. 5289-5298
© Research India Publications. http://www.ripublication.com
5291
Explain the strategy of D.T.C
One of the objectives of direct torque control is to minimize
the switching frequency of the inverter. And on the other is
that the operation does not require a constant DC voltage at
the input of the inverter. An economical smoothing capacity is
thus saved.
The stator flux calculate by:
ssss dtdIRV (16)
The electromagnetic torque represent by [7], [8]:
sinrsrsem kkT
(17)
So that both know :
s : is the vector of stator flux;
r : is the vector of rotor flux;
: is the angle between the vectors of stator and
rotor flux.
Demonstration of the simplification method:
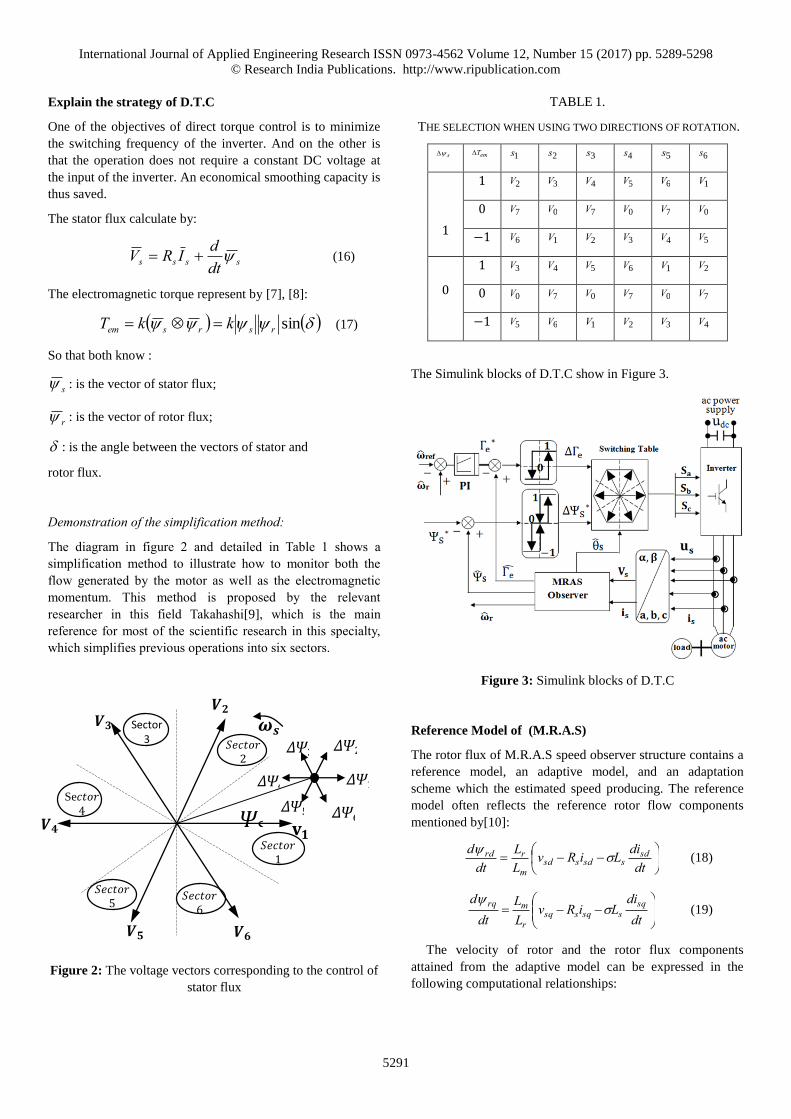
The diagram in figure 2 and detailed in Table 1 shows a
simplification method to illustrate how to monitor both the
flow generated by the motor as well as the electromagnetic
momentum. This method is proposed by the relevant
researcher in this field Takahashi[9], which is the main
reference for most of the scientific research in this specialty,
which simplifies previous operations into six sectors.
Figure 2: The voltage vectors corresponding to the control of
stator flux
TABLE 1.
THE SELECTION WHEN USING TWO DIRECTIONS OF ROTATION.
s emT 1s 2s 3s 4s 5s 6s
1
1 2V 3V 4V 5V 6V 1V
0 7V 0V 7V 0V 7V 0V
−1 6V 1V 2V 3V 4V 5V
0
1 3V 4V 5V 6V 1V 2V
0 0V 7V 0V 7V 0V 7V
−1 5V 6V 1V 2V 3V 4V
The Simulink blocks of D.T.C show in Figure 3.
Figure 3: Simulink blocks of D.T.C
Reference Model of (M.R.A.S)
The rotor flux of M.R.A.S speed observer structure contains a
reference model, an adaptive model, and an adaptation
scheme which the estimated speed producing. The reference
model often reflects the reference rotor flow components
mentioned by[10]:
dtdiLiRv
LL
dtd sd
ssdssdm
rrd
(18)
dtdi
LiRvLL
dtd sq
ssqssqr
mrq
(19)
The velocity of rotor and the rotor flux components
attained from the adaptive model can be expressed in the
following computational relationships:
𝑽𝟑
𝑽𝟐
𝑽𝟒
𝐯𝟏
𝑽𝟓
𝑽𝟔
𝝎𝒔
𝛹𝑆
𝛥𝛹3 𝛥𝛹2
𝛥𝛹1
𝛥𝛹6 𝛥𝛹5 𝛥𝛹4
𝑆𝑒𝑐𝑡𝑜𝑟 2
Sector 3
Se𝑐𝑡𝑜𝑟 4
𝑆𝑒𝑐𝑡𝑜𝑟 5
𝑆𝑒𝑐𝑡𝑜𝑟 6
𝑆𝑒𝑐𝑡𝑜𝑟 1
International Journal of Applied Engineering Research ISSN 0973-4562 Volume 12, Number 15 (2017) pp. 5289-5298
© Research India Publications. http://www.ripublication.com
5292
rqrrrdsdmrd
r TiLdt
dT
ˆˆˆˆ
(20)
rdrrrqsqmrq
r TiLdt
dT
ˆˆˆ
ˆ (21)
The MRAS-based schemes described previously contain a
reference model and an adaptive model. Nonetheless, more
exactness and robustness can be accomplished if the
mathematical model is partially substituted by a robust
(A.N.N).
DISCUSSION OF THE RESULTS
After the production of the schemes of the two methods
previously studied theoretically (F.O.C) and (D.T.C), after
treatment and calculations using the program simulink listed
in the math program Mathlab. And based on Table 2 which
shows the engine data adopted in the simulators.
The primary objective of the first strategy (D.T.C) is the
direct control of the torque and flux produced by the motor,
by means of voltage vector provided by the inverter. In order
to control the torque in two directions, we need a hysteresis
controller, and we can also need to raise and lower the
electromagnetic torque of the engine, as well as maintain its
value constant.
While the previously mentioned second strategy (F.O.C)
enables us to control and estimate the motor speed.
As we said earlier, the Simulink program can test the
durability of both methods:
Steady state and transient behaviors
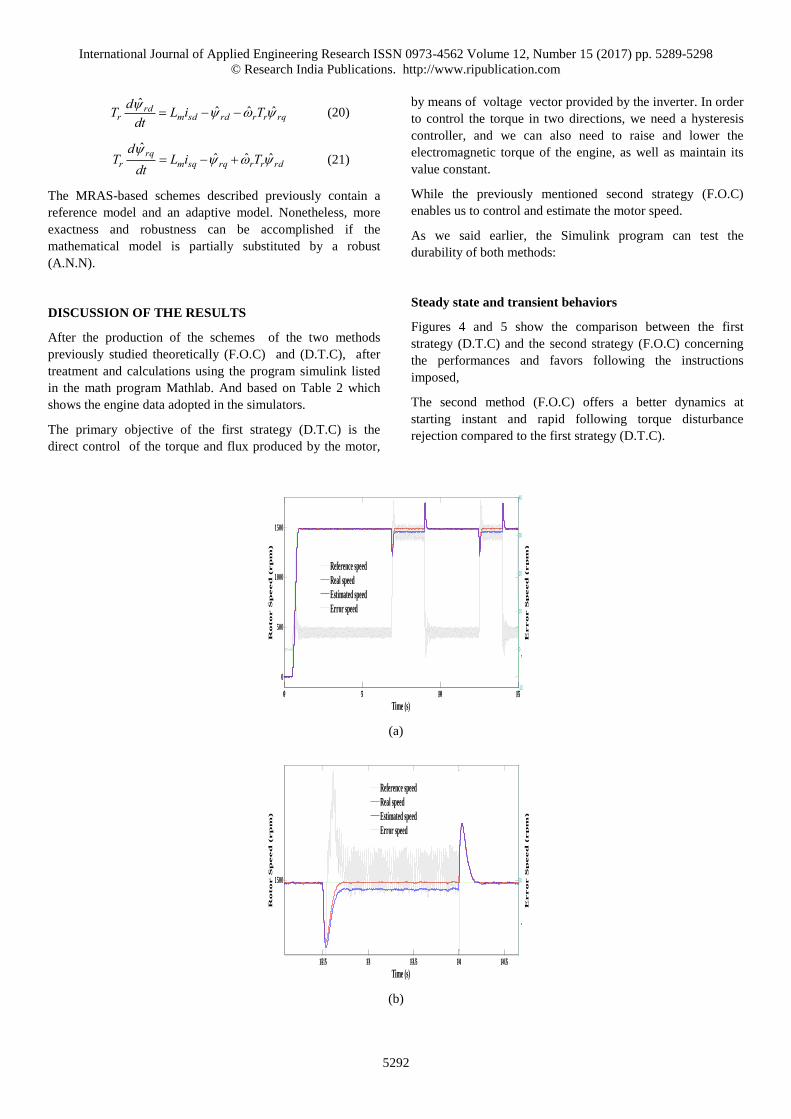
Figures 4 and 5 show the comparison between the first
strategy (D.T.C) and the second strategy (F.O.C) concerning
the performances and favors following the instructions
imposed,
The second method (F.O.C) offers a better dynamics at
starting instant and rapid following torque disturbance
rejection compared to the first strategy (D.T.C).
(a)
(b)
0 5 10 15
0
500
1000
1500
Time (s)
Ro
to
r S
peed
(rp
m)
0 5 10 15-10
0
10
20
30
40
Reference speed
Real speed
Estimated speed
Error speed
Erro
r S
peed
(rp
m)
12.5 13 13.5 14 14.5
1500
Time (s)
Ro
to
r S
peed
(rp
m)
12.5 13 13.5 14 14.5
30
Reference speed
Real speed
Estimated speed
Error speed
Erro
r S
peed
(rp
m)

International Journal of Applied Engineering Research ISSN 0973-4562 Volume 12, Number 15 (2017) pp. 5289-5298
© Research India Publications. http://www.ripublication.com
5293
(c)
(d)
Figure 4: Simulated starting responses of the proposed DTC scheme for 1M drive with load applied: (a) speed, (c) zoom of
speed, (c) current sdi , sqi and emT , and (d) zoom of currents and torque.
(a)
0 5 10 15
0
20
Time (s)
Sta
to
r C
urren
ts (A
)
0 5 10 15-10
0
10
00.51
Tem
(N
m)
Electromagnetic
Torque
Stator
Currents
6.82 6.84 6.86 6.88 6.9 6.92 6.94 6.96 6.98 7 7.02
0
Time (s)
Sta
to
r C
urren
ts (
A)
6.82 6.84 6.86 6.88 6.9 6.92 6.94 6.96 6.98 7 7.02
0
00.51
Tem
(N
m)
Electromagnetic
Torque
Stator
Currents
0 5 10 15
0
500
1000
1500
Sp
eed
(rp
m)
Time (s)
0 5 10 15-100
-50
0
50
100
150
Erro
r sp
eed
(rp
m)
0 5 10 15-100
-50
0
50
100
150
0 5 10 15-100
-50
0
50
100
150
Estimated speed
Reference speed
Real speed
Error speed

International Journal of Applied Engineering Research ISSN 0973-4562 Volume 12, Number 15 (2017) pp. 5289-5298
© Research India Publications. http://www.ripublication.com
5294
(b)
(c)
Figure 5: Simulated starting responses of the proposed FOC scheme for 1M drive with load applied: (a) speed, (b) zoom of
speed, (c) current sdi , sqi and emT , and (c) zoom of currents and torque.
The results obtained from the Simulink program in the form
of schemas, showed that (D.T.C) form immediately
establishment compared to the second strategy (F.O.C), and
this basically increases the dynamics of the device,
(D.T.C) offers a more fluctuating current when starting out
compared to the (F.O.C) which is better in terms of
oscillation, because (D.T.C) does not contain the regulation
loops of the current that are available in the (F.O.C),
Study of the effects of changing the direction of rotation
and application of sudden torque at certain moment.
The ripples formed on the drawings obtained in Figures 6
and 7 represent the velocity and torque obtained by the
(D.T.C) and (F.O.C) methods. We also notice that we have
changed the direction of rotation from 1000 rpm to -1000 rpm
at moments t=0.3s, 8 s, 16.2 s 19.5 s and 27s we also applied
a charges in those moments.
The amplitude ripples of the torque in the graph of (F.O.C)
are better than amplitude ripples obtained by the (D.T.C).
(a)
11.4 11.6 11.8 12 12.2 12.4 12.6 12.8 13
500
1000
1500
Sp
eed
(rp
m)
Time (s)
0 5 10 15-100
-50
0
50
100
150
Erro
r sp
eed
(rp
m)
0 5 10 15-100
-50
0
50
100
150
11.4 11.6 11.8 12 12.2 12.4 12.6 12.8 13
0
50
100
Estimated speed
Reference speed
Real speed
Error speed
0 5 10 15
-4
-2
0
2
4
6
isd
, isq
(A
)
Time (s)
0 5 10 15-1
0
1
2
Tem
(N
m)
0 5 10 15-0.2
0
0.2
0.4
0.6
0.8
1
1.2
1.4
0 5 10 15-0.2
0
0.2
0.4
0.6
0.8
1
1.2
1.4
0 5 10 15-0.2
0
0.2
0.4
0.6
0.8
1
1.2
1.4
isdest
isdmes
isqest
isqmes
Tem
0 5 10 15 20 25 30
-1000
-500
0
500
1000
Time (s)
Ro
to
r S
peed
(rp
m)
0 5 10 15 20 25 30-20
-10
0
10
20
30
40
Reference Speed
Real Speed
Estimated Speed
Error Speed
Erro
r S
peed
(rp
m)

International Journal of Applied Engineering Research ISSN 0973-4562 Volume 12, Number 15 (2017) pp. 5289-5298
© Research India Publications. http://www.ripublication.com
5295
(b)
(c)
(d)
Figure 6: Speed, torque and stator current responses scheme
at medium speed with direction change and torque applied
from the (D.T.C) strategy:
(a) speed, (d) zoom of speed, (c) current , (d) zoom of currents
and torque.
(a)
(b)
(c)
18 19 20 21 22 23 24
-500
0
500
1000
Time (s)
Ro
to
r S
peed
(rp
m)
18 19 20 21 22 23 24
0
10
20
30
Reference Speed
Real Speed
Estimated Speed
Error Speed
Erro
r S
peed
(rp
m)
0 5 10 15 20 25 30
-5
0
5
Time (s)
Sta
to
r C
urren
ts (A
)
0 5 10 15 20 25 30-20
-10
0
10
20
Tem
(N
m)
Electromagnetic
Torque
Stator
Currents
4.8 4.85 4.9 4.95 5 5.05 5.1 5.15 5.2 5.25 5.3
0
5
Time (s)
Sta
to
r C
urren
ts (A
)
4.8 4.85 4.9 4.95 5 5.05 5.1 5.15 5.2 5.25 5.3
0
10
Tem
(N
m)
Stator
Currents
Electromagnetic
Torque
0 5 10 15 20 25 30-1500
-1000
-500
0
500
1000
1500
Sp
eed
(rp
m)
Time (s)
0 5 10 15 20 25 30-400
-300
-200
-100
0
100
200
Error s
peed
(rp
m)
0 5 10 15 20 25 30-400
-300
-200
-100
0
100
200
0 5 10 15 20 25 30-400
-300
-200
-100
0
100
200
Estimated speed
Reference speed
Real speed
Error speed
4.5 5 5.5 6 6.5 7 7.5 8 8.5 9
500
1000
Sp
eed
(rp
m)
Time (s)
0 5 10 15 20 25 30-400
-300
-200
-100
0
100
200
Error s
peed
(rp
m)
0 5 10 15 20 25 30-400
-300
-200
-100
0
100
200
4.5 5 5.5 6 6.5 7 7.5 8 8.5 9
0
100
Estimated speed
Reference speed
Real speed
Error speed
0 5 10 15 20 25 30-10
0
10
isd
, isq
(A
)
Time (s)
0 5 10 15 20 25 30-1
0
1
Tem
(N
m)
0 5 10 15 20 25 30-1
0
1
0 5 10 15 20 25 30-1
0
1
0 5 10 15 20 25 30-1
0
1
Temest
isdmes
isdest
isqest
isqmes

International Journal of Applied Engineering Research ISSN 0973-4562 Volume 12, Number 15 (2017) pp. 5289-5298
© Research India Publications. http://www.ripublication.com
5296
(d)
Figure 7: Speed, torque and stator current responses scheme
at medium speed with direction change and torque applied
from the (F.O.C) strategy:
(a) speed, (d) zoom of speed, (c) current , (d) zoom of currents
and torque.
The consequences of reversing the direction of low-
velocity rotation
The schematics obtained by simulation accurately show how
the process performs at low speeds.
Figure. 6.a. and 7.a show the results obtained by simulators
while reversing the direction of rotation from 100 to 100 -
where this change occurred in two stages, showing that the
speed accurately follows the reference.
Figure 7,b,c show the difference in currents of the stator .
Figure 8 shows the performance of speed control simulation
In Figure 8.a, Figure 9.a and the stator currents estimation in
Figure 8.c and Figure 9.c.
At a reference speed of 100 rpm, the steady state error is
gotten. At these speeds and below, the M.R.A.S based A.N.N
sensorless scheme fails to provide stable operation giving
large oscillations for the two techniques presented.
(a)
(b)
(c)
(d)
Figure 8: Torque, estimated speed, and stator current
responses of DTC scheme at low speed:
(a) speed, (d) zoom of speed, (c) current sdi , sqi and emT , and
(c) zoom of currents and torque.
16 16.5 17 17.5 18 18.5 19 19.5 20 20.5
0
isd
, isq
(A
)
Time (s)
0 5 10 15 20 25 30-1
0
1
Tem
(N
m)
0 5 10 15 20 25 30-1
0
1
0 5 10 15 20 25 30-1
0
1
16 16.5 17 17.5 18 18.5 19 19.5 20 20.5
0
Temest
isdmes
isdest
isqest
isqmes
0 2 4 6 8 10 12 14 16 18 20
0
Time (s)
Rotor S
peed
(rp
m)
0 2 4 6 8 10 12 14 16 18 20-10
0
10
Reference Speed
Real Speed
Estimated Speed
Error Speed
Error S
peed
(rp
m)
2 2.5 3 3.5 4 4.5
0
Time (s)
Ro
to
r S
peed
(rp
m)
2 2.5 3 3.5 4 4.5
0
Reference Speed
Real Speed
Estimated Speed
Error Speed
Erro
r S
peed
(rp
m)
0 2 4 6 8 10 12 14 16 18 20
-2
-1
0
1
2
Time (s)
Sta
to
r C
urren
t (A
)
0 2 4 6 8 10 12 14 16 18 20-20
-10
0
10
20
Tem
(N
m)
Electromagnetic
Torque
Stator
Currents
2.4 2.6 2.8 3 3.2 3.4 3.6
-1
0
1
Time (s)
Sta
to
r C
urren
t (A
)
2.4 2.6 2.8 3 3.2 3.4 3.6
-10
0
10
Tem
(N
m)
Electromagnetic
Torque
Stator
Currents

International Journal of Applied Engineering Research ISSN 0973-4562 Volume 12, Number 15 (2017) pp. 5289-5298
© Research India Publications. http://www.ripublication.com
5297
(a)
(b)
(c)
(d)
Figure 9: The Simulation results responses of FOC scheme
with the proposed MRAS method at low speed:
(a) speed, (d) zoom of speed, (c) current sdi , sqi and emT , and
(c) zoom of currents and torque.
CONCLUSION
We have prepared this study to make a new comparison
between the two methods (D.T.C) and (F.O.C) under the
influence of new factors that have not been used before
judging one of these two methods in terms Performance and
control.
Despite the many changes we have imposed on both methods,
such as changing the direction of speed and imposing certain
loads at specific times, as well as the use of high share speeds
and the use of Low speed, on the other hand, we found that
the method (F.O.C) is better in terms of performance and in
terms of the speed of tracking the reference speed, but there is
a slender advantage of the (D.T.C) comparative to the (F.O.C)
for dynamic flow control performance.
Despite (D.T.C) may be desirable for high dynamic
applications; but it displays a ripple and a more fluctuating
current torque.
As researchers, we have given an overview of an adaptation
of the association M.R.A.S observer-D.T.C and adaptive
M.R.A.S observer-F.O.C.
This combination makes it more robust and stable induction
motor based D.T.C and F.O.C.
TABLE 2: THE PARAMETERS OF INDUCTION MOTOR
𝐶𝑜𝑚𝑝𝑜𝑛𝑒𝑛𝑡𝑠 𝑣𝑎𝑙𝑢𝑒𝑠
𝑆𝑡𝑎𝑡𝑜𝑟 𝑟𝑒𝑠𝑖𝑠𝑡𝑎𝑛𝑐𝑒 𝑅𝑠 = 11.8𝛺
𝑅𝑜𝑡𝑜𝑟 𝑟𝑒𝑠𝑖𝑠𝑡𝑎𝑛𝑐𝑒 𝑅𝑟 = 11.3085𝛺
𝑆𝑡𝑎𝑡𝑜𝑟
/𝑟𝑜𝑡𝑜𝑟 𝑖𝑛𝑑𝑢𝑐𝑡𝑎𝑛𝑐𝑒
𝐿𝑠 = 𝐿𝑟 = 0.5568𝐻
𝑀𝑢𝑡𝑢𝑎𝑙 𝑖𝑛𝑑𝑢𝑐𝑡𝑎𝑛𝑐𝑒 𝐿𝑚 = 0.6585𝐻
𝑀𝑜𝑚𝑒𝑛𝑡 𝑜𝑓 𝑖𝑛𝑒𝑟𝑡𝑖𝑎 𝐽 = 0.0020 𝐾𝑔. 𝑚2
𝑉𝑖𝑠𝑐𝑜𝑢𝑠 𝑓𝑟𝑖𝑐𝑡𝑖𝑜𝑛 𝑓 = 3.1165𝑒 − 004𝑁. 𝑚/𝑟𝑎𝑑/𝑠𝑒𝑐
𝑁𝑢𝑚𝑏𝑒𝑟 𝑜𝑓 𝑝𝑜𝑙𝑒 𝑝𝑎𝑖𝑟𝑠 𝑝 = 2
REFERENCES
[1]. M.P. Kazmierkowski, L.G. Franquelo, J. Rodriguez,
M. Perez, and J.I. Leon, “High-performance motor
drives”, IEEE Industrial Electronics Magazine 5 (4),
6–26, 2011.
[2]. K.Sedhuraman, S.Himavathi and
A.Muthuramalingam, Performances Comparison of
Neural Architectures for On-Line Speed Estimation
in Sensorless IM Drives, World Academy of Science,
0 2 4 6 8 10 12 14 16 18 20
-100
-50
0
50
100
Time (s)
Motor s
peed
(rp
m)
Estimated speed
Reference speed
Actual speed
2 2.5 3 3.5 4 4.5-100
0
100
Ro
to
r S
peed
(rp
m)
Time (s)
0 2 4 6 8 10 12 14 16 18 20-100
-50
0
50
100
Erro
r S
peed
(rp
m)
0 2 4 6 8 10 12 14 16 18 20-100
-50
0
50
100
2 2.5 3 3.5 4 4.5
-50
0
50Real Speed
Reference Speed
Estimated Speed
Error Speed
0 2 4 6 8 10 12 14 16 18 20
-0.8-0.6-0.4-0.2
00.20.40.60.8
isd
, isq
(A
)
Time (s)
0 2 4 6 8 10 12 14 16 18 20-0.4
-0.3
-0.2
-0.1
0
0.1
0.2
0.3
0.4
Tem
(N
m)
0 2 4 6 8 10 12 14 16 18 20-0.4
-0.3
-0.2
-0.1
0
0.1
0.2
0.3
0.4
0 2 4 6 8 10 12 14 16 18 20-0.4
-0.3
-0.2
-0.1
0
0.1
0.2
0.3
0.4
0 2 4 6 8 10 12 14 16 18 20-0.4
-0.3
-0.2
-0.1
0
0.1
0.2
0.3
0.4
Tem
isqmes
isqest
isdest
isdmes
0.5 1 1.5 2 2.5 3
-0.8
-0.6
-0.4
-0.2
0
0.2
0.4
0.6
0.8
isd
, isq
(A
)
Time (s)
0 2 4 6 8 10 12 14 16 18 20-0.4
-0.3
-0.2
-0.1
0
0.1
0.2
0.3
0.4
Tem
(N
m)
0 2 4 6 8 10 12 14 16 18 20-0.4
-0.3
-0.2
-0.1
0
0.1
0.2
0.3
0.4
0 2 4 6 8 10 12 14 16 18 20-0.4
-0.3
-0.2
-0.1
0
0.1
0.2
0.3
0.4
0.5 1 1.5 2 2.5 3
-0.3
-0.2
-0.1
0
0.1
0.2
0.3
Tem
isqmes
isqest
isdest
isdmes

International Journal of Applied Engineering Research ISSN 0973-4562 Volume 12, Number 15 (2017) pp. 5289-5298
© Research India Publications. http://www.ripublication.com
5298
Engineering and Technology, Iss. 60, Dec 2011.
[3]. G.S. Buja M.P. KazmierKowski,Direct torque control of PWM inverter-fed AC motors - a survey Browse journals and Magazines , Volume.51, Issue 4, august, 2004.
[4]. Murtuza Y Saifee1, Hitesh R Khunt2, Ankit B
Lehru3, Niraj B Danidhariya4, Dhaval A Vora5
Comparative Analysis of DTC & FOC of Induction
Motor, International Journal of Advance Research in Engineering, Volume 3, Issue 4, April -2016
[5]. Mohamed S. Zaky and Mohamed K. Metwaly
Performance Investigation of a Four-Switch Three-
Phase Inverter-Fed IM Drives at Low Speeds Using
Fuzzy Logic and PI Controllers Browse Journals &
Magazines Volume: 32 Issue 5, june-2016
[6]. M.Hechlef ,and M.Zrikat, control direct torque
application of MRAS , department of g. electrique ENPO, 2009.
[7]. Y.Zhang, J. Zho, Z. Zhao, W. Xu, D.G. Dorrell, “An
Improved Direct Torque Control for Three-Level
Inverter-Fed Induction Motor Sensorless Drive”,
IEEE T Power Electr, vol. 27, no. 3, pp. 1502-1513,
Mar., 2012.
[8]. I. Takahashi, T. Noguchi, A New Quick-Response
and High-Efficiency Control Strategy for an
Induction Motor. IEEE Trans. Ind. Application., 22(5), p. 820-827, 1986.
[9]. K. Negadi, A. Mansouri, F. Marignetti, M. Touam,
An MRAS Based Estimation Method with Artificial
Neural Networks for High Performance Induction
Motor Drives and its Experimentation, International Review of Automatic Control (IREACO),Vol 7,N°2, Mars, 2014.
[10]. Q. Gao, C. S. Staines, G. M. Asher, and M. Sumner,
Sensorless Speed Operation of Cage Induction Motor
Using Zero Drift Feedback Integration with MRAS
Observer, in Proc. European Conference on Power Electronics and Applications, 2005.