Analytica Chimica Acta - University of...
9
Analytica Chimica Acta 803 (2013) 47–55 Contents lists available at ScienceDirect Analytica Chimica Acta j ourna l ho mepage: www.elsevier.com/locate/aca Electrochemical and microfabrication strategies for remotely operated smart chemical sensors: Application of anodic stripping coulometry to calibration-free measurements of copper and mercury Mohamed M. Marei a , Thomas J. Roussel b , Robert S. Keynton b , Richard P. Baldwin a,∗ a Chemistry Department, University of Louisville, Louisville, KY, USA b Bioengineering Department, University of Louisville, Louisville, KY, USA h i g h l i g h t s • A calibration-free thin-layer stopped-flow electroanalysis platform is described. • Performance characterized by visual- ization and electrochemically. • Exhaustive electrolysis of cell contents is complete in approxi- mately 1 min. • Excellent run to run reproducibility and day to day repeatability. • Anodic stripping coulometry of cop- per and copper/mercury mixtures is demonstrated. g r a p h i c a l a b s t r a c t a r t i c l e i n f o Article history: Received 15 May 2013 Received in revised form 26 June 2013 Accepted 29 June 2013 Available online 5 July 2013 Keywords: Anodic stripping coulometry Thin-layer cell Unattended remote sensors Microfabrication Copper Mercury a b s t r a c t Remote unattended sensor networks are increasingly sought after to monitor the drinking water dis- tribution grid, industrial wastewater effluents, and even rivers and lakes. One of the biggest challenges for application of such sensors is the issue of in-field device calibration. With this challenge in mind, we report here the use of anodic stripping coulometry (ASC) as the basis of a calibration-free micro-fabricated electrochemical sensor (CF-MES) for heavy metal determinations. The sensor platform consisted of a photo-lithographically patterned gold working electrode on SiO 2 substrate, which was housed within a custom stopped-flow thin-layer cell, with a total volume of 2–4 L. The behavior of this platform was characterized by fluorescent particle microscopy and electrochemical studies utilizing Fe(CN) 6 3−/4− as a model analyte. The average charge obtained for oxidation of 500 M ferrocyanide after 60 s over a 10 month period was 176 C, corresponding to a volume of 3.65 L (RSD = 2.4%). The response of the platform to copper concentrations ranging from 50 to 7500 ppb was evaluated, and the ASC results showed a linear dependence of charge on copper concentrations with excellent reproducibility (RSD ≤ 2.5%) and accuracy for most concentrations (≤5–10% error). The platform was also used to determine copper and mercury mixtures, where the total metallic content was measurable with excellent reproducibility (RSD ≤ 4%) and accuracy (≤6% error). © 2013 Elsevier B.V. All rights reserved. ∗ Corresponding author. Tel.: +1 502 852 5892. E-mail address: [email protected] (R.P. Baldwin). 1. Introduction At present, water quality monitoring for heavy metal con- taminants is usually handled by costly and relatively complex instruments such as ICP-MS, GC/LC–MS, and AAS [1]. These instru- ments provide a high level of performance in terms of sensitivity and selectivity but require operation by trained personnel, usually 0003-2670/$ – see front matter © 2013 Elsevier B.V. All rights reserved. http://dx.doi.org/10.1016/j.aca.2013.06.047
-
Upload
hoangkhanh -
Category
Documents
-
view
216 -
download
0
Transcript of Analytica Chimica Acta - University of...

Eoc
Ma
b
h
•
•
•
•
•
a
ARRAA
KATUMCM
0h
Analytica Chimica Acta 803 (2013) 47– 55
Contents lists available at ScienceDirect
Analytica Chimica Acta
j ourna l ho mepage: www.elsev ier .com/ locate /aca
lectrochemical and microfabrication strategies for remotelyperated smart chemical sensors: Application of anodic strippingoulometry to calibration-free measurements of copper and mercury
ohamed M. Mareia, Thomas J. Rousselb, Robert S. Keyntonb, Richard P. Baldwina,∗
Chemistry Department, University of Louisville, Louisville, KY, USABioengineering Department, University of Louisville, Louisville, KY, USA
i g h l i g h t s
A calibration-free thin-layerstopped-flow electroanalysisplatform is described.Performance characterized by visual-ization and electrochemically.Exhaustive electrolysis of cellcontents is complete in approxi-mately 1 min.Excellent run to run reproducibilityand day to day repeatability.Anodic stripping coulometry of cop-per and copper/mercury mixtures isdemonstrated.
g r a p h i c a l a b s t r a c t
r t i c l e i n f o
rticle history:eceived 15 May 2013eceived in revised form 26 June 2013ccepted 29 June 2013vailable online 5 July 2013
eywords:nodic stripping coulometryhin-layer cellnattended remote sensors
a b s t r a c t
Remote unattended sensor networks are increasingly sought after to monitor the drinking water dis-tribution grid, industrial wastewater effluents, and even rivers and lakes. One of the biggest challengesfor application of such sensors is the issue of in-field device calibration. With this challenge in mind, wereport here the use of anodic stripping coulometry (ASC) as the basis of a calibration-free micro-fabricatedelectrochemical sensor (CF-MES) for heavy metal determinations. The sensor platform consisted of aphoto-lithographically patterned gold working electrode on SiO2 substrate, which was housed within acustom stopped-flow thin-layer cell, with a total volume of 2–4 �L. The behavior of this platform wascharacterized by fluorescent particle microscopy and electrochemical studies utilizing Fe(CN)6
3−/4− as amodel analyte. The average charge obtained for oxidation of 500 �M ferrocyanide after 60 s over a 10
icrofabricationopperercury
month period was 176 �C, corresponding to a volume of 3.65 �L (RSD = 2.4%). The response of the platformto copper concentrations ranging from 50 to 7500 ppb was evaluated, and the ASC results showed a lineardependence of charge on copper concentrations with excellent reproducibility (RSD ≤ 2.5%) and accuracyfor most concentrations (≤5–10% error). The platform was also used to determine copper and mercurymixtures, where the total metallic content was measurable with excellent reproducibility (RSD ≤ 4%) and
accuracy (≤6% error).∗ Corresponding author. Tel.: +1 502 852 5892.E-mail address: [email protected] (R.P. Baldwin).
003-2670/$ – see front matter © 2013 Elsevier B.V. All rights reserved.ttp://dx.doi.org/10.1016/j.aca.2013.06.047
© 2013 Elsevier B.V. All rights reserved.
1. Introduction
At present, water quality monitoring for heavy metal con-
taminants is usually handled by costly and relatively complexinstruments such as ICP-MS, GC/LC–MS, and AAS [1]. These instru-ments provide a high level of performance in terms of sensitivityand selectivity but require operation by trained personnel, usually
4 Chim
i“tsnteio[ttlsw
mswepoeeds
swdantnsbistdfvcimp
btesaiakmsw(d1
Q
wt
8 M.M. Marei et al. / Analytica
n a central laboratory [2]. This approach also relies on selectedgrab sampling” where samples are collected on-site and thenransported to the lab for analysis. The result, of course, is a “snap-hot” of the water quality at a particular time and place which mayot be representative of other times and places in the over-all sys-em. Alternatively there are numerous portable instruments, oftenlectrochemical in nature, which permit measurements to be maden the field [3–7]. This is a promising approach, particularly in viewf the rapid advances in fabrication of micro total analysis systems8]. However, these are normally operated by a suitably trainedechnician and still offer the same type of periodic “snapshot” moni-oring provided by the grab sampling approach. This is an importantimitation, and clearly it would be desirable to develop a sensingystem that enables continuous, on-site operation on a 24/7 basisith minimal direct operator intervention.
At present, there do exist some commercially available instru-ent systems intended for continuous water monitoring [9]. These
ystems, which are usually intended for use in monitoring drinkingater distribution grids, are typically large in size and relatively
xpensive and require direct access to a conventional electricalower source. Furthermore, the analytical measurements carriedut are usually non-specific in nature – e.g., conductivity, turbidity,tc. – and therefore provide little or no direct insight into the pres-nce of individual metal species. As a consequence, this approachoes not seem to offer a very attractive solution for real-timeensing of heavy metals in drinking or wastewater systems.
It seems that a more promising approach is the development ofimple yet reliable sensors that can be constructed in large quantity,ith a high degree of reproducibility, and at an affordable cost. Suchevices could be placed permanently on-site to create an appropri-te sensor network and interfaced to a wireless communicationsetwork for control and monitoring purposes [10,11]. In order forhis goal to be practically achievable, advances are required inumerous technical areas. However, the focal point of such a mea-urement network is, of course, the sensor itself which needs toe able to operate accurately and reliably for extended periods but
ndependently without the need for constant maintenance or directupervision. Unfortunately, most analysis methods for metals failo meet this critical requirement. Even if miniaturized and field-eployable, nearly all instruments require considerable attentionrom a suitably skilled technician for proper operation. For example,irtually all analytical instrumentation, including electrochemi-ally based devices, require frequent calibration, even when locatedn a pristine laboratory setting [2,12]. When deployed for long
easurement periods in an uncontrolled field environment (tem-erature, humidity, etc.), calibration issues may be overwhelming.
With this in mind, we have chosen to investigate a well-knownut infrequently used electroanalysis technique – coulometry –hat, in principle, should not require calibration [12]. Nearly alllectroanalysis methods are sensitive to a variety of variablesuch as temperature, pH, electrolyte concentration, and electroderea and therefore provide reliable quantitative information onlyf these variables are suitably controlled and the experiment isdequately calibrated by comparison to standard solutions ofnown concentration. This is certainly true for nearly all com-only employed voltammetric and potentiometric measurement
chemes. The exception to this is coulometric measurements inhich a sample is electrolyzed and the resulting electrical charge
current integrated over time) is determined. Such processes areescribed by Faraday’s Law, first proposed by Michael Faraday in834:
= n × F × N (1)
here Q is the measured charge in coulombs, n is the # of elec-rons involved in the redox process, F is the Faraday constant
ica Acta 803 (2013) 47– 55
(96,485 C mole−1), and N is the number of moles of sample specieselectrolyzed. An alternative form of the equation is:
Q = n × F × C × V (2)
where C represents the analyte concentration and V the samplevolume. Clearly, n and F are constants for any given redox process.So, as long as the redox reaction (n) is known, the sample volume(V) is known, and the electrolysis has proceeded to 100% comple-tion, the associated charge is an absolute measure of the analyteconcentration – regardless of prevailing experimental conditions.The only requirements are that (1) the analyte is electrochemicallyactive and (2) sample pretreatment methods (e.g., acidificationfor cationic trace metal analysis) can be practically achieved inthe field. EPA regulated contaminants that can be monitored elec-trochemically include lead, mercury, cadmium, arsenic, chemicaloxygen demand, and many others. Variations in temperature or pHor even changes in electrode area due to fouling are irrelevant tothe determination as long as the electrolysis is given sufficient timeto proceed to completion.
Some coulometry-based analysis concepts have been reportedin recent years. In particular, Bakker’s group has demonstrated howcoulometric methodology may be used to transform ion-selectiveelectrode measurements that are conventionally potentiometric innature [13,14]. For example, application of a constant current toappropriate ion-selective membranes can be used to deliver coulo-metrically controlled amounts of various ions for either calibrationor titration purposes. Alternatively, application of a suitable poten-tial at an ion-selective membrane and measurement of the currentover time (or charge) associated with the resultant ion uptake canproduce a calibration-free ion-selective sensor that may be attrac-tive for remote monitoring purposes [15].
A coulometric variation on traditional anodic stripping voltam-metry (ASV) was reported for metal analysis by Beinrohr’s group inthe early 1990s [16–19] and, more recently, by Geneste [20,21] andPierce [22] as well. In this approach, the sample solution is passedthrough a porous flow-through electrode possessing a large surfacearea. When a reducing potential is applied, metals are collectedvia electrodeposition; and, as in conventional ASV, they can bestripped off and determined after a suitable accumulation period.In all of these cases, the integrated stripping current gave the totalcharge associated with the sample volume that had flowed throughthe electrode (assuming 100% electrodeposition); and a potentiallycalibration-free analysis was possible. Although it is possible thatthis anodic stripping coulometry (ASC) method might be suitablefor on-site remote sensing applications, we are not aware of anysuch reports as yet. Furthermore, because of the requirement tomaintain a fixed and very well known sample flow rate in thisapproach, implementation in practice would require an accurateand reliable pump or flow meter if flow is natural (e.g., capillaryaction, gravity, etc.) on each sensing platform.
We believe that a more attractive coulometric approach thatis consistent with the production of relatively economical sensingdevices is the stopped-flow thin-layer cell. Because the samplevolume is determined only by the cell volume, the quality of themeasurement does not depend on a precisely metered flow rate;and the device design ought to be greatly simplified. Recently, ourgroup has completed “proof-of-concept” work on such calibration-free coulometric approach [23]. Specifically, we have reported a�L-volume, thin-layer coulometric cell that allows total sampleelectrolysis to be achieved with a high degree of reproducibil-ity in less than a minute. This cell consisted of isolated working
and counter electrode chambers where the working electrode wasmicro-fabricated by photo-lithographically patterning a Si waferwith a Au film that covered the entire bottom of the cell. For amodel analyte (such as Fe(CN)63−/4−), this first-generation device

Chimica Acta 803 (2013) 47– 55 49
wrwwnia
2
2
sfopocp
2
ftwBcwiyNipAtsuCastfitfir1i
2
fitDCnMc1ficmCC
Fig. 1. The platform consists of two polycarbonate fixtures (A), two rubber gasketlayers (B), analyte impermeable membrane (C), counter and reference electrodecompartment and access holes (D and E), and 2–4 �L working electrode analysis
M.M. Marei et al. / Analytica
as shown to track the analyte concentration over a very wideange and to yield reliable sub-ppm determinations over periods ofeeks without the need for direct calibration. In the present work,e describe further developments in the coulometric analysis tech-ique. In particular, we report device improvements implemented
n order to provide higher quality coulometric performance andpplication of the approach to measurement of metals.
. Experimental
.1. Chemicals
Copper and mercury standard AAS solutions (1000 ppm), potas-ium nitrate, nitric acid, and sodium chloride were all purchasedrom Sigma–Aldrich (Milwaukee, WI); potassium ferrocyanide wasbtained from VWR International (Batavia, IL), and agarose wasurchased from Difco Laboratories (Detroit, MI). All chemicals weref the highest available purity and were used without further purifi-ation. Deionized water was used to prepare all solutions, andotassium ferrocyanide solutions were prepared daily before use.
.2. Sensor chip containing the working electrode
Fabrication of the sensor chips was conducted in the cleanroomacility of the University of Louisville Micro/Nano Technology Cen-er. The gold sensing electrodes were patterned on SiO2 coatedafers using an image reversal photolithographic liftoff technique.riefly, this process consisted of thermally oxidizing a 100 mm sili-on wafer to form a ∼500 nm oxide insulating layer. The SiO2 layeras then coated with a positive photoresist and selectively exposed
n a MA6/BA6 mask aligner (Suss MicroTec, Garching, Germany) toield the negative of the desired pattern. Subsequently, gaseousH3 assisted image reversal in a 310TA oven (Yield Engineer-
ng Systems, Livermore, CA) was used to improve liftoff and yieldatterned wafers with exposed oxide only in the electrode regions.
buffered oxide etch produced a ∼210 nm recessed region inhe oxide layer. These recessed regions were then filled by twouccessive sputtering steps (conducted without breaking vacuum)tilizing the multi-target PVD 75 sputtering machine (Kurt J. Leskero., Jefferson Hills, PA). The final electrode consisted of a thin nickeldhesion layer (100 A) covered by a layer of gold (2100 A), whicherved as our thin-film gold working electrode. A final liftoff stephen removed the excess metal deposits atop the remaining sacri-cial photoresist, exposing the final patterned wafer. The edges ofhe metal filled recesses were checked by a Dektak 8 surface pro-lometer (Veeco Instruments Inc., Plainview, NY), and the surfaceoughness was less than 10 nm in all cases. Each wafer contained3 sensor chips which were then separated by dicing to yield the
ndividual 1.3 cm × 3 cm sensor chips (Fig. 1, inset).
.3. Flow cell
The flow cell consisted of the sensor chip, two polycarbonatextures, two rubber gasket layers, and a membrane. Drawings forhe top and bottom fixtures were prepared using Computer Aidedesign (CAD) software (Solidworks, Dassault Systèmes SolidWorksorp., Waltham, MA) and were milled from translucent polycarbo-ate by a commercial prototyping service (FirstCut, Proto Labs Inc,aple Plain, MN). A trench in the bottom fixture allowed for pre-
ise positioning of the sensor chip, and four alignment pins (short/16th inch stainless steel rods) between the two polycarbonatextures served as guides for precise placement of the remaining
omponents during assembly. The drawings for the gasket andembrane layers were also prepared using CAD software (Auto-AD, Autodesk, Inc., San Rafael, CA) and cut using a precision 40 WO2 mini laser cutter/engraver (Epilog Laser, Golden, CO). Assembly
compartment (F). Assembly yields a three electrode dual compartment cell withindependent flow paths. Inset: Photo of elliptical Au working electrode on SiO2 chip,bottom fixture, and a pen for scale.
of these components together yielded a three electrode, membraneseparated, dual compartment cell with independent flow paths foreach compartment (Fig. 1). Here we refer to the lower compartmentcontaining the working electrode as the analysis compartment, andthe upper compartment containing the counter and reference elec-trodes as the auxiliary compartment.
The volume of the lower (analysis) compartment was defined bythe sensor chip’s central 8 mm × 5 mm elliptical electrode (whichserved as the working electrode) on the bottom, the elliptical holein the lower gasket along its sides, and the membrane (SelRO MPF-34, Koch Membrane Systems, Inc., Wilmington, MA) at the top.The lower gasket was made of 125 �m (±75 �m) thick ultra-puresilicone rubber, and the elliptical hole in the center sat atop thesensor chip’s elliptical electrode, masking the edges for an activearea of 8 mm × 4 mm. This central hole was flanked by two 8 mmlong × 0.5 mm wide holes which channeled flow to pre-cut holes inthe layers above. The volume of the upper (auxiliary) compartmentwas defined by the same SelRO membrane on the bottom, the uppergasket (8 mm × 4 mm hole in 500 �m (±75 �m) thick ultra-pure sil-icone rubber flanked by two 1 mm × 0.5 mm holes to channel flowupwards as before) along its sides, and the top fixture. This uppercompartment also contained the counter and reference electrodes,which were inserted through access holes in the top fixture.
Two types of counter electrodes (CE) were employed. The firstCE consisted of two ultra-pure (99.985%) 1 mm diameter gold wires(Alfa Aesar, Ward Hill, MA) in the bottom face of the top fixtureconnected together to form a single electrode. This CE was madeby inserting a length of the gold wire through two pre-machinedaccess holes in the top fixture. The second type of CE consistedof a flat 100 �m thick pyrolytic graphite sheet (Panasonic Elec-tronic Components, Secaucus, NJ) incorporated as an additionallayer between the top gasket and top fixture. This custom cutpyrolytic graphite sheet (PGS) included holes for the alignment pinsand flow paths of the layers above and beneath it, and an addi-tional 0.8 mm diameter hole in the center aligned with the accesshole for the miniature reference electrode (RE). In order to ensurestopped flow during electrochemical experiments, rigid connec-
tions were used to connect the inlets and outlets of the top fixtureto closeable valves. These valves served to isolate the micro-fluidicanalysis cell from the flexible Tygon tubing used to connect it tothe sample and waste reservoirs. Fittings, tubing, rubber gaskets,
5 Chim
spnvsTko
2
AowbrocCo(twTtctRtiTnito3iiTaprS
2
fcatiMFdama(esr(pr
0 M.M. Marei et al. / Analytica
yringes, and valves for sample handling were all composed of inertlastics and rubbers and were obtained from Cole-Parmer (Ver-on Hills, IL) and/or McMaster Carr (Aurora, OH). The expectedolume of the analytical compartment based on the design dimen-ions was 2–4 �L, depending on the thickness of the gasket used.he exact volume was established for each set of experiments usingnown concentrations of electroactive species such as Fe(CN)6
3−/4−
r Cu0/Cu2+.
.4. Reference electrode
For all experiments in the cell, we utilized a custom-madeg/AgCl miniature reference electrode. The end of a 3–4 cm lengthf ultra-pure (99.997%) 100 �m diameter silver wire (Alfa Aesar)as soldered to a larger wire for easier handling and then cleaned
y successive sonication in 1 M HNO3 and deionized water. Chlo-inating the clean silver wire was conducted vs. a similar lengthf 500 �m diameter Pt wire in 1 M NaCl using a two electrodeonfiguration. A function generator (Model 4011A, B&K Precisionorp., Yorba Linda, CA) was used to generate a 560 mV, 40 msn/60 ms off pulse that was applied for 60–70 min. A rectifier diode1N4001, Vishay Semiconductor) was placed in series with the elec-rodes to suppress any reverse (non-oxidizing) current. The squareave was monitored with an oscilloscope (Model DS1052E, Rigol
echnologies Inc., Oakwood Village, OH), and a digital multime-er (Model 34410A, Agilent Technologies Inc., Santa Clara, CA) wasonnected via a LabVIEW (National Instruments, Austin, TX) con-rol program to monitor the unidirectional current flow over time.everse current during the “off” period was negligible, while theypical average current during the “on” period was 300–400 �Anitially and gradually increased to 400–500 �A after 60–70 min.he chlorinated silver wires were stored in deionized water untileeded. To assemble the reference electrode, 3 M NaCl was drawn
nto a 41 mm long × 0.8 mm O.D. glass capillary (Drummond Scien-ific Co., Broomall, PA) until it was about 3/4th full, then the bottomf the capillary was pressed into solidified 3% (w/v) agarose gel in
M NaCl to form a ∼0.25 in. frit. The chlorinated wire was thennserted into the top of the capillary and sealed with Torr Sealnsulating epoxy (Varian Vacuum Technologies, Lexington, MA).he fritted end was immersed in 3 M NaCl while the epoxy driednd thereafter stored in that solution when not in use. The pre-ared electrodes exhibited less than 10 mV drift over an 18 h periodelative to commercial Ag/AgCl reference electrodes (Bioanalyticalystems, West Lafayette, IN).
.5. Fluorescent particle microscopy
For microscopy, the CNC machining tool marks were removedrom the bottom polycarbonate fixture by chemical and mechani-al polishing until the fixture was optically clear. For this study, thessembled flow cell was identical to that described above, excepthat the sensor chip was replaced by a transparent glass slide ofdentical dimensions (Fisher Scientific, Pittsburgh, PA). The Fluoro-
ax R0200 2 �m polystyrene fluorescent particle solution (Thermoisher Scientific Inc., Waltham, MA) was prepared by adding 2–3rops to 50 mL deionized water until the particle density was visu-lly suitable. The visualization utilized a Nikon Eclipse Ti-U invertedicroscope (Nikon Instruments Inc., Melville, NY) equipped with
green light source for excitation of the particle immobilized dye�ex = 542 nm, �em = 612 nm), and a suitable filter for isolating themitted light. Videos and snapshots were captured using a Pico Sen-icam QE camera (PCO AG, Kelheim, Germany). After filling the cell,
epositioning the microscope platform and fine-tuning the focusapproximately a 30 s process), the camera was used to record thearticle movements at 9.1 frames per second. A total of 46 frames,ecorded 30–60 s after filling the cell, were then combined into aica Acta 803 (2013) 47– 55
single composite image where streaks represent the movement ofparticles over a 5 s span in real-time. The particles which did notmove, presumably immobilized on the walls of the compartment,reflect the elliptical shape of the compartment.
2.6. Electrochemical measurements
Electrochemical measurements were carried out using a BASiEpsilon potentiostat (Bioanalytical Systems, West Lafayette, IN). Forferrocyanide, the basic experiment consisted of using a syringe tofill the working electrode compartment with 500 �M ferrocyanidein 0.1 M KNO3. To ensure that the electrode surface was suffi-ciently pre-conditioned prior to each run, a potential of −100 mVwas applied and held for 10 s, followed by a 400 mV potentialapplied for 130–600 s to exhaustively oxidize the ferrocyanide toferricyanide. Background correction was performed by conduct-ing an identical experiment in the absence of ferrocyanide (0.1 MKNO3 only). The analyses of Cu and Hg were conducted in a 10 mMHNO3/10 mM NaCl supporting electrolyte and also utilized a 10 spre-conditioning step (at the stripping potential) followed by areducing potential step at 0 mV for exhaustive deposition of themetals.
For early experiments, the background was obtained in a sep-arate experiment in which the cell was filled with blank solution.However, in order to simplify the background correction processand minimize possible changes in electrode area over time, laterexperiments utilized an in situ background correction which wasperformed in the sample solution by stripping with and with-out pre-concentration of the metal on the electrode surface. Thepotential step sequence was 850 mV for 10 s to pre-condition theelectrode surface, 0 mV for 60 s to exhaustively reduce the metalsonto the electrode surface, 850 mV for 640 ms during which themetal stripping signal was recorded, 850 mV for an additional 60 sto allow the metals to diffuse back into the cell, 0 mV for 20 mswhere metal deposition was minimal, and finally to 850 mV for640 ms to obtain the background stripping signal. In all cases, theexperiments were performed in triplicate for each sample, resultingin 3 current vs. time plots for each sample and/or blank. A Lab-VIEW program was created to integrate the current–time curvesand calculate the total charge passed following the potential steps.
3. Results and discussion
3.1. Micro-coulometry cell performance
In our earlier work [23], we reported the development of aproto-type micro-coulometry platform for calibration-free mea-surements and characterized its performance using Fe(CN)6
3−/4−
as a model analyte. This device consisted of a �L-volume thin-layer cell with isolated working and counter electrode chambers.The actual working electrode consisted of a sputtered Au layerthat was photo-lithographically patterned and covered the entirebottom of the elliptical cell (25.6 mm2). Thus, for the approxi-mately 80-�m thick cell employed, the length of time requiredfor complete electrolysis, once the working electrode compart-ment had been filled with sample and an appropriate potential wasapplied, was approximately 15 s. The electrolysis charge was foundto track the Fe(CN)6
3−/4− concentration over a very wide range(50–10,000 �M); and, most important, the approach gave stableand reproducible results for extended periods without the need forany calibration or other operator adjustments. The elliptical shape
of the cell also promoted complete replacement of the cell contents,as indicated by excellent run-to-run reproducibility.However, despite these positive outcomes, closer examinationof the coulometry experiments indicated significant problems in

M.M. Marei et al. / Analytica Chimica Acta 803 (2013) 47– 55 51
F or ch9 valve8
cwcas(ptdpicha
amtctuttaoicmt
Vrfsfldmigsvicowtte
exceeding that required for diffusion across the thin-layer cell, themeasured charges remained within 10% of the expected/theoreticalvalue. Further, the divergence of the experimental charge fromthe calculated charge appeared to be satisfactorily explained by
Fig. 3. Theoretical response of micro-coulometric cell (gray line), experimentalresult (black line), and ±10% of theoretical (dashed lines), and flow model based
ig. 2. Fluorescent particle microscopy through transparent bottom fixture (sens.1 fps, 46 frames composited to show particle movement over a 5 s span. (A) Open82 �m min−1 (0.07 �L min−1 volumetrically).
ell performance. In particular, although the electrolysis currentsere relatively short-lived as expected, it was found that these
urrents never completely reached the appropriate backgroundnd in fact persisted at low levels for extended time periods. Con-equently, the corresponding charge failed to reach a fixed levelrepresenting total oxidation/reduction of the Fe(CN)6
3−/4− sam-le) but rather continued to increase slowly but steadily long afterhe cell should have been exhausted. For example, even thoughiffusion considerations suggested that electrolysis should be com-lete within tens of seconds, the accumulated charge continued to
ncrease for several minutes and reached levels much higher thanould be accounted for simply by the quantity of Fe(CN)6
3−/4− thatad been injected into the cell (e.g., total charge 140% of expectedfter 1 min).
In view of these findings, the first problem that needed to beddressed in the current study was to improve the absolute coulo-etric performance of the measurement platform. The fact that
he observed currents were always so long-lived and the measuredharges for all Fe(CN)6
3−/4− concentrations consistently exceededhe expected values suggested that the effective electrolysis vol-me was larger than the actual physical volume of the cell andhat this volume was augmented by unanticipated analyte massransfer during the electrolysis. This could be due to such factors asnalyte diffusion into the cell [24,25], leakage of sample solution,r residual flow after filling the sample compartment. In order tonvestigate these possibilities, we turned to a fluorescence parti-le microscopy (FPM) approach in order to visualize directly theicrofluidic processes that were occurring in the device during a
ypical analysis.The details of the FPM experiments are provided in Section 2.
ery briefly, the microfabricated sensor chip was removed andeplaced by a transparent glass slide to permit viewing of the cellrom below by an inverted microscope. The Fe(CN)6
3−/4− sampleolution was replaced by one that contained a suspension of 2 �muorescent-tagged polystyrene particles, but the cell filling proce-ure was carried out via manual syringe loading in exactly the sameanner as usual. During the first 30 s, visual observations qual-
tatively indicated the flow was very fast initially and thereafterradually slowed to a steady state value within 15–30 s. Fig. 2Ahows a composite FPM image constructed from dozens of indi-idual photos taken between 30 and 60 s after a typical samplenjection. In this image, recorded at the outlet of the electrolysisell, the vertical streaks represent the movement of individual flu-rescing particles during this period. Clearly, the sample solution
as not static as desired but rather showed a long-term and rela-ively steady flow through the cell. By measuring and averaginghe lengths of several streaks, the average linear flow rate wasstimated to be nearly 4000 �m min−1 – which corresponds to a
ip replaced with glass of identical dimensions). Particle movements recorded ats, linear flow in channel: 3970 �m min−1. (B) Closed valves, linear flow in channel:
volume flow rate on the order of 0.30 �L min−1. Considering thatthe total volume of the electrolysis cell was only 2–4 �L, it wasapparent that this level of residual sample flow could easily accountfor the surplus current and charge noted above.
In an attempt to address this problem, all flow paths into andout of the cell (which previously had consisted of 1/8th in. I.D.Tygon tubing) were replaced by rigid plastic connectors. In addi-tion, manual valves that could be closed after sample injection wereinserted into the sample flow stream as close as possible to thedevice in order to isolate the cell to the greatest extent possible.When these simple measures were implemented, the residual sam-ple flow was drastically decreased. As seen in Fig. 2B, FPM imagingrevealed that the steady-state flow was reduced by a factor of 4 (to0.07 �L min−1). Most critically, the resulting coulometric perfor-mance showed an immediate and drastic improvement. As shownin Fig. 3, the experimentally measured charge for Fe(CN)6
3−/4−
closely matched the theoretically calculated charge over a muchlonger time period than before. Because the residual flow was notcompletely eliminated, the accumulated charge did increase slowlyover time, but at a much slower rate than for the previous device.At times up to 2 min, there was practically no difference from thecalculated charge; and even at electrolysis times up to 7 min, far
on 0.07 �L min−1 of Fig. 2B (triangles). Experimental data from charge accumulatedduring oxidation of 500 �M ferrocyanide in 0.1 M KNO3, background corrected andnormalized. Oxidation at 0.4 V after 10 s electrode pre-conditioning at −0.1 V vs.Ag/AgCl, background correction obtained by subtraction of identical experimentwith electrolyte only.

52 M.M. Marei et al. / Analytica Chimica Acta 803 (2013) 47– 55
Table 1Experimentally calculated cell volumes on different days. Experimental details werethe same as Fig. 3. For each day, values in parentheses are the RSDs of three mea-surements, whereas the RSD next to the average values are for the six days.
Day Charge after60 s (�C)
Calculatedvolume (�L)
1 180 (1.4%) 3.735 179 (4.0%) 3.71105 172 (1.3%) 3.56291 170 (2.0%) 3.53292 179 (1.3%) 3.71
a(
iureTfsppmacv1vchtbqi
3
aaiiafesdnoiteposp
tmbed
Fig. 4. Square wave voltammogram in the micro-coulometry cell of 1.5 ppmCu2+/5 ppm Hg2+ in 10 mM HNO3/10 mM NaCl, pH 2.20 (f = 15 Hz, Ep = 25 mV,
308 177 (0.8%) 3.65
Avg. 176 (2.4%) 3.65 (2.4%)
ccounting for the steady flow of fresh analyte at 0.07 �L min−1
triangles of Fig. 3).With the improved cell approaching stopped-flow conditions,
t was possible to determine experimentally the cell volume bysing ferrocyanide solutions of known concentrations. This wouldepresent a good measure of the inherent reproducibility of thelectrolysis operation over an extended period of time as shown inable 1. The average charge obtained for the oxidation of 500 �Merrocyanide after 60 s over a 10 month period was 176 �C, corre-ponding to a volume of 3.65 �L, with an RSD of 2.4%. Each day, thelatform was ‘freshly’ assembled with different individual com-onents (e.g., sensor chips, gaskets, electrodes). Even the majorodification of the platform layout, for example, by addition of
n extra layer (PGS counter electrode) did not affect the calculatedell volume (Days 291, 292, and 308), compared to the calculatedolumes when the built-in gold counter electrode was used (Days, 5, and 105). The experimentally obtained charges and calculatedolumes above also showed the coulometric performance of theell, with the excess charge after 130 s being, on average, only 5%igher than the charge at 60 s. Although improvements directedoward improving the coulometric performance of the device areeing planned, the quality of these measurements was deemed ade-uate to allow the desired application to metal monitoring to be
nitiated.
.2. Applications to metal analysis/anodic stripping coulometry
Obvious targets for electrochemically based analysis methodsre the heavy metals, many of which are well known for their char-cteristic electroactivity. These species are of potential importancen practically relevant applications such as the monitoring of drink-ng and waste water systems. One fundamental difference in thenalysis of metal analytes, compared to solution analytes such aserri-/ferrocyanide, is the deposition of the reduced metal onto thelectrode surface. In classic metal stripping experiments, the dis-olved metal ion is pre-concentrated onto the electrode surfaceuring a long lasting deposition step performed at a sufficientlyegative potential to result in accumulation of a metallic depositn the electrode surface. The deposition step, typically carried outn a bulk solution, is often accompanied by a stirring of the solutiono enhance the transport of ions to the electrode surface, therebynhancing the pre-concentration effect. The most common strip-ing process involves some form of anodic potential sweep (linearr pulsed) where the metal deposits accumulated on the electrodeurface during the deposition step are removed at a characteristicotential and the resulting currents are recorded.
This is, of course, the basis for the familiar ASV trace analysisechnique. The peak sizes (areas or heights) of the resulting voltam-
ogram can then be used to determine the metal concentrationy comparison to prepared standards. The peak size is depend-nt on numerous factors including the electrode area and history,eposition time, stirring rate, and the potential sweep parameters.
Es = 4 mV, 2 s quiet time preceded deposition before immediate return scan). (A)Deposition trace showing reduction of Hg2+ followed by Cu2+. (B) Stripping traceshowing oxidation of metallic Cu followed by metallic Hg.
Therefore, calibration is always necessary; and we are not awareof any reports of calibration-free methods based on voltammetricstripping techniques. By analogy, the method specifically exam-ined here might be termed anodic stripping coulometry (ASC). Aswith ASV, both deposition and stripping cycles are possible. Thebasic differences are that, with ASC, the amount of sample is fixedby the thin-layer cell volume and the length of time required forcomplete electro deposition is relatively short. Because the samplevolume is intentionally restricted to a few �L, the very low con-centration levels accessible by ASV are unlikely to be accessiblewith ASC. However, by fixing the volume, one ought to achieve anabsolute, calibration-free measurement.
Fig. 4 illustrates a typical square-wave voltammogram (SWV)obtained for a sample solution containing both Cu2+ and Hg2+
placed in the thin-layer micro-coulometry cell described above.(These metals were chosen because they are reducible at fairly pos-itive potentials at the Au working electrode and therefore allowedus to avoid the concomitant reduction of O2 and H2O.) The voltam-mogram showed the expected redox processes: Hg2+ reduction atapproximately 600 mV and Cu2+ reduction at 275 mV (vs. Ag/AgCl)as well as the corresponding oxidations of the deposited metals onthe return SWV scan. The oxidation, or “stripping”, peaks of trace Bare larger than the reduction, or “deposition”, peaks of trace A dueto the preconcentration effect that occurs for each metal once itsreduction potential has been reached. In fact, the reduction wavesobserved corresponded to the “underpotential deposition” (UPD)peaks related to the very first metal monolayer deposited onto theAu surface, which appears at a somewhat more positive potentialthan the subsequent “bulk” deposition occurring after the Au sur-face has been saturated. From the outset, we decided to focus onthe UPD condition because, in view of our small cell volume andlarge working electrode area, it was expected that sub-monolayercoverage would be exceeded only at very high Cu2+ or Hg2+ concen-trations. For example, calculations indicate that, for our specific cell,copper concentrations up to 20 ppm would yield sub-monolayercoverage [26]. By contrast, the maximum allowable Cu concentra-tion in drinking water is only 1.3 ppm and that for most other heavymetals is much less than this. In addition, UPD conditions producedsimplified voltammograms where (1) there was only one reduc-tion peak and one oxidation peak for each metal, (2) intermetallicalloys were less likely to form [27], and (3) the Au electrode surfacewas likely to show less run-to-run hysteresis and therefore greaterlong-term reproducibility [28].
Initial ASC experiments, shown in Fig. 5, examined the i–tbehavior obtained for electrolysis of a sample solution that con-tained only Cu2+. Each experiment consisted of two phases. First,
the potential was stepped to 0.0 V where the Cu2+ was efficientlyreduced to Cu0 and the corresponding current was recorded overtime. As seen in Fig. 5A, the background corrected currents, whoselevels were directly related to the Cu2+ concentration employed,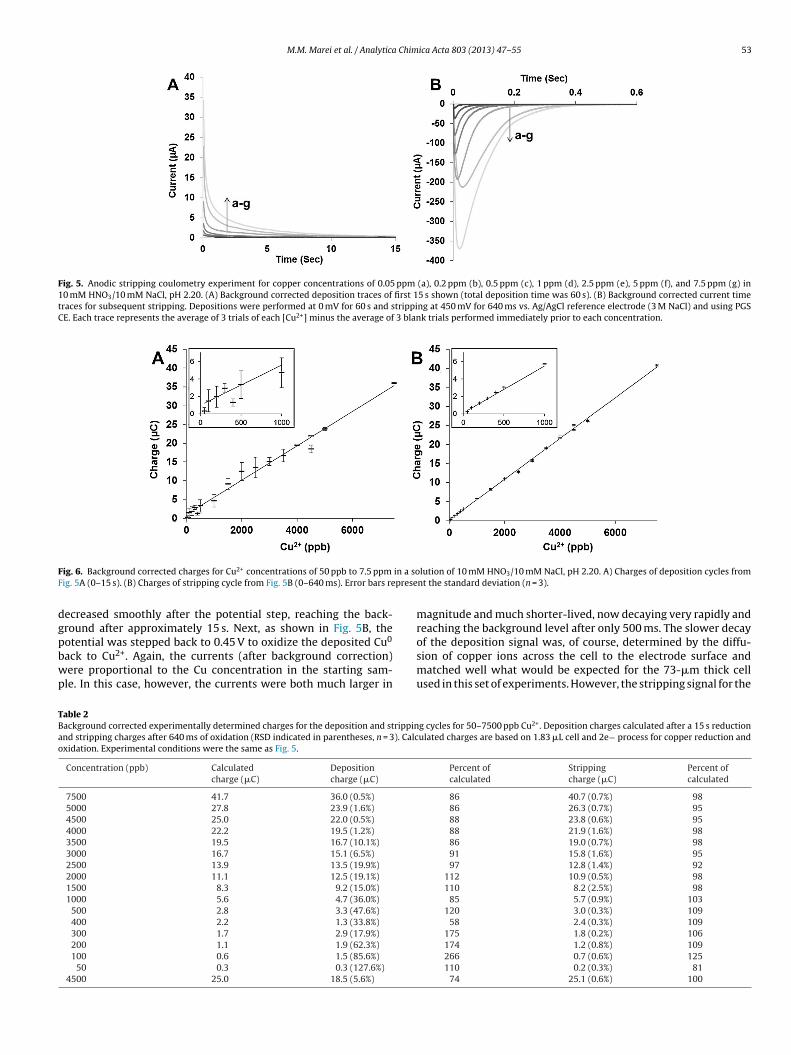
M.M. Marei et al. / Analytica Chimica Acta 803 (2013) 47– 55 53
Fig. 5. Anodic stripping coulometry experiment for copper concentrations of 0.05 ppm (a), 0.2 ppm (b), 0.5 ppm (c), 1 ppm (d), 2.5 ppm (e), 5 ppm (f), and 7.5 ppm (g) in10 mM HNO3/10 mM NaCl, pH 2.20. (A) Background corrected deposition traces of first 15 s shown (total deposition time was 60 s). (B) Background corrected current timetraces for subsequent stripping. Depositions were performed at 0 mV for 60 s and stripping at 450 mV for 640 ms vs. Ag/AgCl reference electrode (3 M NaCl) and using PGSCE. Each trace represents the average of 3 trials of each [Cu2+] minus the average of 3 blank trials performed immediately prior to each concentration.
F in a soF prese
dgpbwp
TBao
ig. 6. Background corrected charges for Cu2+ concentrations of 50 ppb to 7.5 ppm
ig. 5A (0–15 s). (B) Charges of stripping cycle from Fig. 5B (0–640 ms). Error bars re
ecreased smoothly after the potential step, reaching the back-round after approximately 15 s. Next, as shown in Fig. 5B, the
otential was stepped back to 0.45 V to oxidize the deposited Cu0ack to Cu2+. Again, the currents (after background correction)ere proportional to the Cu concentration in the starting sam-le. In this case, however, the currents were both much larger in
able 2ackground corrected experimentally determined charges for the deposition and strippinnd stripping charges after 640 ms of oxidation (RSD indicated in parentheses, n = 3). Calcxidation. Experimental conditions were the same as Fig. 5.
Concentration (ppb) Calculatedcharge (�C)
Depositioncharge (�C)
7500 41.7 36.0 (0.5%)
5000 27.8 23.9 (1.6%)
4500 25.0 22.0 (0.5%)
4000 22.2 19.5 (1.2%)
3500 19.5 16.7 (10.1%)
3000 16.7 15.1 (6.5%)
2500 13.9 13.5 (19.9%)
2000 11.1 12.5 (19.1%)
1500 8.3 9.2 (15.0%)
1000 5.6 4.7 (36.0%)
500 2.8 3.3 (47.6%)
400 2.2 1.3 (33.8%)
300 1.7 2.9 (17.9%)
200 1.1 1.9 (62.3%)
100 0.6 1.5 (85.6%)
50 0.3 0.3 (127.6%)
4500 25.0 18.5 (5.6%)
lution of 10 mM HNO3/10 mM NaCl, pH 2.20. A) Charges of deposition cycles fromnt the standard deviation (n = 3).
magnitude and much shorter-lived, now decaying very rapidly andreaching the background level after only 500 ms. The slower decay
of the deposition signal was, of course, determined by the diffu-sion of copper ions across the cell to the electrode surface andmatched well what would be expected for the 73-�m thick cellused in this set of experiments. However, the stripping signal for theg cycles for 50–7500 ppb Cu2+. Deposition charges calculated after a 15 s reductionulated charges are based on 1.83 �L cell and 2e− process for copper reduction and
Percent ofcalculated
Strippingcharge (�C)
Percent ofcalculated
86 40.7 (0.7%) 9886 26.3 (0.7%) 9588 23.8 (0.6%) 9588 21.9 (1.6%) 9886 19.0 (0.7%) 9891 15.8 (1.6%) 9597 12.8 (1.4%) 92
112 10.9 (0.5%) 98110 8.2 (2.5%) 98
85 5.7 (0.9%) 103120 3.0 (0.3%) 109
58 2.4 (0.3%) 109175 1.8 (0.2%) 106174 1.2 (0.8%) 109266 0.7 (0.6%) 125110 0.2 (0.3%) 81
74 25.1 (0.6%) 100

54 M.M. Marei et al. / Analytica Chimica Acta 803 (2013) 47– 55
F nd cor 2+ 2+ 2+
1 s andE te tria
sdceisbts
Fwrwatarawiwececst
qsdpmiasidss
5(ob
ig. 7. Simultaneous determination of copper and mercury using in situ backgrou0 mM HNO3 and 10 mM NaCl, pH 2.20. Depositions were performed at 0 mV for 60ach trace represents the average of 3 metal trials (black) and 3 metal free electroly
urface-confined copper, whose oxidation is no longer diffusionependent, exhibited much faster charge accumulation. For all con-entrations studied, the magnitude of the stripping charge wasssentially finished in less 500 ms (with the measured chargencreasing by <2% after an additional 140 ms). For both the depo-ition and stripping experiments, the corresponding charges coulde obtained by integration of these i–t curves. When this was done,he coulometry data shown in Table 2 and the calibration curveshown in Fig. 6 were obtained.
Several aspects of the ASC results in Table 2 were noteworthy.irst, for both the deposition and stripping cycles, the total chargesere directly related to the Cu2+ concentrations over the entire
ange studied – from 50 ppb up to 7500 ppb which is consistentith an absolute measurement such as exhaustive coulometry of
fixed sample volume. Second, for any given Cu2+ concentration,he total charge seen for the deposition and stripping cycles waslways essentially the same which is consistent with a chemicallyeversible electrode process such as Cu0/Cu2+. Third, the accuracynd the precision of charge data obtained for the stripping cycleere consistently superior to the similar data for the correspond-
ng deposition cycle. For the stripping experiments, the chargesere much more reproducible, with RSDs generally less than 1%,
ven for the lowest concentrations employed. More important, theharges measured for the stripping cycle also matched the chargesxpected for the cell volume and Cu2+ concentrations much morelosely – usually within 10% – than was the case for the corre-ponding deposition measurements where the discrepancy withhe expected charge was sometimes 50% or more.
This last feature of the ASC data – namely, the obviously higheruality of the stripping data compared to the deposition data – wasomewhat surprising. We believe that this improvement is likelyue to the much shorter time scale of the stripping step in ASC com-ared to that of the deposition: 500 ms vs. 15 s. While the signaleasured in each of these cycles should be identical in magnitude,
t occurs over a much shorter time window for the stripping step;nd therefore, there may be much less noise included in the mea-urement. This is a somewhat different situation than ASV wheremproved detection is obtained by the use of an extended electroeposition period to increase the signal directly. Despite the dis-imilarity of the deposition processes, ASV and ASC both favor thetripping step to produce higher quality data.
The lowest Cu2+ concentration employed in this study was
0 ppb (or 0.8 �M), but it was apparent that the limit of detectionLOD, signal/noise = 3) was somewhat lower. We chose not to try toptimize this aspect of ASC at this time because the LOD will clearlye determined by the specific characteristics of the ASC platform inrection. (A) 30 �M Cu . (B) 30 �M Cu and 50 �M Hg . Electrolyte consisted of stripping at 850 mV for 320 ms (vs. Ag/AgCl reference electrode and using PGS CE).ls (gray). Insets show the corresponding charge–time curves.
use (in particular, the cell/sample volume and electrode area) andthe specific application being targeted (i.e., the particular metal).Nevertheless, it seems likely that LOD values in the low ppb rangeshould be achievable without drastic changes in cell design. At thesame time, it is important to realize that the immediate goal of ourASC sensors is not to rival the ultra-trace level quantitation capabil-ities of conventional ASV but rather to make possible stand-alonesensing devices for use in sensor networks capable of providingreliable semi-quantitative monitoring capabilities suitable for earlywarning or emergency purposes.
3.3. Metal mixtures
It is unlikely that, in practice, many real samples such as drink-ing water or waste water would contain only a single metal ion.Rather, it is far more likely that, even if the analyst might be inter-ested in only a single specific metal in his or her sample, othermetals that are subject to electro deposition and stripping wouldbe present in the sample as well. Therefore, a logical next step incharacterizing the ASC method was to start to investigate samplesthat consisted of mixtures of metal ions. Of course, unlike ASV,where a potential scan is employed during the stripping cycle andindividual metals give rise to peaks at characteristic potentials, thecurrent ASC method employs just a single potential step for strip-ping. Thus, the resulting i–t curves provide insight only into thetotal quantity of metals that were electrodeposited from the sam-ple and give no direct information with regard to exactly whichmetals had been present in the sample. In order to obtain suchqualitative information, a more complex stripping approach wouldbe required.
The first mixture examined contained both Cu2+ and Hg2+. TheSWV in Fig. 4 shows the i–E behavior of these metals under theprevailing experimental conditions and that both metals can beelectrodeposited at 0.0 V (vs. Ag/AgCl). After exhaustive deposi-tion, the metals were subsequently stripped from the electrodesurface by a potential step to 850 mV, and the resulting i–t strip-ping curves for both Cu2+ alone and a Cu2+/Hg2+ mixture are shownin Fig. 7. In both cases, the i–t curves shown are just those for thestripping of the Cu or Cu/Hg deposit since this measurement cyclehas the greater analytical utility. The behavior seen in Fig. 7A forCu2+ by itself was exactly as expected: an exponentially decreasinganodic current that reached the background level within 100 ms;
and, as shown in Table 3, integration of this amperogram yieldedcharges that closely matched the value expected for this concentra-tion and sample volume. Corresponding results for the Cu2+/Hg2+mixture, shown in Fig. 7B and Table 3, also displayed the expected
M.M. Marei et al. / Analytica Chimica Acta 803 (2013) 47– 55 55
Table 3ASC background corrected results for Cu2+ and Cu2+/Hg2+ mixtures over several weeks (RSD in parentheses, n = 3). The expected charges were 21 �C for copper and 56 �C forthe copper/mercury mixture.
Day 30 �M Cu2+ (RSD) Error fromexpected
30 �MCu2+/50 �M Hg2+
(RSD)
Error fromexpected
soncrsiaa
caoeAspeAbgammt
4
tpassNpM�tArtauiiad
wnwue
[[[
[[[
[
[
[
[
[
[[[
[
[25] D.A. Condit, M.E. Herrera, M.T. Stankovich, D.J. Curran, Anal. Chem. 56 (1984)
1 21.4 �C (0.4%) 1.9%
2 22.3 �C (0.5%) 6.0%
18 21.0 �C(1.1%) 0.1%
hort-lived oxidation current and allowed accurate determinationf the total metal concentration present. However, close exami-ation of the i–t curve for the mixture showed that the strippingurrent for the Hg deposit was slightly slower than that for Cu. Theeason for the difference in time dependence, which was alwayseen for Cu/Hg mixtures, is not known at this point but presumablys due to slower electron-transfer kinetics for the Hg oxidation or to
specific interaction of the Hg with the Au electrode surface suchs amalgam formation.
In order to evaluate the capabilities of ASC for long-termalibration-free sensing applications, the above analyses of Cu2+
nd Cu2+/Hg2+ samples were repeated several times over a periodf more than 2 weeks. The results obtained, along with the valuesxpected for the concentrations used, are summarized in Table 3.s always, the measured charges were highly reproducible for anyingle set of replicate measurements, with RSD’s of only a fewercent. In addition, the charges showed good accuracy over thentire 2-week period, with errors usually much less than 1–3%.lthough a 5–10% error in a conventional laboratory analysis mighte considered large, we regard this level of performance as veryood considering that these results did not depend on the use ofny standards or on any run-to-run adjustments of the measure-ent platform and that the target of our ASC method is on-lineetal measurement as part of a continuous “early warning” sys-
em.
. Conclusions
Although coulometry is a well-established electrochemicalechnique that has long been used in the investigation of electroderocesses, it has not routinely been employed as a quantitativenalysis tool. The reason for this is that coulometry is neither highlyensitive nor highly selective in nature and therefore possessesome distinct limitations for trace analysis of complex samples.evertheless, this study demonstrated clearly that coulometry,articularly in the form of ASC, offers some unique advantages.ost important, by carrying out exhaustive electrolysis in aL-volume thin-layer cell, it is possible to make an absolute quanti-
ative determination of the concentration of electroactive analytes.s long as the cell volume is fixed, the determination does notequire the use of any standards and can be viewed as essen-ially “calibration free”. This uncommon feature of ASC makes thepproach extremely attractive for applications requiring contin-ous on-site monitoring where immediate operator intervention
s not feasible. Further, the ASC method should also be relativelynsensitive to prevailing environmental conditions, such as temper-ture, which are not possible to be controlled in the field withoutirect operator input.
By means of the microfabricated ASC device described here, weere able to begin exploring potential applications of this tech-
ique for the determination of individual metals and mixtures andere able to achieve rapid detection at sub-ppm levels by makingse of the very fast stripping process that follows the much slowerlectro deposition step. Numerous issues remain to be investigated[[[
55.2 �C(3.3%) 1.6%57.6 �C (2.1%) 2.7%54.6 �C (1.8%) 2.6%
before practical applications for unattended on-site metal analy-sis by ASC will be feasible – e.g., electrode materials other thanAu, more advanced stripping waveforms, inclusion of elementarysample treatment steps. Nevertheless, we believe this new analy-sis approach is promising and that the current study represents auseful advancement of this methodology.
Acknowledgements
The authors would like to thank Dr. Stuart Williams (Universityof Louisville) for his expertise and assistance with the fluorescenceparticle microscopy experiments and Dr. Cindy Harnett (Univer-sity of Louisville) for assistance and advice with the laser cuttingprocess. This work was supported by the University of LouisvilleResearch Incentive Funds Program and the Lutz Endowment in theDepartment of Bioengineering at the University of Louisville.
References
[1] Environmental Protection Agency, Analytical Methods Approved for DrinkingWater Compliance Monitoring of Inorganic Contaminants and Other InorganicConstituents, 2009, Available at: http://www.epa.gov/ogwdw/methods/pdfs/methods/methods inorganic.pdf
[2] D.A. Skoog, F.J. Holler, T.A. Nieman, Principles of Instrumental Analysis, fifthed., Harcourt Brace, Philadelphia, 1998.
[3] K. Ashley, Electroanalysis 7 (1995) 1189–1192.[4] J. Wang, B. Tian, J. Lu, J. Wang, D. Luo, D. MacDonald, Electroanalysis 10 (1998)
399–402.[5] H. Huang, P.K. Dasgupta, Anal. Chim. Acta 380 (1999) 27–37.[6] S. Daniele, C. Bragato, M.A. Baldo, J. Wang, J. Lu, Analyst 125 (2000) 731–735.[7] I. Palchetti, S. Laschi, M. Mascini, Anal. Chim. Acta 530 (2005) 61–67.[8] M.L. Kovarik, D.M. Ornoff, A.T. Melvin, N.C. Dobes, Y. Wang, A.J. Dickinson, P.C.
Gach, P.K. Shah, N.L. Allbritton, Anal. Chem. 85 (2013) 451–472.[9] Hach Company, Loveland, Colorado. http://www.hach.com (accessed
13.05.13).10] J. Frisby, D. Raftery, J.P. Kerry, D. Diamond, Meat Sci. 70 (2005) 329–336.11] D. Diamond, K.T. Lau, S. Brady, J. Cleary, Talanta 75 (2008) 606–612.12] A.J. Bard, L.R. Faulkner, Electrochemical Methods, Fundamentals and Applica-
tions, second ed., John Wiley, New York, 2001.13] E. Bakker, V. Bhakthavatsalam, K.L. Gemene, Talanta 75 (2008) 629–635.14] E. Grygolowicz-Pawlak, E. Bakker, Anal. Chem. 82 (2010) 4537–4542.15] M. Sohail, R. De Marco, K. Lamb, E. Bakker, Anal. Chim. Acta 744 (2012)
39–44.16] E. Beinrohr, M. Nemeth, P. Tschopel, G. Tolg, Fresenius J. Anal. Chem. 344 (1992)
93–99.17] E. Beinrohr, M. Cakrt, J. Dzurov, L. Jurica, J.A. Broekaert, Electroanalysis 11 (1999)
1137–1144.18] L. Jurica, A. Manova, J. Dzurov, E. Beinrohr, J.A.C. Broekaert, Fresenius J. Anal.
Chem. 366 (2000) 260–266.19] M. Strelec, F. Cacho, A. Manova, S. Hlubikova, E. Beinrohr, Chem. Anal. Warsaw
52 (2007) 377–385.20] R. Nasraoui, D. Floner, C. Paul-Roth, F. Geneste, J. Electroanal. Chem. 638 (2010)
9–14.21] R. Nasraoui, D. Floner, F. Geneste, Electrochem. Commun. 12 (2010) 98–100.22] S.G. Hazelton, D.T. Pierce, Anal. Chem. 79 (2007) 4558–4563.23] S. Carroll, M.M. Marei, T.J. Roussel, R.S. Keynton, R.P. Baldwin, Sens. Actuators
B: Chem. 160 (2011) 318–326.24] K.H. Lee, T. Ishikawa, S. Sasaki, Y. Arikawa, I. Karube, Electroanalysis 11 (1999)
1172–1179.
2909–2914.26] Y. Bonfil, M. Brand, E. Kirowa-Eisner, Anal. Chim. Acta 387 (1999) 85–95.27] Y. Bonfil, M. Brand, E. Kirowa-Eisner, Rev. Anal. Chem. 19 (2000) 201–216.28] Y. Bonfil, M. Brand, E. Kirowa-Eisner, Anal. Chim. Acta 424 (2000) 65–76.


![Analytica Chimica Acta - University of California, Santa CruzAnalytica Chimica Acta 1105 (2020) 82e86 about cancer status and progression [5,6]. miR-1290 is a highly sensitive and](https://static.fdocuments.in/doc/165x107/60af0ef23cf3d07be8654c9c/analytica-chimica-acta-university-of-california-santa-cruz-analytica-chimica.jpg)