Analytica Chimica Acta - chem.xmu.edu.cnchem.xmu.edu.cn/zzjg/anal/wangqiuquan/article/Analytica...
9
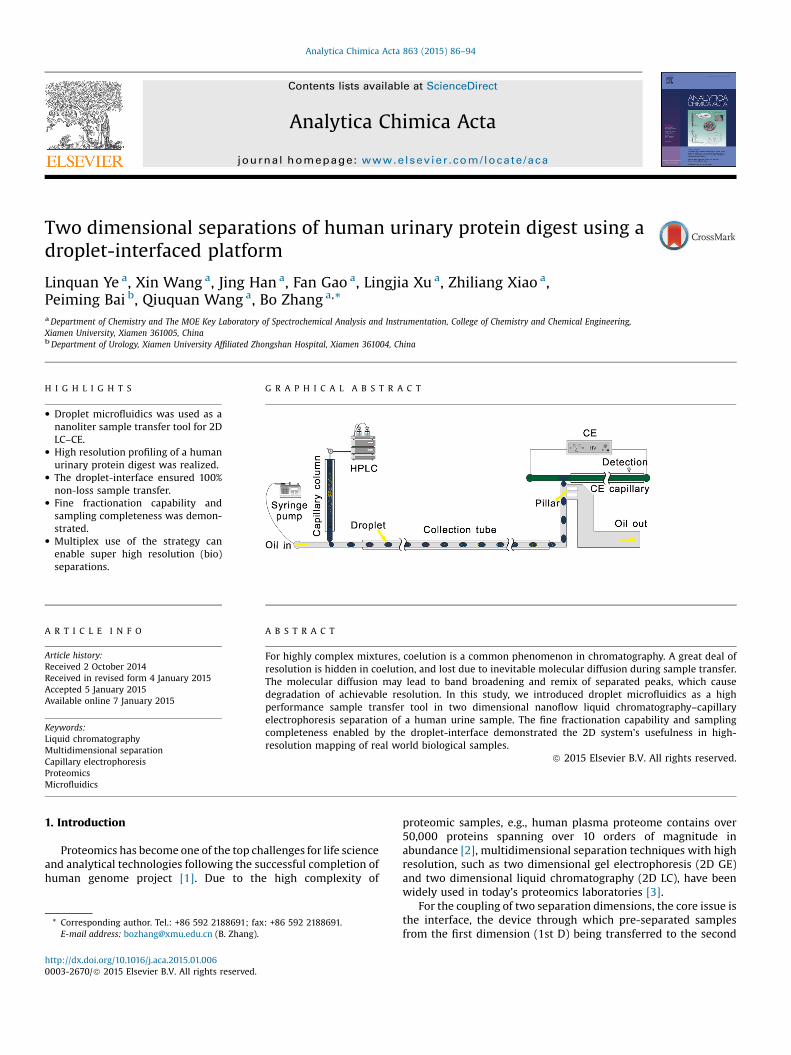
Two dimensional separations of human urinary protein digest using a droplet-interfaced platform Linquan Ye a , Xin Wang a , Jing Han a , Fan Gao a , Lingjia Xu a , Zhiliang Xiao a , Peiming Bai b , Qiuquan Wang a , Bo Zhang a, * a Department of Chemistry and The MOE Key Laboratory of Spectrochemical Analysis and Instrumentation, College of Chemistry and Chemical Engineering, Xiamen University, Xiamen 361005, China b Department of Urology, Xiamen University Affiliated Zhongshan Hospital, Xiamen 361004, China HIGHLIGHTS GRAPHICAL ABSTRACT Droplet microfluidics was used as a nanoliter sample transfer tool for 2D LC–CE. High resolution profiling of a human urinary protein digest was realized. The droplet-interface ensured 100% non-loss sample transfer. Fine fractionation capability and sampling completeness was demon- strated. Multiplex use of the strategy can enable super high resolution (bio) separations. ARTICLE INFO Article history: Received 2 October 2014 Received in revised form 4 January 2015 Accepted 5 January 2015 Available online 7 January 2015 Keywords: Liquid chromatography Multidimensional separation Capillary electrophoresis Proteomics Microfluidics ABSTRACT For highly complex mixtures, coelution is a common phenomenon in chromatography. A great deal of resolution is hidden in coelution, and lost due to inevitable molecular diffusion during sample transfer. The molecular diffusion may lead to band broadening and remix of separated peaks, which cause degradation of achievable resolution. In this study, we introduced droplet microfluidics as a high performance sample transfer tool in two dimensional nanoflow liquid chromatography–capillary electrophoresis separation of a human urine sample. The fine fractionation capability and sampling completeness enabled by the droplet-interface demonstrated the 2D system’s usefulness in high- resolution mapping of real world biological samples. ã 2015 Elsevier B.V. All rights reserved. 1. Introduction Proteomics has become one of the top challenges for life science and analytical technologies following the successful completion of human genome project [1]. Due to the high complexity of proteomic samples, e.g., human plasma proteome contains over 50,000 proteins spanning over 10 orders of magnitude in abundance [2], multidimensional separation techniques with high resolution, such as two dimensional gel electrophoresis (2D GE) and two dimensional liquid chromatography (2D LC), have been widely used in today’s proteomics laboratories [3]. For the coupling of two separation dimensions, the core issue is the interface, the device through which pre-separated samples from the first dimension (1st D) being transferred to the second * Corresponding author. Tel.: +86 592 2188691; fax: +86 592 2188691. E-mail address: [email protected] (B. Zhang). http://dx.doi.org/10.1016/j.aca.2015.01.006 0003-2670/ ã 2015 Elsevier B.V. All rights reserved. Analytica Chimica Acta 863 (2015) 86–94 Contents lists available at ScienceDirect Analytica Chimica Acta journal homepage: www.elsevier.com/locate/aca
Transcript of Analytica Chimica Acta - chem.xmu.edu.cnchem.xmu.edu.cn/zzjg/anal/wangqiuquan/article/Analytica...
Analytica Chimica Acta 863 (2015) 86–94
Contents lists available at ScienceDirect
Analytica Chimica Acta
journal homepage: www.elsev ier .com/ locate /aca
Two dimensional separations of human urinary protein digest using adroplet-interfaced platform
Linquan Ye a, Xin Wang a, Jing Han a, Fan Gao a, Lingjia Xu a, Zhiliang Xiao a,Peiming Bai b, Qiuquan Wang a, Bo Zhang a,*aDepartment of Chemistry and The MOE Key Laboratory of Spectrochemical Analysis and Instrumentation, College of Chemistry and Chemical Engineering,Xiamen University, Xiamen 361005, ChinabDepartment of Urology, Xiamen University Affiliated Zhongshan Hospital, Xiamen 361004, China
H I G H L I G H T S
* Corresponding author. Tel.: +86 592 2188691; faxE-mail address: [email protected] (B. Zhang).
http://dx.doi.org/10.1016/j.aca.2015.01.0060003-2670/ã 2015 Elsevier B.V. All rights reserved.
G R A P H I C A L A B S T R A C T
� Droplet microfluidics was used as ananoliter sample transfer tool for 2DLC–CE.
� High resolution profiling of a humanurinary protein digest was realized.
� The droplet-interface ensured 100%non-loss sample transfer.
� Fine fractionation capability andsampling completeness was demon-strated.
� Multiplex use of the strategy canenable super high resolution (bio)separations.
A R T I C L E I N F O
Article history:
Received 2 October 2014Received in revised form 4 January 2015Accepted 5 January 2015Available online 7 January 2015Keywords:Liquid chromatographyMultidimensional separationCapillary electrophoresisProteomicsMicrofluidics
A B S T R A C T
For highly complex mixtures, coelution is a common phenomenon in chromatography. A great deal ofresolution is hidden in coelution, and lost due to inevitable molecular diffusion during sample transfer.The molecular diffusion may lead to band broadening and remix of separated peaks, which causedegradation of achievable resolution. In this study, we introduced droplet microfluidics as a highperformance sample transfer tool in two dimensional nanoflow liquid chromatography–capillaryelectrophoresis separation of a human urine sample. The fine fractionation capability and samplingcompleteness enabled by the droplet-interface demonstrated the 2D system’s usefulness in high-resolution mapping of real world biological samples.
ã 2015 Elsevier B.V. All rights reserved.
1. Introduction
Proteomics has become one of the top challenges for life scienceand analytical technologies following the successful completion ofhuman genome project [1]. Due to the high complexity of
: +86 592 2188691.
proteomic samples, e.g., human plasma proteome contains over50,000 proteins spanning over 10 orders of magnitude inabundance [2], multidimensional separation techniques with highresolution, such as two dimensional gel electrophoresis (2D GE)and two dimensional liquid chromatography (2D LC), have beenwidely used in today’s proteomics laboratories [3].
For the coupling of two separation dimensions, the core issue isthe interface, the device through which pre-separated samplesfrom the first dimension (1st D) being transferred to the second
L. Ye et al. / Analytica Chimica Acta 863 (2015) 86–94 87
separation dimension (2nd D), ideally, without sacrificing theresolution achieved in 1st D [4]. Conventionally used 2D liquidphase separation strategies transfer samples between dimensionsin a continuous flow manner [5]. In general, the risk of resolutionloss in a 2D interface is reflected in three aspects: (1) bandbroadening, since molecular diffusion is always taking place, longsample transfer time and/or flow path may lead to peak dispersionand result in less efficient peaks [6]; (2) remix, when adjacentpeaks experience such molecular diffusion, the already separatedpeaks in 1st D may merge back during sample transfer; (3)fractionation frequency, according to the theoretical work [7], apeak should be sampled at least three times in order to retain itsresolution in transferring from 1st to 2nd dimension. Therefore,high frequency fractionation of sample peaks is preferred.Moreover, real-world proteomic samples may have only limitedamount available for analysis, e.g., diseased tissue or even singletumor cells. Therefore, multidimensional separations based onmicrocolumn techniques [8,9], such as nanoflow liquid chroma-tography (nanoLC) and capillary electrophoresis (CE), have becomethe method of choice, especially in the case when coupled withmass spectrometer (MS). Consequently, high performance inter-face technology which can support nanoliter fluid manipulationand high resolution and non-loss sample transfer is in greatdemand for proteomic separations.
Droplet microfluidics uses two immiscible phases, e.g., aqueousand oil, to generate and manipulate discontinuous fluid flow[10,11]. It enables diffusion-free operation of extremely smallvolumes of liquid, such as micro- to nanoliter and even down tofemtoliter [12,13]. From a separation science point of view [14],droplet microfluidics has multiple advantages in securing highperformance sample transfer. Using droplet microfluidics, contin-uous flow of liquid phase separations, such as HPLC and CE, can beconverted to discontinuous droplet flow with a finely controllableresolution [15–23]. In this way, following a separation, analytesdistributed spatially and temporally in the continuous effluentflow can be compartmentalized into a series of discrete dropletfractions, with their spatiotemporal resolution well maintained.Therefore, the abovementioned issues, such as band dispersion
[(Fig._1)TD$FIG]
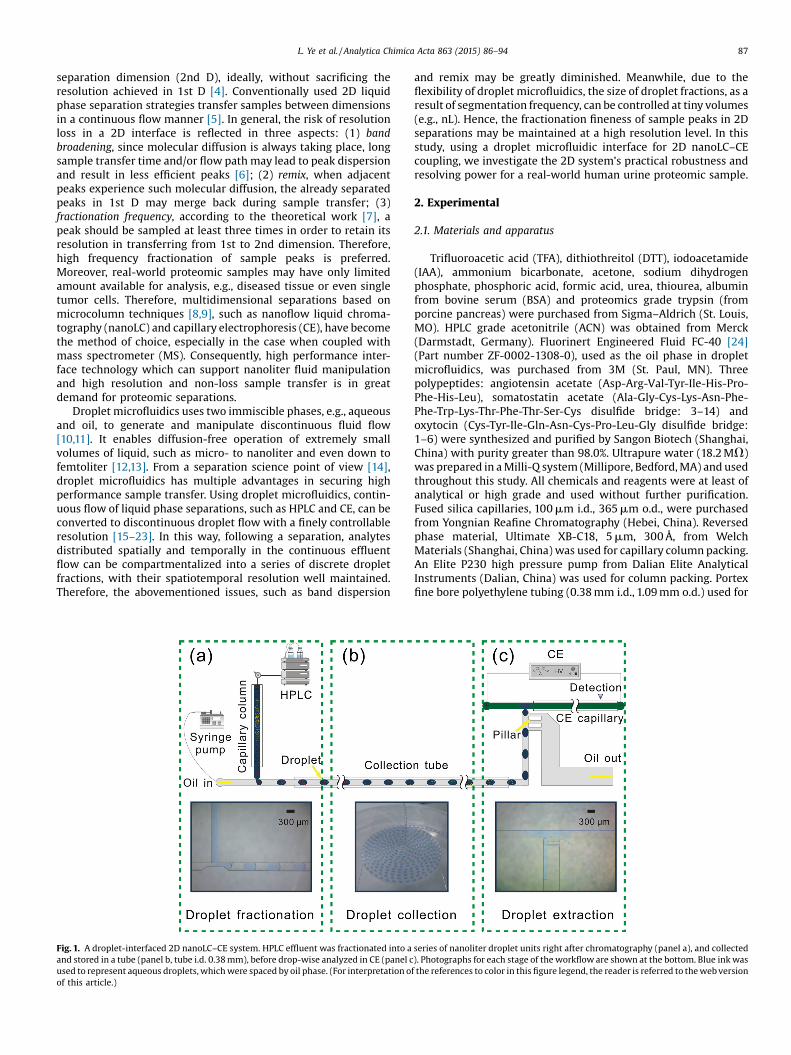
Fig. 1. A droplet-interfaced 2D nanoLC–CE system. HPLC effluent was fractionated into aand stored in a tube (panel b, tube i.d. 0.38mm), before drop-wise analyzed in CE (panel cused to represent aqueous droplets,whichwere spaced by oil phase. (For interpretation oof this article.)
and remix may be greatly diminished. Meanwhile, due to theflexibility of droplet microfluidics, the size of droplet fractions, as aresult of segmentation frequency, can be controlled at tiny volumes(e.g., nL). Hence, the fractionation fineness of sample peaks in 2Dseparations may be maintained at a high resolution level. In thisstudy, using a droplet microfluidic interface for 2D nanoLC–CEcoupling, we investigate the 2D system’s practical robustness andresolving power for a real-world human urine proteomic sample.
2. Experimental
2.1. Materials and apparatus
Trifluoroacetic acid (TFA), dithiothreitol (DTT), iodoacetamide(IAA), ammonium bicarbonate, acetone, sodium dihydrogenphosphate, phosphoric acid, formic acid, urea, thiourea, albuminfrom bovine serum (BSA) and proteomics grade trypsin (fromporcine pancreas) were purchased from Sigma–Aldrich (St. Louis,MO). HPLC grade acetonitrile (ACN) was obtained from Merck(Darmstadt, Germany). Fluorinert Engineered Fluid FC-40 [24](Part number ZF-0002-1308-0), used as the oil phase in dropletmicrofluidics, was purchased from 3M (St. Paul, MN). Threepolypeptides: angiotensin acetate (Asp-Arg-Val-Tyr-Ile-His-Pro-Phe-His-Leu), somatostatin acetate (Ala-Gly-Cys-Lys-Asn-Phe-Phe-Trp-Lys-Thr-Phe-Thr-Ser-Cys disulfide bridge: 3–14) andoxytocin (Cys-Tyr-Ile-Gln-Asn-Cys-Pro-Leu-Gly disulfide bridge:1–6) were synthesized and purified by Sangon Biotech (Shanghai,China) with purity greater than 98.0%. Ultrapure water (18.2MV)was prepared in aMilli-Q system (Millipore, Bedford,MA) and usedthroughout this study. All chemicals and reagents were at least ofanalytical or high grade and used without further purification.Fused silica capillaries, 100mm i.d., 365mm o.d., were purchasedfrom Yongnian Reafine Chromatography (Hebei, China). Reversedphase material, Ultimate XB-C18, 5mm, 300Å, from WelchMaterials (Shanghai, China) was used for capillary columnpacking.An Elite P230 high pressure pump from Dalian Elite AnalyticalInstruments (Dalian, China) was used for column packing. Portexfine bore polyethylene tubing (0.38mm i.d., 1.09mm o.d.) used for
series of nanoliter droplet units right after chromatography (panel a), and collected). Photographs for each stage of theworkfloware shown at the bottom. Blue inkwasf the references to color in thisfigure legend, the reader is referred to thewebversion
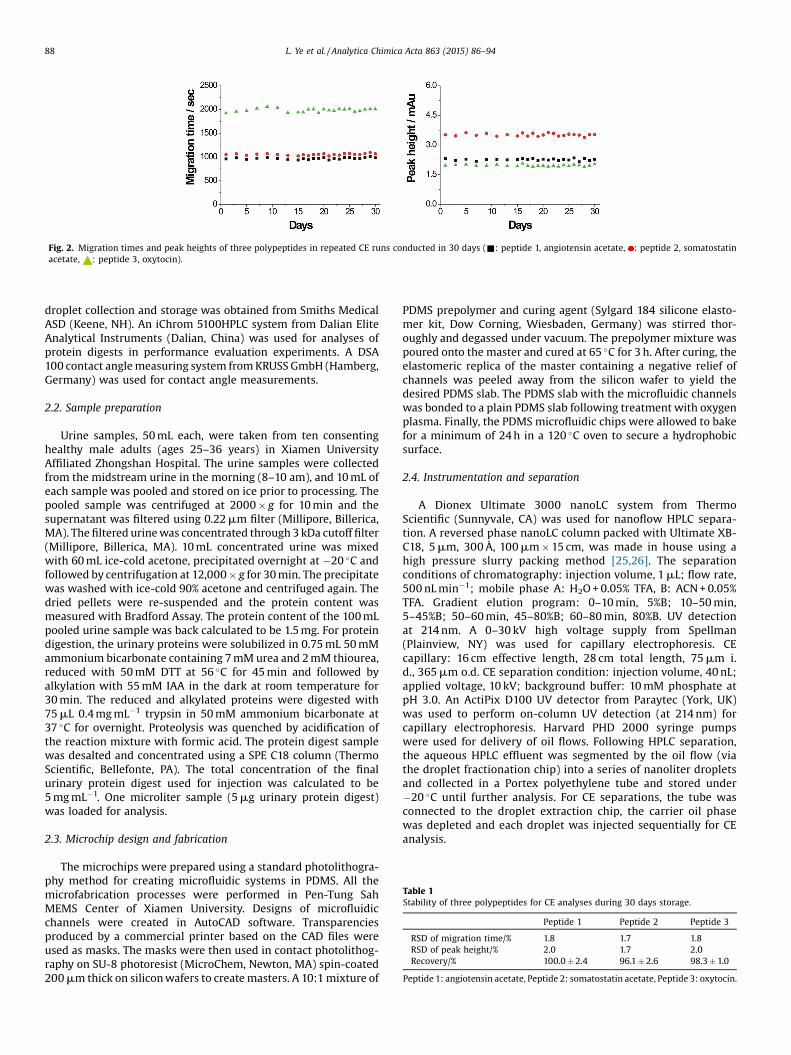
Table 1Stability of three polypeptides for CE analyses during 30 days storage.
Peptide 1 Peptide 2 Peptide 3
RSD of migration time/% 1.8 1.7 1.8RSD of peak height/% 2.0 1.7 2.0Recovery/% 100.0�2.4 96.1�2.6 98.3�1.0
Peptide 1: angiotensin acetate, Peptide 2: somatostatin acetate, Peptide 3: oxytocin.
[(Fig._2)TD$FIG]
Fig. 2. Migration times and peak heights of three polypeptides in repeated CE runs conducted in 30 days (&: peptide 1, angiotensin acetate, [TD$INLINE]: peptide 2, somatostatinacetate, [TD$INLINE]: peptide 3, oxytocin).
88 L. Ye et al. / Analytica Chimica Acta 863 (2015) 86–94
droplet collection and storage was obtained from Smiths MedicalASD (Keene, NH). An iChrom 5100HPLC system from Dalian EliteAnalytical Instruments (Dalian, China) was used for analyses ofprotein digests in performance evaluation experiments. A DSA100 contact anglemeasuring system fromKRUSSGmbH (Hamberg,Germany) was used for contact angle measurements.
2.2. Sample preparation
Urine samples, 50mL each, were taken from ten consentinghealthy male adults (ages 25–36 years) in Xiamen UniversityAffiliated Zhongshan Hospital. The urine samples were collectedfrom the midstream urine in the morning (8–10 am), and 10mL ofeach sample was pooled and stored on ice prior to processing. Thepooled sample was centrifuged at 2000� g for 10min and thesupernatant was filtered using 0.22mm filter (Millipore, Billerica,MA). Thefiltered urinewas concentrated through 3kDa cutoff filter(Millipore, Billerica, MA). 10mL concentrated urine was mixedwith 60mL ice-cold acetone, precipitated overnight at �20 �C andfollowed by centrifugation at 12,000� g for 30min. The precipitatewas washed with ice-cold 90% acetone and centrifuged again. Thedried pellets were re-suspended and the protein content wasmeasured with Bradford Assay. The protein content of the 100mLpooled urine sample was back calculated to be 1.5mg. For proteindigestion, the urinary proteins were solubilized in 0.75mL 50mMammonium bicarbonate containing 7mMurea and 2mM thiourea,reduced with 50mM DTT at 56 �C for 45min and followed byalkylation with 55mM IAA in the dark at room temperature for30min. The reduced and alkylated proteins were digested with75mL 0.4mgmL�1 trypsin in 50mM ammonium bicarbonate at37 �C for overnight. Proteolysis was quenched by acidification ofthe reaction mixture with formic acid. The protein digest samplewas desalted and concentrated using a SPE C18 column (ThermoScientific, Bellefonte, PA). The total concentration of the finalurinary protein digest used for injection was calculated to be5mgmL�1. One microliter sample (5mg urinary protein digest)was loaded for analysis.
2.3. Microchip design and fabrication
The microchips were prepared using a standard photolithogra-phy method for creating microfluidic systems in PDMS. All themicrofabrication processes were performed in Pen-Tung SahMEMS Center of Xiamen University. Designs of microfluidicchannels were created in AutoCAD software. Transparenciesproduced by a commercial printer based on the CAD files wereused as masks. The masks were then used in contact photolithog-raphy on SU-8 photoresist (MicroChem, Newton, MA) spin-coated200mm thick on siliconwafers to createmasters. A 10:1mixture of
PDMS prepolymer and curing agent (Sylgard 184 silicone elasto-mer kit, Dow Corning, Wiesbaden, Germany) was stirred thor-oughly and degassed under vacuum. The prepolymer mixture waspoured onto the master and cured at 65 �C for 3h. After curing, theelastomeric replica of the master containing a negative relief ofchannels was peeled away from the silicon wafer to yield thedesired PDMS slab. The PDMS slab with the microfluidic channelswas bonded to a plain PDMS slab following treatment with oxygenplasma. Finally, the PDMS microfluidic chips were allowed to bakefor a minimum of 24h in a 120 �C oven to secure a hydrophobicsurface.
2.4. Instrumentation and separation
A Dionex Ultimate 3000 nanoLC system from ThermoScientific (Sunnyvale, CA) was used for nanoflow HPLC separa-tion. A reversed phase nanoLC column packed with Ultimate XB-C18, 5mm, 300Å, 100mm�15 cm, was made in house using ahigh pressure slurry packing method [25,26]. The separationconditions of chromatography: injection volume, 1mL; flow rate,500 nLmin�1; mobile phase A: H2O+ 0.05% TFA, B: ACN+0.05%TFA. Gradient elution program: 0–10min, 5%B; 10–50min,5–45%B; 50–60min, 45–80%B; 60–80min, 80%B. UV detectionat 214nm. A 0–30 kV high voltage supply from Spellman(Plainview, NY) was used for capillary electrophoresis. CEcapillary: 16 cm effective length, 28 cm total length, 75mm i.d., 365mm o.d. CE separation condition: injection volume, 40nL;applied voltage, 10 kV; background buffer: 10mM phosphate atpH 3.0. An ActiPix D100 UV detector from Paraytec (York, UK)was used to perform on-column UV detection (at 214nm) forcapillary electrophoresis. Harvard PHD 2000 syringe pumpswere used for delivery of oil flows. Following HPLC separation,the aqueous HPLC effluent was segmented by the oil flow (viathe droplet fractionation chip) into a series of nanoliter dropletsand collected in a Portex polyethylene tube and stored under�20 �C until further analysis. For CE separations, the tube wasconnected to the droplet extraction chip, the carrier oil phasewas depleted and each droplet was injected sequentially for CEanalysis.
[(Fig._3)TD$FIG]
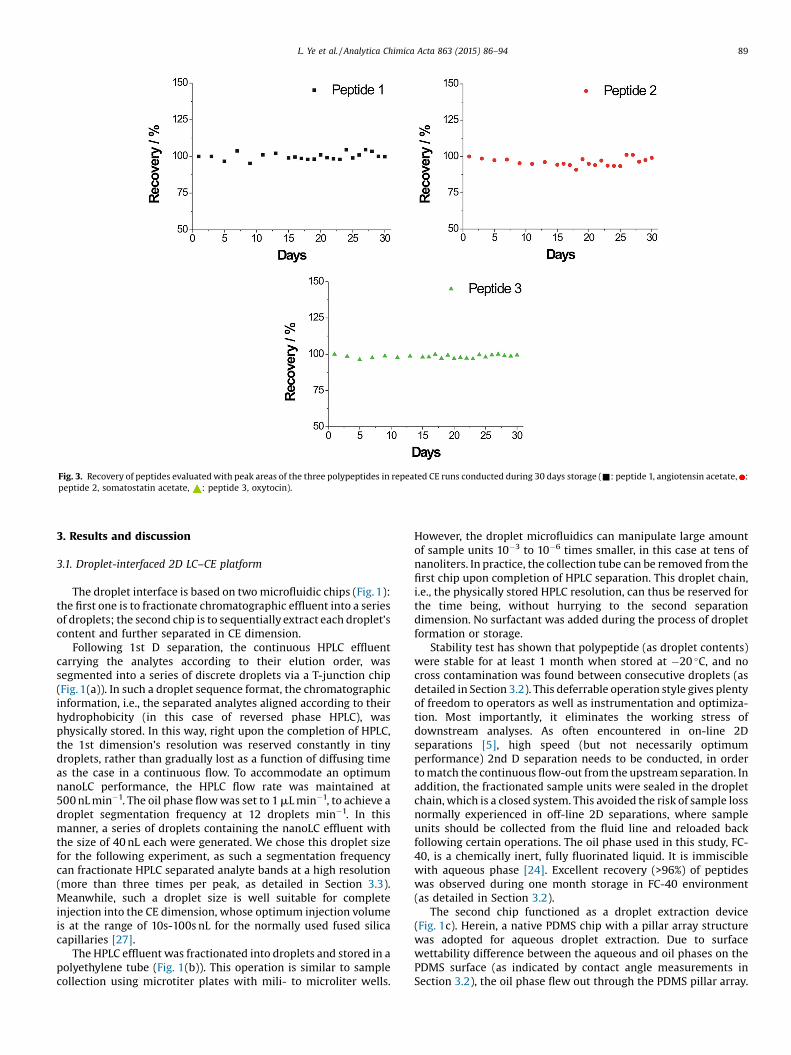
Fig. 3. Recovery of peptides evaluated with peak areas of the three polypeptides in repeated CE runs conducted during 30 days storage (&: peptide 1, angiotensin acetate, [TD$INLINE]:peptide 2, somatostatin acetate, [TD$INLINE]: peptide 3, oxytocin).
L. Ye et al. / Analytica Chimica Acta 863 (2015) 86–94 89
3. Results and discussion
3.1. Droplet-interfaced 2D LC–CE platform
The droplet interface is based on twomicrofluidic chips (Fig. 1):the first one is to fractionate chromatographic effluent into a seriesof droplets; the second chip is to sequentially extract each droplet’scontent and further separated in CE dimension.
Following 1st D separation, the continuous HPLC effluentcarrying the analytes according to their elution order, wassegmented into a series of discrete droplets via a T-junction chip(Fig. 1(a)). In such a droplet sequence format, the chromatographicinformation, i.e., the separated analytes aligned according to theirhydrophobicity (in this case of reversed phase HPLC), wasphysically stored. In this way, right upon the completion of HPLC,the 1st dimension’s resolution was reserved constantly in tinydroplets, rather than gradually lost as a function of diffusing timeas the case in a continuous flow. To accommodate an optimumnanoLC performance, the HPLC flow rate was maintained at500nLmin�1. The oil phase flowwas set to 1mLmin�1, to achieve adroplet segmentation frequency at 12 droplets min�1. In thismanner, a series of droplets containing the nanoLC effluent withthe size of 40nL each were generated. We chose this droplet sizefor the following experiment, as such a segmentation frequencycan fractionate HPLC separated analyte bands at a high resolution(more than three times per peak, as detailed in Section 3.3).Meanwhile, such a droplet size is well suitable for completeinjection into the CE dimension, whose optimum injection volumeis at the range of 10s-100s nL for the normally used fused silicacapillaries [27].
The HPLC effluent was fractionated into droplets and stored in apolyethylene tube (Fig. 1(b)). This operation is similar to samplecollection using microtiter plates with mili- to microliter wells.
However, the droplet microfluidics can manipulate large amountof sample units 10�3 to 10�6 times smaller, in this case at tens ofnanoliters. In practice, the collection tube can be removed from thefirst chip upon completion of HPLC separation. This droplet chain,i.e., the physically stored HPLC resolution, can thus be reserved forthe time being, without hurrying to the second separationdimension. No surfactant was added during the process of dropletformation or storage.
Stability test has shown that polypeptide (as droplet contents)were stable for at least 1 month when stored at �20 �C, and nocross contamination was found between consecutive droplets (asdetailed in Section 3.2). This deferrable operation style gives plentyof freedom to operators as well as instrumentation and optimiza-tion. Most importantly, it eliminates the working stress ofdownstream analyses. As often encountered in on-line 2Dseparations [5], high speed (but not necessarily optimumperformance) 2nd D separation needs to be conducted, in ordertomatch the continuous flow-out from the upstream separation. Inaddition, the fractionated sample units were sealed in the dropletchain, which is a closed system. This avoided the risk of sample lossnormally experienced in off-line 2D separations, where sampleunits should be collected from the fluid line and reloaded backfollowing certain operations. The oil phase used in this study, FC-40, is a chemically inert, fully fluorinated liquid. It is immisciblewith aqueous phase [24]. Excellent recovery (>96%) of peptideswas observed during one month storage in FC-40 environment(as detailed in Section 3.2).
The second chip functioned as a droplet extraction device(Fig. 1c). Herein, a native PDMS chip with a pillar array structurewas adopted for aqueous droplet extraction. Due to surfacewettability difference between the aqueous and oil phases on thePDMS surface (as indicated by contact angle measurements inSection 3.2), the oil phase flew out through the PDMS pillar array.
[(Fig._4)TD$FIG]
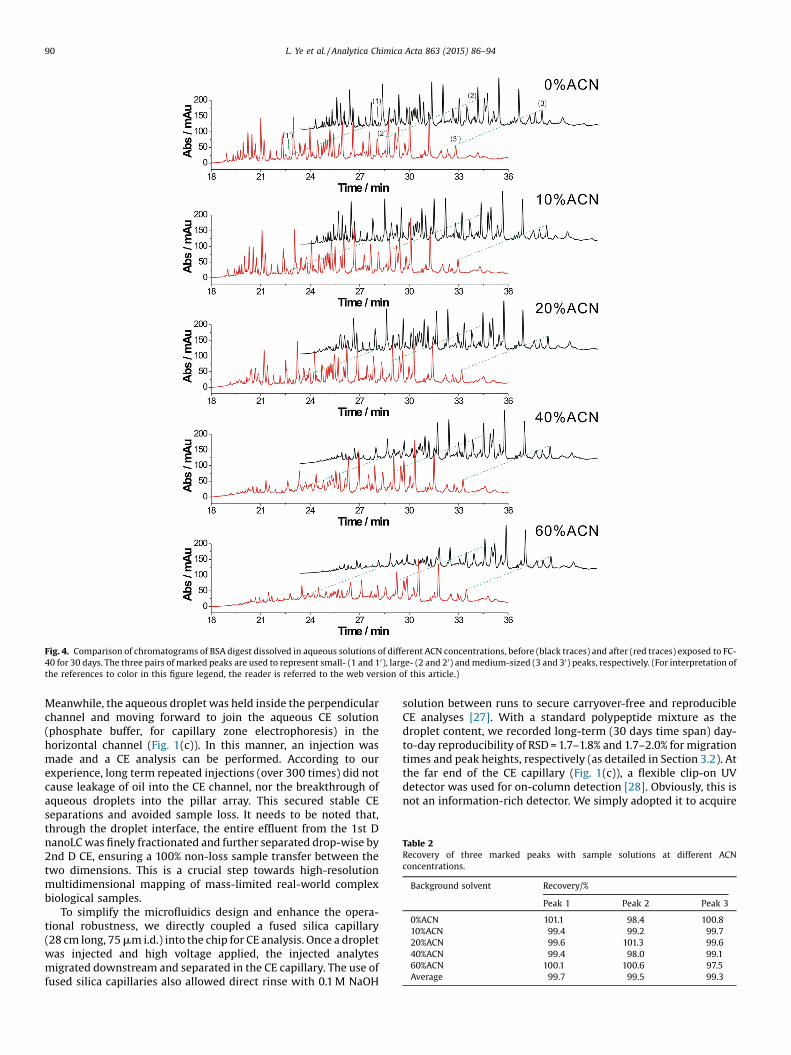
Fig. 4. Comparison of chromatograms of BSA digest dissolved in aqueous solutions of different ACN concentrations, before (black traces) and after (red traces) exposed to FC-40 for 30 days. The three pairs of marked peaks are used to represent small- (1 and 10), large- (2 and 20) andmedium-sized (3 and 30) peaks, respectively. (For interpretation ofthe references to color in this figure legend, the reader is referred to the web version of this article.)
Table 2Recovery of three marked peaks with sample solutions at different ACNconcentrations.
Background solvent Recovery/%
Peak 1 Peak 2 Peak 3
0%ACN 101.1 98.4 100.810%ACN 99.4 99.2 99.720%ACN 99.6 101.3 99.640%ACN 99.4 98.0 99.160%ACN 100.1 100.6 97.5Average 99.7 99.5 99.3
90 L. Ye et al. / Analytica Chimica Acta 863 (2015) 86–94
Meanwhile, the aqueous droplet was held inside the perpendicularchannel and moving forward to join the aqueous CE solution(phosphate buffer, for capillary zone electrophoresis) in thehorizontal channel (Fig. 1(c)). In this manner, an injection wasmade and a CE analysis can be performed. According to ourexperience, long term repeated injections (over 300 times) did notcause leakage of oil into the CE channel, nor the breakthrough ofaqueous droplets into the pillar array. This secured stable CEseparations and avoided sample loss. It needs to be noted that,through the droplet interface, the entire effluent from the 1st DnanoLCwas finely fractionated and further separated drop-wise by2nd D CE, ensuring a 100% non-loss sample transfer between thetwo dimensions. This is a crucial step towards high-resolutionmultidimensional mapping of mass-limited real-world complexbiological samples.
To simplify the microfluidics design and enhance the opera-tional robustness, we directly coupled a fused silica capillary(28 cm long, 75mm i.d.) into the chip for CE analysis. Once a dropletwas injected and high voltage applied, the injected analytesmigrated downstream and separated in the CE capillary. The use offused silica capillaries also allowed direct rinse with 0.1M NaOH
solution between runs to secure carryover-free and reproducibleCE analyses [27]. With a standard polypeptide mixture as thedroplet content, we recorded long-term (30 days time span) day-to-day reproducibility of RSD=1.7–1.8% and 1.7–2.0% for migrationtimes and peak heights, respectively (as detailed in Section 3.2). Atthe far end of the CE capillary (Fig. 1(c)), a flexible clip-on UVdetector was used for on-column detection [28]. Obviously, this isnot an information-rich detector. We simply adopted it to acquire
[(Fig._5)TD$FIG]
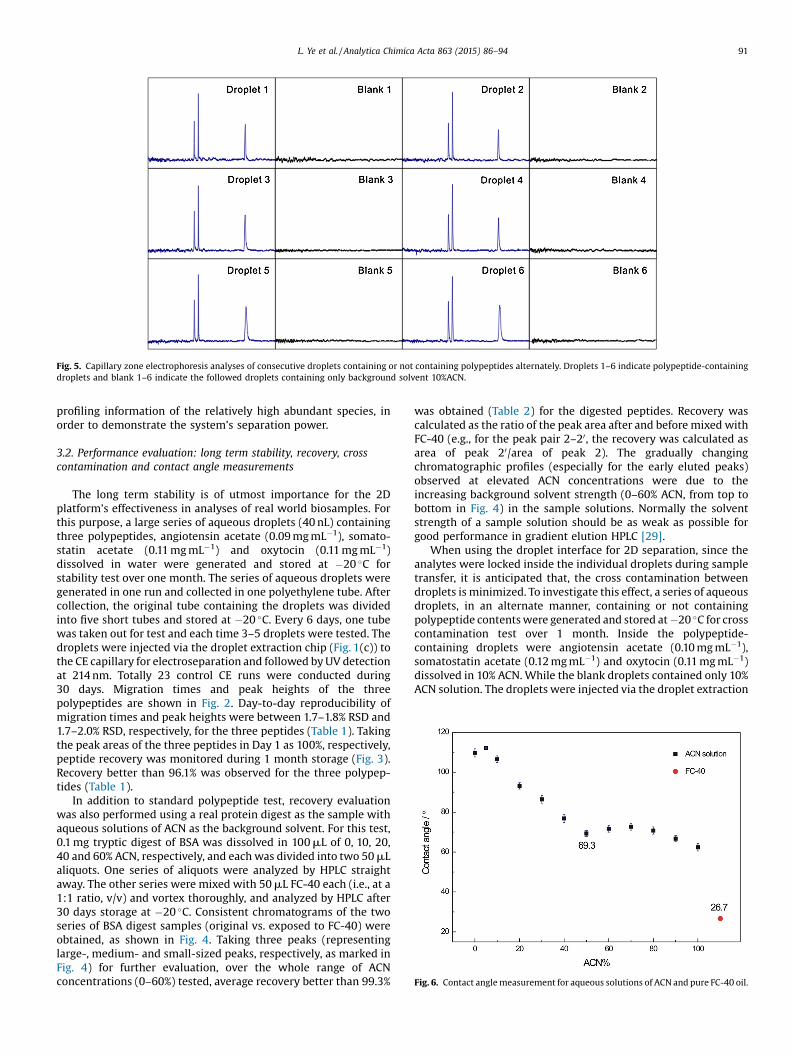
Fig. 5. Capillary zone electrophoresis analyses of consecutive droplets containing or not containing polypeptides alternately. Droplets 1–6 indicate polypeptide-containingdroplets and blank 1–6 indicate the followed droplets containing only background solvent 10%ACN.
[(Fig._6)TD$FIG]
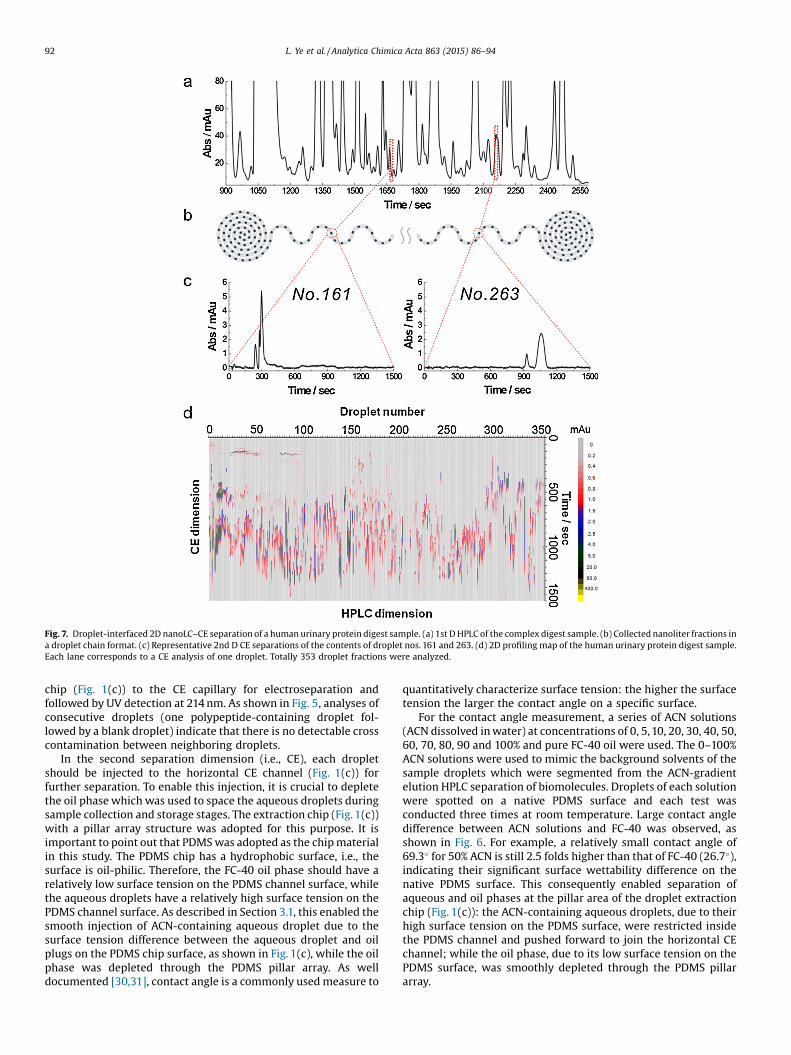
Fig. 6. Contact anglemeasurement for aqueous solutions of ACN and pure FC-40 oil.
L. Ye et al. / Analytica Chimica Acta 863 (2015) 86–94 91
profiling information of the relatively high abundant species, inorder to demonstrate the system’s separation power.
3.2. Performance evaluation: long term stability, recovery, crosscontamination and contact angle measurements
The long term stability is of utmost importance for the 2Dplatform’s effectiveness in analyses of real world biosamples. Forthis purpose, a large series of aqueous droplets (40nL) containingthree polypeptides, angiotensin acetate (0.09mgmL�1), somato-statin acetate (0.11mgmL�1) and oxytocin (0.11mgmL�1)dissolved in water were generated and stored at �20 �C forstability test over one month. The series of aqueous droplets weregenerated in one run and collected in one polyethylene tube. Aftercollection, the original tube containing the droplets was dividedinto five short tubes and stored at �20 �C. Every 6 days, one tubewas taken out for test and each time 3–5 droplets were tested. Thedroplets were injected via the droplet extraction chip (Fig. 1(c)) tothe CE capillary for electroseparation and followed byUV detectionat 214nm. Totally 23 control CE runs were conducted during30 days. Migration times and peak heights of the threepolypeptides are shown in Fig. 2. Day-to-day reproducibility ofmigration times and peak heights were between 1.7–1.8% RSD and1.7–2.0% RSD, respectively, for the three peptides (Table 1). Takingthe peak areas of the three peptides in Day 1 as 100%, respectively,peptide recovery was monitored during 1 month storage (Fig. 3).Recovery better than 96.1% was observed for the three polypep-tides (Table 1).
In addition to standard polypeptide test, recovery evaluationwas also performed using a real protein digest as the sample withaqueous solutions of ACN as the background solvent. For this test,0.1mg tryptic digest of BSA was dissolved in 100mL of 0, 10, 20,40 and 60% ACN, respectively, and each was divided into two 50mLaliquots. One series of aliquots were analyzed by HPLC straightaway. The other series were mixed with 50mL FC-40 each (i.e., at a1:1 ratio, v/v) and vortex thoroughly, and analyzed by HPLC after30 days storage at �20 �C. Consistent chromatograms of the twoseries of BSA digest samples (original vs. exposed to FC-40) wereobtained, as shown in Fig. 4. Taking three peaks (representinglarge-, medium- and small-sized peaks, respectively, as marked inFig. 4) for further evaluation, over the whole range of ACNconcentrations (0–60%) tested, average recovery better than 99.3%
was obtained (Table 2) for the digested peptides. Recovery wascalculated as the ratio of the peak area after and before mixed withFC-40 (e.g., for the peak pair 2–20, the recovery was calculated asarea of peak 20/area of peak 2). The gradually changingchromatographic profiles (especially for the early eluted peaks)observed at elevated ACN concentrations were due to theincreasing background solvent strength (0–60% ACN, from top tobottom in Fig. 4) in the sample solutions. Normally the solventstrength of a sample solution should be as weak as possible forgood performance in gradient elution HPLC [29].
When using the droplet interface for 2D separation, since theanalytes were locked inside the individual droplets during sampletransfer, it is anticipated that, the cross contamination betweendroplets is minimized. To investigate this effect, a series of aqueousdroplets, in an alternate manner, containing or not containingpolypeptide contentswere generated and stored at�20 �C for crosscontamination test over 1 month. Inside the polypeptide-containing droplets were angiotensin acetate (0.10mgmL�1),somatostatin acetate (0.12mgmL�1) and oxytocin (0.11mgmL�1)dissolved in 10% ACN. While the blank droplets contained only 10%ACN solution. The droplets were injected via the droplet extraction
[(Fig._7)TD$FIG]
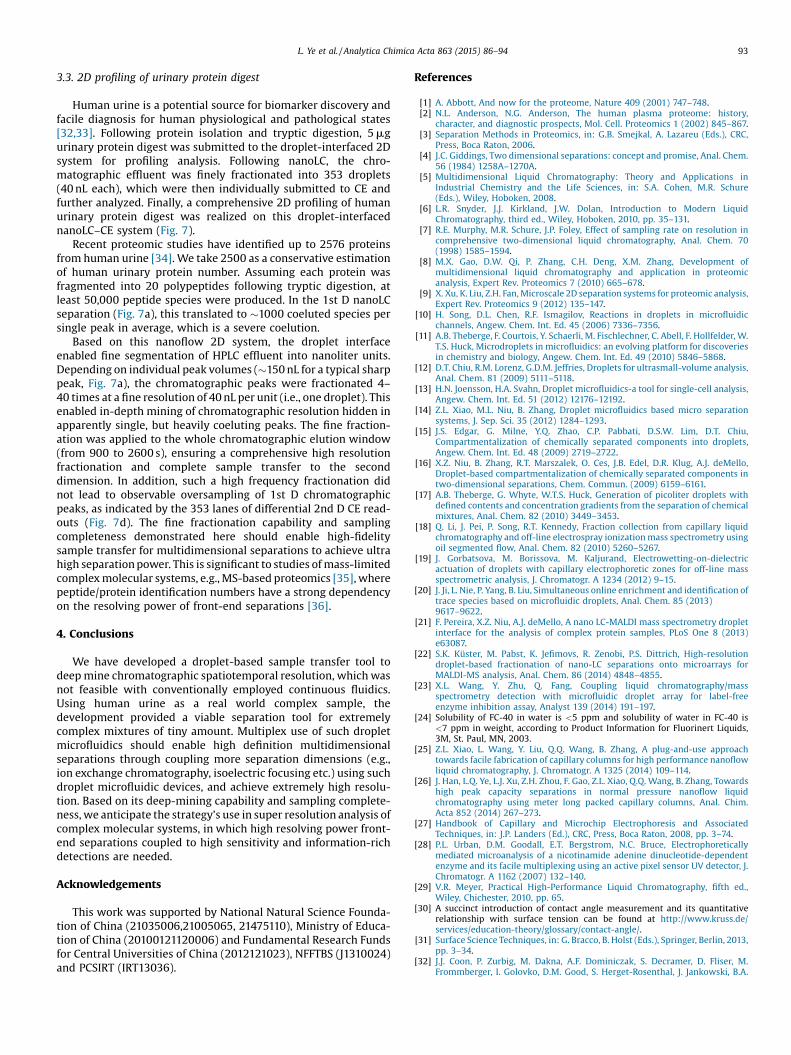
Fig. 7. Droplet-interfaced 2D nanoLC–CE separation of a human urinary protein digest sample. (a) 1st DHPLC of the complex digest sample. (b) Collected nanoliter fractions ina droplet chain format. (c) Representative 2nd D CE separations of the contents of droplet nos. 161 and 263. (d) 2D profiling map of the human urinary protein digest sample.Each lane corresponds to a CE analysis of one droplet. Totally 353 droplet fractions were analyzed.
92 L. Ye et al. / Analytica Chimica Acta 863 (2015) 86–94
chip (Fig. 1(c)) to the CE capillary for electroseparation andfollowed by UV detection at 214nm. As shown in Fig. 5, analyses ofconsecutive droplets (one polypeptide-containing droplet fol-lowed by a blank droplet) indicate that there is no detectable crosscontamination between neighboring droplets.
In the second separation dimension (i.e., CE), each dropletshould be injected to the horizontal CE channel (Fig. 1(c)) forfurther separation. To enable this injection, it is crucial to depletethe oil phase which was used to space the aqueous droplets duringsample collection and storage stages. The extraction chip (Fig. 1(c))with a pillar array structure was adopted for this purpose. It isimportant to point out that PDMSwas adopted as the chipmaterialin this study. The PDMS chip has a hydrophobic surface, i.e., thesurface is oil-philic. Therefore, the FC-40 oil phase should have arelatively low surface tension on the PDMS channel surface, whilethe aqueous droplets have a relatively high surface tension on thePDMS channel surface. As described in Section 3.1, this enabled thesmooth injection of ACN-containing aqueous droplet due to thesurface tension difference between the aqueous droplet and oilplugs on the PDMS chip surface, as shown in Fig. 1(c), while the oilphase was depleted through the PDMS pillar array. As welldocumented [30,31], contact angle is a commonly usedmeasure to
quantitatively characterize surface tension: the higher the surfacetension the larger the contact angle on a specific surface.
For the contact angle measurement, a series of ACN solutions(ACN dissolved inwater) at concentrations of 0, 5,10, 20, 30, 40, 50,60, 70, 80, 90 and 100% and pure FC-40 oil were used. The 0–100%ACN solutions were used to mimic the background solvents of thesample droplets which were segmented from the ACN-gradientelution HPLC separation of biomolecules. Droplets of each solutionwere spotted on a native PDMS surface and each test wasconducted three times at room temperature. Large contact angledifference between ACN solutions and FC-40 was observed, asshown in Fig. 6. For example, a relatively small contact angle of69.3� for 50% ACN is still 2.5 folds higher than that of FC-40 (26.7�),indicating their significant surface wettability difference on thenative PDMS surface. This consequently enabled separation ofaqueous and oil phases at the pillar area of the droplet extractionchip (Fig. 1(c)): the ACN-containing aqueous droplets, due to theirhigh surface tension on the PDMS surface, were restricted insidethe PDMS channel and pushed forward to join the horizontal CEchannel; while the oil phase, due to its low surface tension on thePDMS surface, was smoothly depleted through the PDMS pillararray.
L. Ye et al. / Analytica Chimica Acta 863 (2015) 86–94 93
3.3. 2D profiling of urinary protein digest
Human urine is a potential source for biomarker discovery andfacile diagnosis for human physiological and pathological states[32,33]. Following protein isolation and tryptic digestion, 5mgurinary protein digest was submitted to the droplet-interfaced 2Dsystem for profiling analysis. Following nanoLC, the chro-matographic effluent was finely fractionated into 353 droplets(40nL each), which were then individually submitted to CE andfurther analyzed. Finally, a comprehensive 2D profiling of humanurinary protein digest was realized on this droplet-interfacednanoLC–CE system (Fig. 7).
Recent proteomic studies have identified up to 2576 proteinsfrom human urine [34]. We take 2500 as a conservative estimationof human urinary protein number. Assuming each protein wasfragmented into 20 polypeptides following tryptic digestion, atleast 50,000 peptide species were produced. In the 1st D nanoLCseparation (Fig. 7a), this translated to �1000 coeluted species persingle peak in average, which is a severe coelution.
Based on this nanoflow 2D system, the droplet interfaceenabled fine segmentation of HPLC effluent into nanoliter units.Depending on individual peak volumes (�150nL for a typical sharppeak, Fig. 7a), the chromatographic peaks were fractionated 4–40 times at afine resolution of 40nL per unit (i.e., one droplet). Thisenabled in-depth mining of chromatographic resolution hidden inapparently single, but heavily coeluting peaks. The fine fraction-ation was applied to the whole chromatographic elution window(from 900 to 2600 s), ensuring a comprehensive high resolutionfractionation and complete sample transfer to the seconddimension. In addition, such a high frequency fractionation didnot lead to observable oversampling of 1st D chromatographicpeaks, as indicated by the 353 lanes of differential 2nd D CE read-outs (Fig. 7d). The fine fractionation capability and samplingcompleteness demonstrated here should enable high-fidelitysample transfer for multidimensional separations to achieve ultrahigh separationpower. This is significant to studies ofmass-limitedcomplexmolecular systems, e.g.,MS-based proteomics [35], wherepeptide/protein identification numbers have a strong dependencyon the resolving power of front-end separations [36].
4. Conclusions
We have developed a droplet-based sample transfer tool todeepmine chromatographic spatiotemporal resolution, whichwasnot feasible with conventionally employed continuous fluidics.Using human urine as a real world complex sample, thedevelopment provided a viable separation tool for extremelycomplex mixtures of tiny amount. Multiplex use of such dropletmicrofluidics should enable high definition multidimensionalseparations through coupling more separation dimensions (e.g.,ion exchange chromatography, isoelectric focusing etc.) using suchdroplet microfluidic devices, and achieve extremely high resolu-tion. Based on its deep-mining capability and sampling complete-ness, we anticipate the strategy’s use in super resolution analysis ofcomplex molecular systems, in which high resolving power front-end separations coupled to high sensitivity and information-richdetections are needed.
Acknowledgements
This work was supported by National Natural Science Founda-tion of China (21035006,21005065, 21475110), Ministry of Educa-tion of China (20100121120006) and Fundamental Research Fundsfor Central Universities of China (2012121023), NFFTBS (J1310024)and PCSIRT (IRT13036).
References
[1] A. Abbott, And now for the proteome, Nature 409 (2001) 747–748.[2] N.L. Anderson, N.G. Anderson, The human plasma proteome: history,
character, and diagnostic prospects, Mol. Cell. Proteomics 1 (2002) 845–867.[3] Separation Methods in Proteomics, in: G.B. Smejkal, A. Lazareu (Eds.), CRC,
Press, Boca Raton, 2006.[4] J.C. Giddings, Two dimensional separations: concept and promise, Anal. Chem.
56 (1984) 1258A–1270A.[5] Multidimensional Liquid Chromatography: Theory and Applications in
Industrial Chemistry and the Life Sciences, in: S.A. Cohen, M.R. Schure(Eds.), Wiley, Hoboken, 2008.
[6] L.R. Snyder, J.J. Kirkland, J.W. Dolan, Introduction to Modern LiquidChromatography, third ed., Wiley, Hoboken, 2010, pp. 35–131.
[7] R.E. Murphy, M.R. Schure, J.P. Foley, Effect of sampling rate on resolution incomprehensive two-dimensional liquid chromatography, Anal. Chem. 70(1998) 1585–1594.
[8] M.X. Gao, D.W. Qi, P. Zhang, C.H. Deng, X.M. Zhang, Development ofmultidimensional liquid chromatography and application in proteomicanalysis, Expert Rev. Proteomics 7 (2010) 665–678.
[9] X. Xu, K. Liu, Z.H. Fan,Microscale 2D separation systems for proteomic analysis,Expert Rev. Proteomics 9 (2012) 135–147.
[10] H. Song, D.L. Chen, R.F. Ismagilov, Reactions in droplets in microfluidicchannels, Angew. Chem. Int. Ed. 45 (2006) 7336–7356.
[11] A.B. Theberge, F. Courtois, Y. Schaerli, M. Fischlechner, C. Abell, F. Hollfelder, W.T.S. Huck, Microdroplets in microfluidics: an evolving platform for discoveriesin chemistry and biology, Angew. Chem. Int. Ed. 49 (2010) 5846–5868.
[12] D.T. Chiu, R.M. Lorenz, G.D.M. Jeffries, Droplets for ultrasmall-volume analysis,Anal. Chem. 81 (2009) 5111–5118.
[13] H.N. Joensson, H.A. Svahn, Droplet microfluidics-a tool for single-cell analysis,Angew. Chem. Int. Ed. 51 (2012) 12176–12192.
[14] Z.L. Xiao, M.L. Niu, B. Zhang, Droplet microfluidics based micro separationsystems, J. Sep. Sci. 35 (2012) 1284–1293.
[15] J.S. Edgar, G. Milne, Y.Q. Zhao, C.P. Pabbati, D.S.W. Lim, D.T. Chiu,Compartmentalization of chemically separated components into droplets,Angew. Chem. Int. Ed. 48 (2009) 2719–2722.
[16] X.Z. Niu, B. Zhang, R.T. Marszalek, O. Ces, J.B. Edel, D.R. Klug, A.J. deMello,Droplet-based compartmentalization of chemically separated components intwo-dimensional separations, Chem. Commun. (2009) 6159–6161.
[17] A.B. Theberge, G. Whyte, W.T.S. Huck, Generation of picoliter droplets withdefined contents and concentration gradients from the separation of chemicalmixtures, Anal. Chem. 82 (2010) 3449–3453.
[18] Q. Li, J. Pei, P. Song, R.T. Kennedy, Fraction collection from capillary liquidchromatography and off-line electrospray ionizationmass spectrometry usingoil segmented flow, Anal. Chem. 82 (2010) 5260–5267.
[19] J. Gorbatsova, M. Borissova, M. Kaljurand, Electrowetting-on-dielectricactuation of droplets with capillary electrophoretic zones for off-line massspectrometric analysis, J. Chromatogr. A 1234 (2012) 9–15.
[20] J. Ji, L. Nie, P. Yang, B. Liu, Simultaneous online enrichment and identification oftrace species based on microfluidic droplets, Anal. Chem. 85 (2013)9617–9622.
[21] F. Pereira, X.Z. Niu, A.J. deMello, A nano LC-MALDI mass spectrometry dropletinterface for the analysis of complex protein samples, PLoS One 8 (2013)e63087.
[22] S.K. Küster, M. Pabst, K. Jefimovs, R. Zenobi, P.S. Dittrich, High-resolutiondroplet-based fractionation of nano-LC separations onto microarrays forMALDI-MS analysis, Anal. Chem. 86 (2014) 4848–4855.
[23] X.L. Wang, Y. Zhu, Q. Fang, Coupling liquid chromatography/massspectrometry detection with microfluidic droplet array for label-freeenzyme inhibition assay, Analyst 139 (2014) 191–197.
[24] Solubility of FC-40 in water is <5 ppm and solubility of water in FC-40 is<7 ppm in weight, according to Product Information for Fluorinert Liquids,3M, St. Paul, MN, 2003.
[25] Z.L. Xiao, L. Wang, Y. Liu, Q.Q. Wang, B. Zhang, A plug-and-use approachtowards facile fabrication of capillary columns for high performance nanoflowliquid chromatography, J. Chromatogr. A 1325 (2014) 109–114.
[26] J. Han, L.Q. Ye, L.J. Xu, Z.H. Zhou, F. Gao, Z.L. Xiao, Q.Q. Wang, B. Zhang, Towardshigh peak capacity separations in normal pressure nanoflow liquidchromatography using meter long packed capillary columns, Anal. Chim.Acta 852 (2014) 267–273.
[27] Handbook of Capillary and Microchip Electrophoresis and AssociatedTechniques, in: J.P. Landers (Ed.), CRC, Press, Boca Raton, 2008, pp. 3–74.
[28] P.L. Urban, D.M. Goodall, E.T. Bergstrom, N.C. Bruce, Electrophoreticallymediated microanalysis of a nicotinamide adenine dinucleotide-dependentenzyme and its facile multiplexing using an active pixel sensor UV detector, J.Chromatogr. A 1162 (2007) 132–140.
[29] V.R. Meyer, Practical High-Performance Liquid Chromatography, fifth ed.,Wiley, Chichester, 2010, pp. 65.
[30] A succinct introduction of contact angle measurement and its quantitativerelationship with surface tension can be found at http://www.kruss.de/services/education-theory/glossary/contact-angle/.
[31] Surface Science Techniques, in: G. Bracco, B. Holst (Eds.), Springer, Berlin, 2013,pp. 3–34.
[32] J.J. Coon, P. Zurbig, M. Dakna, A.F. Dominiczak, S. Decramer, D. Fliser, M.Frommberger, I. Golovko, D.M. Good, S. Herget-Rosenthal, J. Jankowski, B.A.
94 L. Ye et al. / Analytica Chimica Acta 863 (2015) 86–94
Julian, M. Kellmann, W. Kolch, Z. Massy, J. Novak, K. Rossing, J.P. Schanstra, E.Schiffer, D. Theodorescu, R. Vanholder, E.M.Weissinger, H.Mischak, P. Schmitt-Kopplin, CE–MS analysis of the human urinary proteome for biomarkerdiscovery and disease diagnostics, Proteomics Clin. Appl. 2 (2008) 964–973.
[33] S. Decramer, A.G. de Peredo, B. Breuil, H. Mischak, B. Monsarrat, J.L. Bascands, J.P. Schanstraa, Urine in clinical proteomics, Mol. Cell. Proteomics 7 (2008)1850–1862.
[34] A. Marimuthu, R.N. O’Meally, R. Chaerkady, Y. Subbannayya, V. Nanjappa, P.Kumar, D.S. Kelkar, S.M. Pinto, R. Sharma, S. Renuse, R. Goel, R. Christopher, B.
Delanghe, R.N. Cole, H.C. Harsha, A. Pandey, A comprehensive map of thehuman urinary proteome, J. Proteome Res. 10 (2011) 2734–2743.
[35] R. Aebersold, M. Mann, Mass spectrometry-based proteomics, Nature 422(2003) 198–207.
[36] T. Köcher, P. Pichler, R. Swart, K. Mechtler, Analysis of protein mixtures fromwhole-cell extracts by single-run nanoLC–MS/MS using ultralong gradients,Nat. Protoc. 7 (2012) 882–890.
![Analytica Chimica Acta - UT Arlington – UTA · 104 K.A. Schug et al. / Analytica Chimica Acta 713 (2012) 103–110 large pharmaceuticalcompanies[8,9].Infact,onlytwonewclasses of](https://static.fdocuments.in/doc/165x107/5c67dd2009d3f226588c984a/analytica-chimica-acta-ut-arlington-104-ka-schug-et-al-analytica.jpg)