Centralized analytic software? Yes, an analytic software ...

ANALYTIC PERFORMANCE OF TWO-GRID ACCELERATOR DESIGNS FOR KAUFMAN THRUSTERS
by W a l t e r C. Lathem
Lewis Research Center Cleveland, Ohio 44135
N A T I O N A L A E R O N A U T I C S A N D S P A C E A D M I N I S T R A T I O N W A S H I N G T O N , 0.

TECH LIBRARY KAFB, NM
"
1. Report No. 2. Government Accession No.
NASA TN D-6275 "
4. Title and Subtitle ANALYTIC PERFORMANCE OF TWO-GRID ACCELERATOR DESIGNS FOR KAUFMAN THRUSTERS
7. Author(s)
Wal te r C. Lathem
9. Performing Organization Name and Address
Lewis Resea rch Cen te r Nat ional Aeronaut ics and Space Adminis t ra t ion Cleveland, Ohio 44135
2. Sponsoring Agency Name and Address
National Aeronaut ics and Space Adminis t ra t ion Washington, D. C. 20546
5. Supplementary Notes
T 1
I 1 1
3. Recipient. OL33062
5. Report Date Apri l 1971
6. Performing Organization Code
8. Performing Organization Report NO.
E -6032 10. Work Unit No.
120-26 11. Contract or Grant No.
13. Type of Report and Period Covered
Technical Note 14. Sponsoring Agency Code
16. Abstract
Resu l t s are p resen ted fo r a theo re t i ca l ana lys i s of the performance of two-g r id acce le ra to r sys - t ems fo r Kaufman t h rus t e r s . Six configurat ions were used to cover the range of geometr ies which are of immedia te in te res t . A d ig i ta l computer p rogram was used to f ind ax ia l ly symet r ic so lu- t ions for a single hole of each conf igura t ion . Resul t s are p r e s e n t e d i n t e r m s of maximum cur ren t per hole , th rus t per hole ( including beam divergence effects), and maximum net- to total-voltage rat io consis tent with the prevent ion of e lec t ron backs t reaming. The resu l t s p resented here in should be useful in the design of a c c e l e r a t o r s y s t e m s f o r a var ie ty of appl icat ions. An analysis of the effects of charge-exchange ions on the erosion rate of t he acce le ra to r g r id r e su l t ed i n equa - tions which could be used to predict the expected useful lifetime of the gr id . The equat ions seemed cons is ten t when theore t ica l resu l t s were compared wi th exper imenta l resu l t s for the SERT I1 configuration. However, when applied to the configurations used in this analysis, limita- tions in the usefulness of the model were found and are presented here in .
17. Key Words (Suggested by Author(s) )
Electr ic propuls ion Ion th rus te r Acce le ra to r sys t ems
18. Distribution Statement
Unclassified - unlimited
19. Security Classif. (of this report) 20. Security Classif. (of this page) 22. Price" 21. NO. of Pages
Unclassified I .. Unclassified $3.00 27
For sale by the National Technical Information Service, Springfield, Virginia 22151

ANALYTIC PERFORMANCE OF TWO-GRID ACCELERATOR
DESIGNS FOR KAUFMAN THRUSTERS
by Walter C. Lathem
Lewis Research Center
SUMMARY
Results are presented for a theoretical analysis of the performance of two-grid ac- celerator systems of Kaufman thrusters. Six configurations were used to cover the range of geometries which are of immediate interest. A digital computer program was used to find axially symetric solutions for a single hole of each configuration. Results are presented in terms of maximum current per hole, thrust per hole (including beam di- vergence effects) and maximum net- to total-voltage ratio consistent with the prevention of electron backstreaming. The results presented herein should be useful in the design of accelerator systems for a variety of applications.
An analysis of the effects of charge-exchange ions on the erosion rate of the accel- erator grid resulted in equations which could be used to predict the expected useful life- time of the grid. The equations seemed consistent when theoretical results were com- pared with experimental results for the SERT I1 configuration. However, when applied to the configurations used in this analysis, limitations in the usefulness of the model were found and are presented herein.
INTRODUCTION
Accelerator systems used to extract mercury ions from the plasma discharge of Kaufman thrusters and exhaust them at high velocity have typically been designed by e m - pirical techniques. Performance trends were noted during experimental tests at Lewis Research Center over a period of years, and design "rules of thumb" were established (refs. 1 to 3). Since this early work, various analog and digital computer techniques (refs. 4 to 7) have become available. More recently a theoretical analysis of the effects of varying the geometrical and electrical parameters of a two-grid accelerator system was made (ref. 8). The results initially reported in reference 8 are discussed herein in greater detail. In addition, the results of the charge-exchange ion erosion portion of this analysis are correlated with experimental erosion results for a 1000-hour life test of a .)

SERT I1 accelerator grid system (ref. 9). SERT stands for Space Electric Rocket Test. The SERT I1 mission is an orbi ta l test of a 15-centimeter-diameter Kaufman thruster. The SERT I1 vehicle was launched on February 2, 1970.
The analysis reported herein uti l izes a more detailed description of the shape and location of the downstream plasma boundary and ion impingement patterns on the accel- erator grid than has been previously reported.
MODEL
Figure 1 is a cutaway view of a typical two-grid accelerator system showing the sin- gle hole model. The holes in this grid set are match drilled, with the simple untapered holes arranged in a hexagonal array. Figure 2 identifies the geometric variables needed to define the accelerator system. The webbing thickness wa represents the minimum distance between two immediately adjacent holes (see insert, fig. 2).
For the comparison with experimental SERT II erosion results, the observed erosion pattern should also be described. During thruster operation, charge-exchange ions can be formed in the beam region by a transfer of charge between fast-moving beam ions and slow-moving neutral atoms which have escaped the discharge chamber. These newly formed slow ions are attracted by the negative potential of the accelerator grid. When they impinge, metal atoms are sputtered from the grid. Figure 3 shows the resulting erosion in the form of a hexagonal-shaped pattern around each grid hole on a grid which was operated for about 800 hours. The erosion channel depth is a minimum at points midway between immediately adjacent holes (point a) and maximum at center points of three adjacent holes (point B). Obviously, when the channel has been eroded through at point A , the hexagonal section of grid around the hole will separate from the rest of the grid. This section could lodge between grids, which would short out the accelerator sys- tem and cause an immediate end to the usefulness of the grid system. Even if the section of grid separated without causing such problems, the loss of the section would reduce the ion extraction capability of the accelerator system. For subsequent calculation, the use- ful lifetime (on a single -hole basis) is assumed to be the time required for charge- exchange ions to erode through the accelerator grid at point A.
GENERAL APPROACH
There are obviously many possible configurations involving variations in the geomet- r ic parameters shown in figure 2. Figure 4 shows a few representative configurations which were selected to allow interpolation of results to many other configurations. Con- figurations 1, 2, 4, 5 and 6 are labeled to indicate how they differ from configuration 3
2

which was chosen as the basic configuration because in general it is similar to accel- erator systems presently in use (on SERT 11, for example). Numerical values for con- figuration 3 geometrical and electrical parameters are given in table I. Typical varia- tions in five of the variables are described in figure 4 and compared in the included table. The sc reen hole diameter ds was held fixed. In addition, the screen grid thickness ts was held fixed because of limitations involved in using the digital computer program. The reason becomes clear upon examination of figure 5. Although the screen thickness in f igure 5(b) is twice that in figure 5(a) the discharge chamber plasma boundary in both cases is such that the bounded regions which must be defined for the computer program are identical. In effect, the screen electrode can extend any depth into the plasma with- out affecting the results of the computer program. In practice, of course, the thicker s c reen of figure 5(b) would lead to more ions recombining on the screen, and poorer over all thruster performance.
A total of 17 different cases, including variations in accelerator grid voltages, beam current levels, and geometric variables were analyzed using a digital computer program (ref. 4) which yielded, as par t of the output, the beam current and the thrust per hole. From these results, values for the maximum current per hole (at constant grid voltage) were obtained for each configuration.
In addition to these cases, the SERT I1 accelerator grid system was analyzed to co r - relate theoretical results with experimental test results and to estimate the expected ac- celerator grid lifetime.
METHOD OF SOLUTION
The digital computer program (ref. 4) was used to obtain the space-charge-limited current and the thrust for each configuration. Computer solutions can be obtained for almost any configuration exhibiting axial symmetry. To obtain alternate solutions for a given geometric configuration, it is only necessary to assign a value of beam current and then vary the shape and location of the plasma sheath until the current density is uniform across the sheath and the assigned value of beam current is obtained. Each solution yields a different total current per hole depending on the sheath positions and the voltages applied to the grids. During actual thruster operation, the level of this current is con- trolled by the ion density in the discharge chamber plasma.
The shape and location of the boundary which separates the ion beam from the neu- tralized downstream plasma can be varied considerably without significant effect on the computed total beam current or ion trajectories. However, as pointed out in reference 6, the location and shape of this boundary are important for explaining the accelerator gr id erosion pat terns caused by charge-exchange ions in experimental thrusters. Var- ious downstream plasma boundaries are shown in figure 6. (This figure is a c r o s s
3
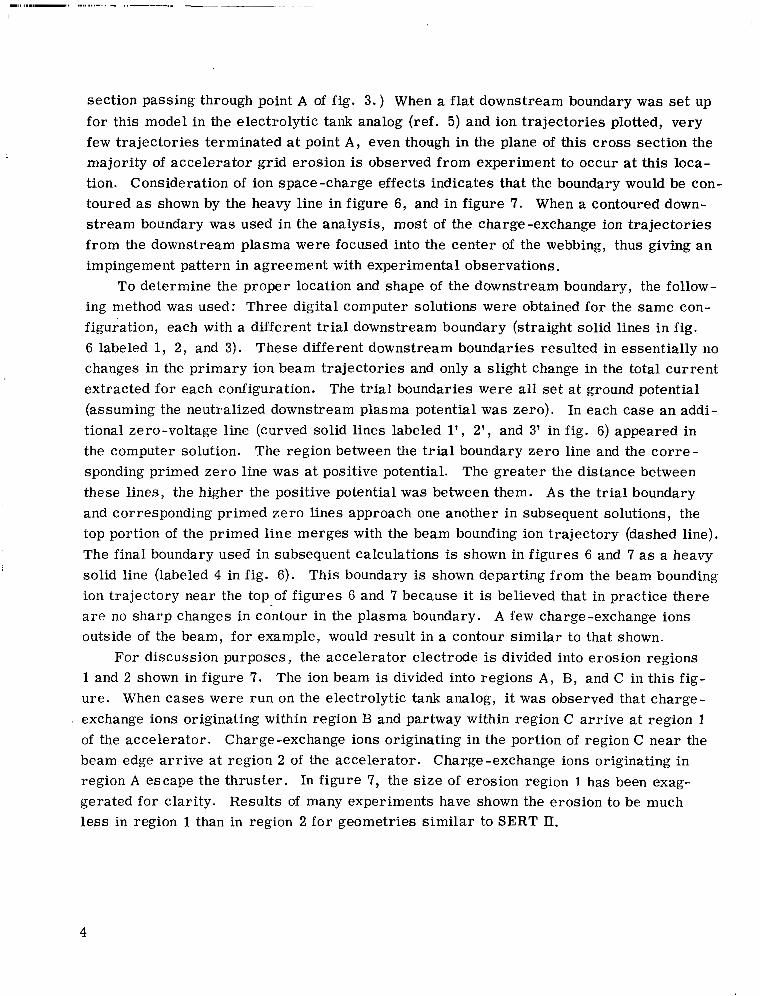
section passing through point A of fig. 3. ) When a flat downstream boundary was set up for this model in the electrolytic tank analog (ref. 5) and ion trajectories plotted, very few trajectories terminated at point A , even though in the plane of this cross section the majority of accelerator gr id erosion is observed from experiment to occur at this loca- tion. Consideration of ion space-charge effects indicates that the boundary would be con- toured as shown by the heavy line in figure 6, and in figure 7 . When a contoured down- stream boundary was used in the analysis, most of the charge-exchange ion trajectories from the downstream plasma were focused into the center of the webbing, thus giving an impingement pattern in agreement with experimental observations.
To determine the proper location and shape of the downstream boundary, the follow- ing method was used: Three digital computer solutions were obtained for the same con- figuration, each with a different trial downstream boundary (straight solid lines in fig. 6 labeled 1, 2 , and 3). These different downstream boundaries resulted in essentially no changes in the primary ion beam trajectories and only a slight change in the total current extracted for each configuration. The trial boundaries were all s e t at ground potential (assuming the neutralized downstream plasma potential was zero). In each case an addi- tional zero-voltage line (curved solid lines labeled 1' , 2', and 3' in fig. 6) appeared in the computer solution. The region between the trial boundary zero line and the corre- sponding primed zero line was at positive potential. The greater the distance between these lines, the higher the positive potential was between them. A s the trial boundary and corresponding primed zero lines approach one another in subsequent solutions, the top portion of the primed l ine merges with the beam bounding ion trajectory (dashed line). The final boundary used in subsequent calculations is shown in figures 6 and 7 as a heavy solid line (labeled 4 in fig. 6). This boundary is shown departing from the beam bounding ion trajectory near the top of figures 6 and 7 because i t is believed that in practice there a r e no sharp changes in contour in the plasma boundary. A few charge-exchange ions outside of the beam, for example, would result in a contour similar to that shown.
For discussion purposes, the accelerator electrode is divided into erosion regions 1 and 2 shown in figure 7. The ion beam is divided into regions A, B, and C in this fig- ure. When cases were run on the electrolytic tank analog, it was observed that charge- exchange ions originating within region B and partway within region C arr ive a t region 1 of the accelerator. Charge-exchange ions originating in the portion of region C near the beam edge arrive at region 2 of the accelerator. Charge-exchange ions originating in region A escape the thruster. In figure 7, the s ize of erosion region 1 has been exag- gerated for clari ty. Results of many experiments have shown the erosion to be much less in region 1 than in region 2 for geometr ies s imilar to SERT II.
4

RESULTS AND DISCUSSION
The results are presented in the following order: The results of the digital computer analysis of the general configurations in t e rms of ion beam optics and electron back- s t reaming l imits are stated. An analytical model used to estimate the grid lifetime for the SERT 11 configuration is then discussed. Finally, some limitations of the model when applied to other configurations are presented.
General Configuration Results
Ion ~ - beam optics. - Results of the digital computer analysis for the 17 cases consid- e red are presented in table 11. The screen voltage (net accelerating voltage) was 1600 volts for these cases. As indicated in column 2 of table 11, the negative voltage was -400 volts for all cases except 2a and 3a, where the voltage was -1067 volts. Geometrically, configurations 2a and 3a were identical to configurations 2 and 3, respectively (see fig. 4). Values of ion beam current per hole are shown in column 3. In several cases a range of beam currents was considered for the same electrode geometry. This required separate solutions for the shape and location of the upstream plasma sheath for each dif- ferent beam current. For cases 2a and 3a, each of the beam currents was obtained by first obtaining sheath solutions for cases 2 and 3 and then changing only the negative ac- celerator voltage. For example, the sheath shape and location which yielded 0.41 milli- amperes in configuration 2 yields 0.63 milliamperes when the voltage is changed to -1067 volts (configuration 2a). This result reflects the 3/2 power relation to the voltage, as would be expected from the Child's law relation.
Corresponding thrust values are shown in column 4 and thrust coefficients in column 5. The thrust coefficients were obtained by dividing the total thrust from the computer program (which corrects for beam divergence) by the theoretical value obtained by as- suming zero divergence. The computer program computes the thrust using the axial component of velocity for each stream tube of current as it crosses the downstream plasma sheath. In some cases (those footnoted in column 5 of table 11), a portion of the beam is intercepted by the accelerator or by the upper boundary of the region of interest before reaching the downstream boundary. This occurs with highly divergent beams. That portion of the beam is not included in the total thrust value given by the computer for such configurations. Therefore, for the footnoted cases the thrust values in column 4 were hand calculated using the ion velocity value given by the computer program at the point of interception with the upper boundary. Ions striking the accelerator were not in- cluded in any case. Even though these velocity values would not be much different than values expected at the downstream boundary, the resulting thrust values were not deemed accurate enough to yield meaningful thrust coefficients. For example, the ions are
5

decelerating in this region and the hand-calculated value using the last-known velocities yields a thrust coefficient greater than unity for at least one case. Table I1 shows that for s imilar beam current levels , all configurations yield approximately the same thrust. This is because the thrust coefficients are all near unity.
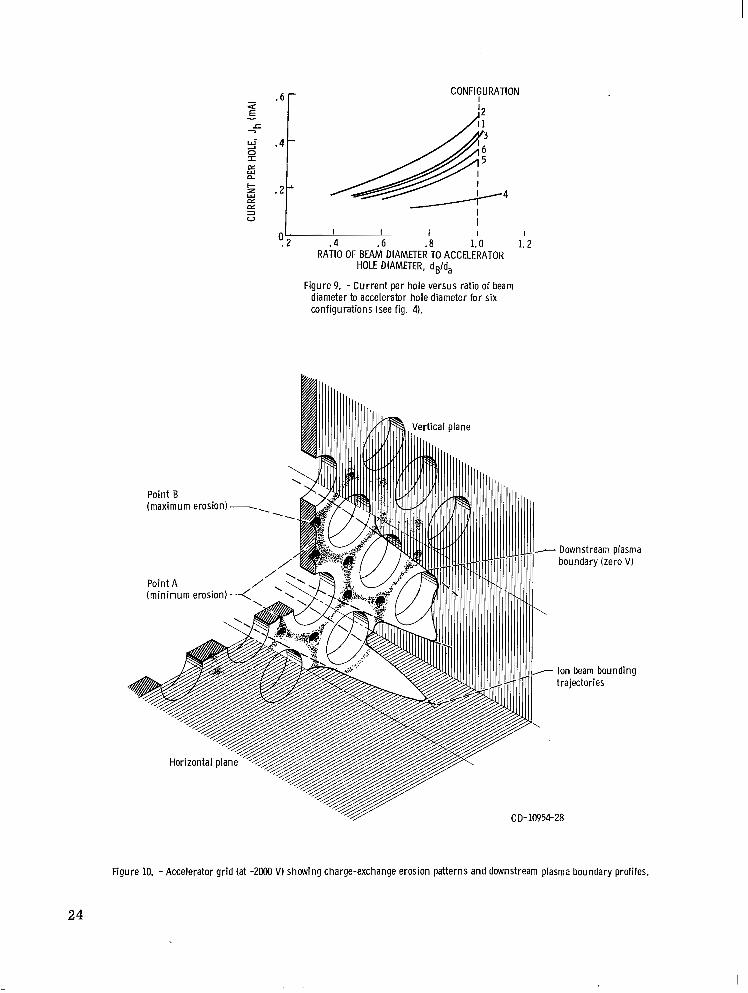
Columns 6, 7, and 8 of table I1 present the data used to determine the maximum al- lowable current per hole values shown in the last column. In that regard, figure 8 indi- cates the effect of beam current variations on the plasma sheath location and the bound- ing ion trajectory for a typical configuration. As the beam current per hole increases, the sheath moves downstream (while becoming flatter) and the ion beam radius increases. By definition herein, the upper limit of beam current is reached when the maximum value of the beam diameter (within the bounds of the accelerator) is equal to the accelerator hole diameter (i. e. , when the ratio of beam diameter to accelerator hole diameter equals unity). Columns 6, 7, and 8 of table I1 summarize the values of maximum beam diam- eters, accelerator hole diameters, and the corresponding ratios for the various config- urations. The beam current per hole values from column 3 are plotted in figure 9 against ra t ios of maximum beam diameter to accelerator hole diameter from column 8.
An extrapolation was used in some cases to reach the line where the ratio was unity (vertical dashed line in fig. 9). Values of the maximum allowable current per hole for each configuration were read from this plot at the points of interception of the curves with the dashed line and tabulated in column 9 of table II. The maximum current per hole values for configurations 2a and 3a were a lso found by the method of figure 9 and, in addi- tion, were checked by calculating them from the values given for configurations 2 and 3 and using a 3/2 power relation of the change in voltage.
It is of interest to compare the results of configurations 3 and 4, where, as noted in figure 4, the only change is in the grid spacing y (i. e . , y4 = 2y3). Fo r a one- dimensional, space-charge-limited flow model, the current scales as the inverse square of the acceleration distance. If the centerline-to-centerline grid spacing ((ts/2) + y + (ta/2)) is used for the acceleration distance, the current-per-hole ratio for configurations 3 and 4 is given by
(All symbols are defined in appendix A . ) From equation (1) a value of 0.17 was calcu- lated for the maximum current per hole of configuration 4. This value compares favor- ably with the value of 0.16 given in table 11, column 9. This acceleration distance also has been used in another analysis (ref. 1) to estimate the fraction of Child's law flow in
6
ion thrusters. The present analysis further supports the idea of using the distance ((ts/2) + y + (ta/2)) as a meaningful ion thruster grid design parameter.
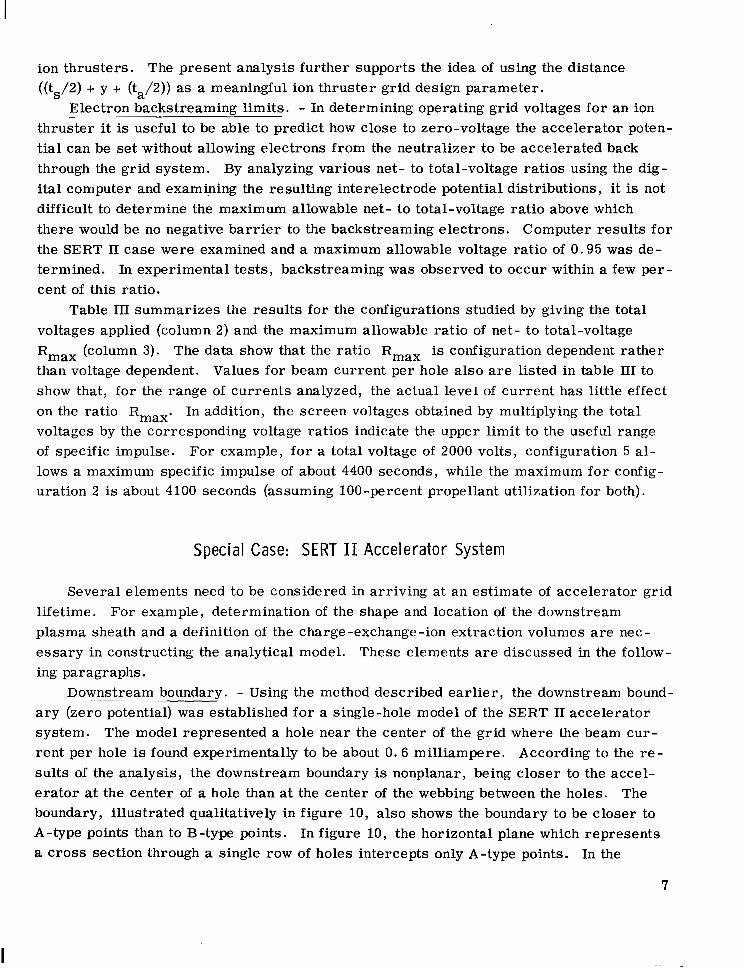
thruster it is useful to be able to predict how close to zero-voltage the accelerator poten- tial can be set without allowing electrons from the neutralizer to be accelerated back through the grid system. By analyzing various net- to total-voltage ratios using the dig- ital computer and examining the resulting interelectrode potential distributions, it is not difficult to determine the maximum allowable net- to total-voltage ratio above which there would be no negative barrier to the backstreaming electrons. Computer results f o r the SERT 11 case were examined and a maximum allowable voltage ratio of 0 .95 was de- termined. In experimental tests, backstreaming was observed to occur within a few per- cent of this ratio.
- Electron ~~ backstreaming " l imits. - In determining operating grid voltages for an ion
Table 111 summarizes the results for the configurations studied by giving the total voltages applied (column 2) and the maximum allowable ratio of net- to total-voltage Rmax (column 3). The data show that the rat io Rmax is configuration dependent rather than voltage dependent. Values for beam current per hole also are listed in table III to show that, for the range of currents analyzed, the actual level of current has little effect on the ratio Rmax. In addition, the screen voltages obtained by multiplying the total voltages by the corresponding voltage ratios indicate the upper limit to the useful range of specific impulse. For example, for a total voltage of 2000 volts, configuration 5 al- lows a maximum specific impulse of about 4400 seconds, while the maximum for config- uration 2 is about 4100 seconds (assuming 100-percent propellant utilization for both).
Special Case: SERT I1 Accelerator System
Several elements need to be considered in arriving at an estimate of accelerator grid lifetime. For example, determination of the shape and location of the downstream plasma sheath and a definition of the charge-exchange-ion extraction volumes are nec- essary in constructing the analytical model. These elements are discussed in the follow- ing paragraphs.
Downstream boundary. - Using the method described earlier, the downstream bound- ary (zero potential) was established for a single-hole model of the SERT I1 accelerator system. The model represented a hole near the center of the grid where the beam cur- rent per hole is found experimentally to be about 0 .6 milliampere. According to the re- sul ts of the analysis, the downstream boundary is nonplanar, being closer to the accel- e r a to r at the center of a hole than at the center of the webbing between the holes. The boundary, illustrated qualitatively in figure 10, also shows the boundary to be closer to A-type points than to B-type points. In figure 10, the horizontal plane which represents a cross section through a single row of holes intercepts only A-type points. In the
~ ~~~

vertical plane, the cross section cuts through both A - and B-type points. The shape of the downstream plasma boundary in the vertical plane indicates that charge-exchange ions accelerated from the plasma to the accelerator would be focused toward the B-type points. In both planes, the shapes indicate a focusing toward the center of the webbing.
For the SERT I1 analytical model, the distance to the downstream plasma boundary where the ion beams intersect at a point (which was assumed to be at zero volts) was es- timated by using the digital computer program to be about 13.0 millimeters. Probe measurements reported in reference 10 indicated that the beam potential was about 40 volts at a distance of 12.7 millimeters from the accelerator. This 40-volt difference between theory and experiment is a small f ract ion of the 2000-volt difference between the accelerator and the boundary. Thus, the apparent agreement between the boundary loca- tion predicted by the analysis and the location found by experimental measurement lends credence to the analytical method used herein for establishing the downstream plasma boundary.
Charge -exchange-ion extraction volume. - Charge -exchange ions responsible for the erosion of region 2 of the accelerator were found to originate in the portion of region C near the ion beam boundary (fig. 7) . The volume of this portion of region C consists of a surface area A, which is formed by the intersection of three conical-shaped beams, and a thickness dc. Although it is difficult to illustrate the area by way of a figure, the calculation is straightforward. Details of the calculation are given in appendix B. The following formula was used to calculate the thickness dc for the SERT I1 configuration:
"2
SA cQ P+P'T dc =
where
A, area of plasma boundary coincident with beam boundary, m
Q cross section for charge-exchange interaction, m
S volume sputtering rate of accelerator material, m /ion
V2 volume of material sputtered from region 2 of the accelerator, m
p' primary beam ion flux, ions/(m )(sec)
po neutral atom density, atoms/m
T total thruster operating t ime, sec
2
2
3
3
2
3
The following procedure was used in applying this formula to the SERT I1 configuration: Surface analysis of a SERT I1 grid which had been tested in a vacuum facility for 1000 hours yielded erosion pit (point B) profiles like those shown in figure 11. The depth of
8

the pits varied with radial position on the grid, with the deepest being at the center of the grid. A typical pit near the center of the grid was about 0. 38 millimeter deep and had a 45' half angle. Since the pits were approximately conical, the volume V2 was calcu- lated on this basis for the deepest pit. The result was V2 = 8. 5X1O-l1 cubic meters.
using 2000-volt charge-exchange ions with normal incidence. The area, A, = 4 . 4 7 ~ 1 0 - ~ square meters, was calculated by the method of appendix B. The cross section, Q = 6 . 4 ~ 1 0 - ~ ' s q u a r e m e t e r s , w a s obtained from reference 13 for 3000-volt primary beam ions. The primary ion f l u x , p' = 2 . 3 5 ~ 1 0 ~ ' i o n s per square meter per second, was obtained by dividing the beam current ( 6 ~ 1 0 - ~ A) by the cross-sectional area of the beam ( 1 . 5 8 ~ 1 0 - ~ m 2 ) in the region near the downstream plasma. The neutral density, po = 7 . 9 ~ 1 0 ~ ~ atoms per cubic meter, was obtained from the equation
The sputtering rate, S = cubic meters, was taken from references 11 and 12
po = 1 J O
1.6X10⁻¹⁹ *BV 4
where Jo is the neutral atom flow in equivalent amperes based on a beam current of 6X10d4 amperes and a propellant utilization efficiency of 85 percent, A B is the c ros s - sectional area of the beam at the downstream boundary ( 1 . 5 8 ~ 1 0 - ~ m 2 ) , and V is the neutral atom velocity from
In equation (4), a temperature of 700 K was used. Finally, the time T w a s 3 . 6 ~ 1 0 seconds (1000 hr). Substitution of all these values in equation (2) yields a thickness dc of 0. 11 mill imeters.
6
This distance seems reasonable when compared to the Debye shielding distance for this region of the downstream plasma. The Debye shielding distance is given by
= 7. 43X1O6rfT2 mil l imeters
where Te is the electron temperature in eV; and pi is the ion density in ions per cubic meter which can be obtained from
I

where p+ has already been given, 7 is the charge-to-mass ratio of singly charged mer- cury ions (4.8~10 C/kg), and Vs is the net accelerating voltage (3 kV). If the average electron temperature is assumed to be 1 eV, the result of equation (5) is AD = 0.11 millimeter, which agrees with the resulting thickness d, previously calculated. It was concluded then that the charge-exchange ions that are responsible for the erosion of the accelerator in region 2 are formed in a volume which can be defined by the portion of the boundary of region C coincident with the bounding ion beam trajectory and a thickness equal to the Debye shielding distance at that point.
5
Theoretical grid lifetime. - A s previously discussed, the useful lifetime of a partic- ular grid for ion extraction is based on the erosion at the minimum erosion channel depth (point A in fig. 10). For the 1.5-millimeter-thick SERT 11 grid, the depth at this point was approximately 7 to 10 percent of the depth at the maximum erosion point, point B (which was 0.38 mm for the deepest pit). Typical erosion depth for an A-type point was about 0.033 mill imeter. A cross sect ion of the erosion channel at point A shows a V- shaped groove (fig. 12). The groove half-angle is defined as a. A l l ions impinging on region 2 are assumed to arrive normal to the plane of the accelerator, and therefore the angle of incidence is defined in figure 12 as p (the angle between the ion trajectory and a normal to the surface of the groove). It is seen that cy is equal to 90' - p.
If atoms sputtered from the surface of such a groove are assumed to leave the s u r - face with a cosine distribution, some of the substrate atoms will redeposit on the opposite walls and effectively reduce the sputtering yield o r erosion rate. In fact , if the impinging ions are uniformly distributed across the groove, the amount of mater ia l which escapes is proportional to sin cy and an effective sputtering yield can be defined as
seff = s X s in cy = S X sin(90 - p) 0 (7)
Data from references 11 and 12 which show the sputtering rate as a function of the angle of incidence p for angles between 0' and 60' were used in conjunction with equation (7) to obtain effective sputtering rates for the SERT I1 case. Results showed that for 2000- volt ions, the effective sputtering rate is nearly constant for this range of p. For lack of data, it was assumed that the effective sputtering rate would remain constant for angles greater than 60'. Data for ions and materials other than mercury and molybdenum indi- cate a peak in the sputtering rate at about 65' to 70°, making this possibly a conservative estimate.
The preceding discussion indicates that even though the erosion-groove geometry changes with time, the effective sputtering rate is approximately linear with time. Data f rom tests of a cesium bombardment engine (ref. 14) indicated that the erosion rate de- creased with time rather than being linear. Therefore a conservative estimate of the use- ful lifetime of the SERT I1 grid can be obtained by a linear extrapolation of the 1000-hour data. The result is a lifetime estimate of about 46 000 hours. This estimate, of course,
10

is for the main region of the accelerator and does not include any localized effects such as are known to exist in the vicinity of the neutralizer.
It should be noted that the grid analyzed here was tested in a 1. 5-meter-diameter by 1.8-meter-long vacuum facility with the beam directed into a frozen mercury target . Ad- ditional mercury atoms would arrive from the target at the accelerator region so that the erosion rate would be lower in a space flight in the absence of such a target.
Limitations of Analytical Model
If the model used to estimate the grid lifetime for the SERT 11 were completely gen- eral, it could be applied to the configurations discussed earlier in this paper. For exam- ple, equation (2) could be rewri t ten in terms of the thruster running time T ; that is,
v2 T =
To apply this equation to the erosion at point A s o that a lifetime estimate can be ob- tained, the volume V2 must be defined in terms of the depth of erosion h at point A and the downstream plasma surface area A, must a lso be defined. The remaining param- eters in equation (8) are readily defined in terms of the particular configuration geometry and voltages.
When an attempt was made to apply the model to all the general configurations, some limitations became readily apparent:
(1) The definition of the downstream plasma surface given earlier cannot be applied to a configuration in which adjacent ion beams diverge very slowly; that is, a smal l d i - vergence angle leads to near-infinite plasma boundary surface areas if the method of ap- pendix B is used. Also, unreasonably high estimates for the distance from the acceler- ator to the downstream plasma sheath are obtained. In this type of configuration the zero potential line cannot be expected to follow the bounding beam trajectory. Additional in- formation is required concerning the detailed behavior of the potential field lines in this region. Examples of configurations exhibiting these low divergence angles are the low- cur ren t cases of configurations 2, 2a, 3, 3a, and 4 (see table II).
(2) A problem arises also for beams with very high divergence angles. In this case the t ra jector ies of adjacent beams intersect upstream of the zero potential line and the plasma boundary surface area as defined in appendix B approaches zero. An infinite- lifetime prediction would result from application of the model to this type of configuration. Erosion on the sides of the holes would also become more important. Examples are the high current cases of configurations 2, 2a, 3, and 3a.
11

(3) A third limitation arises from the inability to predict the erosion volume V2. Without prior knowledge of the erosion-groove dimensions, a calculation is needed which
I involves, among other things, the energy, angle of incidence and distribution of the im- pinging ions. Obtaining this information requires accurate plotting of charge-exchange - ion trajectories start ing from the downstream plasma. To date, this has not been possi- ble because of physical limitations in the electrolytic tank analog and storage limitations in the digital computer program.
It is clear then that a better understanding of the behavior of the downstream plasma sheath is needed. The main drawback to the model presented herein appears to lie with the determination of the plasma boundary for both high- and low-current configurations and the extensive analysis required to predict the charge-exchange erosion volume.
CONCLUDING REMARKS
The effects of varying the geometrical and electrical parameters of a two-grid ion accelerator system have been presented in terms of ion beam optics. The parameters involved included
(1) Screen and accelerator grid thicknesses (2) Screen and accelerator hole diameters (3) Grid separation distance (4) Grid fraction open area (5) Grid voltages (6) Ratio of grid voltages (7) Sheath shapes and location
A number of representative cases were studied which cover a wide range of variables. Additional results can be obtained by scaling and interpolation of the results given.
A SERT I1 grid was examined for experimental erosion data and an extrapolated life- time calculated. Limitations were discussed in conjunction with the application of the model used in the SERT I1 calculation. It was concluded that additional information is still needed to obtain useful lifetime predictions that can be generalized.
Other results of the analysis include the prediction of the accelerator potential needed to prevent electron backstreaming, the definition of a specific impulse range for each configuration and each value of total voltage, and a digital computer technique for locating the position and approximate shape of the downstream plasma boundary.
Lewis Research Center, National Aeronautics and Space Administration,
Cleveland, Ohio, December 28, 1970, 120-26.
12

APPENDIX A
SYMBOLS
dC
dS
h
Jh
JO
Q R
r
S
ta
va
v2 - V
wa
wS
Y
(Y
P
cross-sectional area of beam at downstream boundary, m 2
surface area of charge-exchange-ion extraction volume, m 2
surface area of f rustrum of cone (see appendix B)
surface area of ion beam intersection region (see appendix B)
accelerator hole diameter, m
maximum single-hole ion beam diameter measured within plane of accelerator grid, m
thickness of charge -exchange -ion extraction volume, m
sc reen hole diameter, m
depth of erosion of region 2 at middle of accelerator grid webbing, m
beam current per hole, mA
neutral atom flux, equivalent mA
charge-exchange cross section, m 2
ra t io of screen voltage to total accelerating voltage
radius of ion beam
sputtering rate of accelerator gr id , m 3 /ion
accelerator grid thickness, m
screen grid thickness, m
screen voltage, V
volume of material sputtered from region 2 of accelerator, m 3
neutral atom velocity, m/sec
thickness of webbing between adjacent holes in accelerator grid, m
thickness of webbing between adjacent holes in screen grid, m
grid separation distance, m
erosion-groove half-angle
incidence angle of impinging ion
13
I II

.q charge-to-mass ratio of singly ionized mercury
8 ion beam divergence angle
,u+ primary beam ion f l u x , ion/(m )(sec) 2
a r r iva l rate density of charge-exchange ions at middle of webbing, ion/(m 2 )(set)
po neutral atom density, atoms/m
T thruster operating t ime, sec
3
14
APPENDIX B
SURFACE AREA OF DOWNSTREAM PLASMA BOUNDARY
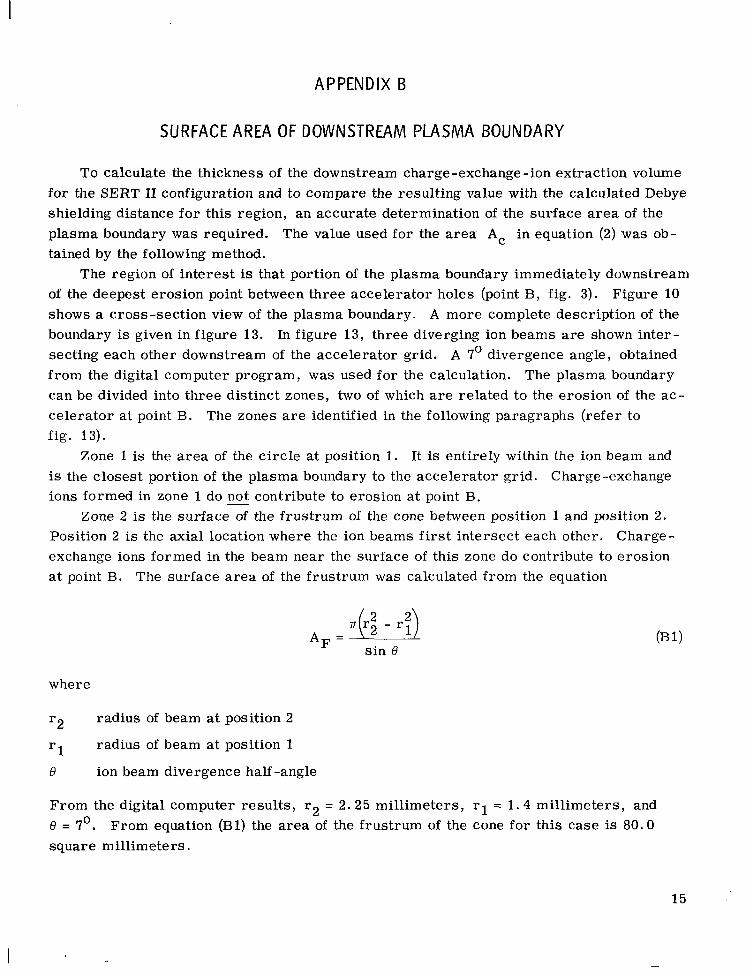
To calculate the thickness of the downstream charge-exchange-ion extraction volume for the SERT II configuration and to compare the resulting value with the calculated Debye shielding distance for this region, an accurate determination of the surface area of the plasma boundary was required. The value used for the area A, in equation (2) was ob- tained by the following method.
The region of interest is that portion of the plasma boundary immediately downstream of the deepest erosion point between three accelerator holes (point B, fig. 3). Figure 10 shows a cross-section view of the plasma boundary. A more complete description of the boundary is given in figure 13. In figure 13, three diverging ion beams are shown inter - secting each other downstream of the accelerator grid. A 7' divergence angle, obtained from the digital computer program, was used for the calculation. The plasma boundary can be divided into three distinct zones, two of which are related to the erosion of the ac- celerator a t point B. The zones are identified in the following paragraphs (refer to fig. 13).
Zone 1 is the area of the circle at position 1. It is entirely within the ion beam and is the closest portion of the plasma boundary to the accelerator grid. Charge-exchange ions formed in zone 1 do - not contribute to erosion at point B.
Zone 2 is the surface of the frustrum of the cone between position 1 and position 2. Position 2 is the axial location where the ion beams first intersect each other. Charge- exchange ions formed in the beam near the surface of this zone do contribute to erosion at point B. The surface area of the frustrum was calculated from the equation
where
r2 radius of beam at position 2
r l radius of beam at position 1
e ion beam divergence half-angle
From the digital computer results, r2 = 2.25 mill imeters, r1 = 1.4 millimeters, and 8 = 7'. From equation (Bl) the area of the frustrum of the cone for this case is 80.0 square mill imeters.
15

Zone 3 is the most difficult to visualize. It is the region where the three ion beams overlap. Each of the three s ides of the pyramid-shaped region shown in figure 13 is associated with one of the three cones. The heavy lines in figure 13 are the locus of points formed by the intersection of each pair of cones. The lines come to a point where all three cones intersect. The surface area of zone 3 can be obtained from the equation
2 '2 A - 0 . 1 6 2 - 1- s i n 0
where r2 and 0 have been previously defined. The result for AI = 6 . 7 square mil l imeters .
All of the zone 3 area A, contributes charge-exchange ions
(B2 )
the SERT I1 case is
that can arrive at point I
B , however, only one-sixth of the zone 2 area AF of each of the three beams contributes at that point; that is,
A C = A I + 3 ( - )
or , for the case considered,
A, = 4 6 . 7 square mill imeters (B4)
This value was used in equation (2) to obtain the result for the plasma thickness dc.
16

REFERENCES
1. Kerslake, William R. : Accelerator Grid Tests on an Electron-Bombardment Ion Rocket. NASA TN D-1168, 1962.
2. Kerslake, William R. ; and Pawlik, Eugene V. : Additional Studies of Screen and Accelerator Grids for Electron-Bombardment Ion Thrusters. NASA TN D-1411, 1963.
3. Kaufman, Harold R. : Performance Correlation for Electron-Bombardment Ion Sources. NASA TN D-3041, 1965.
4. Bogart, Carl D. ; and Richley, Edward A. : A Space-Charge-Flow Computer Program. NASA TN D-3394, 1966.
5. Staggs, John F. : An Electrolytic Tank Analog for Two-Dimensional Analysis of Electrostatic-Thrustor Optics. NASA TN D-2803, 1965.
6. Pawlik, Eugene V. ; Margosian, Paul M. ; and Staggs, John F. : A Technique for Obtaining Plasma-Sheath Configurations and Ion Optics for an Electron- Bombardment Ion Thrustor. NASA TN D-2804, 1965.
7. Lathem, Walter C. : A New Technique for Similating Space-Charge Potential Distributions. J. Spacecraft Rockets, vol. 5, no. 6, June 1968, pp. 737-738.
8. Lathem, Walter C. : Ion Accelerator Designs for Kaufman Thrusters. J. Space- craft Rockets, vol. 6, no. 11, Nov. 1969, pp. 1237-1242.
9. Byers, David C. ; and Staggs, John F. : SERT 11: Thruster System Ground Testing. J: Spacecraft Rockets, vol. 7, no. 1, Jan. 1970, pp. 7-14.
10. Rawlin, Vincent K. ; and Kerslake, William R. : SERT 11 - Durability of the Hollow Cathode and Future Applications of Hollow Cathodes. J. Spacecraft Rockets, ~ 0 1 . 7, no. 1, Jan. 1970, pp. 14-20.
11 . Magnuson, G. D. : Sputtering Mechanisms Under Ion Propulsion Conditions. Rep. AE62-9517, General Dynamics Corp. , May 10, 1962.
12. Cheney, K. B. ; Rogers, E. E. ; and Pitkin, E. T. : Research on Experimental Evaluation of Sputtering Yield Rates. Marquardt Corp. (ARL-63-125), July 1963.
13. Brown, Sanborn c. : Basic Data of Plasma Physics. Technology Press of MIT, 1959, p. 38.
14. Sohl, G. ; Reid, G. C. ; Barcatta, F. A. ; Zafran, S. ; and Speiser, R. c. : Ion Rocket System Research and Development. Rept. 4920-Fina1, Electro-Optical Systems, Inc. (NASA CR-54323), Dec. 30, 1965.
17

TABLE I. - NUMERICAL VALUFS O F CONFIGURATION
3 PARAMETERS (SEE FIG. 4) . ~~ ~. . " . ~
Screen hole diameter, ds, mm Screen thickness, t,, mm Grid separation, y , mm Accelerator hole diameter, da, mm Accelerator thickness, t,, mm Screen webbing thickness, w,, mm Accelerator webbing thickness, wa, mm Screen fraction open area, f, Screen voltage, V,, volt Accelerator voltage, V,, volt Net- to total-voltage ratio, R Maximum beam current per hole, Jh, max, mA
~~ -
2.0 0.5 1.0 1.33 1.0 0.2
0.87 0.75 1600 -400 0.8
0.42 ___
18

TABLE 11. - COMPUTER PROGRAM RESULTS FOR THE VARIOUS CONFIGURATIONS SHOWN IN FIGURE 4.
[Screen voltage, 1600 V in each case.]
Configuration 1 Accelerator Ion beam Thrust, Thrust Maximum beam Accelerator Ratio of maximum Maximum ~
number j votlt;, current PN coefficient diameter inside hole beam diameter current (see fig. 4) per hole, accelerator hole, diameter, to accelerator per hole,
Jh dB da 7 diameter, mA
Jh, max’ ! V
I I mm mm mA
! (see fig. 9) I - ‘ - 4 0 0
0.29 23. 6 0.993 1.07 1.33 0.81 -0.45
2 1 -400 0.41 33.5 (a) 1.77 2.00 0.89 0.52 .29 23. 6 0.989 1.36 2.00 .68 .52 .17 13.8 .998 .77 2.00 .39 .52
2a -1067 0.63 51. 4 (a) 1.78 .45 36.3 (a) 1. 38 .26 21.2 0.996 .77 2.00
0.89 .69 .39
0.80 .80 I .80
3 -400 0.45 32.0 (a) .29 23. 7 0.992 .16 13. 3 .999
1.36 1.12
.63
1.33 1.33 1.33
1.02 .85 .47
0.42 .42 .42
3a
I. -1067 0.69 50.3 (a)
.45 20.4 0.986 1 .25 1 20.4 I .993
l 5 I -400 I 0.29 I 23.6 I 0.989
1 6 I -400 I 0.25 I 20.5 1 0.993
1.36 1. 13
.63
1.33 1.33 1.33
1.02 .85 .47
0.65 .65 .65 1
~
1.46 1.07
1.28 1 1.33 I 0.96 I -0.33 I 1.08 I 1.33 . I 0 .81 I -0.37 1
aAccurate total thrusts not available from computer results (see text). using extrapolated values of ion velocity.
~ ~
Thrust values of column 4 for these cases were hand calculated ~~
CL W

TABLE ID. - MAXIMUM ALLOWABLE NET- TO
TOTAL-VOLTAGE RATIO AS LIMITED
BY ELECTRON BACKSTREAMING
Configuration number
(see fig. 4)
2
voltage ratio,
1 Rmax ! Beam current per hole,
Jh' mA
0 . 2 9 I
~
2000 ' 0.87 1 0 . 4 1
. 8 7 . 2 9
. 8 8 . 1 7
1
2667 0.84 0.63
.85 . 45
. 8 6 . 2 6
3 2000 0.94 0.45
. 9 4 . 2 9
. 9 4 . 1 6
3a 2667 0.93 0.69
. 9 3 . 4 5
.93 . 25
4 2000 0.97 0. 18
. 9 7 . 11 ""
5 2000 0.99 0 .29
6 2000 0.95 ""
0.25
Model
C D-9455 Figure 1. -Typical two-grid system shwing the s ing le -ho le model.
;DISCHARGE CHAMBER PLASMA
Figure 2. - Description of a single hole of a mult ihole two-gr id accelerator system (refer to appendix A for symbol definitions).
Figure 3. - Erosion pattern on downstream face of accelerator grid.
21

I Parameter varied Compare configurations-
, Accelerator thickness, ta ' 1, 3, and 5 Grid spacing, y 3 and 4 Accelerator hole diameter, da 2 and 3 Accelerator web thickness, wa 2, 3, and 6 ' Fraction open area 3 and 6
0 I I I
Y+ 0.23 Wa
1.5 da
I 0 ' A
0"-
I I
I I I O 0
(b) Configuration 2. (c) Configuration 3. (dl Configuration 4.
(e) Configuration 5.
I
( f l Configuration 6.
DISCHARGE CHAMBER PLASMA
"
(A) NARROW SCREEN.
SCREEN ACCELERATOR
NEUTRALIZATION PILANE
lBa"-- (BOUNDED REGION)
- LDISCHARGE
CHAMBER PLASMA
/ASSUMED NEUTRALIZATION PLANE
(E) THICK SCREEN.
Figure 5. - Comparison of screen electrode thicknesses.
Figure 4. - Description of configurations showing variation of geometrical parameters (refer to symbol l is t and table I).

SCREEN ACCELERATOR (POSITIVE (NEGATIVE POTENTIAL) 1 POTENTIAL)?
CONVERGED BOUNDARY-
\-PLASMA - - - - 7 - - - l - BOUNDARY I I I
LDISCHARGE BOUNDING \l' 2'3;4,3 2 Y
CHAMBER ION ICORRESPONDING TRIAL BOUNDARIES PLASMA TRAJECTORYJSECONDARY (ZERO POTENTIAL)
F igure 6. -Method for obtaining shape and location of downstream ZERO LINES
plasma boundary. (Cross section at point A, see fig. 3. I
ACCELERATOR, 12) SCREEN \ h Y
'DISCHARGE CHAMBER PLASMA DOWNSTREAM I NEUTRALIZED PLASMA
Figure 7. -Trajectories of typical charge-exchange ions, showing two distinct erosion regions (marked 1 and 2).
c BOUNDING ION '\,TRAJECTORY 2
SCREEN ACCELERATOR ') " _"
('B,.max,l \ ' \ I i!+" \- ', LPLASMA SHEATH 2 BOUNDING ION TRAJECTORY 1
LPLASMA SHEATH 1 Figure 8. - Method for determin ing maximum current per ho le
' Jh , l<Jh ,2 ) -
23
. 6 I" CONFI$URATION
0 2 u I I I
. 4 .6 .8 1.0 1 .2 RATIO OF BEAM DIAMETER TO ACCELERATOR
HOLE DIAMETER, ds/da
Figure 9. -Current per hole versus rat io of beam diameter to accelerator hole diameter for six configurations (see fig. 4).
. Downstream plasma boundary (zero V)
Ion beam bounding trajectories
CD-10954-28
Figure 10. - Accelerator grid (at -2000 V) showing charge-exchange erosion patterns and downstream plasma boundary profiles.
24

Figure 11. -Typical grid erosion-pit cross sections as determined with a surface analyzer.
Figure 12. -Cross sect ion through point A of acceler- ator grid, showing erosion on Webbing centerline.
25

CD-10953-28 L l o n beam bounding
trajectories
Figure 13. - Intersection of three ion beams. Beam divergence half-angle, 7'.
26 NASA-Langley, 1971 - 28 E -60 32
NATIONAL AERONAUTICS AND SPACE ADMINISTRA? ION
WASHINGTON, D. C. 20546
OFFICIAL BUSINESS P E N A L T Y F O R P R I L ' A T E USE 5300
FIRST CLASS MAIL
POSTAGE AND FEES PAID NATIONAL AERONAUTICS ANE
SPACE ADMINISTRATION
0 8 U 001 5 3 51 3 0 s 71.10 009Q3 A I R FORCE kEAPONS L A B O R A T O R Y /WLCL/ K I R T L A N D A F B I NEW N E X I C O 87117
POSTMASTER: If Undeliverable (Section 158 Postal Manual) Do Not Return
"The aero~lantiral and space activities of the United States shall be condncted so as to contribute . . , to the expamiofz of human knozul- edge of pbeuo~l~ena in the a t~uosphere and space. The Ad~ni&strn t ioa shall protide for the widest practicable and appropriate disse~ninatidn of information comerning its activities and the r.esdts thereof.''
-NATIONAL AERONAUTICS AND SPACE ACT OF 1958%
NASA SCIENTIFIC AND TECHNLCAL PUBLICATIONS
TECHNICAL REPORTS: Scientific and technical information considered important, complete, and a lasting contribution to existing knowledge.
TECHNICAL NOTES: Information less broad' in scope but nevertheless of importance as a .
contribution to existing knowledge.
TECHNICAL MEMORANDUMS: Information receiving limited distribution because of preliminary data, security classifica- tion, or other reasons.
CONTRACTOR REPORTS: Scientific and technical information generated under a NASA contract or grant and considered an important contribution to existing knowledge.
TECHNICAL TRANSLATIONS: Information published in a foreign language considered to merit NASA distribution in English.
SPECIAL %PUBLICATIONS: Informition &rived from or of value to NASA activities. Publications include conference proceedings, monographs, data compilations, handbooks, sourcebooks', and special bibliographies.
,TECHNOLOGY UTILIZATION 'PUBLICATIONS: Information on technology usecl by NASA that may be of particular interest in commercial and other non-aerospace applications. Publications include Tech Briefs, Ttchnology Utilization Reports and Technology Surveys.
Details on the availability of these publications may be obtained from:
SCIENTIFIC AND TECf1NICAL INFORILIATION OFFICE
NATIONAL AERONAUTICS AND SPACE ADMINISTRATION Washington, D.C. PO546


![PEP Web - The Analytic Third: Working with Intersubjective ... … · analytic third'. This third subjectivity, the intersubjective analytic third Green's [1975] 'analytic object'),](https://static.fdocuments.in/doc/165x107/6099619e2d4b51336024f694/pep-web-the-analytic-third-working-with-intersubjective-analytic-third.jpg)