Analyst Presentation - L&T India-Investor Homeinvestors.larsentoubro.com/upload/AnalystPres... ·...
35
1 Analyst Presentation - Q4 / FY17 May 29, 2017
Transcript of Analyst Presentation - L&T India-Investor Homeinvestors.larsentoubro.com/upload/AnalystPres... ·...

1
Analyst
Presentation- Q4 / FY17
May 29, 2017

2
This presentation contains certain forward
looking statements concerning L&T’s future
business prospects and business profitability,
which are subject to a number of risks and
uncertainties and the actual results could
materially differ from those in such forward
looking statements.
The risks and uncertainties relating to these
statements include, but are not limited to,
risks and uncertainties regarding fluctuations
in earnings, our ability to manage growth,
competition (both domestic and
international), economic growth in India and
the target countries for exports, ability to
attract and retain highly skilled professionals,
time and cost over runs on contracts, our
ability to manage our international
operations, government policies and actions
with respect to investments, fiscal deficits,
regulations, etc., interest and other fiscal
costs generally prevailing in the economy.
Past performance may not be indicative of
future performance.
The company does not undertake to make
any announcement in case any of these
forward looking statements become
materially incorrect in future or update any
forward looking statements made from time
to time by or on behalf of the company.
Disclaimer

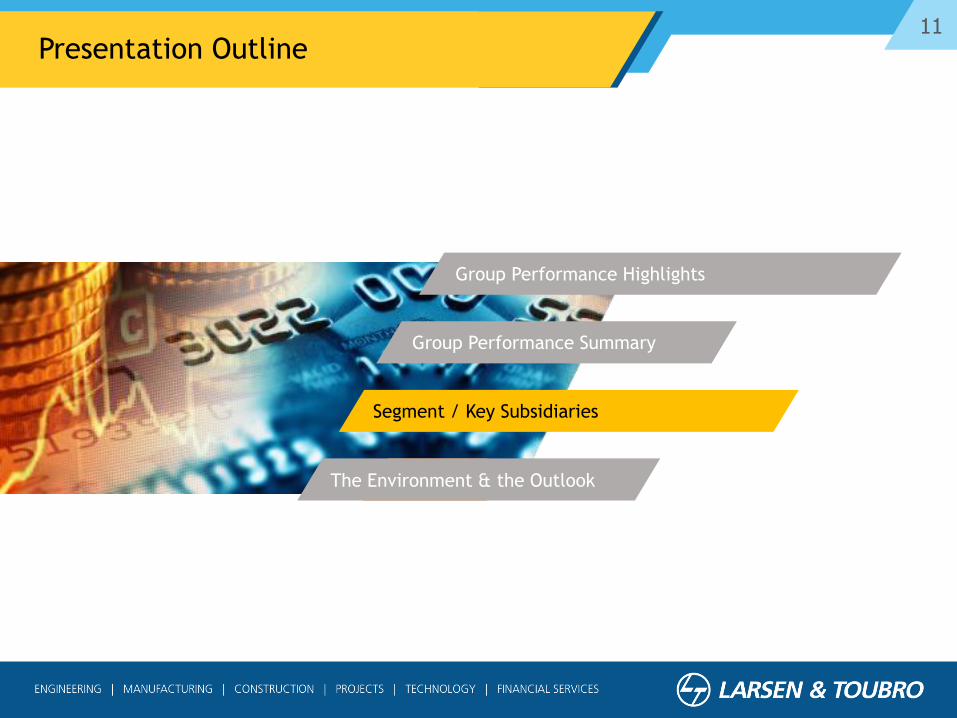
3Presentation Outline
Group Performance Highlights
Group Performance Summary
Segment / Key Subsidiaries
The Environment & the Outlook

4
Order Inflow
Order Book
Revenue
EBITDA Recurring PAT
5%
5%
8%
43%6%
Performance Highlights – FY17

5Key Financial Indicators
Amount in ₹ bn
Q4 FY16 Q4 FY17 Var % Particulars FY16 FY17 Var %
432 473 10% Order Inflow 1360 1430 5%
Order-Book 2490 2613 5%
329 368 12% Revenue from Operations 1020 1100 8%
45 43 -4% EBITDA 105 111 6%
23 30 30% Profit After Tax 42 60 43%
42 73 +₹30 bn Cash flow from operations 77 122 + ₹44 bn
Net Worth 442 502 + ₹60 bn
Borrowings 881 940 + ₹59 bn
Gross Debt / Equity 1.87 1.75 -12 bps
Net Working Capital 23% 19% -430 bps
RONW (%) 9.9% 12.8% +290 bps
Dividend (per share) pre-
bonus*18.25 21.00 +₹2.75
Bonus* 1:2
* Recommended

6Presentation Outline
Group Performance Highlights
Group Performance Summary
Segment / Key Subsidiaries
The Environment & the Outlook

7
• Order inflow growth reflects
muted capex environment
• Domestic order inflow growth
of 10% YoY led by Heavy Civil,
Water and Heavy Engg.
businesses
• Large & diversified order-book
offers hedge against cyclical
volatility
FY17 Order Inflow / Order Book
FY16 FY17
1,787 1,916
703 698
Domestic International
24902613
5%
FY16 FY17
927 1,015
434 415
Domestic
1360 1430
Amount in ` bn
Order BookOrder Inflow
5%

8Key Orders won during FY17
Order Details Client Segment Value
Hasbah Field Development Saudi Aramco Hydrocarbon ~ USD 1000 mn
Transmission expansion Phase – XIII KAHRAMAA, Qatar Infrastructure ~ USD 800 mn
Major Onshore EPC Contract Overseas Client Hydrocarbon ~ USD 600 mn
100 Nos Vajra Artillery Guns MoD Heavy Engg. ~ Rs 45 bn
3x660 MW Ghatampur TPP Neyveli UP Power Power ~ Rs 40 bn
Rewari to Dadri Section DFCC Infrastructure ~ Rs 40 bn
Mumbai BDD Chawl Re-development MHADA Infrastructure ~ Rs 30 bn
Barrage construction at Karimnagar District Govt of Telangana Infrastructure ~ Rs 20 bn
Neelam Redevelopment offshore contract ONGC Hydrocarbon ~ Rs 20 bn
High rise residential Mumbai Developer Infrastructure ~ Rs 10 bn
Bongaigaon Refinery IOCL Hydrocarbon ~ Rs 10 bn
Electrification works - IPDS and DDUGJY Bihar Discoms Infrastructure ~ Rs 10 bn
International
Domestic
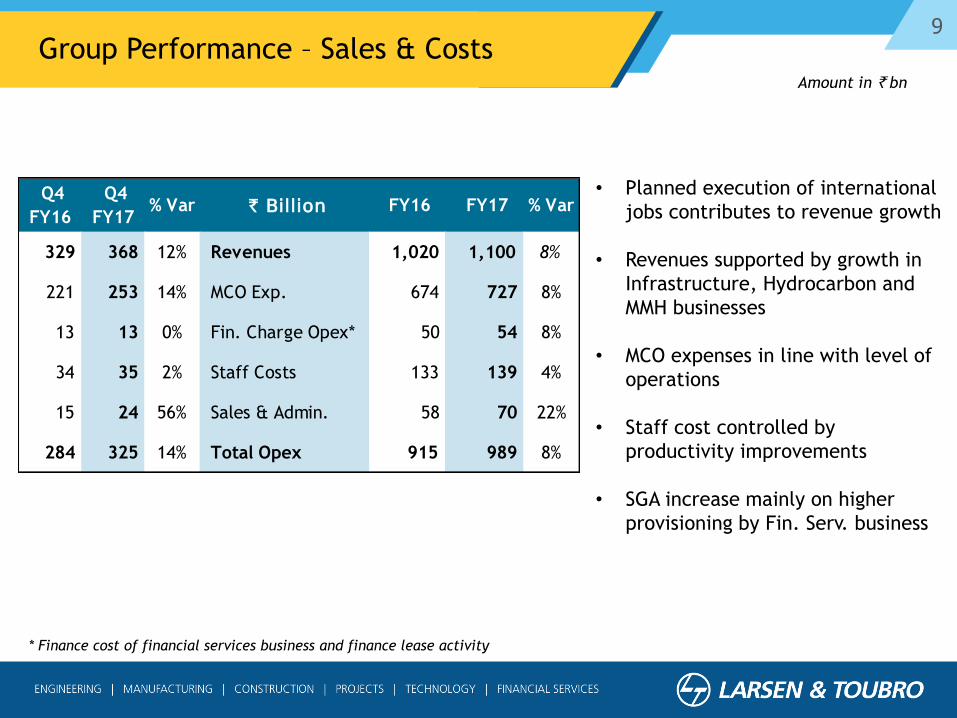
9Group Performance – Sales & Costs
• Planned execution of international
jobs contributes to revenue growth
• Revenues supported by growth in
Infrastructure, Hydrocarbon and
MMH businesses
• MCO expenses in line with level of
operations
• Staff cost controlled by
productivity improvements
• SGA increase mainly on higher
provisioning by Fin. Serv. business
* Finance cost of financial services business and finance lease activity
Q4
FY16
Q4
FY17 % Var ` Billion FY16 FY17 % Var
329 368 12% Revenues 1,020 1,100 8%
221 253 14% MCO Exp. 674 727 8%
13 13 0% Fin. Charge Opex* 50 54 8%
34 35 2% Staff Costs 133 139 4%
15 24 56% Sales & Admin. 58 70 22%
284 325 14% Total Opex 915 989 8%
Amount in ` bn
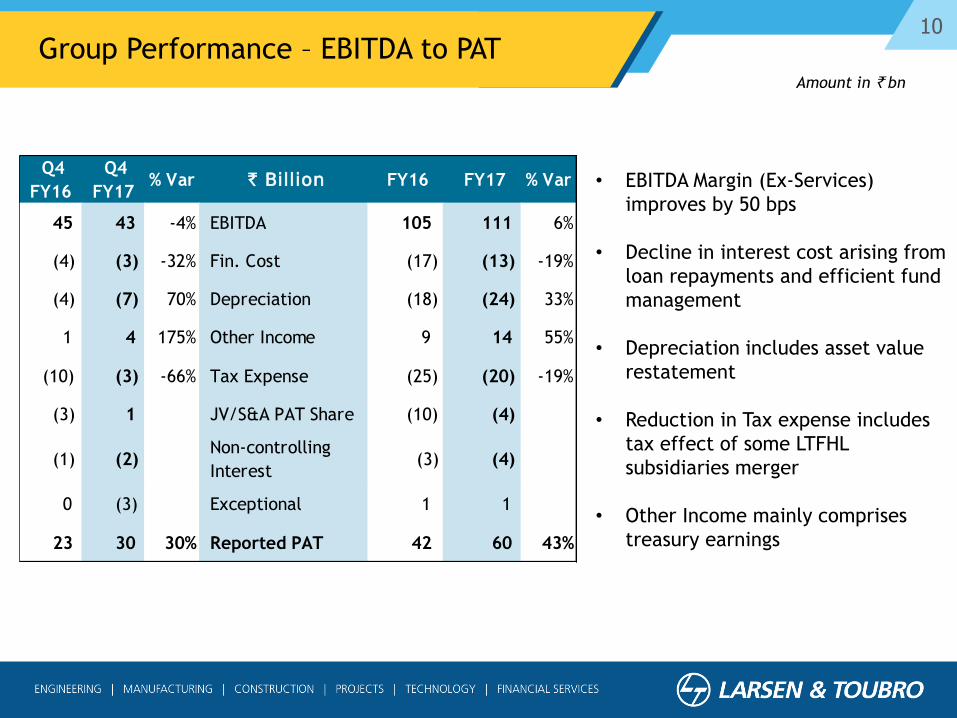
10
• EBITDA Margin (Ex-Services)
improves by 50 bps
• Decline in interest cost arising from
loan repayments and efficient fund
management
• Depreciation includes asset value
restatement
• Reduction in Tax expense includes
tax effect of some LTFHL
subsidiaries merger
• Other Income mainly comprises
treasury earnings
Group Performance – EBITDA to PAT
Q4
FY16
Q4
FY17 % Var ` Billion FY16 FY17 % Var
45 43 -4% EBITDA 105 111 6%
(4) (3) -32% Fin. Cost (17) (13) -19%
(4) (7) 70% Depreciation (18) (24) 33%
1 4 175% Other Income 9 14 55%
(10) (3) -66% Tax Expense (25) (20) -19%
(3) 1 JV/S&A PAT Share (10) (4)
(1) (2)Non-controlling
Interest (3) (4)
0 (3) Exceptional 1 1
23 30 30% Reported PAT 42 60 43%
Amount in ` bn
11Presentation Outline
Group Performance Highlights
Group Performance Summary
Segment / Key Subsidiaries
The Environment & the Outlook
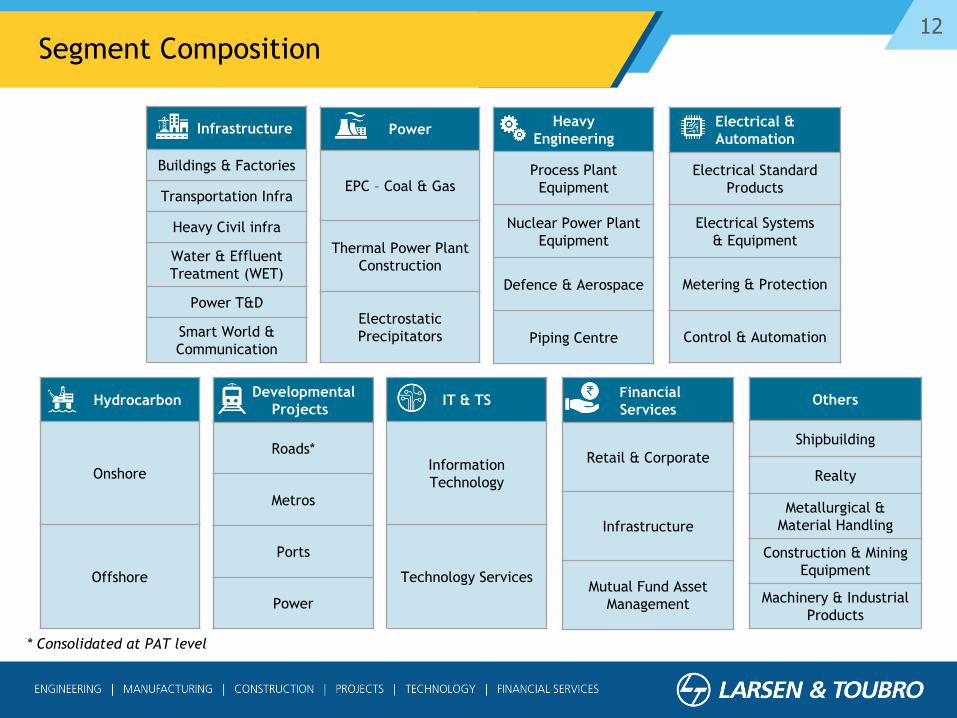
12
* Consolidated at PAT level
Infrastructure
Buildings & Factories
Transportation Infra
Heavy Civil infra
Water & Effluent
Treatment (WET)
Power T&D
Smart World &
Communication
Power
EPC – Coal & Gas
Thermal Power Plant
Construction
Electrostatic
Precipitators
Heavy
Engineering
Process Plant
Equipment
Nuclear Power Plant
Equipment
Defence & Aerospace
Piping Centre
Electrical &
Automation
Electrical Standard
Products
Electrical Systems
& Equipment
Metering & Protection
Control & Automation
Hydrocarbon
Onshore
Offshore
Developmental
Projects
Roads*
Metros
Ports
Power
IT & TS
Information
Technology
Technology Services
Financial
Services
Retail & Corporate
Infrastructure
Mutual Fund Asset
Management
Others
Shipbuilding
Realty
Metallurgical &
Material Handling
Construction & Mining
Equipment
Machinery & Industrial
Products
Segment Composition

13
Infrastructure55%
Power2%
HE5%
E&A4%
Hydrocarbon13%
Services16%
Others5%
Infrastructure74%
Power5%
HE5% E&A
1%
Hydrocarbon 10%
Others5%
Order Book
₹ 2613 Bn
Order Inflow
₹ 1430 Bn
Order Inflow (FY17) / Order Book Break-up
• Order Inflow growth mainly
contributed by Hydrocarbon
and Heavy Engineering
• Growth in Services Business
driven by IT & TS Segment and
Financial Services

14FY17 Revenue Break-up
Infrastructure48%
Power6%
HE3%
E&A4%
Hydrocarbon9%
IT & TS9% Fin. Services
8%Devl. Proj.
4%
Others9%
• Infrastructure growth slowed
down by multiple constraints
(demonetisation, client
liquidity, clearances and
work front availability)
66%
34%
Domestic International

15
Net Revenues & Margin
Amount in ` bn
Infrastructure Segment
• Execution headwinds slow down
revenue growth
• Transportation Infra, Heavy Civil
and Water Businesses deliver
higher growth
• Smart World Business Unit makes
an encouraging start
• Margins impacted due to delayed
execution and extended stay on
some projects
16
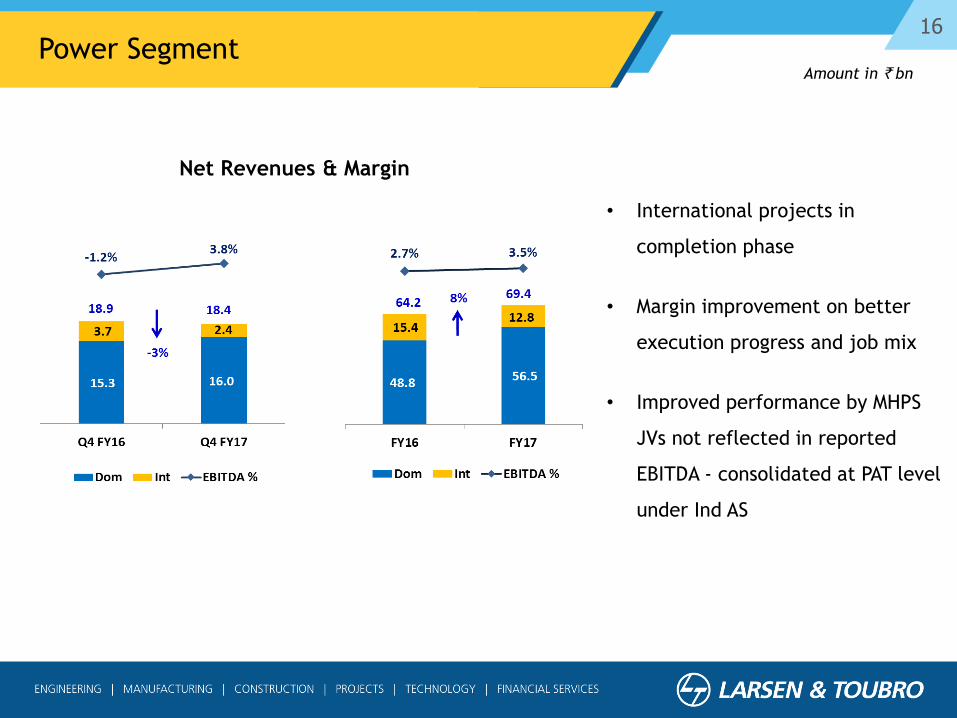
Amount in ` bn
Power Segment
• International projects in
completion phase
• Margin improvement on better
execution progress and job mix
• Improved performance by MHPS
JVs not reflected in reported
EBITDA - consolidated at PAT level
under Ind AS
Net Revenues & Margin

17
Amount in ` bn
Heavy Engineering Segment
• Subdued revenue growth on
delay in awards and slow
progress of jobs
• Defence business holds promise
• PY margins impacted by cost
overruns and delayed
deliveries. FY17 reflects
turnaround in profitability
Net Revenues & Margin

18
Amount in ` bn
Electrical & Automation Segment
• Low-key revenue growth in
FY17 mainly due to lower
industrial demand
• Margin expansion obtained
from favourable sales
composition and operational
efficiencies
Net Revenues & Margin
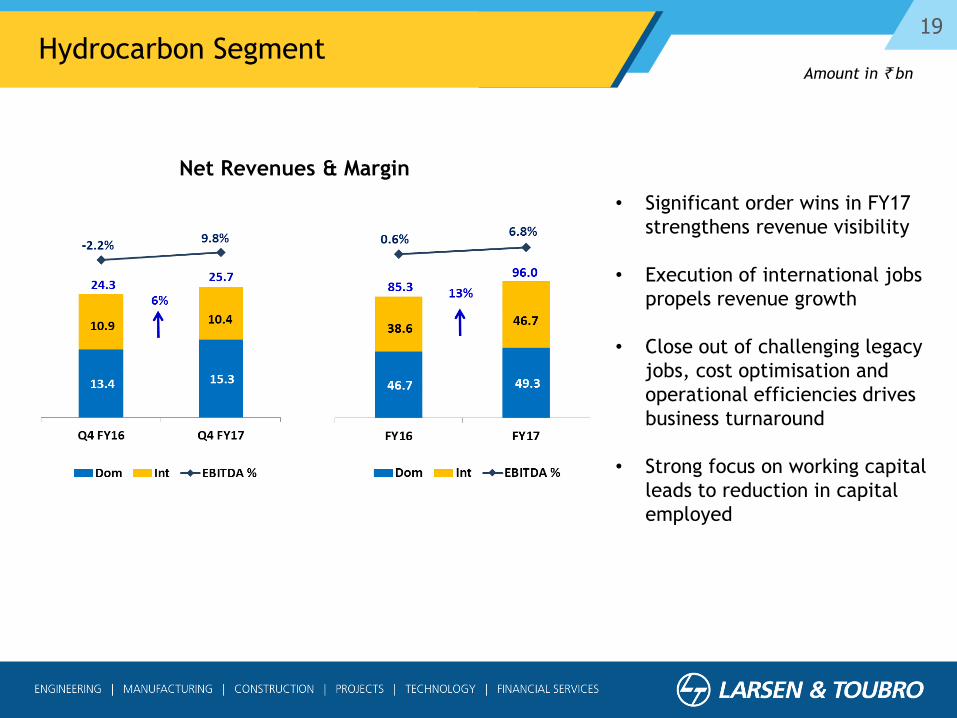
19
Amount in ` bn
Hydrocarbon Segment
• Significant order wins in FY17
strengthens revenue visibility
• Execution of international jobs
propels revenue growth
• Close out of challenging legacy
jobs, cost optimisation and
operational efficiencies drives
business turnaround
• Strong focus on working capital
leads to reduction in capital
employed
Net Revenues & Margin

20
Amount in ` bn
IT & Technology Services Segment
• Revenue growth driven by
Insurance, Auto Aero & Others
for IT business; Transportation
& Industrial Products verticals
for Tech services business
• Stable margins achieved
through manpower utilisation
and delivery optimisation
Net Revenues & Margin

21
Amount in ` bn
Developmental Projects Segment
• Segment includes Power
Development, Hyderabad Metro
and Kattupalli Port (currently
under divestment process)
• IDPL (Roads & TL) consolidated
at PAT level under Equity
method
• Revenues impacted by lower
construction progress in Hyd.
Metro project
• Margin decline due to
provisioning and non-accrual of
disputed receivables (Nabha)
Net Revenues & Margin

22
Amount in ` bn
Others Segment
• Revenue growth sustained thru
strong execution by MMH
• Weak demand slows down
construction equipment &
industrial products business
• Demonetisation adversely affects
Realty business; demand gradually
improving
• Shipbuilding performance
continues to be impacted by delay
in defence ordering
• EBITDA margin reflects
Shipbuilding inventory write-down
Net Revenues & Margin

23
Amount in ` bn
L&T Finance Holdings (I-GAAP)
` Billion FY16 FY17 % Change
Networth
(Incl. Pref.Cap and Warrants) 84.09 91.07 8%
Consolidated Debt 516.16 598.11 16%
Loans and Advances 582.56 666.48 14%
Mutual Fund Average AUM 243.74 338.90 39%
Income from Operations 72.89 83.41 14%
Net NPA (%) - 120 DPD 3.82% 2.89%
PAT 8.57 10.42 22%
• Emphasis on ROE
improvement
• Efforts to reduce Cost to
Income ratio
• Robust growth witnessed in
focussed business and fee
income

24Presentation Outline
Group Performance Highlights
Group Performance Summary
Segment / Key Subsidiaries
The Environment & the Outlook
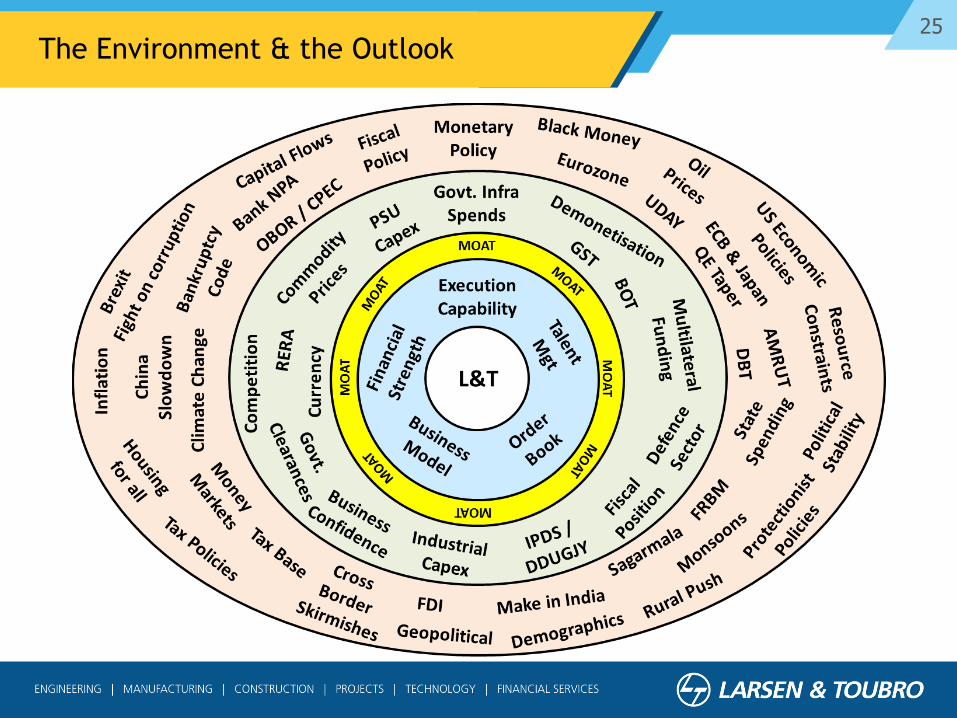
25The Environment & the Outlook

26
Thank You

27
Annexures

28Group Profit & Loss Extracts
* Includes Insurance Business
FY17 FY16 % Var
Income from Operations 97.31 85.45 40.27 877.07 1,100.11 1,019.75 8%
EBITDA 20.19 5.92 0.61 84.03 110.75 104.63 6%
Other Income 0.44 2.73 0.30 10.55 14.01 9.04 55%
Interest Expenses (0.05) (0.01) (0.71) (12.63) (13.40) (16.55) -19%
Depreciation (2.37) (0.79) (0.59) (19.95) (23.70) (17.87) 33%
Provision for Taxes (4.37) (0.11) (0.00) (15.59) (20.07) (24.85) -19%
Share in profit/(loss) of JVs /
Associates- 0.06 (3.45) (0.57) (3.95) (9.90)
Adjustments for non -controlling
interest in Subs., etc.(1.30) (2.76) 0.66 (1.04) (4.44) (3.12)
Net PAT 12.53 5.04 (3.18) 46.02 60.41 42.33 43%
L&T Group ` Billion IT & TS
Fin.
Services *
Devl.
Projects
L&T &
Others (Incl.
Eliminations)

29Balance Sheet
` Billion Mar-17 Mar-16Incr /
(Decr)
Equity & Reserve 502 442 60
Non Controlling Interest 36 29 7
Borrowings - Financial Services 631 546 85
Development Projects 150 142 8
Others 159 193 (34)
Sources of Funds 1,478 1,352 125
Fixed Assets
(Tangible / Intangible / Goodwill)169 189 (20)
Loans towards Financing Activities 625 568 58
Development Projects 160 143 17
Finance lease receivable 95 98 (3)
Other Non-Current Assets
(Incl. S&A / JV Investment)99 77 22
Current Investments 136 75 61
Working Capital 194 203 (9)
Application of Funds 1,478 1,352 125

30Group Cash Flow
* included under Net Cash from operations under statutory financial statements
Q4 FY16 FY16 ` Billion Q4 FY17 FY17
44.6 108.6 Operating Profit 44.2 113.8
7.3 0.8 Changes in Working Capital 37.6 39.8
(9.7) (32.1) Direct Taxes paid (9.2) (32.0)
42.2 77.2 Net Cash from Operations (A) 72.6 121.6
(7.5) (41.2) Investments in Fixed Assets (Net) (4.9) (28.2)
(2.6) (14.0) Net Purchase of Long Term & Curr. Inv. (23.0) (80.8)
(0.3) (2.4) Loans/Deposits made with JV/Associate Cos. (19.1) (22.2)
2.2 5.8 Interest & Dividend Received & Others 5.2 11.5
1.0 1.8 Divestment Proceeds (Incl. Advances) 0.3 20.5
(7.1) (50.0) Net Cash from/(used in) Invest. Act. (B) (41.6) (99.2)
0.6 10.4 Issue of Share Capital / Minority 0.6 21.1
0.9 105.2 Net Borrowings 7.0 50.7
(25.3) (105.8) Disbursements towards financing activities* (26.3) (57.4)
(5.7) (43.0) Interest & Dividend paid (3.7) (36.6)
(29.4) (33.3) Net Cash from Financing Activities (C) (22.4) (22.2)
5.7 (6.1) Net (Dec) / Inc in Cash & Bank (A+B+C) 8.6 0.2

31Share in Profit/(Loss) of JVs/Associates
` Billion FY17 FY16
MHPS JVs 1.12 0.54
IDPL & Subs. (3.45) (8.19)
Others (1.62) (2.25)
Total (3.95) (9.90)

32
OCI represents movement in components of
Equity (Net Worth) in Balance Sheet
Components:
• Re-measurement of defined benefit
(retirement) plans – Volatile and dependent on
G-Sec rate movement due to actuarial
valuation; no flow back to P&L
• MTM of Debt investments – Flow back to P&L
on actual sale
• Changes in FCTR represents MTM on
Consolidation of Balance Sheets of Businesses
with Foreign Functional Currency – Flow back
to P&L only on sale of business
• MTM of Off-Balance Sheet Hedges – Flow back
to P&L on entry of underlyings into Balance
Sheet
Other Comprehensive Income (OCI)
₹ Billion FY17 FY16
Changes arising out of re-
measurement of defined
benefit plans for employees
(0.25) (0.10)
MTM of investment in Debt
instruments (0.06) (0.03)
Changes in Foreign Currency
Translation Reserve (1.31) 0.69
MTM of Off-Balance Sheet
Hedges 3.40 1.03
Total 1.78 1.59

33Reconciliation of Net PAT (FY2015-16)
Adjustments
Net Profit After Tax as per previous IGAAP 50.91
Provision for Expected Credit Loss 0.14
Gain/loss on divestment of stake in subsidiary (2.64)
Provision for Employee Benefits based on constructive
obligations (0.37)
Impact of fair valuation of investments (1.47)
Increase in borrowing cost pursuant to application of
Effective Interest Rate method (0.88)
Reclassification of net actuarial (gain)/loss on Employee
Defined Benefit Obligations to OCI 0.14
Increase in borrowing cost due to initial fair valuation of
long term financial liabilities (3.05)
Others 0.11
Deferred and current taxes (0.08)
Additional Tax on dividend distributed by subsidiaries (0.46) (8.58)
Net Profit After Tax as per IND AS 42.33
` Billion
34
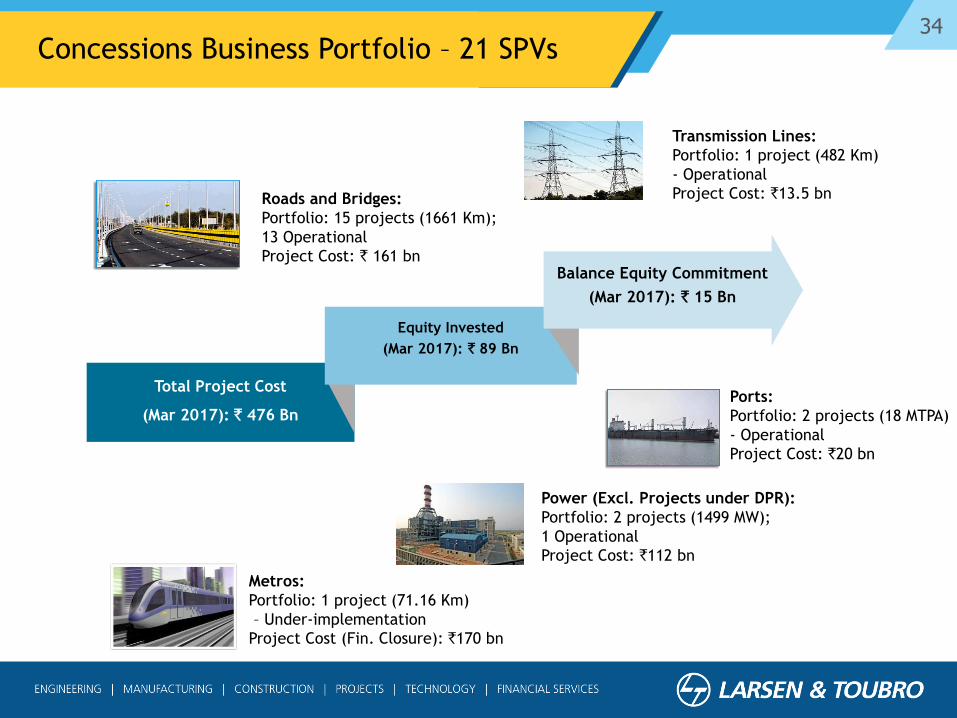
Roads and Bridges:
Portfolio: 15 projects (1661 Km);
13 Operational
Project Cost: ` 161 bn
Power (Excl. Projects under DPR):
Portfolio: 2 projects (1499 MW);
1 Operational
Project Cost: `112 bn
Ports:
Portfolio: 2 projects (18 MTPA)
- Operational
Project Cost: `20 bn
Metros:
Portfolio: 1 project (71.16 Km)
– Under-implementation
Project Cost (Fin. Closure): `170 bn
Transmission Lines:
Portfolio: 1 project (482 Km)
- Operational
Project Cost: `13.5 bn
Total Project Cost
(Mar 2017): ` 476 Bn
Equity Invested
(Mar 2017): ` 89 Bn
Balance Equity Commitment
(Mar 2017): ` 15 Bn
Concessions Business Portfolio – 21 SPVs

35Major Opportunities
Roads & Highways- NH & SH
- Special Bridges
- Tunnels
- Expressways
- Elevated Corridors
Railways- Metros
- DFCC (next phase)
- Station development
Water- Lift Irrigation schemes
- Water Treatment (Incl. Desal)
- Effluent & Waste water
Treatment (Incl. Namami
Gange)
- Inland Waterways
Smart World & Comm.- Surveillance systems
- Optical fiber layout
- Traffic mgmt system
- Smart Grid
- Wifi enabled
Power T&D- Various countries in ME
- High voltage lines
- Green Energy corridors
- Solar EPC
Building & Factories- Airports
- Hospitals & Medical Colleges
- Affordable housing
Defence & Aerospace
(Incl. Shipbuilding)- Landing Platform Docks
- Corvettes
- Gun programs
- Submarines
Hydrocarbon- Saudi Aramco capex (ME)
- Kuwait Oil Co. capex (ME)
- Refinery fuel upgrade (IN)
- Planned mega refinery (IN)
- East Africa (Algeria, etc)
- Fertilizer plants
- Oil & Gas Pipelines
Nuclear Power- Indigenous tech plants
- Russian based plants
- Steam generators