Analyst Presentation 4th Quarter 2014-15 - HDILhdil.in/.../Q4-Analyst-Presentation-F.Y.14-15.pdf ·...
30
Analyst Presentation 4 th Quarter 2014-15
Transcript of Analyst Presentation 4th Quarter 2014-15 - HDILhdil.in/.../Q4-Analyst-Presentation-F.Y.14-15.pdf ·...

Analyst Presentation 4th Quarter 2014-15

11111
• HDIL, promoted by Rakesh Kumar Wadhawan and Sarang Wadhawan
• Promoter Shareholding 36.16%
• FII & FPI Shareholding 49.02%
• Land Reserves of 243.99 Million Sq. Ft.
• Largest land bank owner in Mumbai Metropolitan Region
Company History
• HDIL Group has completed construction of 100 Mn. Sq. Ft. since inception in 1977
• More than 1.5 Lakhs homes delivered
• 23 Ongoing Projects
• 30.55 Million sq. ft. area under construction
• Possession handed in last 24 months of approx. 2500 residential units.
• Next 12-18 months we will hand over 4,500 residential units
Residential Portfolio
• Planet HDIL sale potential of 74 million sq. ft.
• Spread across 550 Acres
• India’s first smart city and affordable housing project
Future Plans - Iconic Project
Company Overview
as on March 31, 2015.

Project Mix
2
Residential
Commercial
Retail
•Ongoing Projects – 4,350,000•Planned Projects - 6,960,000
•Ongoing Projects – 264,456•Planned Projects - 16,727,821
•Ongoing Projects – 6,209,035 •Planned Projects - 47,175,000
•Ongoing Projects– 30,557,810•Planned Projects- 131,749,589
SRA
Ongoing Projects Segment wise Breakup & Saleable Area as on March 31, 2015.
Area in Million sq. ft

Residential Portfolio
3
BKC
Churchgate
Virar
Churc
hgate
to V
irar
(52 k
ms)
Bandra
to V
irar
(30 k
ms)
Suburb
an R
ail R
oute
Premier Exotica
Majestic Towers
Whispering Tower
Berkeley Square
Daulat Nagar
Residency Park
Planet HDIL
Meadows
Harmony
Ekta Nagar
Project Saleable Area (in Sq.ft.)
Metropolis 700,000
Residency Park - Phase II 600,000
Galaxy 175,000
Planet HDIL Phase I 15,882,810
Paradise City 5,000,000
Ekta Nagar 1,500,000
Majestic 1,300,000
Meadows - Phase I 1,000,000
Whispering Towers-Phase I 1,200,000
Whispering Towers-Phase II 800,000
Premier Exotica Phase II 800,000
Berkeley Square 900,000
Premier Exotica Phase I 700,000
30,557,810
Paradise City
Metropolis
Galaxy
as on March 31, 2015.

4
Project Update

Residency Park
5
March 31, 2015.December 31, 2014.
Possession commencing in Q1 FY 2015-16, Project fully sold

Metropolis
6
Possession commencing FY 2015-16, Project fully sold

Premier Exotica Phase I
7
March 31, 2015.December 31, 2014.

Premier Exotica Phase II
8
March 31, 2015.December 31, 2014.

Majestic Tower
9

Whispering Tower Phase I
10

Whispering Tower Phase II
11

Possession in next 12 months
Sr. No. Project Area (in sq. ft.) Sales Value (in Cr.)
1 Metropolis 7,00,000 560
2 Residency Park 6,00,000 210
3 Premier Exotica 7,00,000 630
4 Paradise City 50,00,000 1000
5 Galaxy 1,75,000 90
Total 71,75,000 2490
12
Sales to be recognized on project completion basis

TDR
Handing over 10,000 residential units
to Slum Rehabilitation Authority
7 Million Sq. Ft. TDR will be
generated in phase wise manner
2.5 Million Sq. Ft. TDR will be
generated in 1st phase for Sale
13Handed over 1700 Units to MCGM on April , 2015.

14
Iconic Project

Affordable Housing Project
‘Planet HDIL’ 550 Acre Township

Planet HDIL Location
Planet HDIL is proposed in Vasai-Virarbelt (Part of Thane district) Preferred residential destination, well connected with rail and road network
Mere 5Km away from Mumbai periphery
Thane is part of Mumbai Metropolitan Region and the fastest growing district in India.
Vasai-Virar is sanctioned as Satellite city by Govt. of India.
Project is well connected through road and railways
Project is adjoining to Proposed railway station “HDIL City” connected to Mumbai with 4 dedicated tracks.
1KM away from NH-8, connecting to Mumbai
BKC
Churchgate
Virar
Churc
hgate
to V
irar
(52 k
ms)
Bandra
to V
irar
(30
km
s)
Planet HDIL Suburb
an R
ail R
oute
India’s Largest Smart Affordable City
Bandra

Attached to proposed railway station “HDIL City”
1KM from NH-8, Connecting to Mumbai to Ahmedabad
Land Area: 550 Acres Non-Agricultural Land
Suburban Station 2KM Away
Planet HDIL- Regional Setting
HDIL Industrial Park, Home to 150 Industries
Proposed Freight Corridor connecting JNPT under DMIC.
Railway Track

Commitment towards
Environment Protection,
Education and Health
Care Facility
Plot Area-
2,48,76,761 Sq. Ft
Construction Area consisting Residential,
Commercial, Infrastructure-
5,49,71,909 Sq. Ft.
Saleable Area-
7,41,71,577 Sq. Ft.
Proposed Project Cost-
Rs. 11,000 Cr
Future Revenue Generated-
Rs 35,000-40,000 Cr
Residential Population Estimated-
3,36,050
Employment Generation Estimated-
35,000
Development will take place in 8-10 phases
Time Line-
10-12 Years
Open Green Space 15% of plot area
Economic Indicators of Project
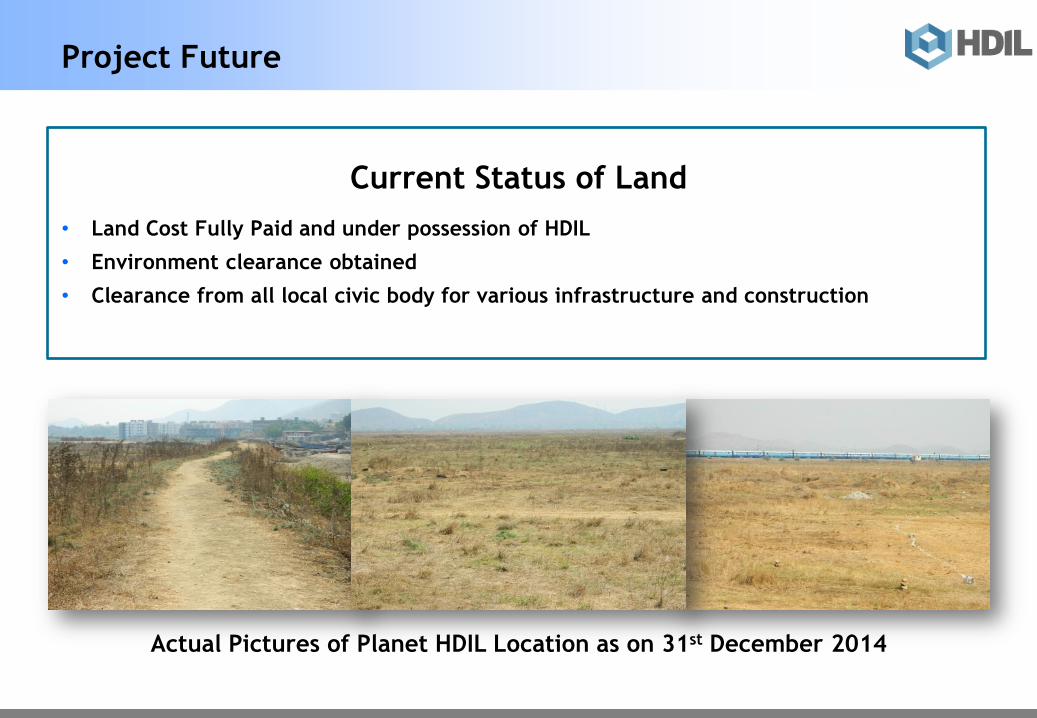
Project Future
Current Status of Land
• Land Cost Fully Paid and under possession of HDIL
• Environment clearance obtained
• Clearance from all local civic body for various infrastructure and construction
Actual Pictures of Planet HDIL Location as on 31st December 2014

Financials
20

Key Development: 4th Quarter 2014-15
• HDIL FY15 net profit at Rs. 218.65 crore, up 23.14%
• For the year FY15, consolidated turnover remains at Rs.
1083.12 crore representing an increase of 13.58%
• During the quarter, the company booked the turnover from
retail property Harmony located in Mumbai suburb Goregoan
• For the quarter ended March 2015, new residential sales
crossed Rs 400 crore, representing 100% growth on YoY basis
• Customer collection during the quarter stands at approx. Rs.
425 crore
• Consolidated EBITDA for the quarter ended on 31st March 2015
stands at 35.86% as against 27.25% in Q4FY14
• Consolidated Net debt for the year ended March 2015 remains
at Rs. 2942 crore, a decline of 10.41% as compare to Rs. 3284
in the previous year
• During the current quarter, the company has handed over
approx. 1700 apartments of SRA project located in Kurla to
the Government of Maharashtra
• Around 2 million sq. ft TDR generation is expected which will
boost operating cash flow in next 12-15 months
• TDR generated approx 0.2 million during current quarter21

Consolidated Debt Analysis
22
70% of debt has a floating cost, with decrease in interest rates the overall repayment also decrease
Gross Debt 3231.30
Lease Rental Discounting 75.00
Cash & cash equivalents 214.14
Net Debt 2942.16
All Figure in INR Crore.
•HDIL has reduced its debt by INR 793.71 Cr
from its peak level, an overall decline of
19.71% in last Six Quarters
•Net debt as on March 31, 2015 is INR
2942.16 Cr
•Lease rental discounting is on account of
rental income of approx 10 Cr every year.
•Cash and cash equivalents includes cash on
hand of Rs 189.14 Cr and balance in liquid
instruments

Consolidated Financial Ratios Y-o-Y
23
PAT
EPS Finance Cost
EBIDTA
All Figure in INR Crore.

Financial Ratio
24
Note:
* Company follows project completion method of accounting and hence quarter turnover cannot be compared
** Includes other income of 44 Cr, from sale of HDIL Leisures Private Limited Business in March 2014 Quarter
*** PAT for March 2014 include Rs. 35.63 Cr. On account of revision of income tax provision
Particulars
Consolidated Stand alone Consolidated
Quarter Ended Year Ended Year Ended
31-Mar-15 31-Dec-14 Growth % 31-Mar-15 31-Mar-14 Growth % 31-Mar-15 31-Mar-14 Growth % 31-Mar-15 31-Mar-14 Growth %
Turnover (Net) 156.45 350.83 -55.41% 156.45 208.92* -25.11% 1,005.25 770.79 30.42% 1,022.48 872.27 17.22%
Other Income 6.23 8.65 -27.98% 6.23 50.34** -87.62% 85.68 169.65 -49.50% 60.65 81.38 -25.47%
Total Income 162.68 359.48 -54.75% 162.68 259.26 -37.25% 1,090.93 940.44 16.00% 1,083.13 953.65 13.58%
PBT&E 45.94 86.71 -47.02% 45.94 79.38 -42.13% 307.53 255.52 20.35% 297.80 189.06 57.52%
PBT % to income 28.24% 24.12% 28.24% 30.62% 28.19% 27.17% 27.49% 19.82%
EBIDTA 58.34 98.31 -40.66% 58.34 129.07 -54.80% 372.76 365.63 1.95% 369.37 380.27 -2.87%
EBIDTA % to
income35.86% 27.35% 35.86% 49.78% 34.17% 38.88% 34.10% 39.88%
PAT 31.88 67.30 -52.63% 31.88 113.52*** -71.92% 226.33 244.85 -7.56% 218.65 177.57 23.14%
PAT % to income 19.60% 18.72% 19.60% 43.79% 20.75% 26.04% 20.19% 18.62%
Net worth 10,804.68 10,775.17 0.27% 10,804.68 10,775.17 0.27% 10,655.05 10,425.21 2.20% 10,804.68 10,559.05 2.33%
Debt 3,231.30 3,339.36 -3.24% 3,231.30 3,508.52 -7.90% 2,206.46 2,441.80 -9.64% 3,231.30 3,508.42 -7.90%
Debt Equity ratio 0.30 0.31 0.31 0.33 0.21 0.23 0.30 0.33
EPS -Basic 0.71 1.76 0.71 2.71 5.49 5.81 5.20 4.21
- Diluted 0.71 1.76 0.71 2.71 5.49 5.81 5.20 4.21
Inventories 13,078.97 12,903.10 1.36% 13,078.97 12,467.85 4.90% 10,905.36 10,596.54 2.91% 13,078.97 12,467.85 4.90%
All Figure in INR Crore.

Consolidated Balance Sheet
25
Particulars31st March, 2015 31st December, 2014 31st March, 2014
(Audited) (Unaudited) (Audited)
I. EQUITY AND LIABILITIES
(1) Shareholders' Funds
Share Capital 4,190,039,860 4,190,039,860 4,190,039,860
Reserves and Surplus 103,856,772,143 108,046,812,003 103,561,746,982 107,751,786,842 101,400,471,700 105,590,511,560
Share application money pending allotment - - -
(2) Minority Interest 73,672,691 73,553,176 73,821,394
(3) Non-Current Liabilities
Long-term borrowings 10,616,671,060 10,787,726,768 11,271,184,637
Deferred tax liabilities (Net) 189,358,704 185,741,639 189,309,365
Long term provisions 16,722,995 10,822,752,759 13,848,486 10,987,316,893 13,674,831 11,474,168,833
(4) Current Liabilities
Short-term borrowings 16,457,319,243 16,342,694,217 16,432,932,858
Trade payables 4,464,317,035 4,400,872,382 4,408,538,410
Other current liabilities 34,169,315,588 32,516,403,528 29,449,416,582
Short-term provisions 2,148,837,620 57,239,789,486 2,019,702,198 55,279,672,325 1,440,042,655 51,730,930,505
Total 176,183,026,939 174,092,329,236 168,869,432,292
II.ASSETS
(1) Non-current assets
Fixed assets
(i) Tangible assets 1,199,384,767 1,202,643,798 2,207,427,918
(ii) Intangible assets 926,732 1,076,436 9,915,961
(iii) Capital work-in-progress - 1,200,311,499 6,506,392 1,210,226,626 69,099,550 2,286,443,429
Goodwill on consolidation - 17,870,729 71,482,914
Non-current investments 1,596,503,096 1,047,188,813 500,725,787
Long term loans and advances 728,277,925 728,305,415 857,336,295
(2) Current assets
Current investments 79,485,202 79,485,202 147,148,414
Inventories 130,789,665,668 129,031,042,007 124,678,503,229
Trade receivables 3,041,733,047 3,534,044,202 3,813,955,394
Cash and bank balances 1,891,446,976 1,968,747,066 2,267,065,655
Short-term loans and advances 36,855,603,526 172,657,934,419 36,475,419,176 171,088,737,653 34,246,771,175 165,153,443,867
Total 176,183,026,939 174,092,329,236 168,869,432,292

P&L Consolidated
26
Particulars
Quarter ended
31st March, 2015
Quarter ended
31st December, 2014
Quarter ended
31st March, 2014
Year ended
31st March, 2015
Year ended
31st March, 2014
(Audited) (Unaudited) (Audited) (Audited) (Audited)
Revenue:
Revenue from operations 1,564,475,903 3,508,300,778 2,089,263,677 10,224,754,579 8,722,654,507
Other Income 62,327,977 86,476,297 503,462,577 606,466,288 813,786,514
Total Revenue 1,626,803,880 3,594,777,075 2,592,726,254 10,831,220,867 9,536,441,021
Expenses :
Cost of material consumed 1,957,973,012 2,184,961,161 1,597,436,320 7,748,110,835 6,141,119,666
Changes in inventories of finished goods, work in
progress and stock in trade (2,348,810,268) (1,103,632,972) (1,983,823,572) (6,705,520,873) (7,616,428,237)
Employee benefits expense 100,124,503 114,299,811 97,817,517 411,940,797 401,388,130
Finance costs 1,212,611,256 1,308,899,983 1,693,647,352 5,534,449,193 7,072,930,265
Depreciation and amortisation expense 46,888,905 30,852,516 199,193,422 153,194,532 785,746,516
Other expenses 198,637,213 192,252,625 194,622,345 711,063,390 861,052,817
Total Expenses 1,167,424,621 2,727,633,124 1,798,893,384 7,853,237,874 7,645,809,157
Profit before tax 459,379,259 867,143,951 793,832,870 2,977,982,992 1,890,631,864
Tax expense:
Current tax 136,830,917 197,052,144 (356,341,410) 791,696,257 90,571,887
Deferred tax 3,617,064 (2,774,380) 13,295,438 (71,158) 23,168,429
140,447,981 194,277,764 (343,045,972) 791,625,099 113,740,316
Profit after tax 318,931,278 672,866,187 1,136,878,842 2,186,357,893 1,776,891,548
Less : Minority Interest 119,518 (179,731) 1,712,845 (155,359) 1,240,883
Add : Share of profit of Associates - - 37,584 - -
Profit for the year 318,811,760 673,045,918 1,135,203,581 2,186,513,252 1,775,650,665
Earnings per equity share of ` 10/-
(1) Basic 0.71 1.76 2.71 5.20 4.21
(2) Diluted 0.71 1.76 2.71 5.20 4.21

Cash flow Consolidated
27
ParticularQuarter ended
31st March, 2015
(Audited)
Cash flow from operating activities
Net profit before tax 459,379,259
Adjustments for :
Depreciation and amortisation expense 46,888,905
Interest expenses 1,212,611,256
Interest received (37,665,510)
Dividend received -
Loss/(profit) on sale of investments -
Loss by fire -
Loss on sale of fixed assets - 1,221,834,651
Operating profit before working capital changes 1,681,213,910
Movements in working capital :
Decrease / (Increase) in inventory (1,758,623,661)
Decrease / (Increase) in trade receivable 492,311,155
Decrease / (Increase) in other receivables (380,156,860)
(Decrease) / Increase in trade and other payables2,743,901,867
Net movement in working capital 1,097,432,501
Cash generated from operations 2,778,646,411
Less : Direct taxes paid (net of refunds) 8,166,140
Net cash from operating activities 2,770,480,271
Cash flows from investing activities
(Increase) / Decrease in capital work in progress6,506,392
(Increase) / Decrease in investments (net) (596,692,998)
Interest received 37,665,510
Dividend received -
Purchase of fixed assets (383,577)
Consideration received on diposal of subsidiary-
Sale of fixed assets -
Net cash from investing activities (552,904,673)
Cash flows from financing activities
Proceeds from borrowings 436,070,907
Repayment of borrowings (1,516,701,589)
Expenses on increase in authorised share capital(1,633,750)
Interest paid (1,212,611,256)
Net cash used in financing activities (2,294,875,688)
Net increase in cash and cash equivalents (A + B + C) (77,300,090)
Cash and cash equivalents at the beginning of the year 1,968,747,066
Less : Delink of subsidiary -
Cash and cash equivalents at the end of the year 1,891,446,976
Components of cash and cash equivalents as at
Quarter ended
31st March, 2015
Cash on hand 47,521,420
With banks - on current account 229,336,761
- on escrow account 2,770,670
- on deposit account * 1,611,818,125
1,891,446,976

Disclaimer
28282828
This investor presentation has been prepared by Housing Development and Infrastructure Ltd (“HDIL”). and does notconstitute a prospectus or placement memorandum or an offer to acquire any securities. This presentation or any otherdocumentation or information (or any part thereof) delivered or supplied should not be deemed to constitute an offer.
No representation or warranty, express or implied is made as to, and no reliance should be placed on, the fairness,accuracy, completeness or correctness of such information or opinions contained herein. The information contained in thispresentation is only current as of its date. Certain statements made in this presentation may not be based on historicalinformation or facts and may be “forward looking statements”, including those relating to the general business plans andstrategy of HDIL, its future financial condition and growth prospects, future developments in its industry and itscompetitive and regulatory environment, and statements which contain words or phrases such as ‘will’, ‘expected to’,‘horizons of growth’, ‘strong growth prospects’, etc., or similar expressions or variations of such expressions. Theseforward-looking statements involve a number of risks, uncertainties and other factors that could cause actual results,opportunities and growth potential to differ materially from those suggested by the forward-looking statements. Theserisks and uncertainties include, but are not limited to risks with respect to its real estate business, SEZ business and itsinfrastructure business.
HDIL may alter, modify or otherwise change in any manner the content of this presentation, without obligation to notifyany person of such revision or changes. This presentation cannot be copied and disseminated in any manner.
No person is authorized to give any information or to make any representation not contained in and not consistent withthis presentation and, if given or made, such information or representation must not be relied upon as having beenauthorized by or on behalf of HDIL. This presentation is strictly confidential.

29
For further information please log on to http://www.hdil.in/ or contact:
Mr. Shriram TotalaTel: +91 (22) 67888000Email: [email protected]/[email protected]
Thank You