Analyst Day Financial
74
Financial Analyst Day Chuck MacGlashing Vice President, Investor Relations
Transcript of Analyst Day Financial

Financial Analyst Day Chuck MacGlashingVice President, Investor Relations
Safe Harbor StatementThis presentation includes certain “forward-looking statements" within the meaning of the Private Securities Litigation Reform Act of 1995, including statements regarding management’s expectations for future financial and operational performance and operating expenditures, expected growth, and business outlook, including our long-term financial framework; our focus on profitable growth; cash flow and margin improvement expectations; our product plans, strategies, and trends; our ability to expand our total addressable market; our position to execute on our growth strategy and related growth drivers; our opportunities in international markets; and our ability to expand our leadership position and market opportunity for our CRM platform. These forward-looking statements include, but are not limited to, plans, objectives, expectations and intentions and other statements contained in this press release that are not historical facts and statements identified by words such as "expects," "anticipates," "intends," "plans," "believes," "seeks," "estimates" or words of similar meaning. These forward-looking statements reflect our current views about our plans, intentions, expectations, strategies and prospects, which are based on the information currently available to us and on assumptions we have made. Although we believe that our plans, intentions, expectations, strategies and prospects as reflected in or suggested by those forward-looking statements are reasonable, we can give no assurance that the plans, intentions, expectations or strategies will be attained or achieved. Furthermore, actual results may differ materially from those described in the forward-looking statements and will be affected by a variety of risks and factors that are beyond our control including, without limitation, risks associated with the announced leadership changes, impact of COVID-19 on our business, the broader economy, and our ability to forecast our future financial performance as a result of COVID-19; our history of losses, our ability to retain existing customers and add new customers, the continued growth of the market for an inbound platform; our ability to differentiate our platform from competing products and technologies; our ability to manage our growth effectively to maintain our high level of service; our ability to maintain and expand relationships with our solutions partners; our ability to successfully recruit and retain highly-qualified personnel; the price volatility of our common stock, and other risks set forth under the caption "Risk Factors" in our Quarterly Report on Form 10-Q filed on August 4, 2021 and our other SEC filings. We assume no obligation to update any forward-looking statements contained in this document as a result of new information, future events or otherwise.
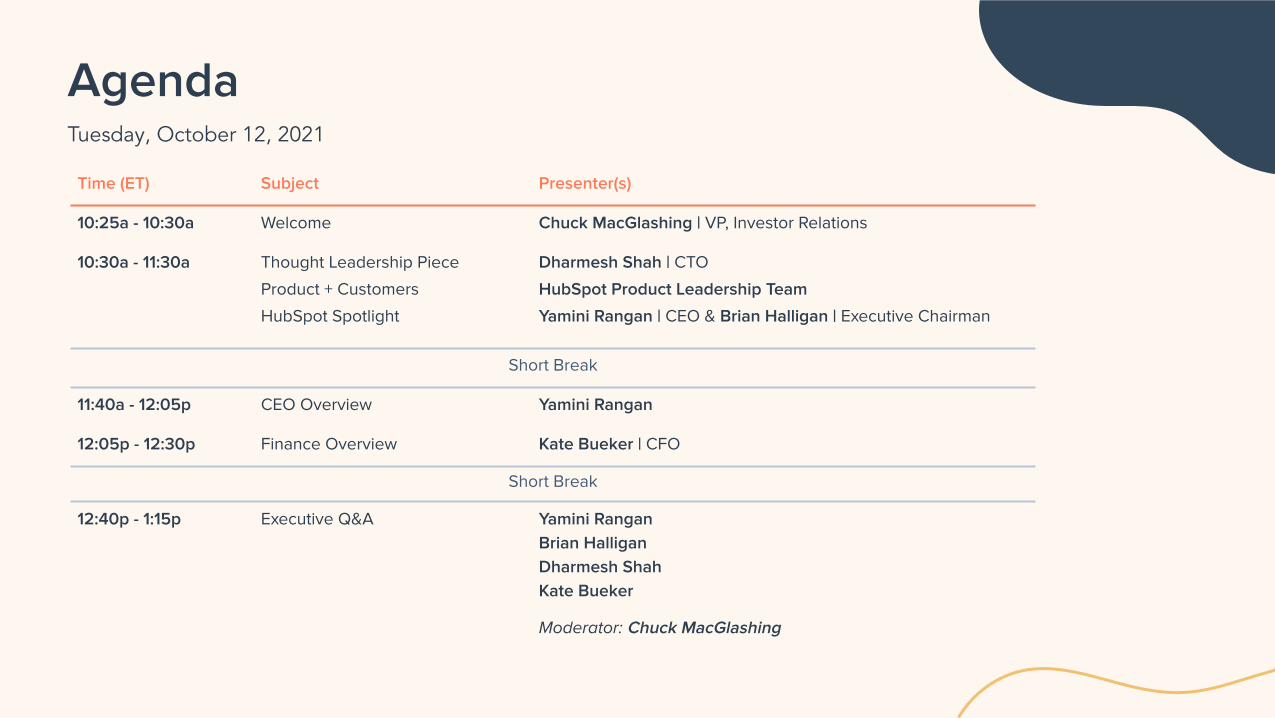
AgendaTuesday, October 12, 2021
Time (ET) Subject Presenter(s)
10:25a - 10:30a Welcome Chuck MacGlashing | VP, Investor Relations
10:30a - 11:30a Thought Leadership Piece
Product + Customers
HubSpot Spotlight
Dharmesh Shah | CTO
HubSpot Product Leadership Team
Yamini Rangan | CEO & Brian Halligan | Executive Chairman
Short Break
11:40a - 12:05p CEO Overview Yamini Rangan
12:05p - 12:30p Finance Overview Kate Bueker | CFO
Short Break
12:40p - 1:15p Executive Q&A Yamini Rangan Brian Halligan Dharmesh Shah Kate Bueker
Moderator: Chuck MacGlashing
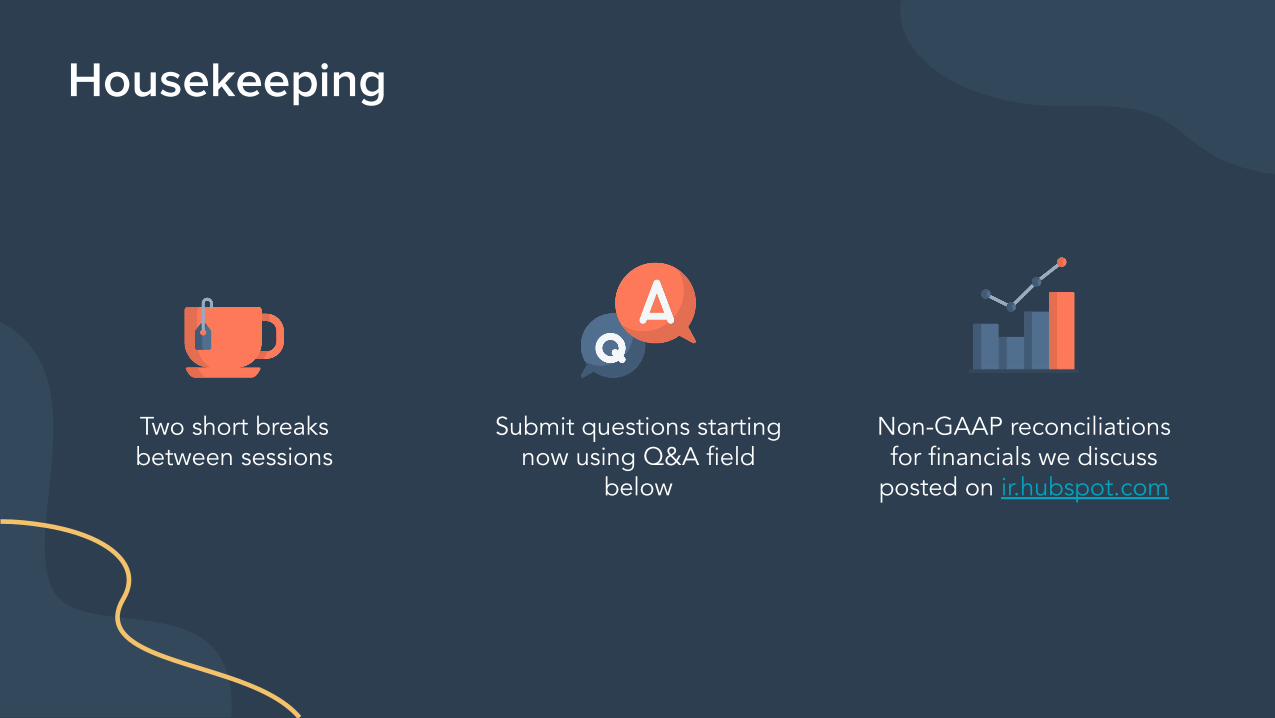
Housekeeping
Two short breaks between sessions
Submit questions starting now using Q&A field
below
Non-GAAP reconciliations for financials we discuss
posted on ir.hubspot.com

Thank you
Helping Companies Win in the Age of the Connected Customer
Yamini RanganCEO
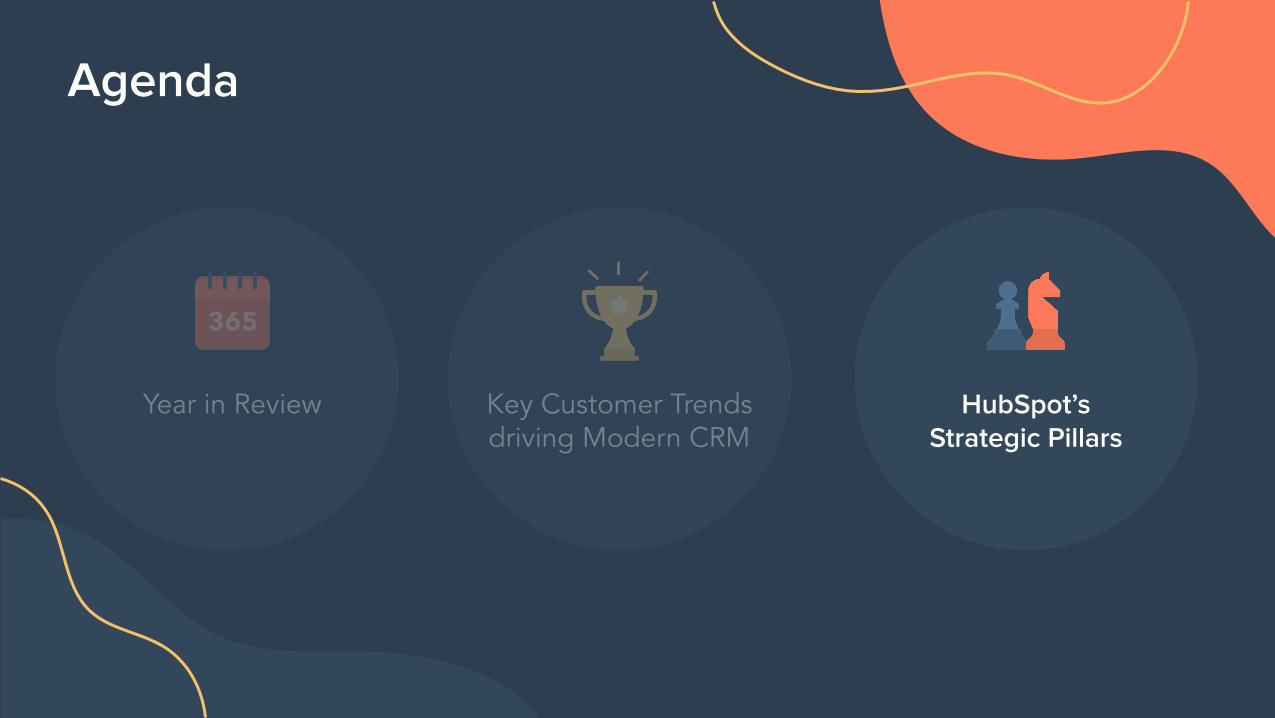
Agenda
Year in Review Key Customer Trends Driving Modern CRM
HubSpot’s Strategic Pillars
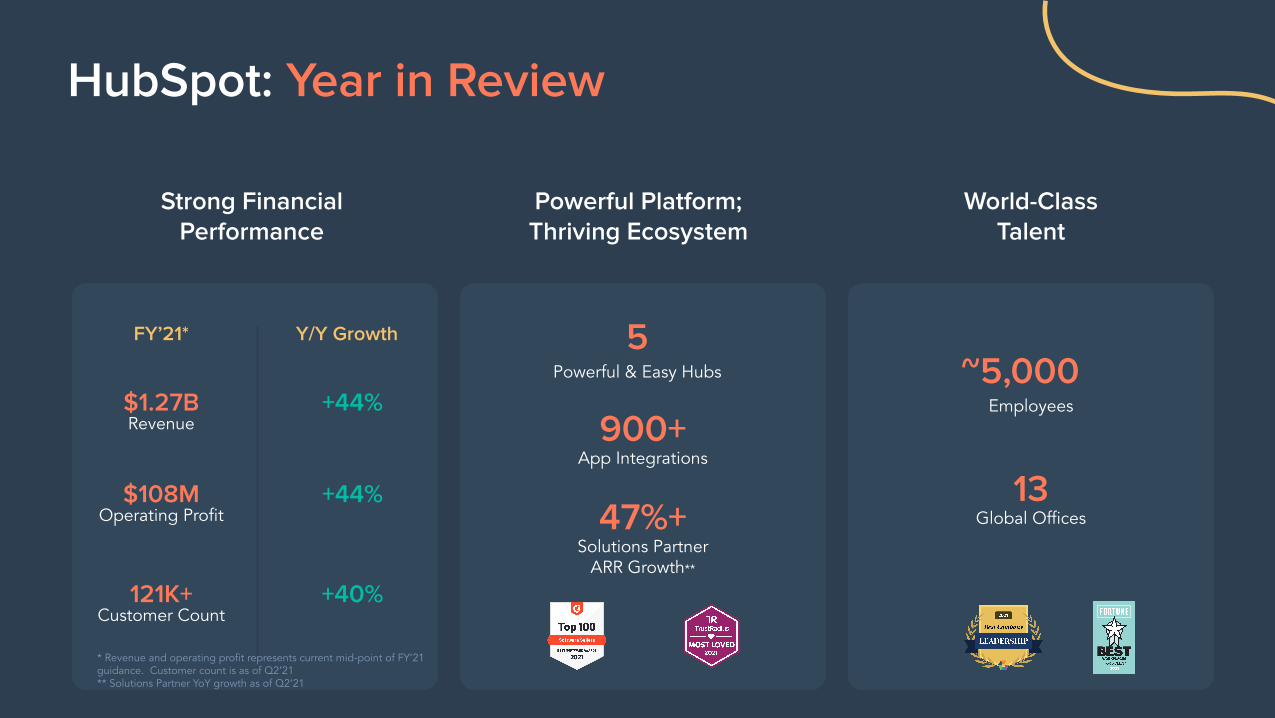
HubSpot: Year in Review
Powerful Platform; Thriving Ecosystem
900+App Integrations
47%+Solutions Partner
ARR Growth**
5Powerful & Easy Hubs
Strong Financial Performance
FY’21*
$1.27BRevenue
$108MOperating Profit
121K+Customer Count
Y/Y Growth
+44%
+44%
+40%
* Revenue and operating profit represents current mid-point of FY’21 guidance. Customer count is as of Q2’21** Solutions Partner YoY growth as of Q2’21
World-Class Talent
~5,000Employees
13Global Offices
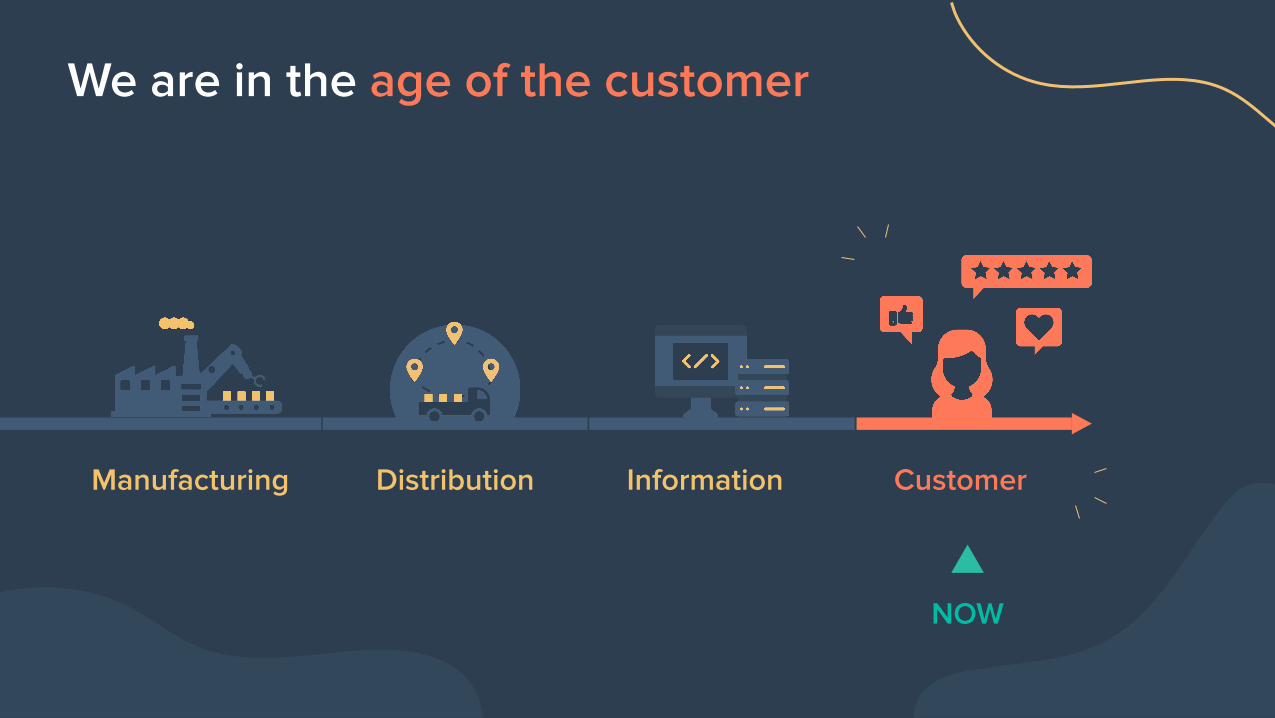
We are in the age of the customer
Manufacturing Distribution Information Customer
NOW

Winning in the age of the connected customer
Be able to pivot and adapt
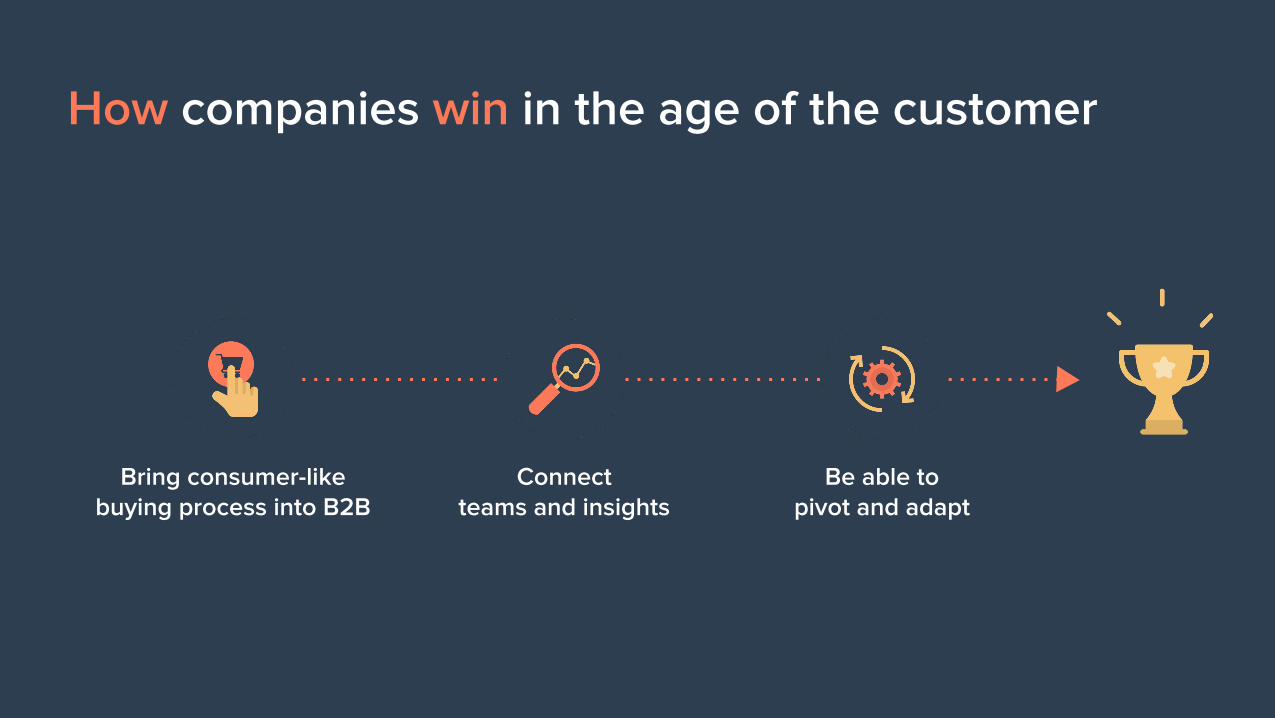
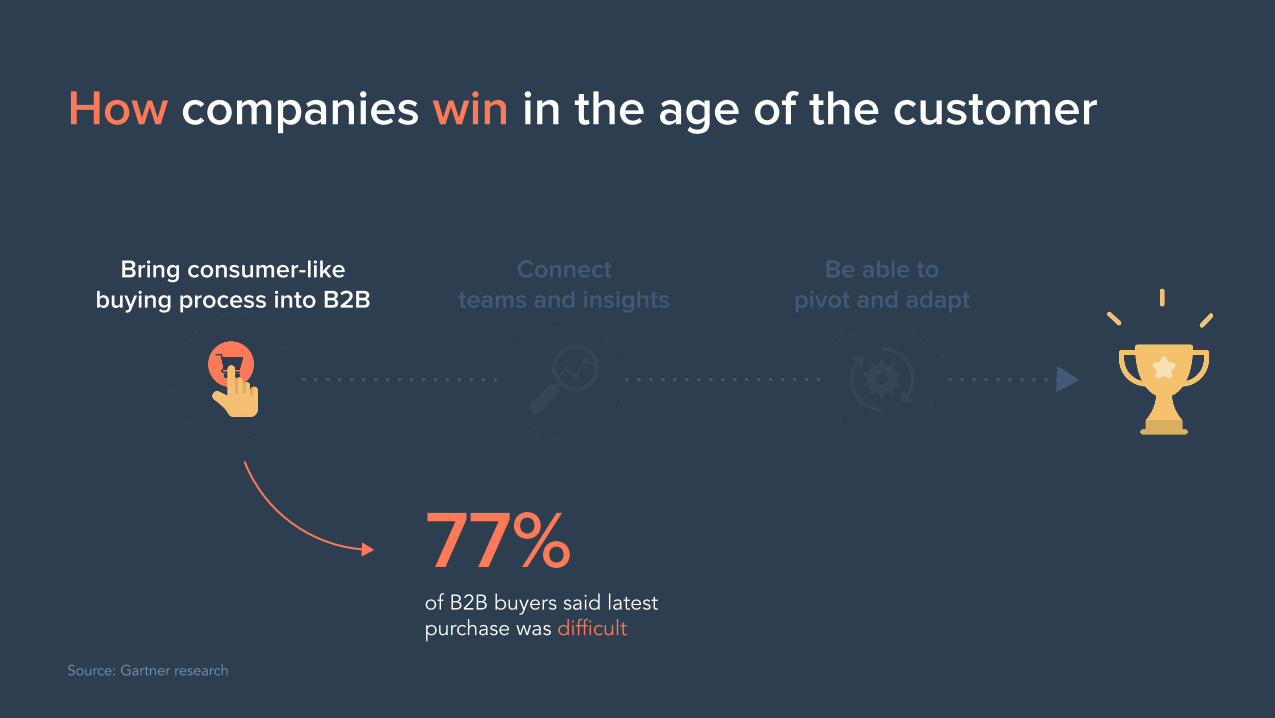
How companies win in the age of the customer
Bring consumer-likebuying process into B2B
Connect teams and insights
Be able to pivot and adapt
How companies win in the age of the customer
Bring consumer-likebuying process into B2B
Connect teams and insights
Be able to pivot and adapt
77%of B2B buyers said latest purchase was difficult
Source: Gartner research

50 SaaS appsAverage size of our target customer’s technology stack
How companies win in the age of the customer
Bring consumer-likebuying process into B2B
Connect teams and insights
Be able to pivot and adapt
50 SaaS appsAverage size of our target customers’ technology stack
Source: Blissfully research
Use techto be agile
& adaptable
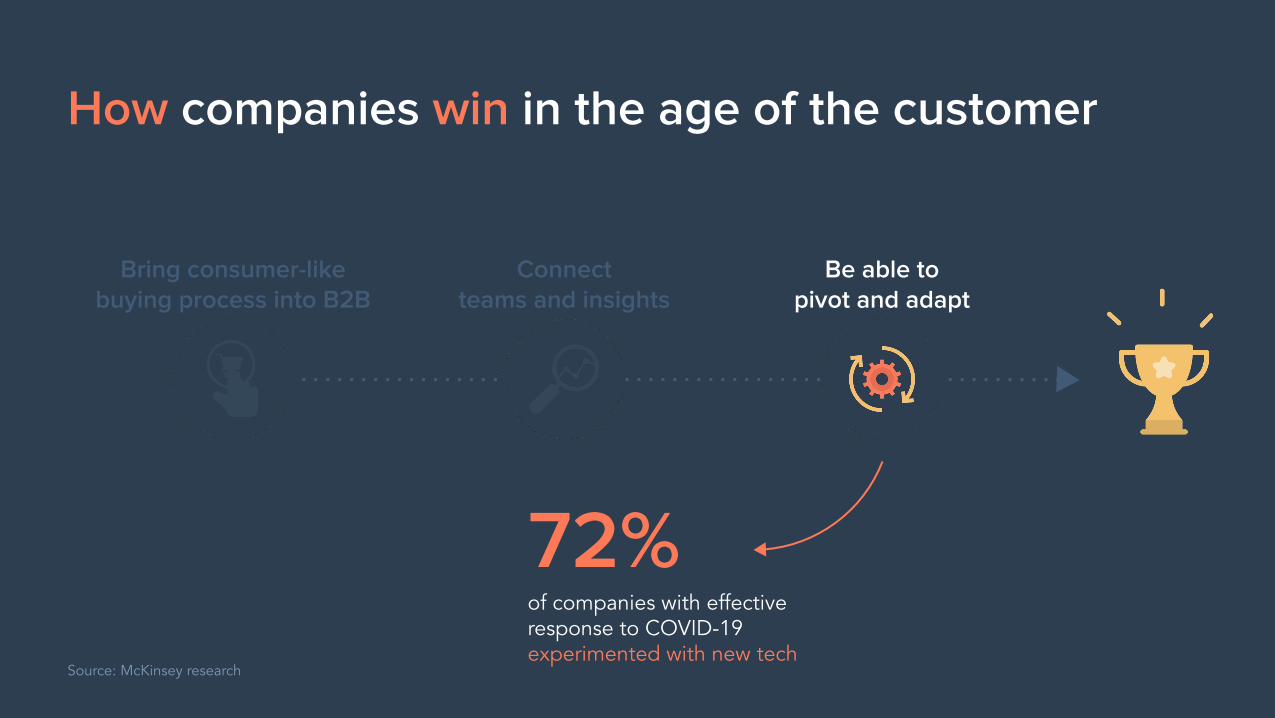
How companies win in the age of the customer
Bring consumer-likebuying process into B2B
Connect teams and insights
Be able to pivot and adapt
72%of companies with effectiveresponse to COVID-19experimented with new tech
Source: McKinsey research

From building fitness centersto enabling fitness anywhere.
Now more than ever, companies need a modern CRM platform to win
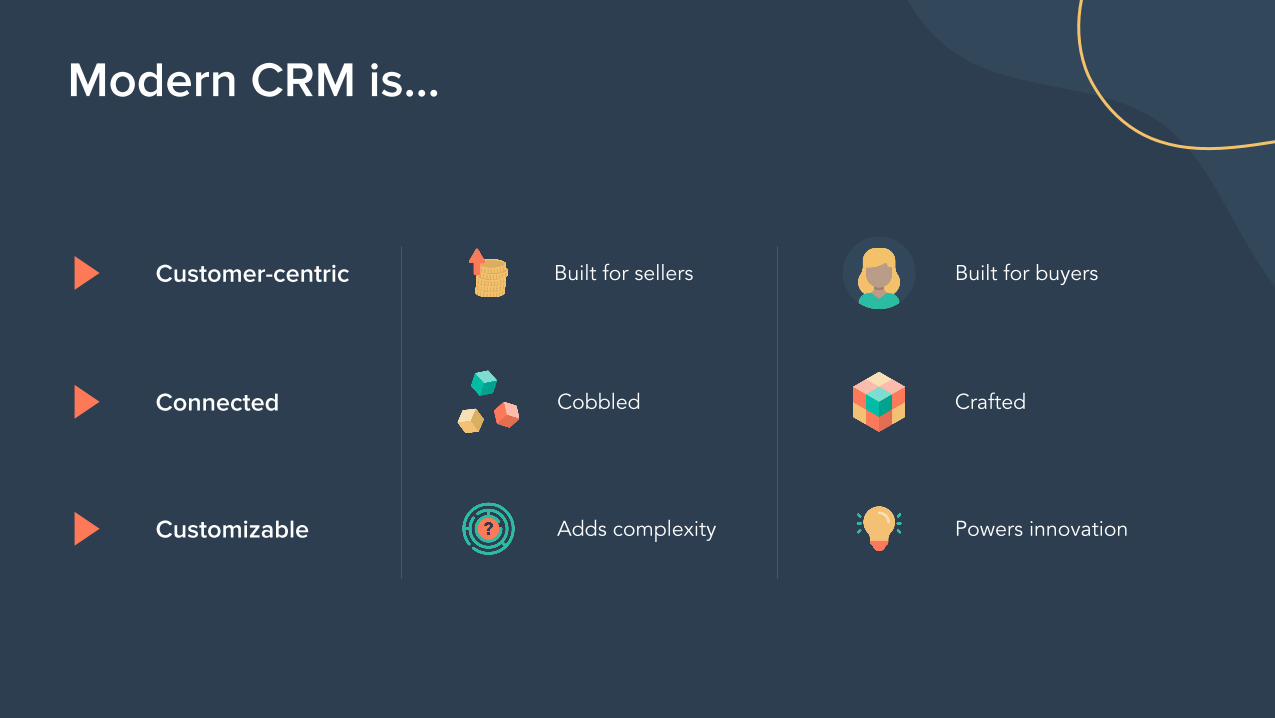
Modern CRM is...
Built for sellers Built for buyersCustomer-centric
Cobbled CraftedConnected
Adds complexity Powers innovationCustomizable
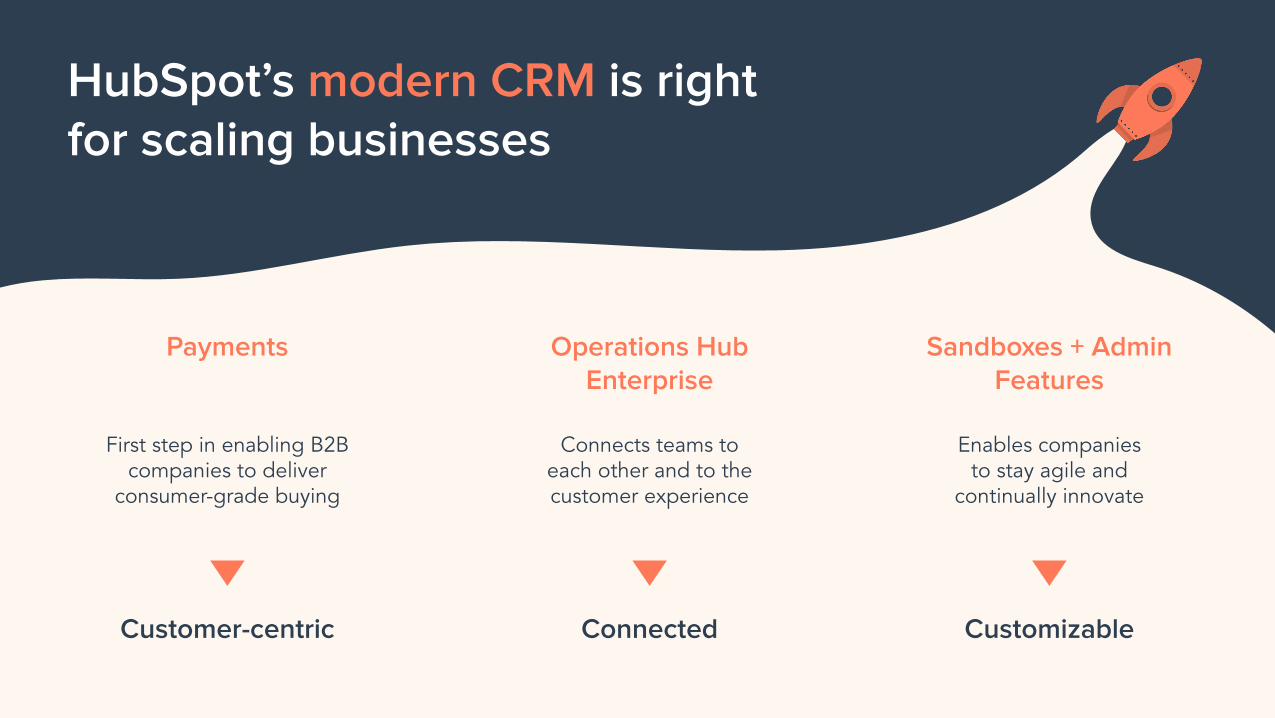
Payments
Customer-centric
First step in enabling B2B companies to deliver
consumer-grade buying
Operations Hub Enterprise
Connected
Connects teams to each other and to the customer experience
Sandboxes + Admin Features
Customizable
Enables companies to stay agile and
continually innovate
HubSpot’s modern CRM is right for scaling businesses
Agenda
Year in Review Key Customer Trends driving Modern CRM
HubSpot’s Strategic Pillars
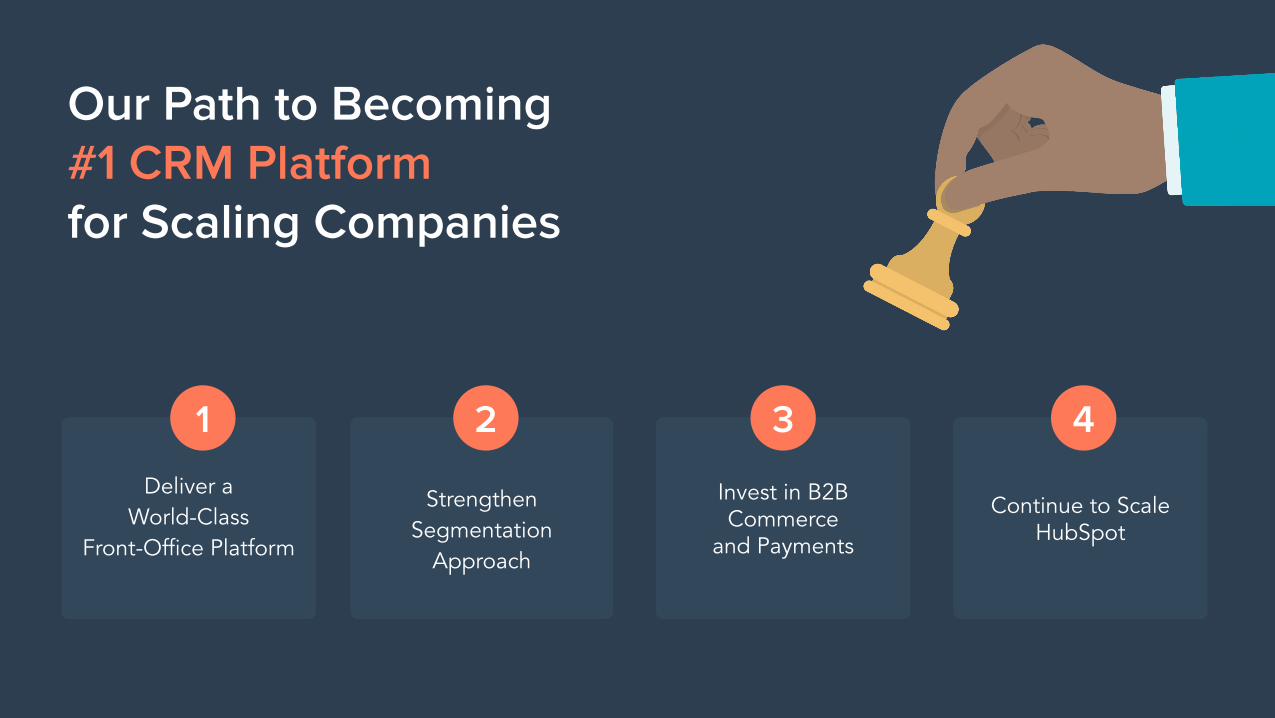
Our Path to Becoming #1 CRM Platform for Scaling Companies
Deliver a World-Class
Front-Office Platform
1
Strengthen Segmentation
Approach
Invest in B2B Commerce
and Payments
Continue to ScaleHubSpot
2 3 4
Strategic Pillar
Deliver a World-ClassFront-Office Platform
1
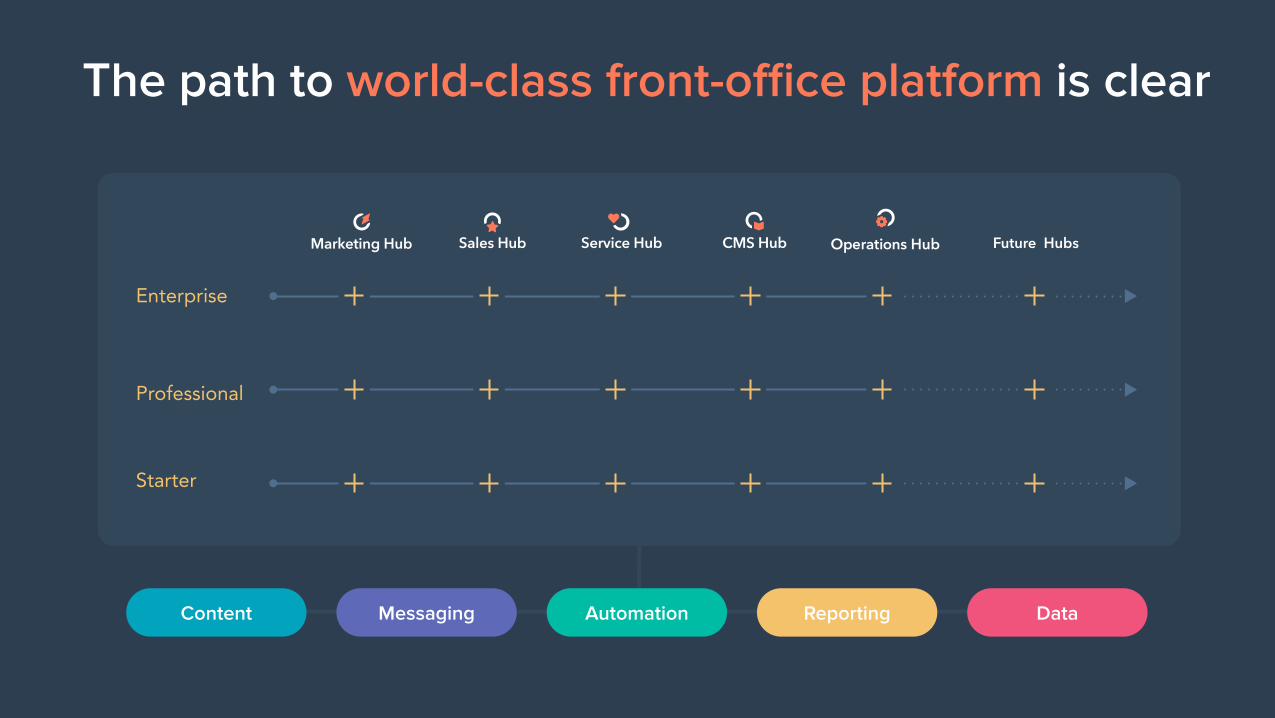
The path to world-class front-office platform is clear
Enterprise
Professional
Starter
Content Messaging Automation Reporting Data

Invest in Platform
1. For Users
2. For Ops
3. For Developers
Invest in Hubs
1. Continue Investing in Anchor Hubs
2. Accelerate Emerging Hubs
3. Launch New Hubs
Our strategy is simple

StrengthenSegmentation Approach
Strategic Pillar 2
Enterprise
Pro
Starter
Free
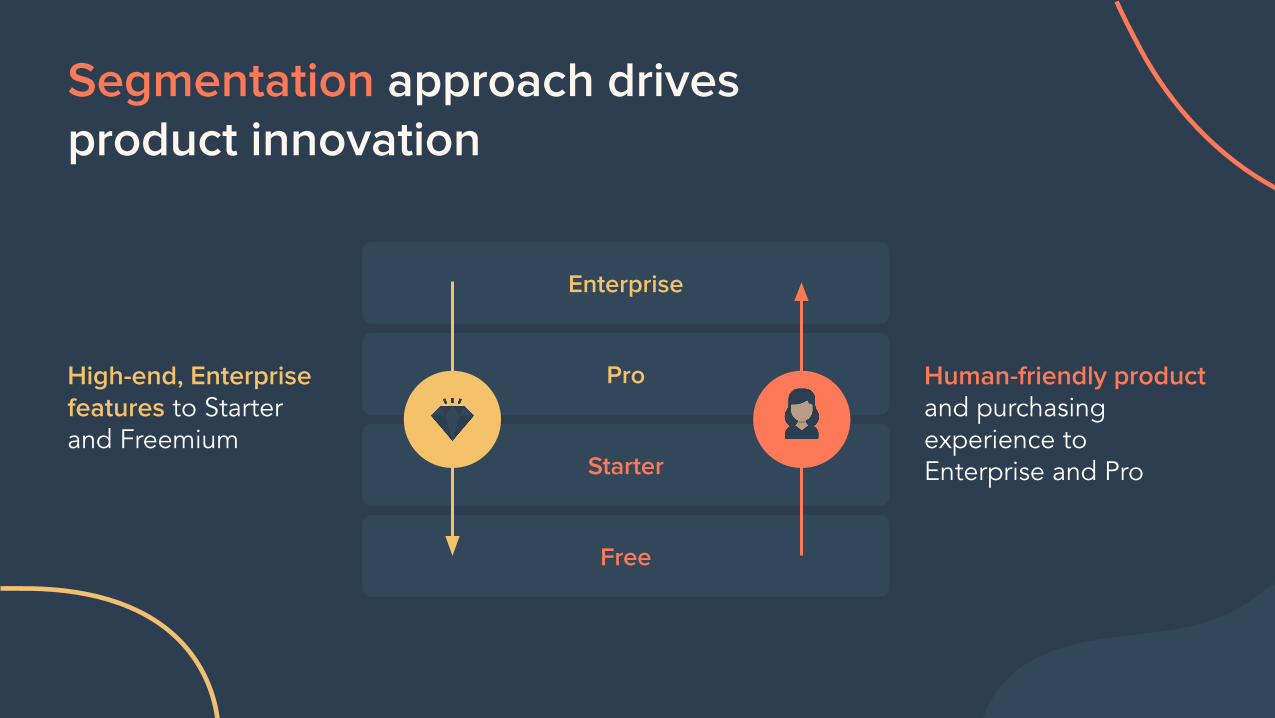
Segmentation approach drives product innovation
High-end, Enterprise features to Starter and Freemium
Human-friendly product and purchasing experience to Enterprise and Pro
Enterprise
Starter
Free
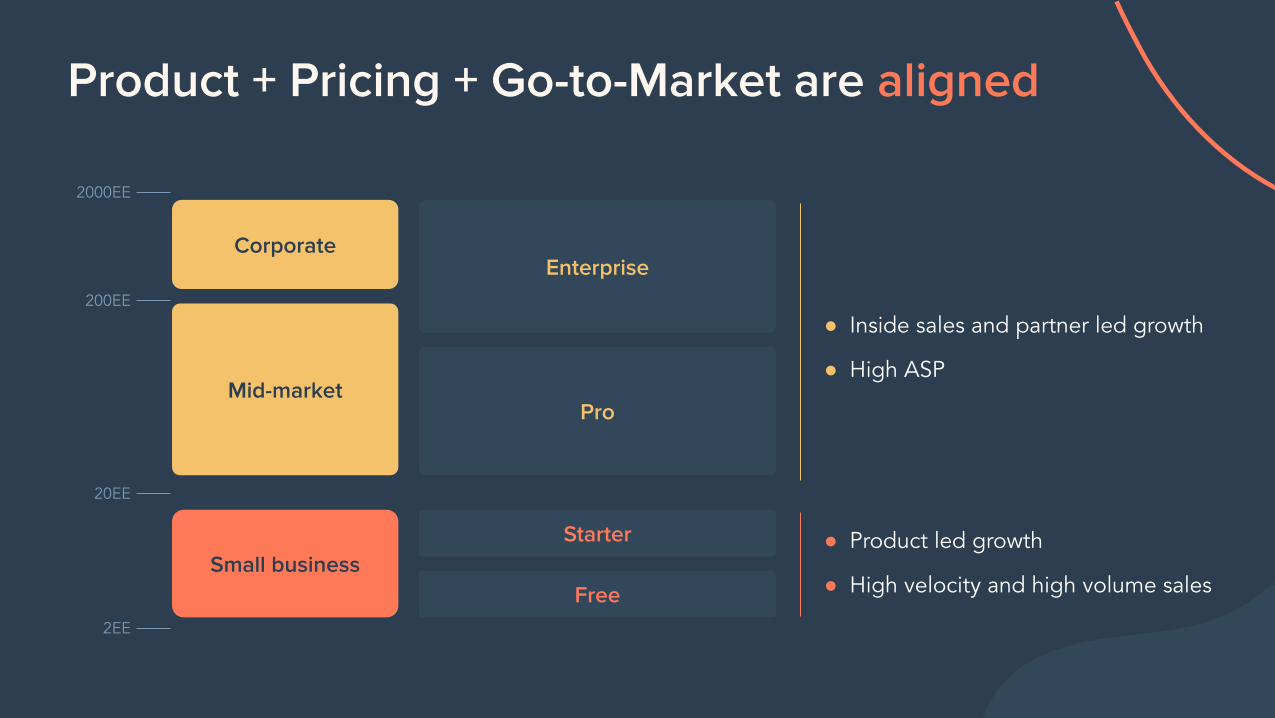
Product + Pricing + Go-to-Market are aligned
Corporate
Mid-market
Small business
2000EE
200EE
20EE
2EE
Pro
● Inside sales and partner led growth
● High ASP
● Product led growth
● High velocity and high volume sales
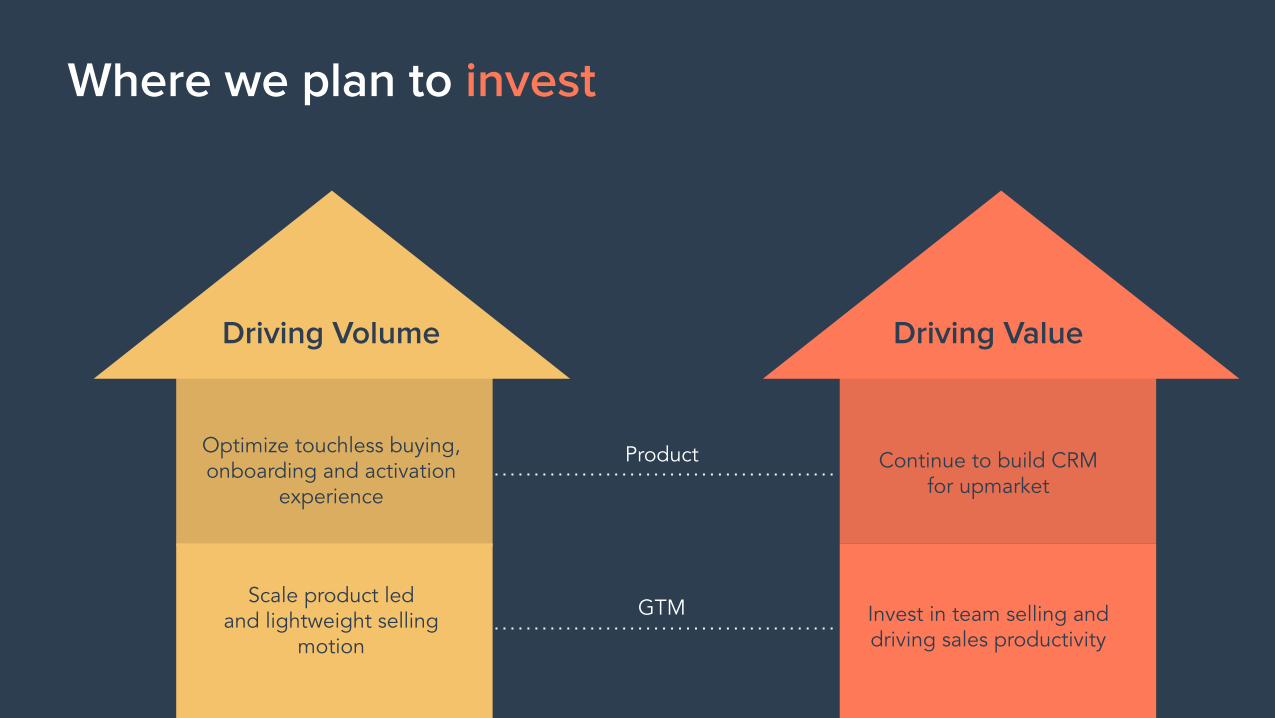
Where we plan to invest
Driving Volume
Optimize touchless buying, onboarding and activation
experience
Scale product ledand lightweight selling
motion
Driving Value
Continue to build CRM for upmarket
Invest in team selling and driving sales productivity
Driving Volume
Product
GTM

Invest in B2B Commerceand Payments
Strategic Pillar 3
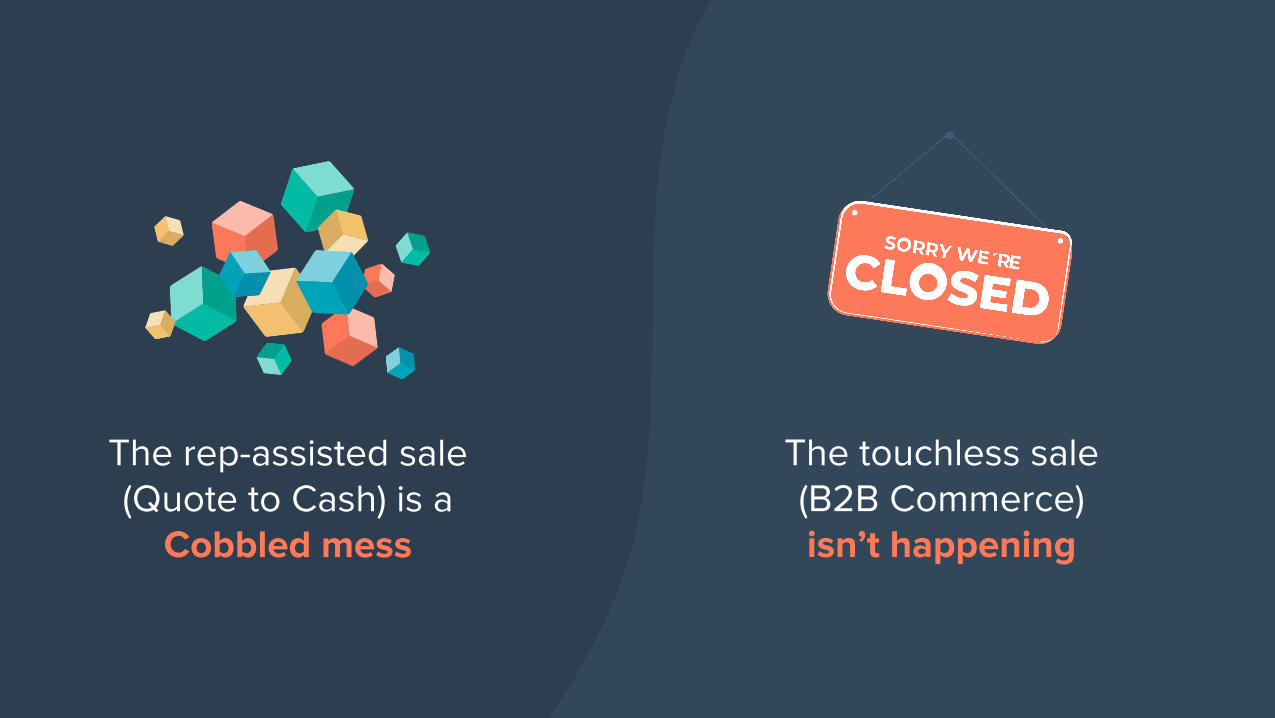
The rep-assisted sale (Quote to Cash) is a
Cobbled mess
The touchless sale (B2B Commerce) isn’t happening
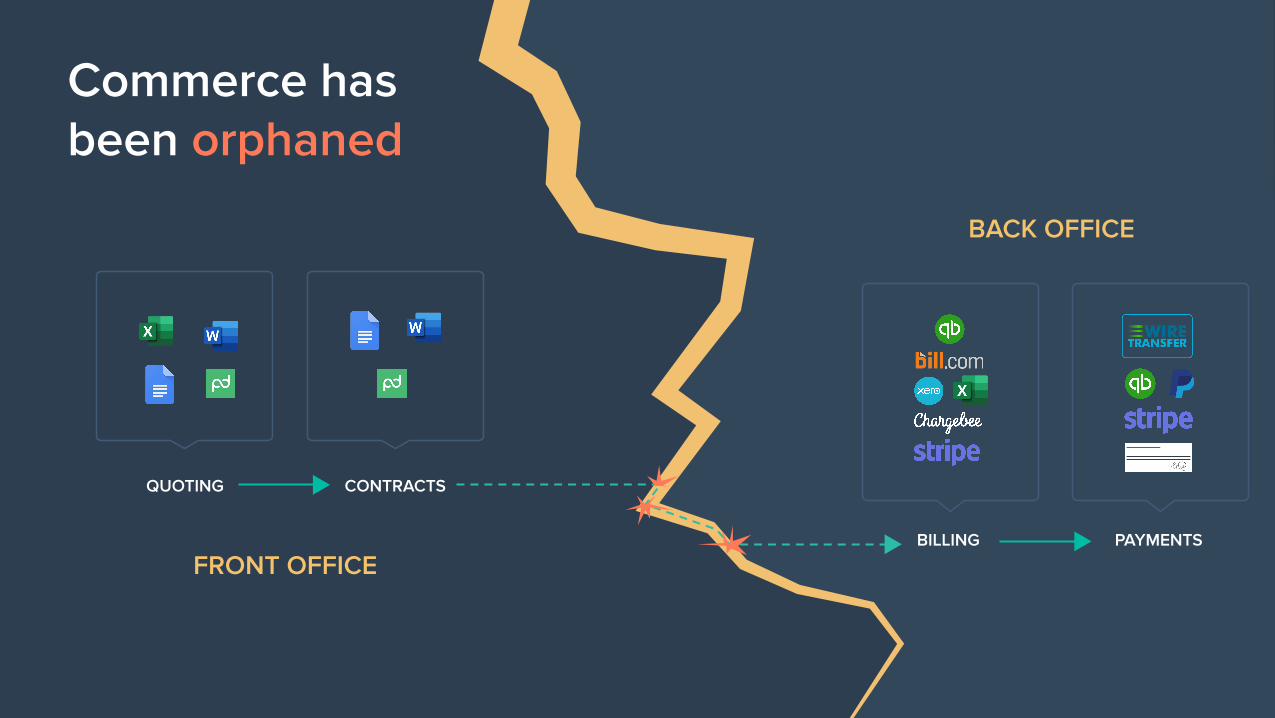
Commerce has been orphaned
BACK OFFICE
FRONT OFFICE
QUOTING CONTRACTS
BILLING PAYMENTS
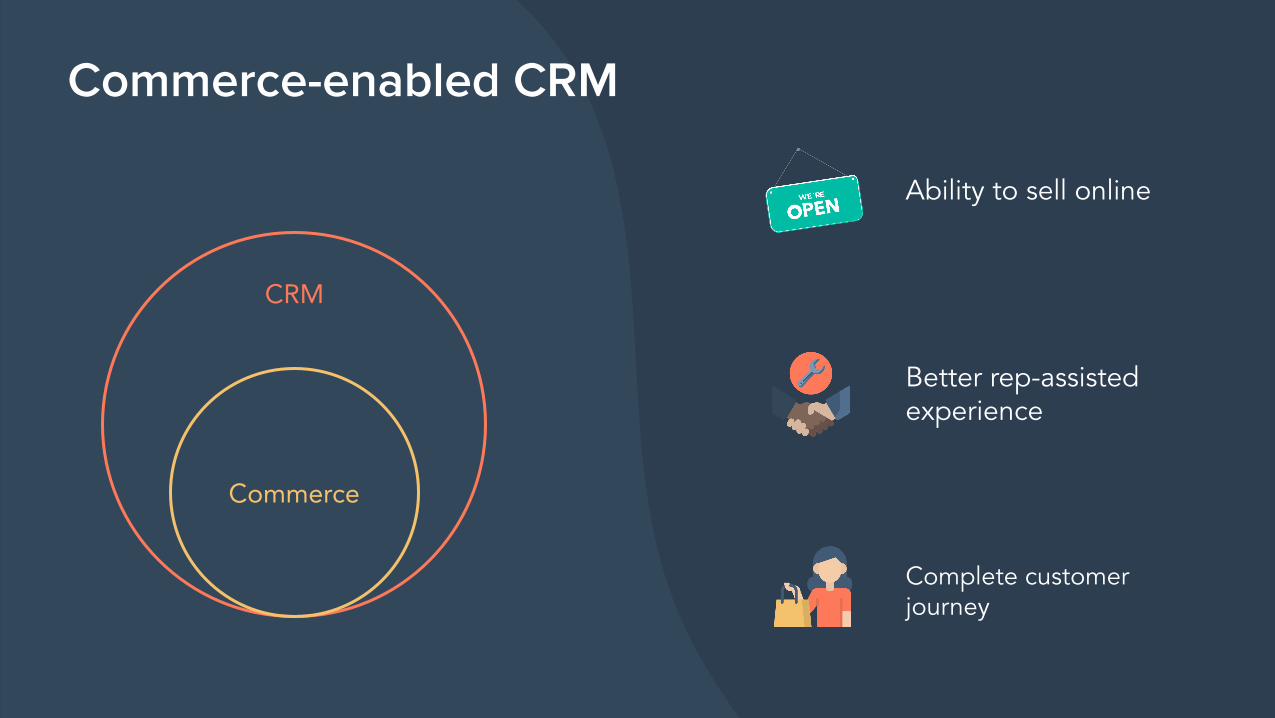
Commerce
CRM
31
Ability to sell online
Better rep-assisted experience
Complete customer journey
Commerce-enabled CRM

Continue toScale HubSpot
Strategic Pillar 4
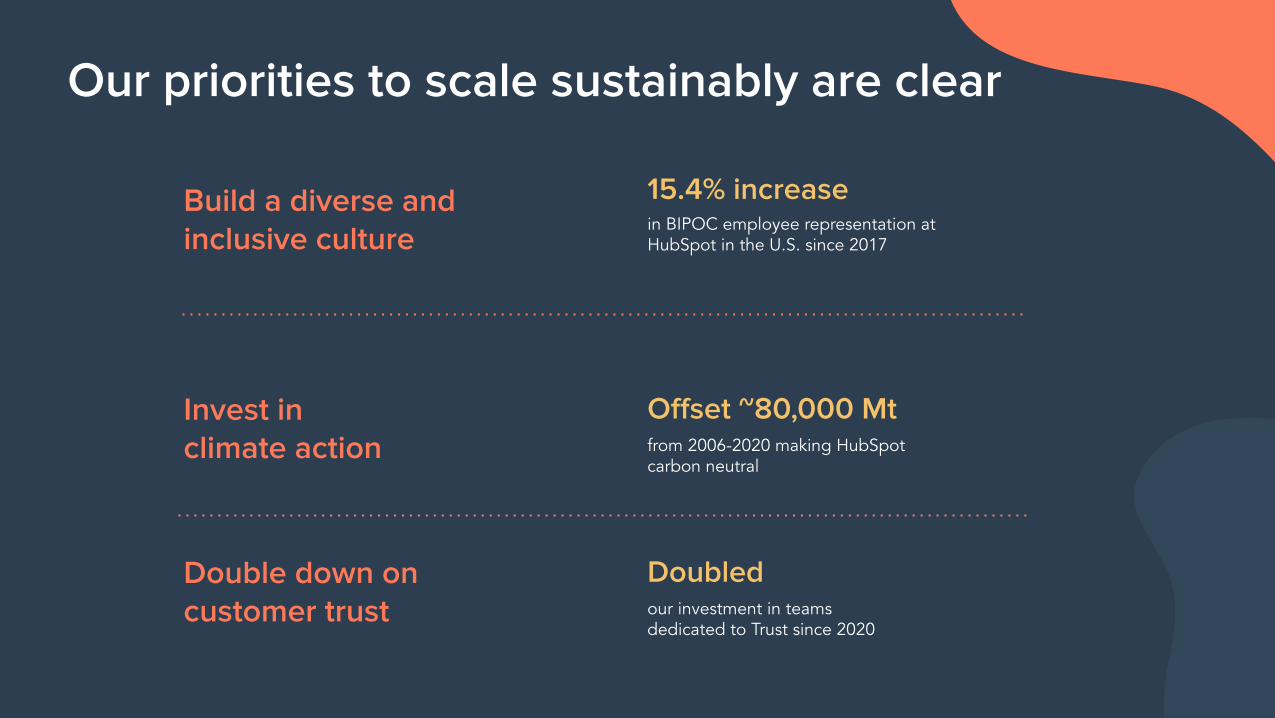
Our priorities to scale sustainably are clear
Build a diverse and inclusive culture
Invest in climate action
Double down on customer trust
in BIPOC employee representation at HubSpot in the U.S. since 2017
Offset ~80,000 Mtfrom 2006-2020 making HubSpotcarbon neutral
Doubledour investment in teamsdedicated to Trust since 2020
15.4% increase
In the age of the customer, delightful customer experience wins
HubSpot’s modern CRM is right for scaling businesses
New buyer expectations are defining modern CRM
We have the right strategy, the right investments, and the right team to win
Key Takeaways

FinanceOverviewKate BuekerChief Financial Officer
Safe Harbor StatementThis presentation includes certain “forward-looking statements" within the meaning of the Private Securities Litigation Reform Act of 1995, including statements regarding management’s expectations for future financial and operational performance and operating expenditures, expected growth, and business outlook, including our long-term financial framework; our focus on profitable growth; cash flow and margin improvement expectations; our product plans, strategies, and trends; our ability to expand our total addressable market; our position to execute on our growth strategy and related growth drivers; our opportunities in international markets; and our ability to expand our leadership position and market opportunity for our CRM platform. These forward-looking statements include, but are not limited to, plans, objectives, expectations and intentions and other statements contained in this press release that are not historical facts and statements identified by words such as "expects," "anticipates," "intends," "plans," "believes," "seeks," "estimates" or words of similar meaning. These forward-looking statements reflect our current views about our plans, intentions, expectations, strategies and prospects, which are based on the information currently available to us and on assumptions we have made. Although we believe that our plans, intentions, expectations, strategies and prospects as reflected in or suggested by those forward-looking statements are reasonable, we can give no assurance that the plans, intentions, expectations or strategies will be attained or achieved. Furthermore, actual results may differ materially from those described in the forward-looking statements and will be affected by a variety of risks and factors that are beyond our control including, without limitation, risks associated with the announced leadership changes, impact of COVID-19 on our business, the broader economy, and our ability to forecast our future financial performance as a result of COVID-19; our history of losses, our ability to retain existing customers and add new customers, the continued growth of the market for an inbound platform; our ability to differentiate our platform from competing products and technologies; our ability to manage our growth effectively to maintain our high level of service; our ability to maintain and expand relationships with our solutions partners; our ability to successfully recruit and retain highly-qualified personnel; the price volatility of our common stock, and other risks set forth under the caption "Risk Factors" in our Quarterly Report on Form 10-Q filed on August 4, 2021 and our other SEC filings. We assume no obligation to update any forward-looking statements contained in this document as a result of new information, future events or otherwise.
1. HubSpot’s strong and durable business
2. Impact of Strategic Pillars
3. Long-Term Model
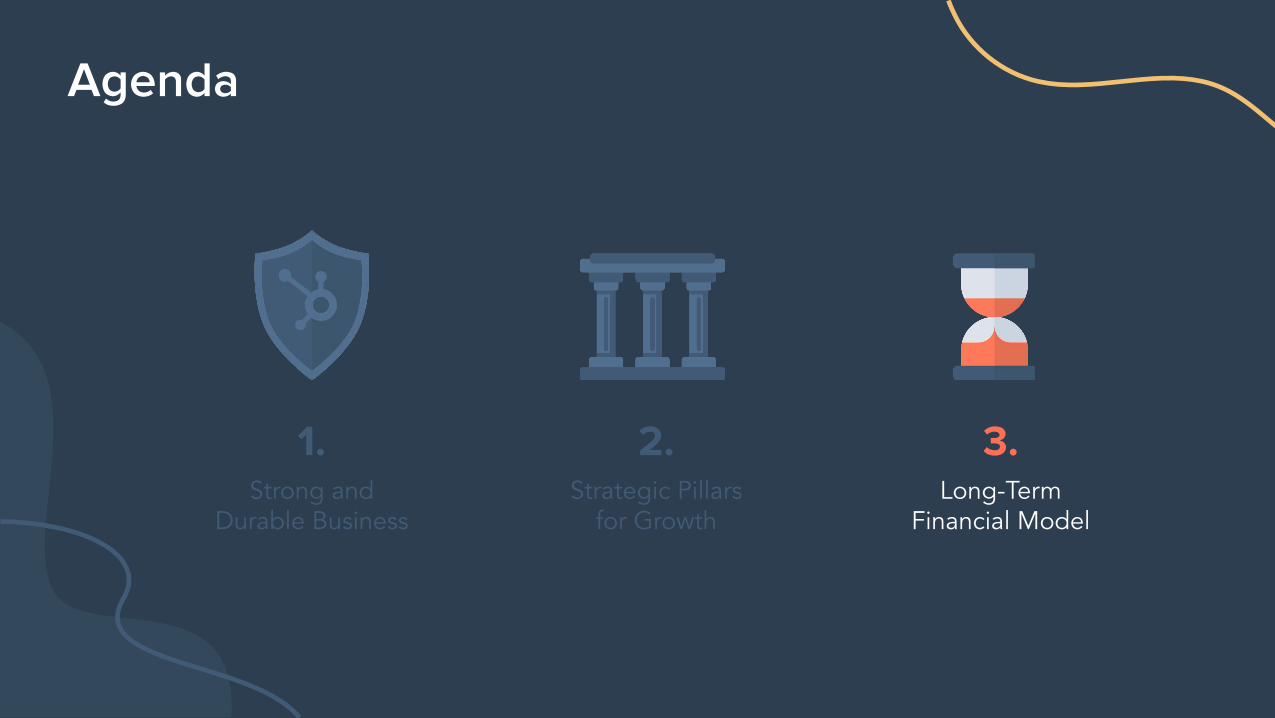
Agenda
1.Strong and
Durable Business
2.Strategic Pillars
for Growth
3.Long-Term
Financial Model
Agenda
1.Strong and
Durable Business
2.Strategic Pillars
for Growth
3.Long-Term
Financial Model
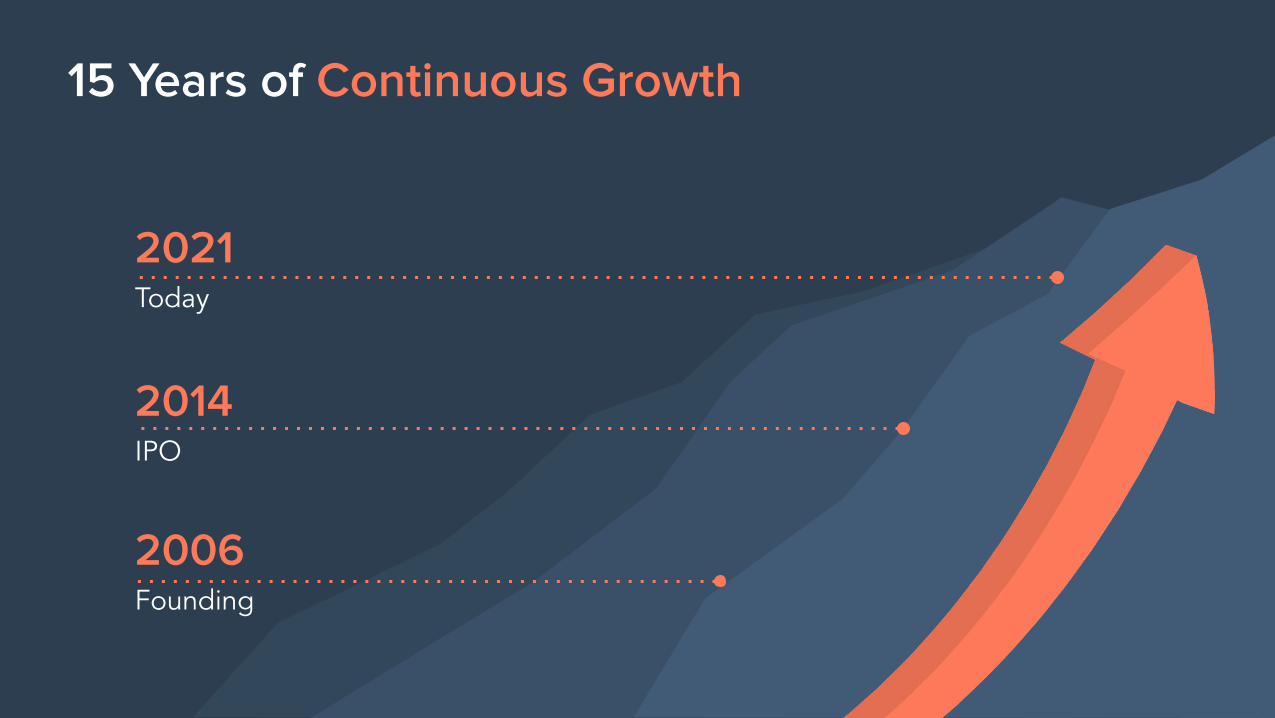
15 Years of Continuous Growth
2006Founding
2014IPO
2021Today
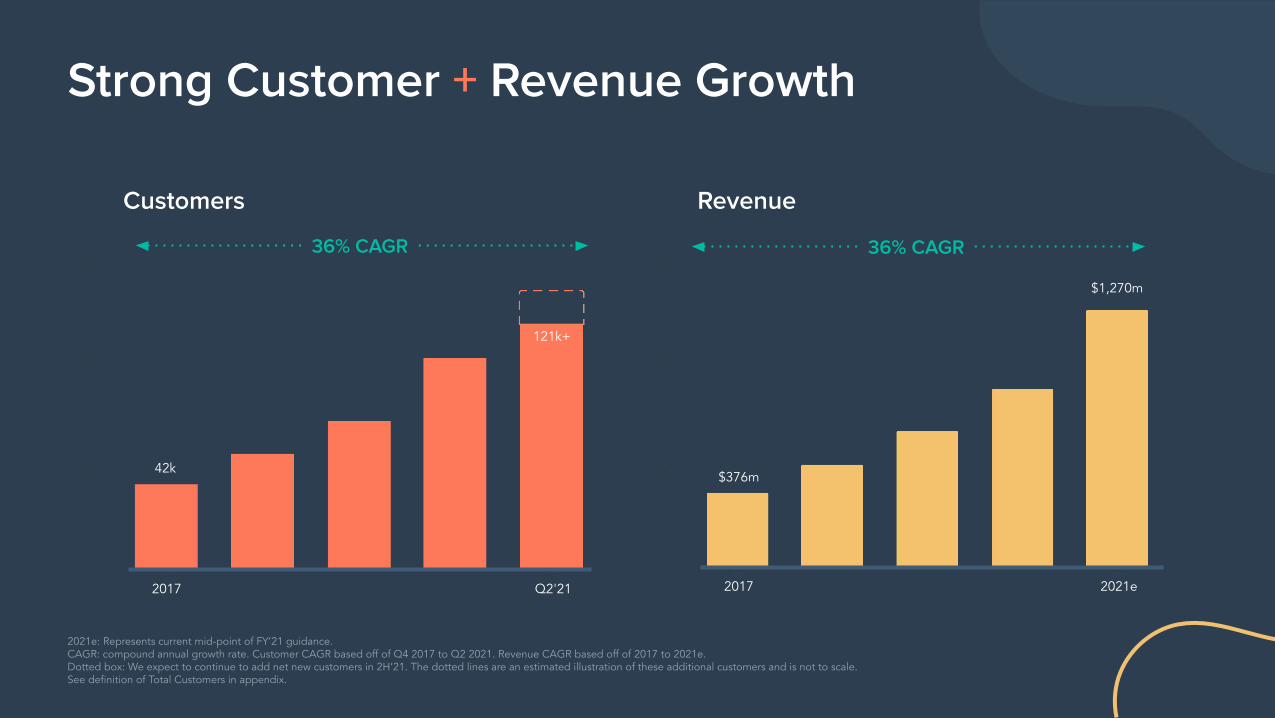
Strong Customer + Revenue Growth
2021e: Represents current mid-point of FY’21 guidance.CAGR: compound annual growth rate. Customer CAGR based off of Q4 2017 to Q2 2021. Revenue CAGR based off of 2017 to 2021e.Dotted box: We expect to continue to add net new customers in 2H’21. The dotted lines are an estimated illustration of these additional customers and is not to scale.See definition of Total Customers in appendix.
Customers
36% CAGR
121k+
42k
Q2'212017
Revenue
36% CAGR
$376m
$1,270m
2021e2017
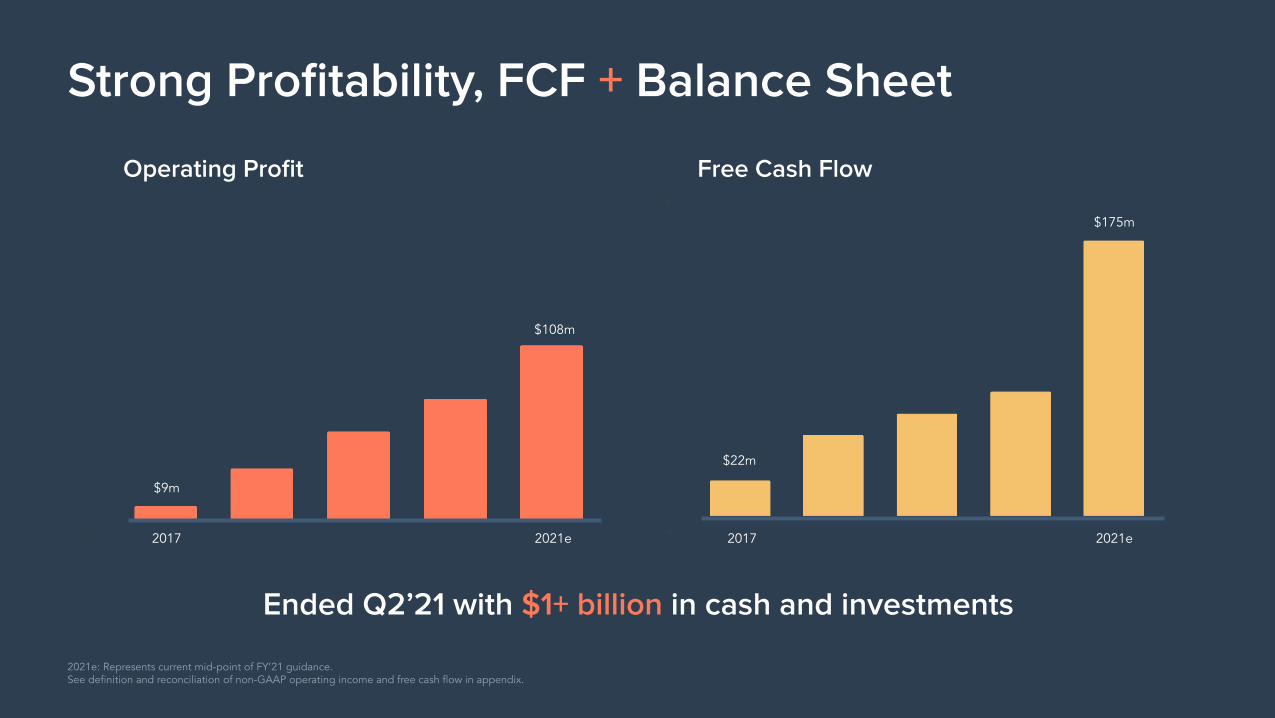
Strong Profitability, FCF + Balance Sheet
2021e: Represents current mid-point of FY’21 guidance. See definition and reconciliation of non-GAAP operating income and free cash flow in appendix.
Ended Q2’21 with $1+ billion in cash and investments
Operating Profit Free Cash Flow
$108m
$9m
$22m
$175m
2021e2017 2021e2017
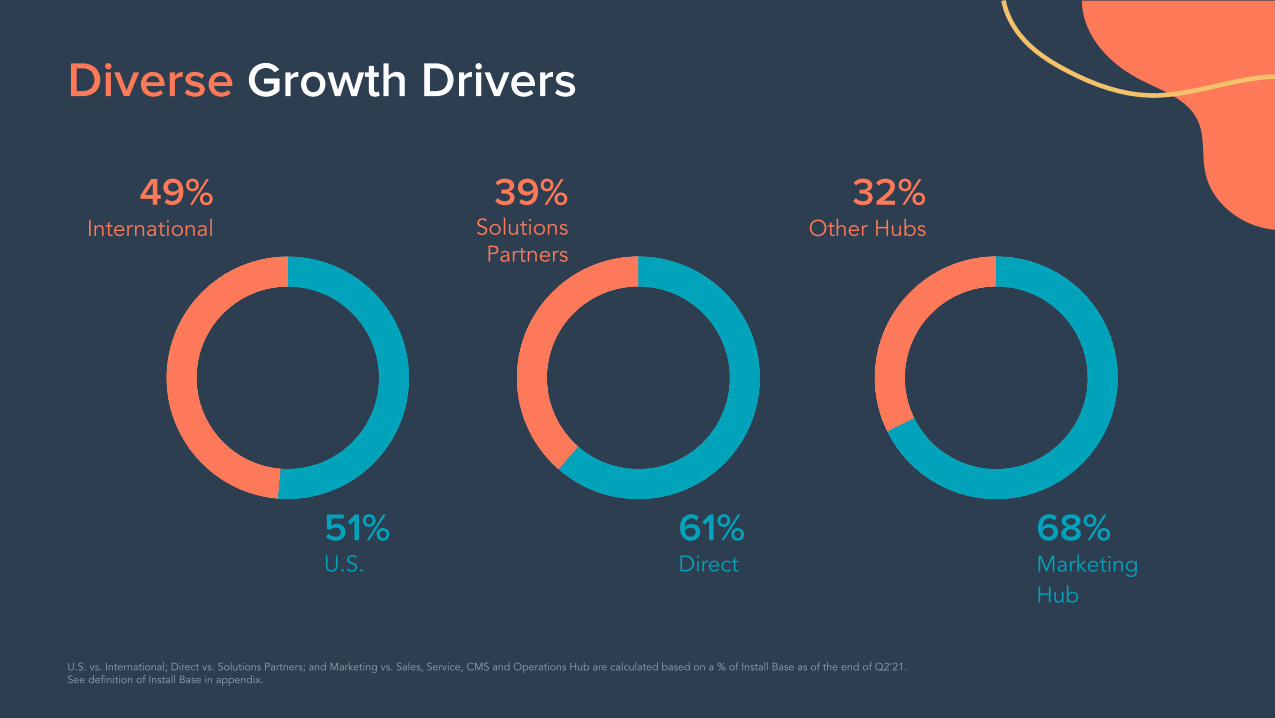
Diverse Growth Drivers
U.S. vs. International; Direct vs. Solutions Partners; and Marketing vs. Sales, Service, CMS and Operations Hub are calculated based on a % of Install Base as of the end of Q2’21. See definition of Install Base in appendix.
49%International
51%U.S.
39%Solutions Partners
61%Direct
32%Other Hubs
68%MarketingHub
1. HubSpot’s strong and durable business
2. Impact of Strategic Pillars
3. Long-Term Model
Agenda
1.Strong and
Durable Business
2.Strategic Pillars
for Growth
3.Long-Term
Financial Model
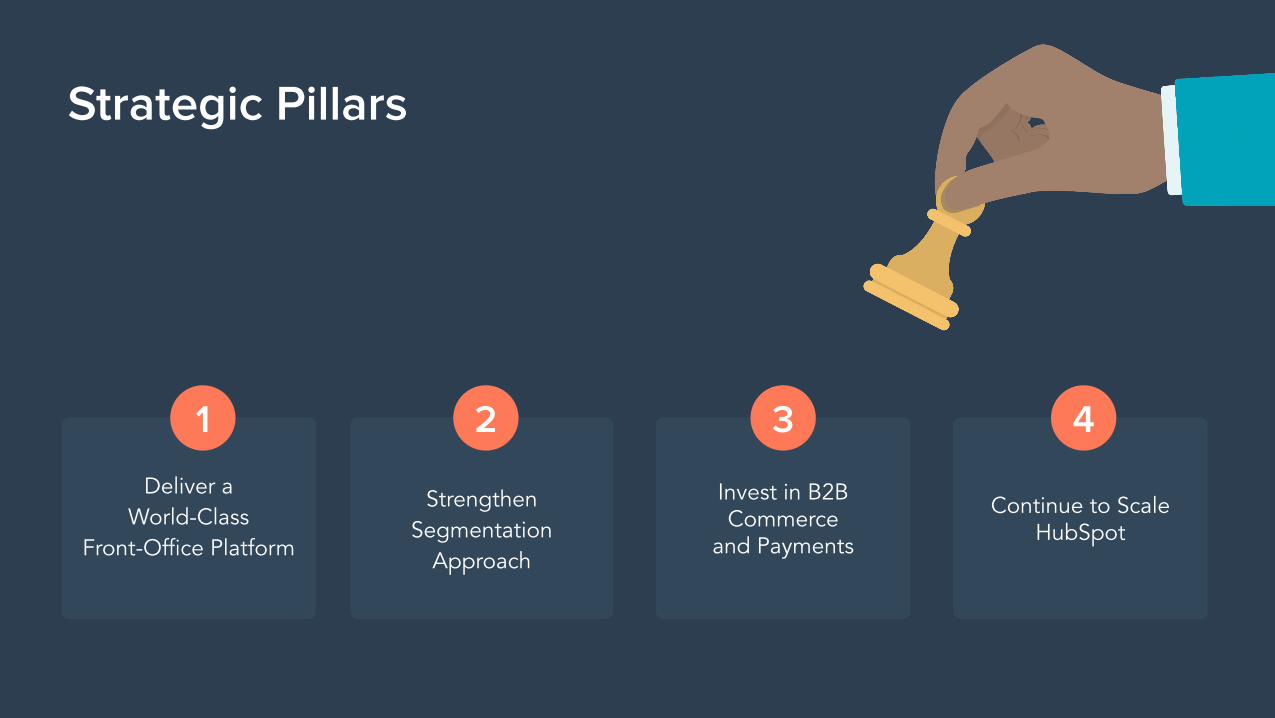
Strategic Pillars
Deliver a World-Class
Front-Office Platform
1
Strengthen Segmentation
Approach
Invest in B2B Commerce
and Payments
Continue to ScaleHubSpot
2 3 4

Strategic Pillar
Deliver a World-ClassFront-Office Platform
1
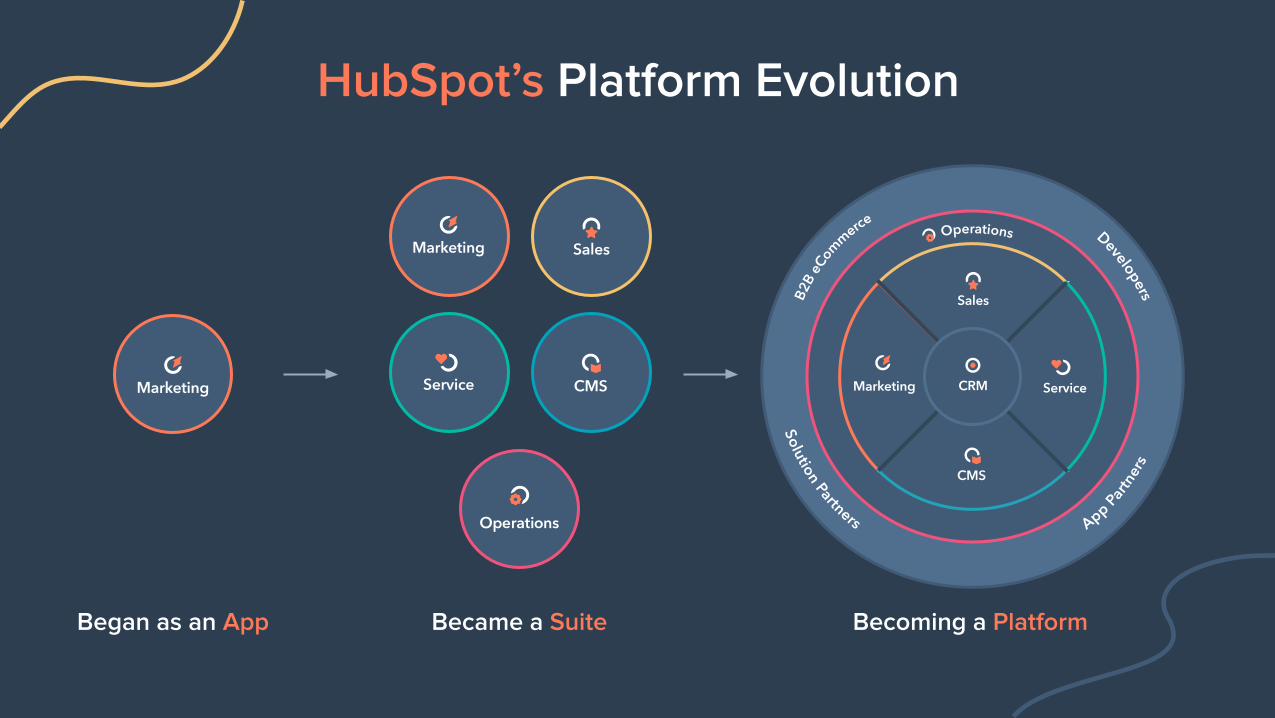
HubSpot’s Platform Evolution
Began as an App Became a Suite Becoming a Platform
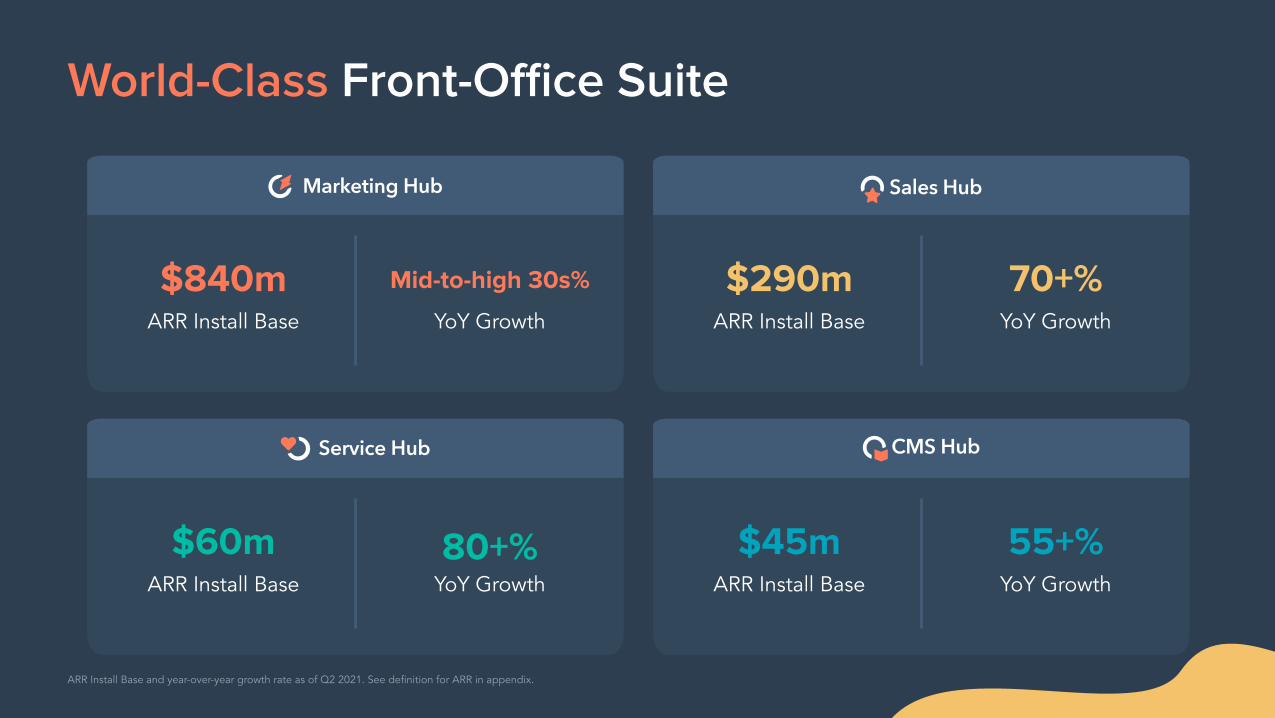
World-Class Front-Office Suite
$840mARR Install Base
Mid-to-high 30s%
YoY Growth
$290mARR Install Base
70+%YoY Growth
$60mARR Install Base
80+%YoY Growth
$45mARR Install Base
55+%YoY Growth
ARR Install Base and year-over-year growth rate as of Q2 2021. See definition for ARR in appendix.
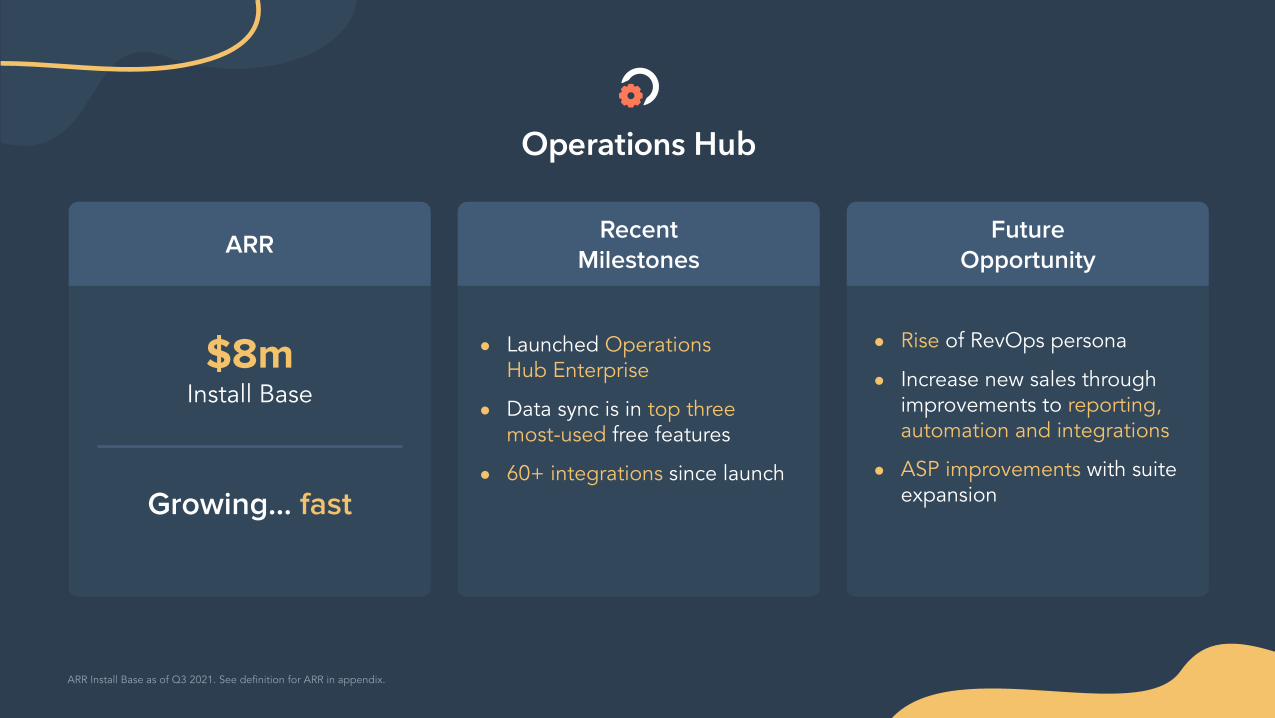
● Rise of RevOps persona
● Increase new sales through improvements to reporting, automation and integrations
● ASP improvements with suite expansion
ARRRecent
MilestonesFuture
Opportunity
$8m ● Launched Operations Hub Enterprise
● Data sync is in top three most-used free features
● 60+ integrations since launch
ARR Install Base as of Q3 2021. See definition for ARR in appendix.
Install Base
Growing… fast
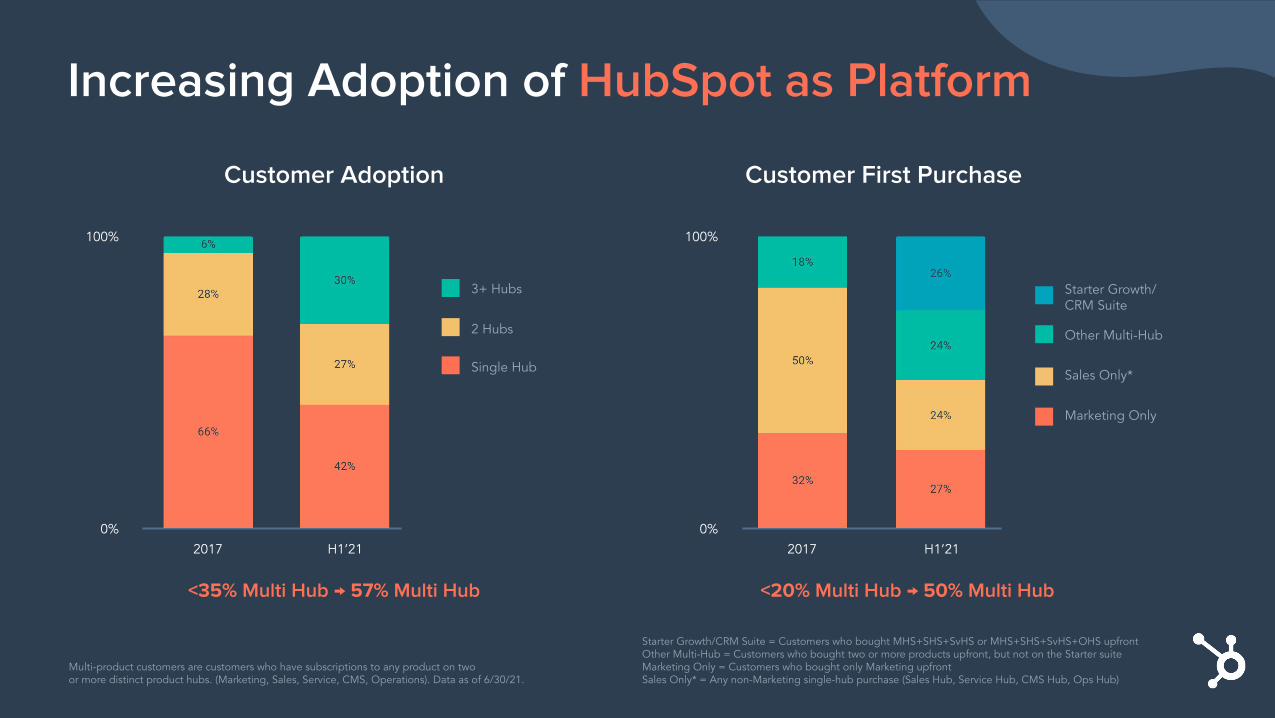
Increasing Adoption of HubSpot as Platform
Starter Growth/CRM Suite = Customers who bought MHS+SHS+SvHS or MHS+SHS+SvHS+OHS upfrontOther Multi-Hub = Customers who bought two or more products upfront, but not on the Starter suiteMarketing Only = Customers who bought only Marketing upfrontSales Only* = Any non-Marketing single-hub purchase (Sales Hub, Service Hub, CMS Hub, Ops Hub)
Starter Growth/ CRM Suite
Other Multi-Hub
Sales Only*
Marketing Only
Customer First Purchase
<20% Multi Hub → 50% Multi Hub
2017 H1’210%
100%
Multi-product customers are customers who have subscriptions to any product on two or more distinct product hubs. (Marketing, Sales, Service, CMS, Operations). Data as of 6/30/21.
3+ Hubs
2 Hubs
Single Hub
Customer Adoption
<35% Multi Hub → 57% Multi Hub
2017 H1’210%
100%
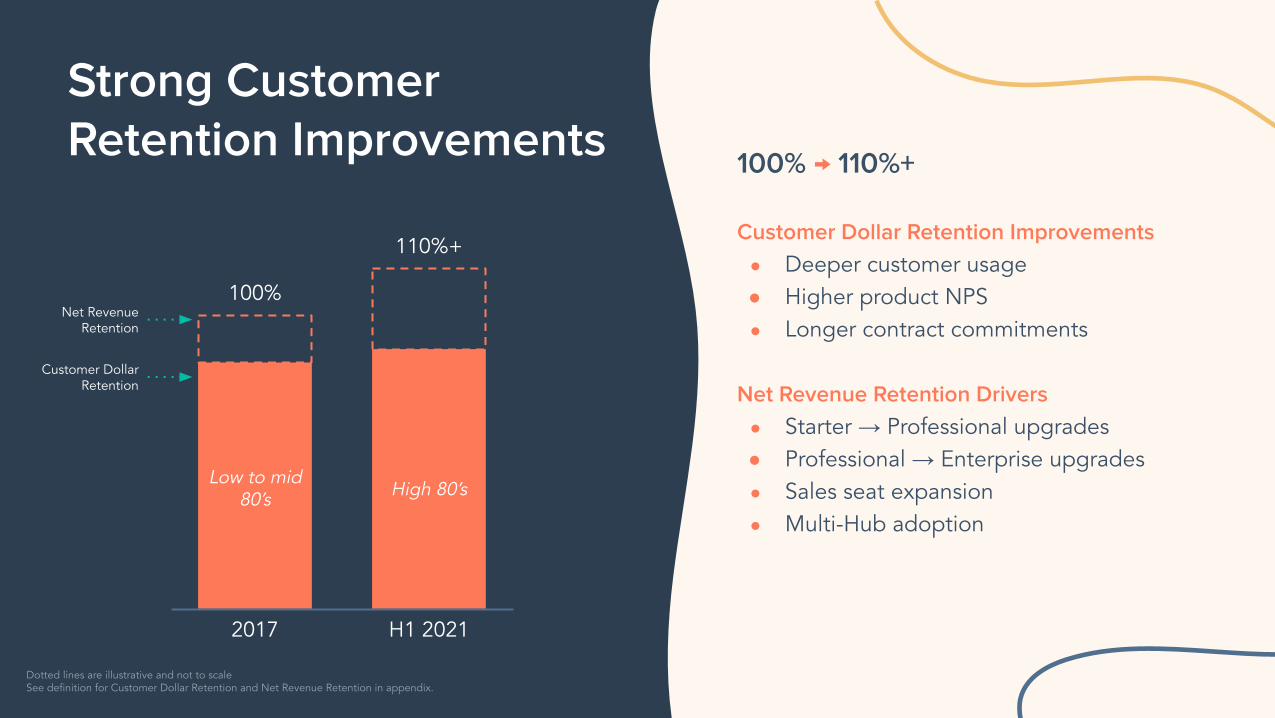
Strong Customer Retention Improvements
2017 H1 2021
Low to mid 80’s High 80’s
100%
110%+
100% → 110%+
Customer Dollar Retention Improvements● Deeper customer usage● Higher product NPS● Longer contract commitments
Net Revenue Retention Drivers● Starter → Professional upgrades● Professional → Enterprise upgrades● Sales seat expansion● Multi-Hub adoption
Dotted lines are illustrative and not to scaleSee definition for Customer Dollar Retention and Net Revenue Retention in appendix.
Customer Dollar Retention
Net Revenue Retention
StrengthenSegmentation Approach
Strategic Pillar 2
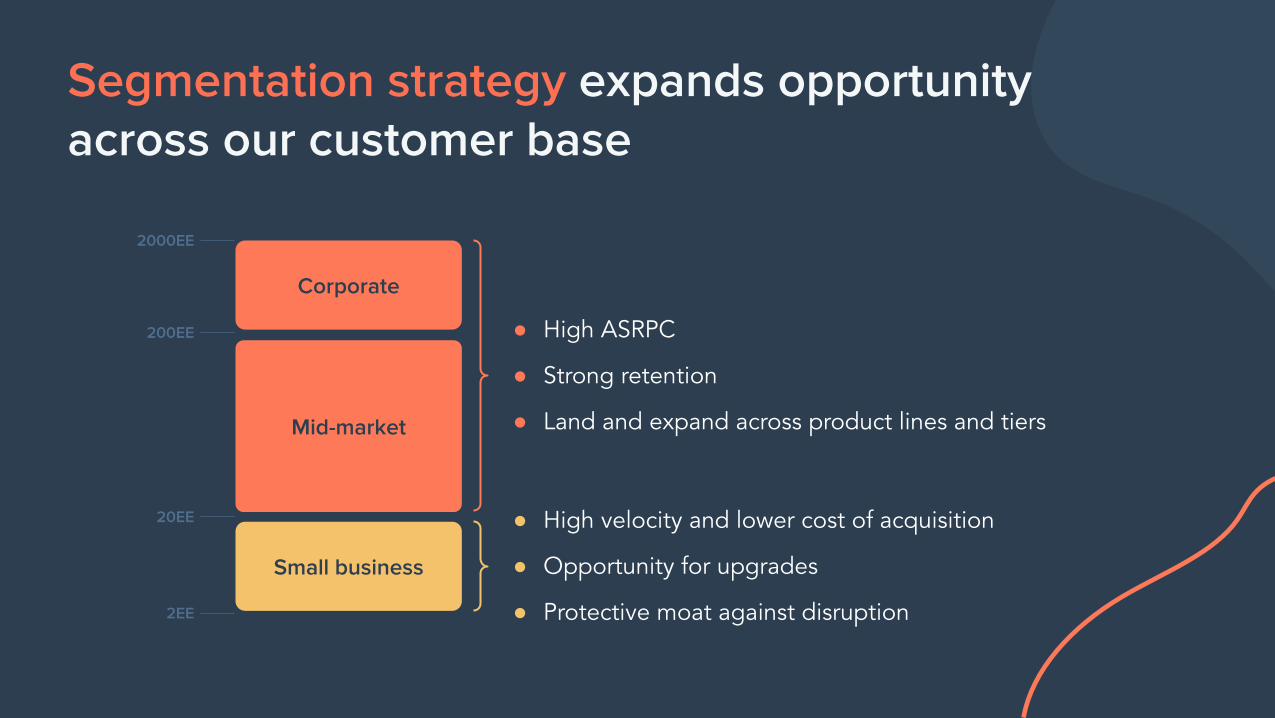
Segmentation strategy expands opportunity across our customer base
Corporate
Mid-market
Small business
2000EE
200EE
20EE
2EE
● High ASRPC
● Strong retention
● Land and expand across product lines and tiers
● High velocity and lower cost of acquisition
● Opportunity for upgrades
● Protective moat against disruption
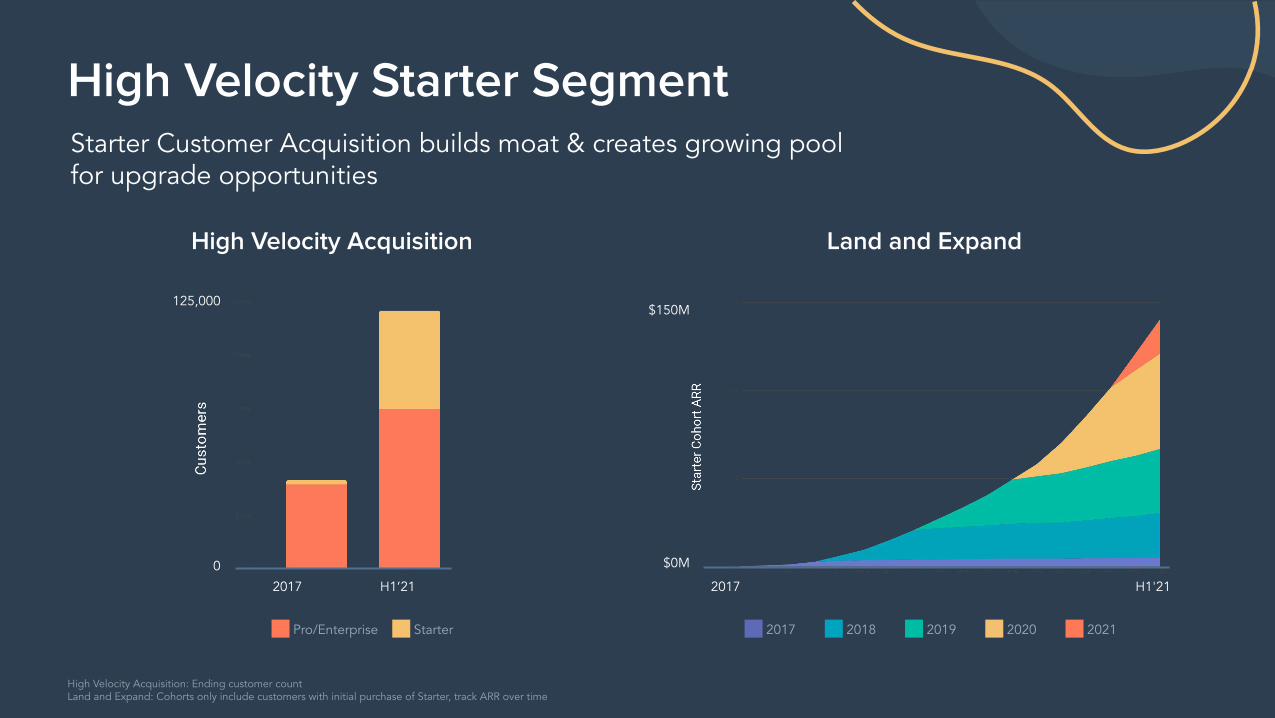
Starter Customer Acquisition builds moat & creates growing poolfor upgrade opportunities
High Velocity Acquisition Land and Expand
High Velocity Starter Segment
2017 2018 2019 2020 2021Pro/Enterprise Starter
High Velocity Acquisition: Ending customer countLand and Expand: Cohorts only include customers with initial purchase of Starter, track ARR over time
0
125,000
$0M
$150M
2017 H1'212017 H1’21
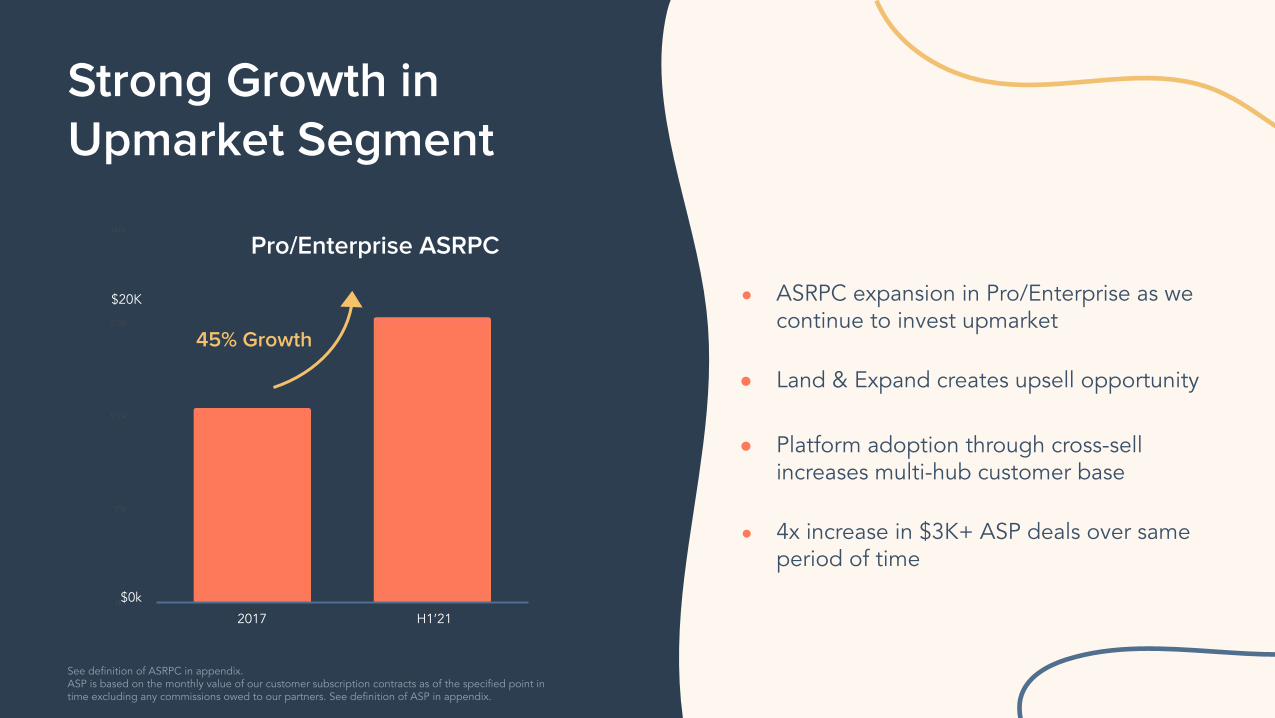
Strong Growth in Upmarket Segment
● ASRPC expansion in Pro/Enterprise as we continue to invest upmarket
● Land & Expand creates upsell opportunity
● Platform adoption through cross-sell increases multi-hub customer base
● 4x increase in $3K+ ASP deals over same period of time
Pro/Enterprise ASRPC
$0k
$20K
45% Growth
2017 H1’21
See definition of ASRPC in appendix.ASP is based on the monthly value of our customer subscription contracts as of the specified point in time excluding any commissions owed to our partners. See definition of ASP in appendix.
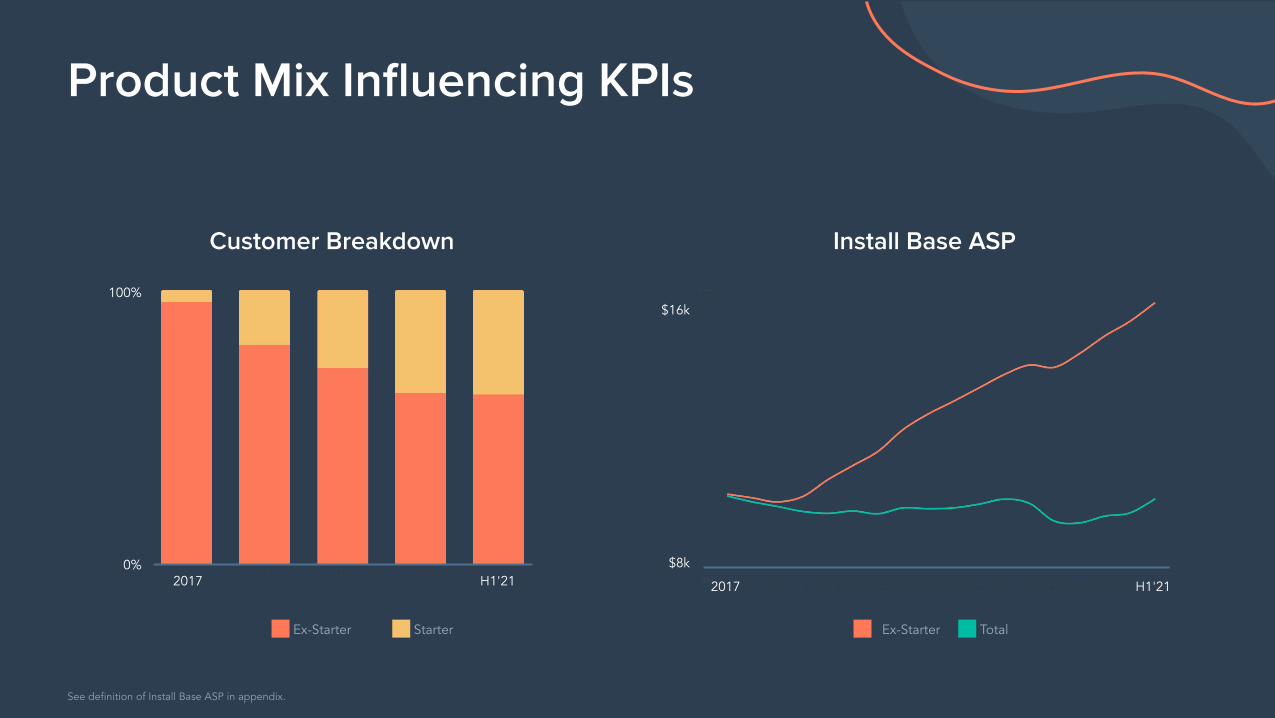
Customer Breakdown Install Base ASP
Product Mix Influencing KPIs
Ex-Starter Starter
See definition of Install Base ASP in appendix.
$8k
$16k
2017 H1'212017 H1'210%
100%
Ex-Starter Total

Invest in B2B Commerceand Payments
Strategic Pillar 3
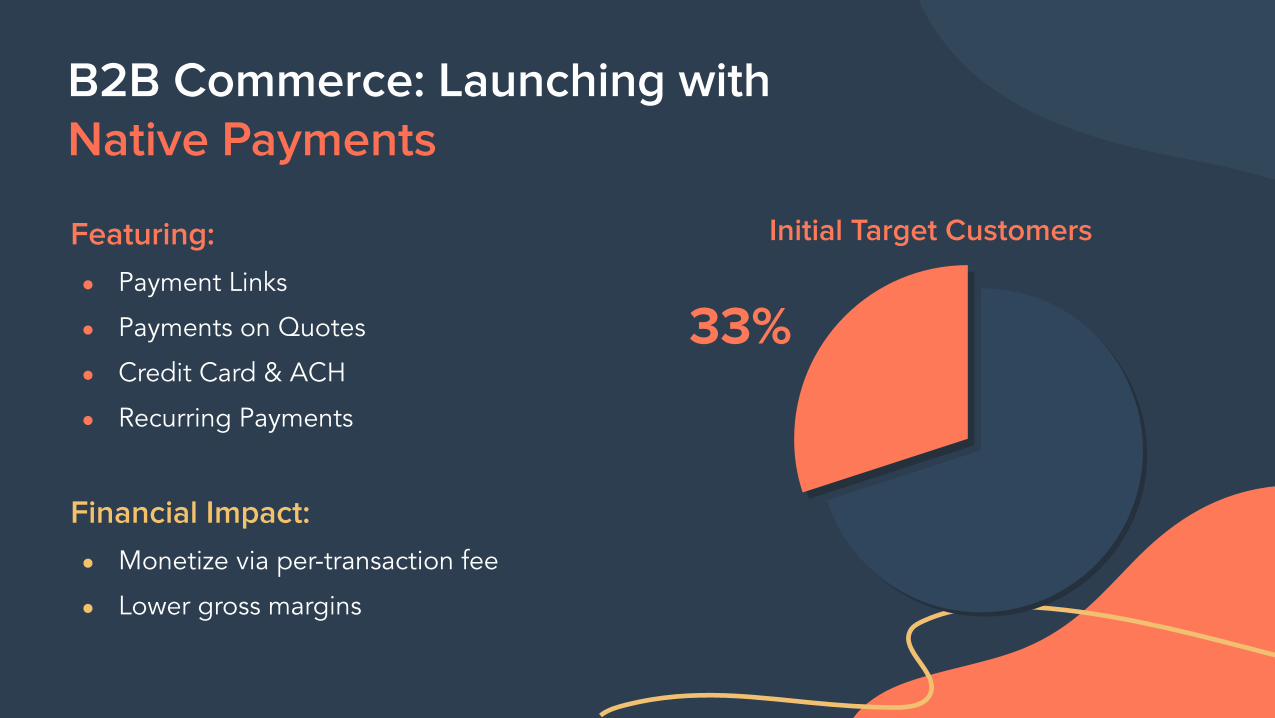
B2B Commerce: Launching withNative Payments
Financial Impact:● Monetize via per-transaction fee
● Lower gross margins
Featuring:● Payment Links
● Payments on Quotes
● Credit Card & ACH
● Recurring Payments
Initial Target Customers
33%
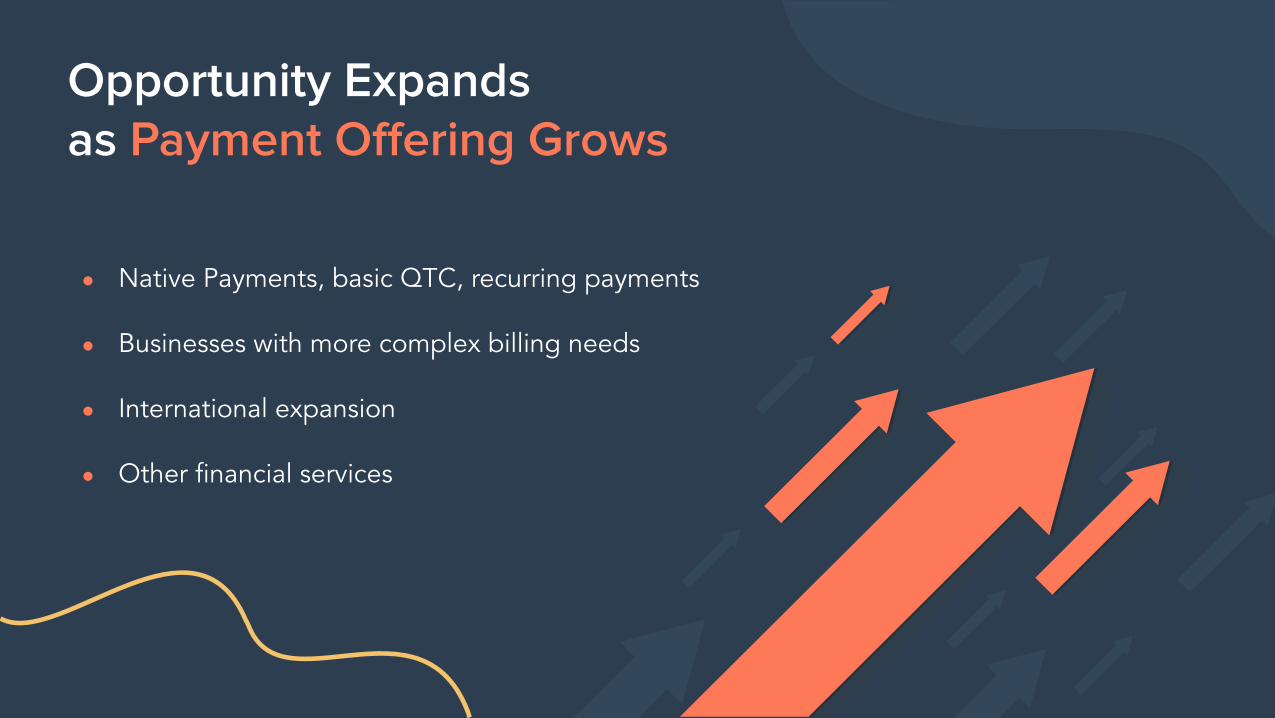
Opportunity Expands as Payment Offering Grows
● Native Payments, basic QTC, recurring payments
● Businesses with more complex billing needs
● International expansion
● Other financial services
1. HubSpot’s strong and durable business
2. Impact of Strategic Pillars
3. Long-Term Model
Agenda
1.Strong and
Durable Business
2.Strategic Pillars
for Growth
3.Long-Term
Financial Model

Drive durable growth at scale
Our Philosophy on Profit and Growth
Drive efficiencies and expand margins consistent with long-term financial framework
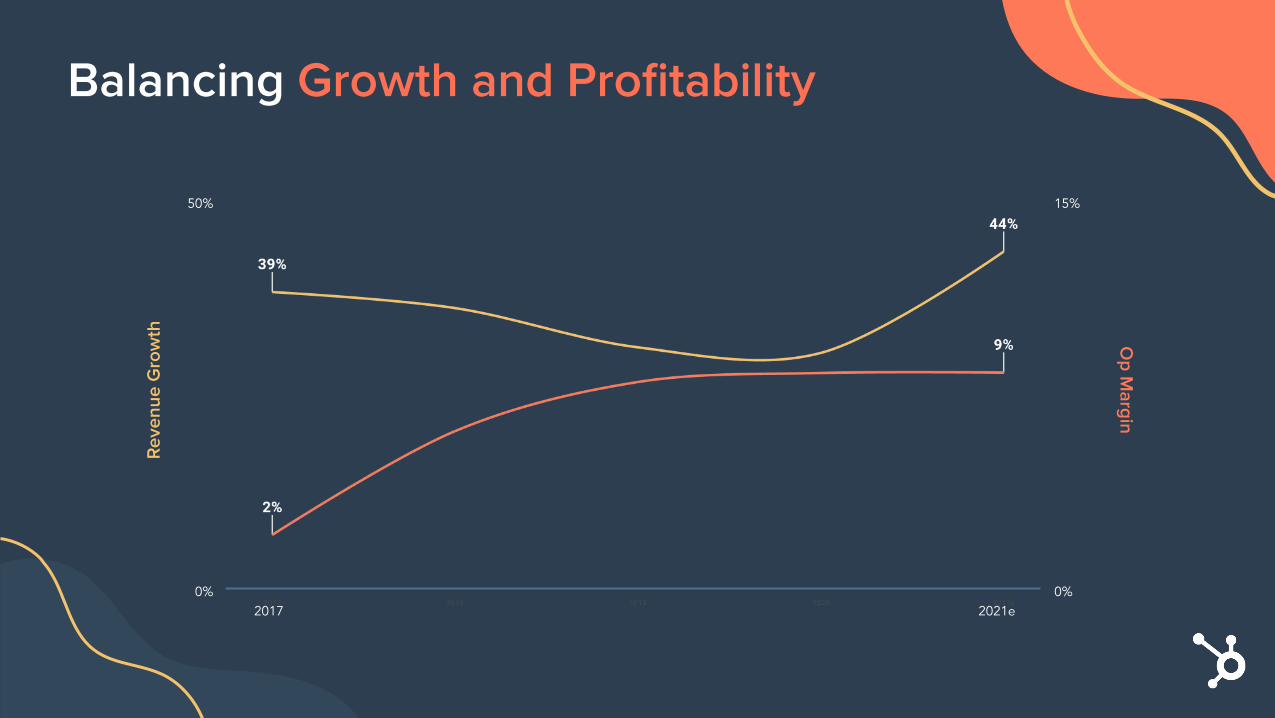
Balancing Growth and Profitability
2017 2021e
50%
0%
15%
0%
Rev
enue
Gro
wth O
p Margin
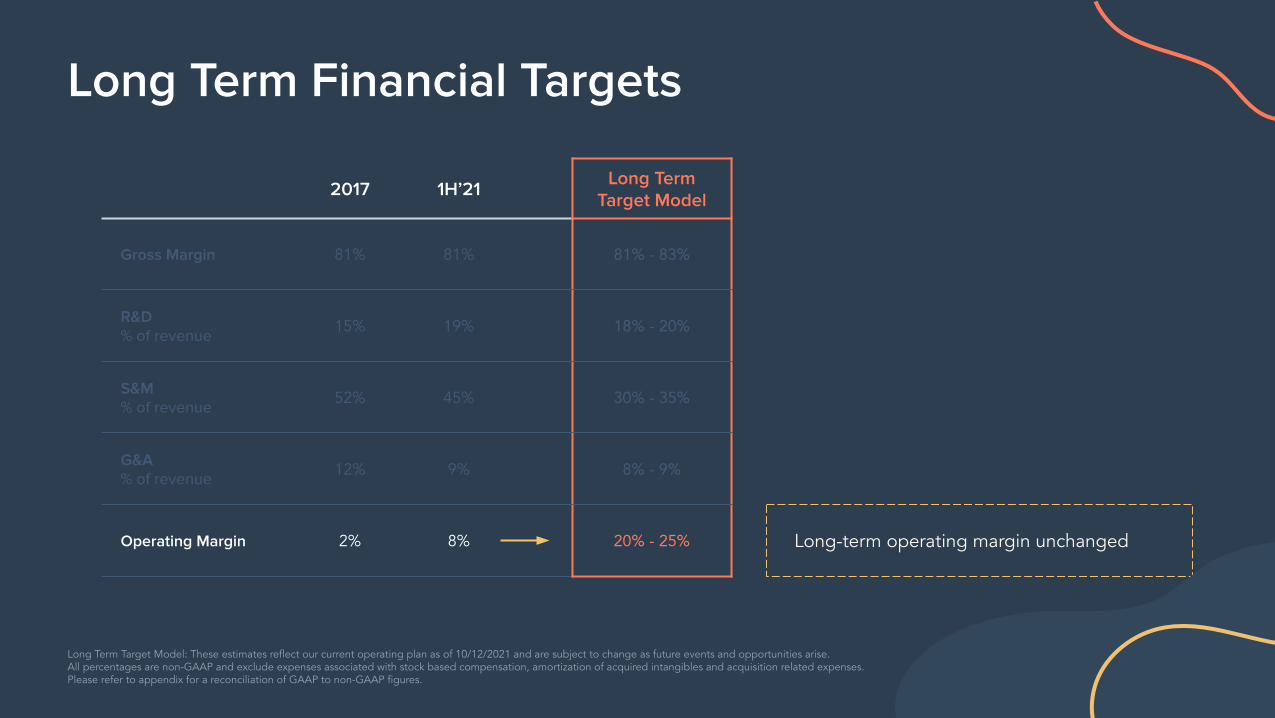
Long-term operating margin unchanged
Long Term Financial Targets
Long Term Target Model: These estimates reflect our current operating plan as of 10/12/2021 and are subject to change as future events and opportunities arise.All percentages are non-GAAP and exclude expenses associated with stock based compensation, amortization of acquired intangibles and acquisition related expenses. Please refer to appendix for a reconciliation of GAAP to non-GAAP figures.
2017 1H’21 Long Term Target Model
Gross Margin 81% 81% 81% - 83%
R&D% of revenue
15% 19% 18% - 20%
S&M% of revenue
52% 45% 30% - 35%
G&A% of revenue
12% 9% 8% - 9%
Operating Margin 2% 8% 20% - 25%
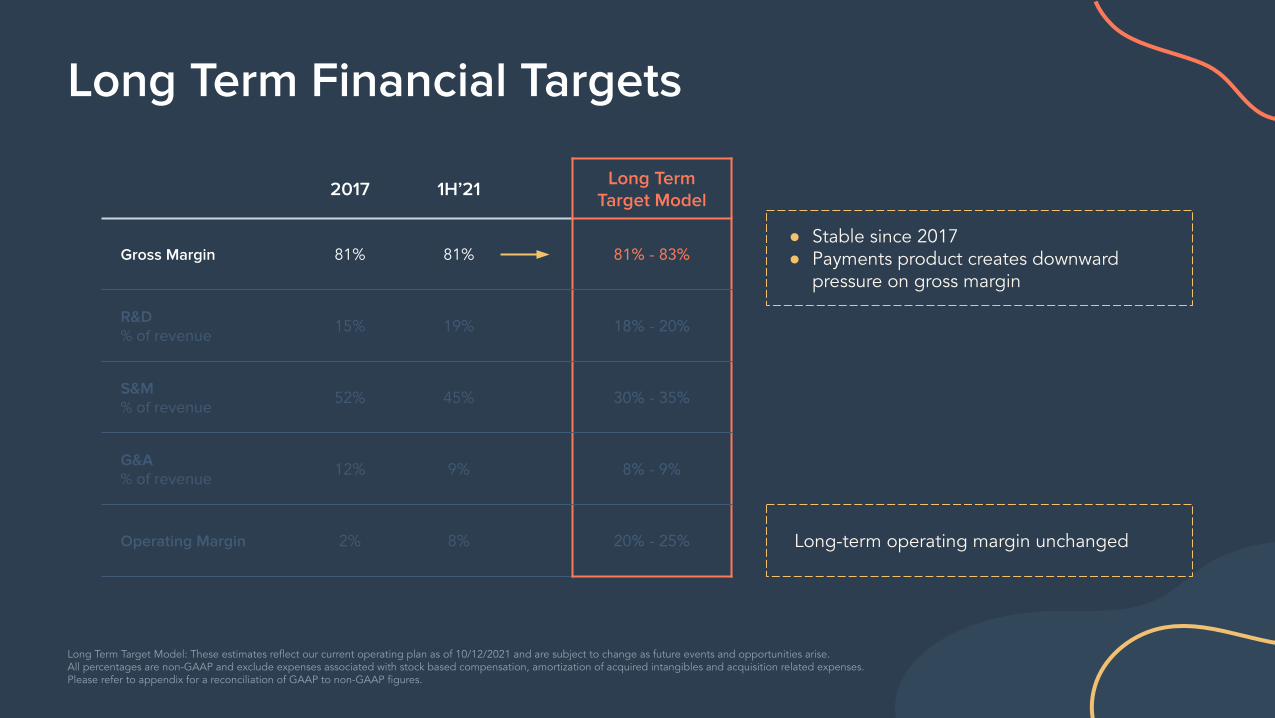
● Stable since 2017● Payments product creates downward
pressure on gross margin
Long Term Financial Targets
Long Term Target Model: These estimates reflect our current operating plan as of 10/12/2021 and are subject to change as future events and opportunities arise.All percentages are non-GAAP and exclude expenses associated with stock based compensation, amortization of acquired intangibles and acquisition related expenses. Please refer to appendix for a reconciliation of GAAP to non-GAAP figures.
2017 1H’21 Long Term Target Model
Gross Margin 81% 81% 81% - 83%
R&D% of revenue
15% 19% 18% - 20%
S&M% of revenue
52% 45% 30% - 35%
G&A% of revenue
12% 9% 8% - 9%
Operating Margin 2% 8% 20% - 25% Long-term operating margin unchanged
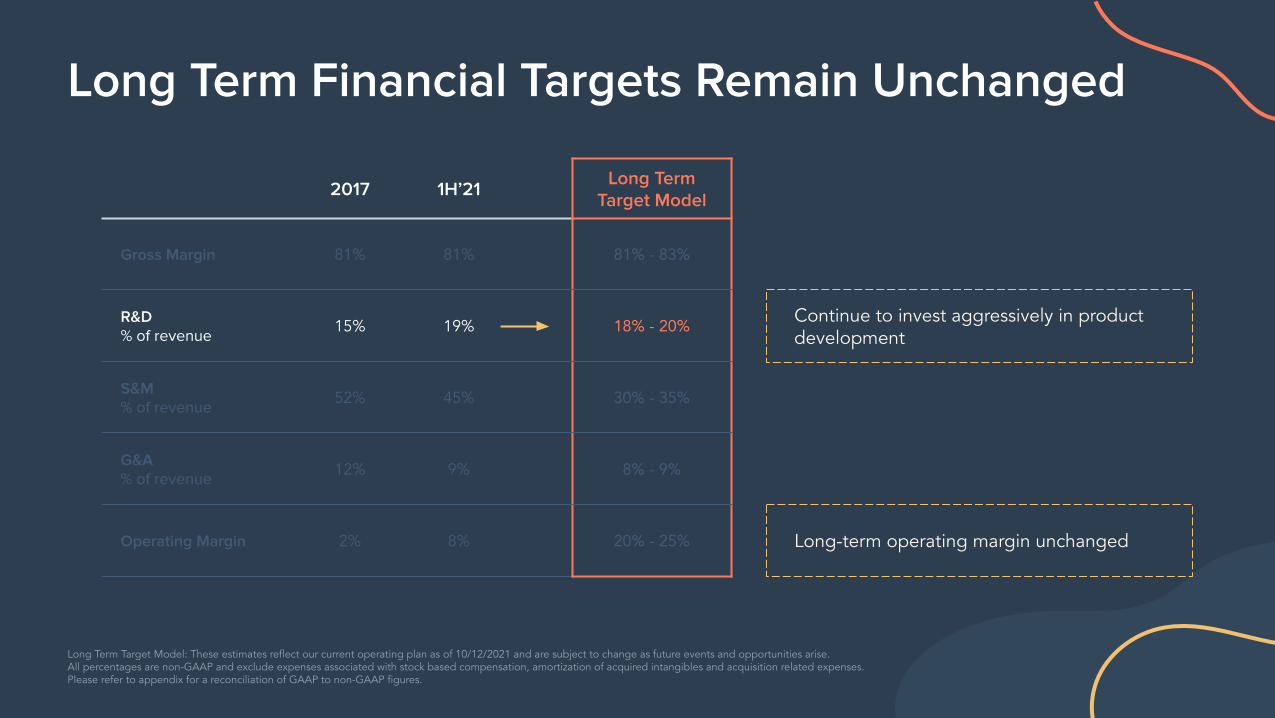
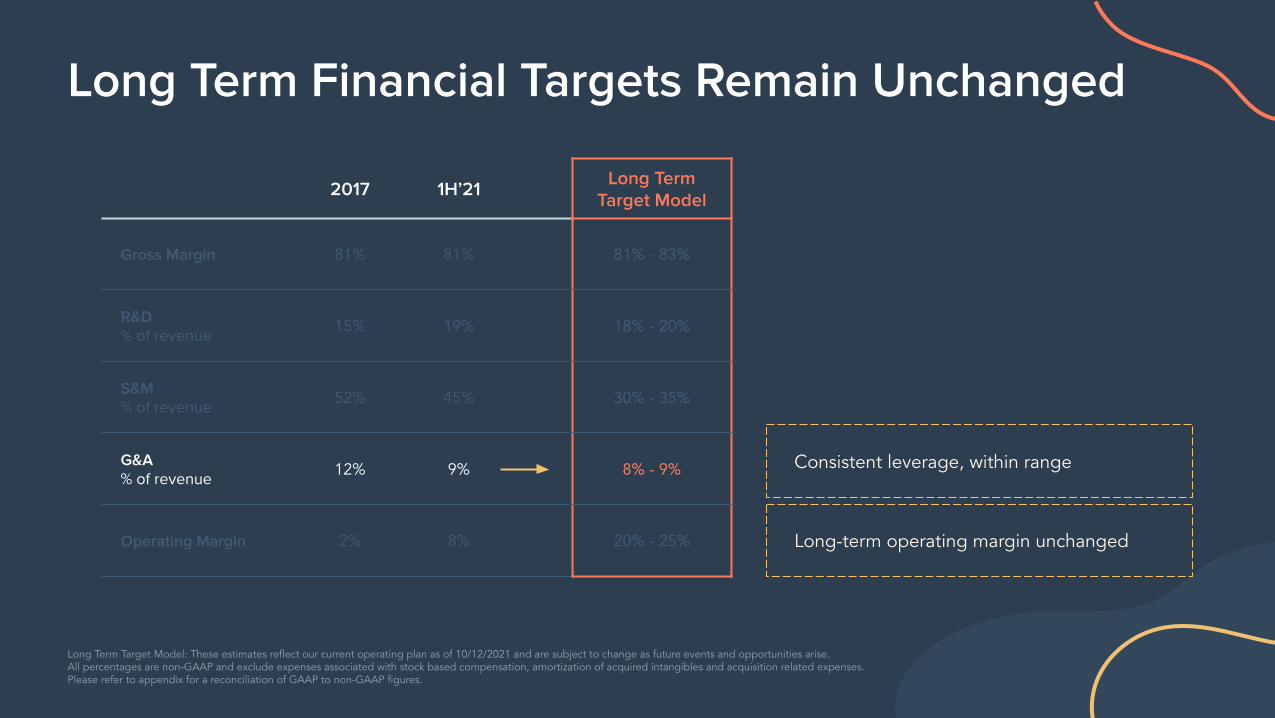
Long Term Financial Targets Remain Unchanged
Long Term Target Model: These estimates reflect our current operating plan as of 10/12/2021 and are subject to change as future events and opportunities arise.All percentages are non-GAAP and exclude expenses associated with stock based compensation, amortization of acquired intangibles and acquisition related expenses. Please refer to appendix for a reconciliation of GAAP to non-GAAP figures.
2017 1H’21 Long Term Target Model
Gross Margin 81% 81% 81% - 83%
R&D% of revenue
15% 19% 18% - 20%
S&M% of revenue
52% 45% 30% - 35%
G&A% of revenue
12% 9% 8% - 9%
Operating Margin 2% 8% 20% - 25%
Continue to invest aggressively in product development
Long-term operating margin unchanged
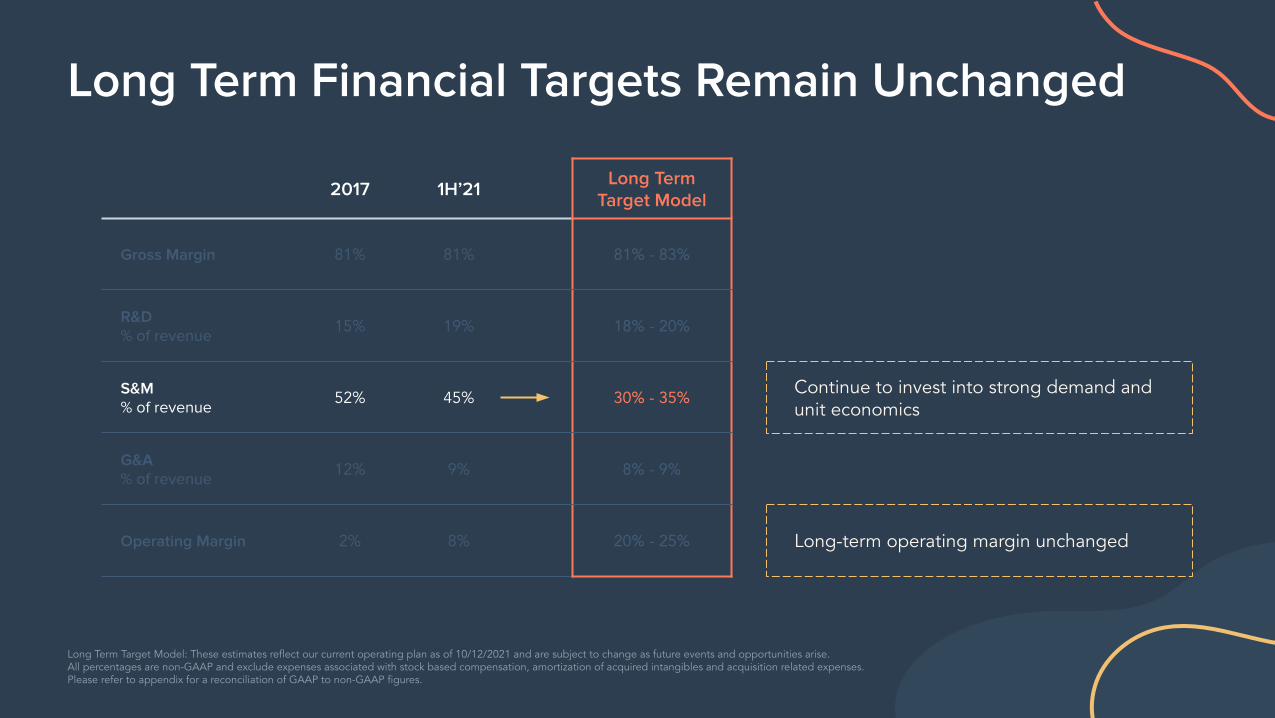
Long Term Financial Targets Remain Unchanged
Long Term Target Model: These estimates reflect our current operating plan as of 10/12/2021 and are subject to change as future events and opportunities arise.All percentages are non-GAAP and exclude expenses associated with stock based compensation, amortization of acquired intangibles and acquisition related expenses. Please refer to appendix for a reconciliation of GAAP to non-GAAP figures.
2017 1H’21 Long Term Target Model
Gross Margin 81% 81% 81% - 83%
R&D% of revenue
15% 19% 18% - 20%
S&M% of revenue
52% 45% 30% - 35%
G&A% of revenue
12% 9% 8% - 9%
Operating Margin 2% 8% 20% - 25%
Continue to invest into strong demand and unit economics
Long-term operating margin unchanged
Long Term Financial Targets Remain Unchanged
Long Term Target Model: These estimates reflect our current operating plan as of 10/12/2021 and are subject to change as future events and opportunities arise.All percentages are non-GAAP and exclude expenses associated with stock based compensation, amortization of acquired intangibles and acquisition related expenses. Please refer to appendix for a reconciliation of GAAP to non-GAAP figures.
2017 1H’21 Long Term Target Model
Gross Margin 81% 81% 81% - 83%
R&D% of revenue
15% 19% 18% - 20%
S&M% of revenue
52% 45% 30% - 35%
G&A% of revenue
12% 9% 8% - 9%
Operating Margin 2% 8% 20% - 25%
Consistent leverage, within range
Long-term operating margin unchanged
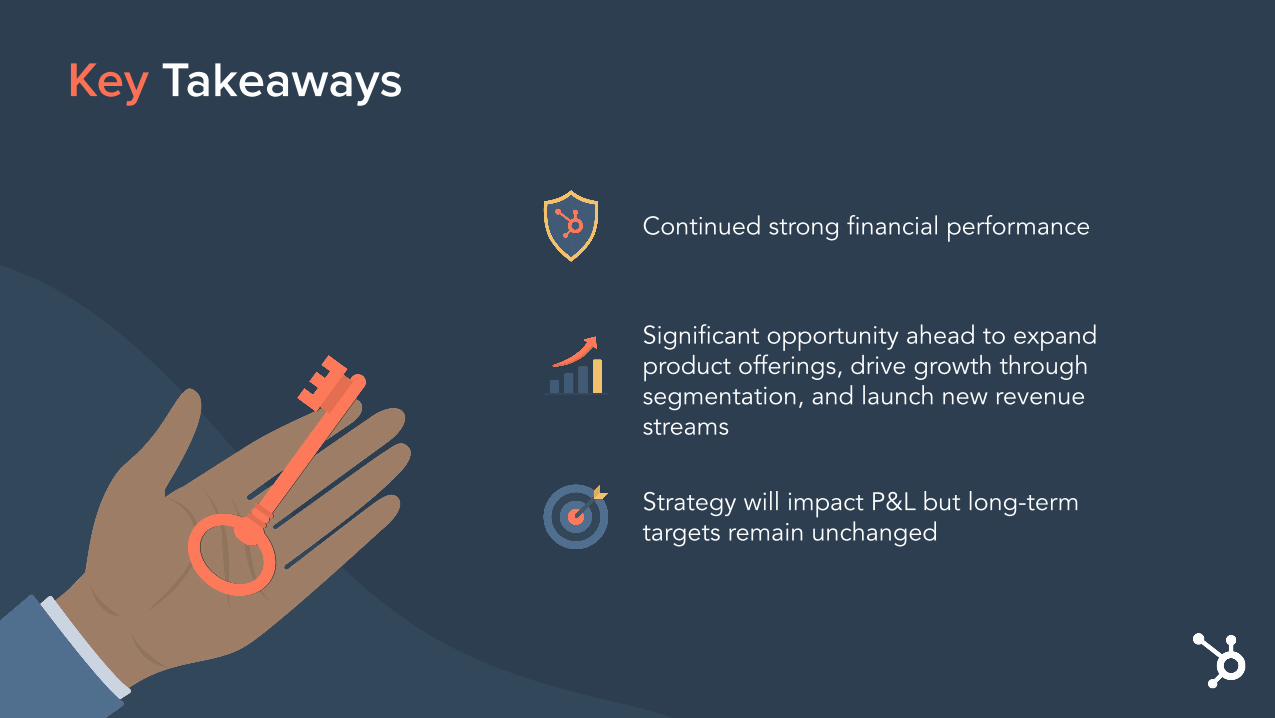
Strategy will impact P&L but long-term targets remain unchanged
Significant opportunity ahead to expand product offerings, drive growth through segmentation, and launch new revenue streams
Continued strong financial performance
Key Takeaways

Thank you

Appendix

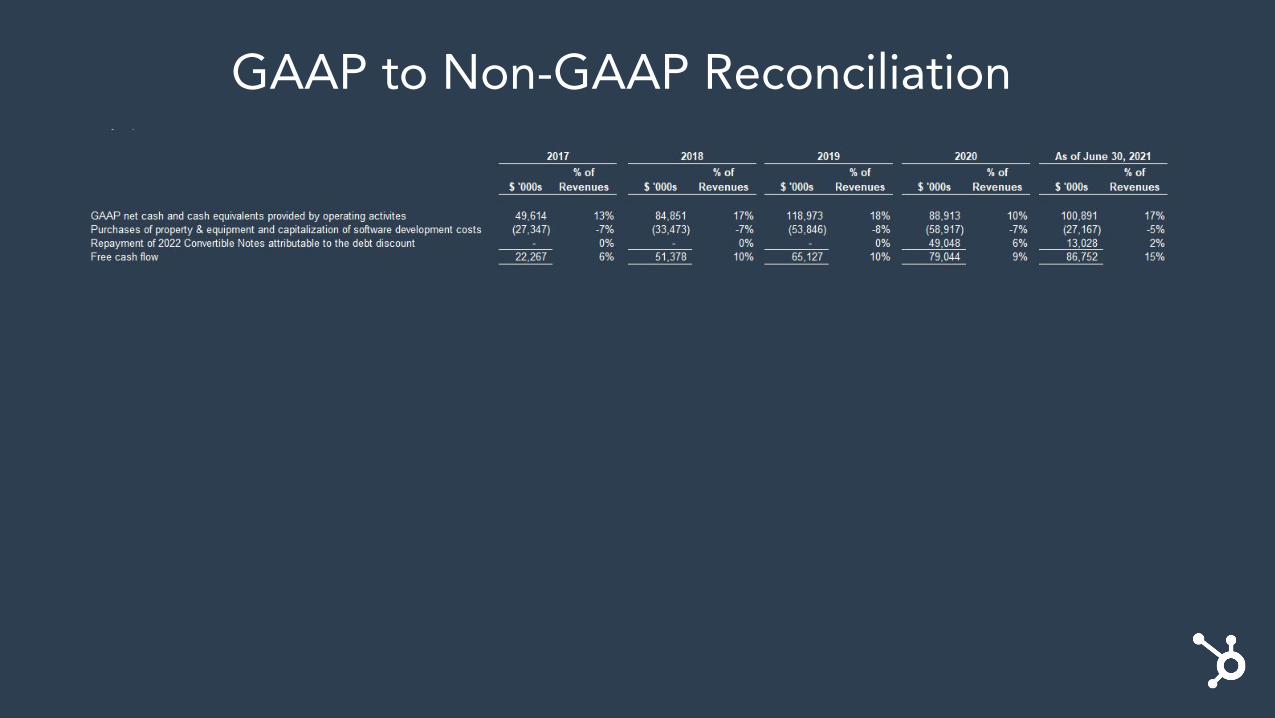
GAAP to Non-GAAP Reconciliation
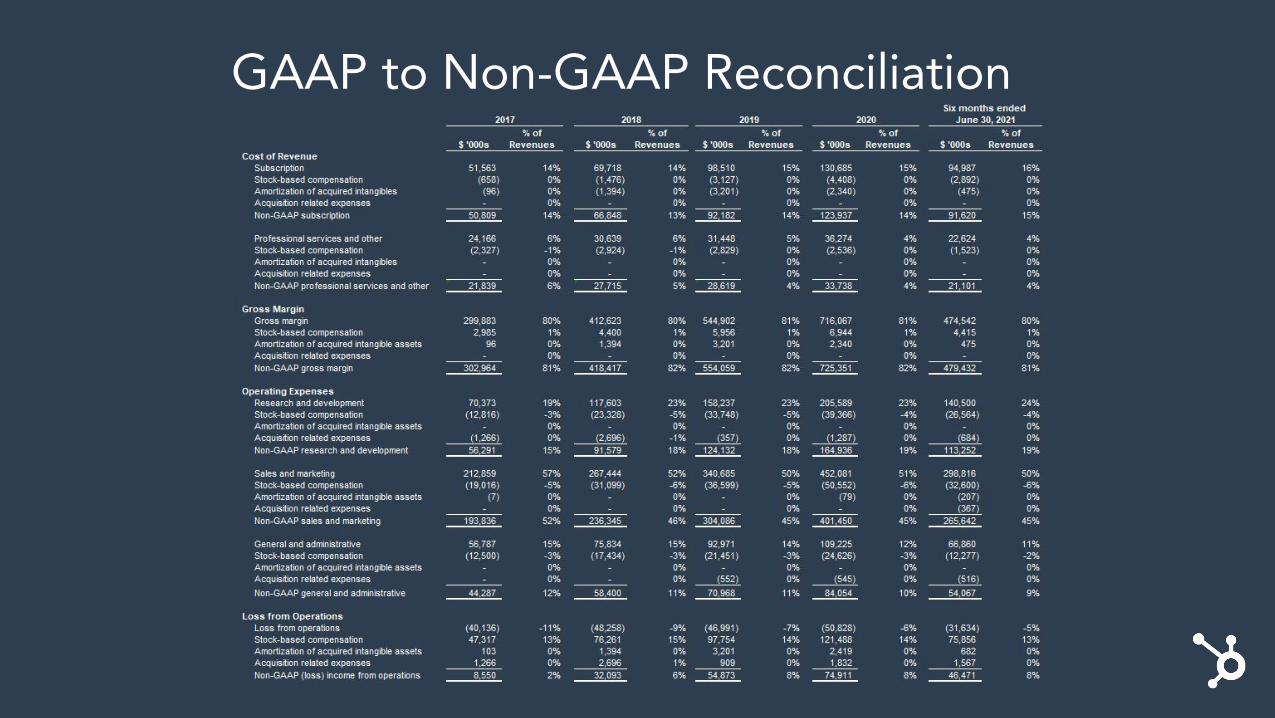
GAAP to Non-GAAP Reconciliation
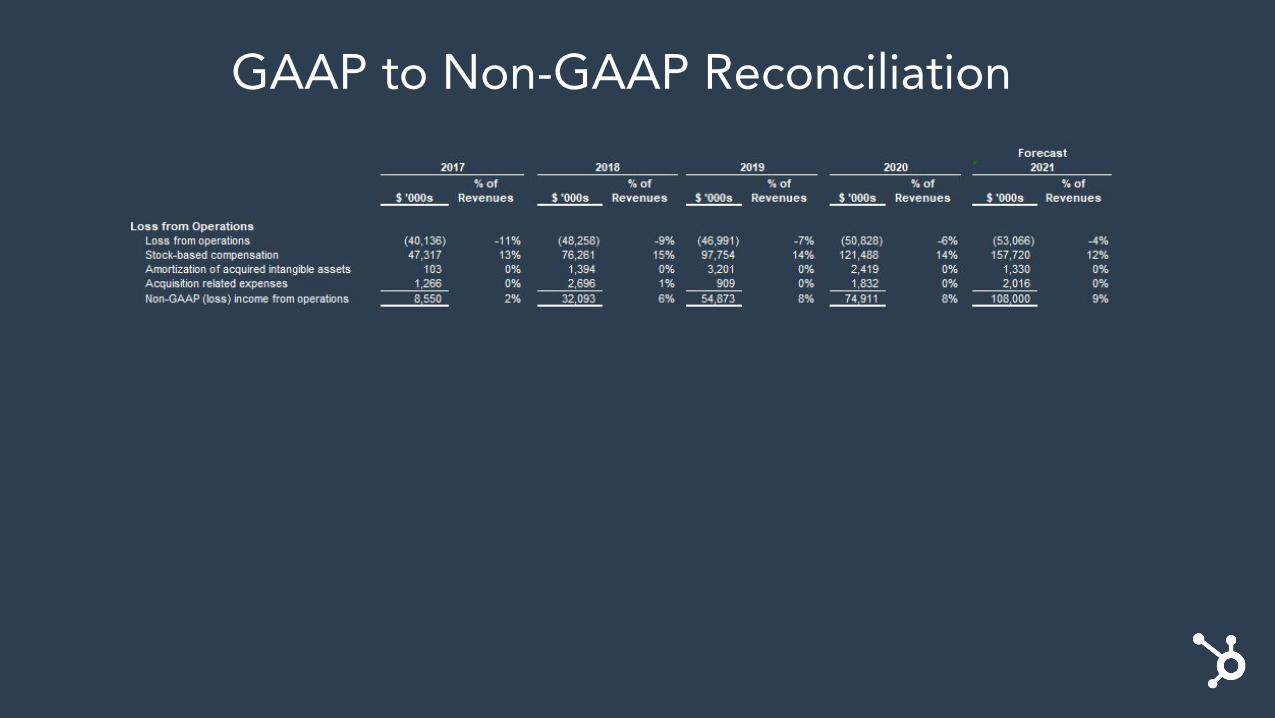
GAAP to Non-GAAP Reconciliation
GAAP to Non-GAAP Reconciliation
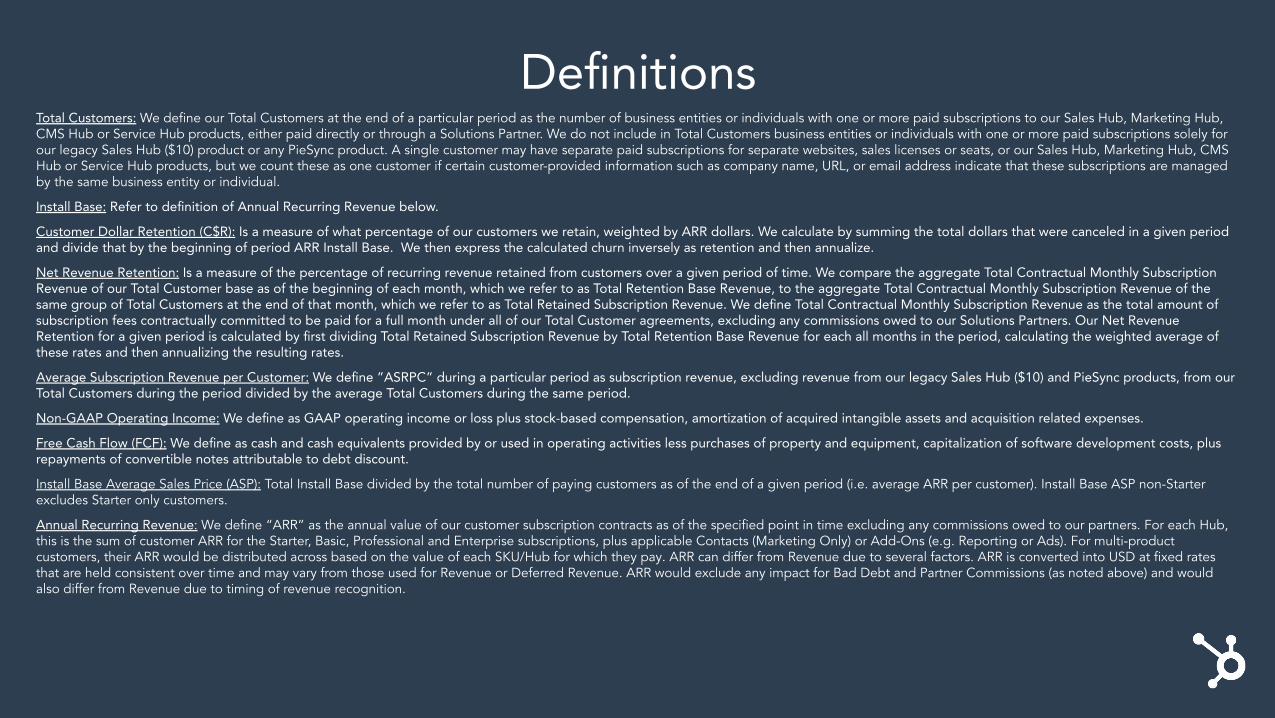
DefinitionsTotal Customers: We define our Total Customers at the end of a particular period as the number of business entities or individuals with one or more paid subscriptions to our Sales Hub, Marketing Hub, CMS Hub or Service Hub products, either paid directly or through a Solutions Partner. We do not include in Total Customers business entities or individuals with one or more paid subscriptions solely for our legacy Sales Hub ($10) product or any PieSync product. A single customer may have separate paid subscriptions for separate websites, sales licenses or seats, or our Sales Hub, Marketing Hub, CMS Hub or Service Hub products, but we count these as one customer if certain customer-provided information such as company name, URL, or email address indicate that these subscriptions are managed by the same business entity or individual.
Install Base: Refer to definition of Annual Recurring Revenue below.
Customer Dollar Retention (C$R): Is a measure of what percentage of our customers we retain, weighted by ARR dollars. We calculate by summing the total dollars that were canceled in a given period and divide that by the beginning of period ARR Install Base. We then express the calculated churn inversely as retention and then annualize.
Net Revenue Retention: Is a measure of the percentage of recurring revenue retained from customers over a given period of time. We compare the aggregate Total Contractual Monthly Subscription Revenue of our Total Customer base as of the beginning of each month, which we refer to as Total Retention Base Revenue, to the aggregate Total Contractual Monthly Subscription Revenue of the same group of Total Customers at the end of that month, which we refer to as Total Retained Subscription Revenue. We define Total Contractual Monthly Subscription Revenue as the total amount of subscription fees contractually committed to be paid for a full month under all of our Total Customer agreements, excluding any commissions owed to our Solutions Partners. Our Net Revenue Retention for a given period is calculated by first dividing Total Retained Subscription Revenue by Total Retention Base Revenue for each all months in the period, calculating the weighted average of these rates and then annualizing the resulting rates.
Average Subscription Revenue per Customer: We define ”ASRPC” during a particular period as subscription revenue, excluding revenue from our legacy Sales Hub ($10) and PieSync products, from our Total Customers during the period divided by the average Total Customers during the same period.
Non-GAAP Operating Income: We define as GAAP operating income or loss plus stock-based compensation, amortization of acquired intangible assets and acquisition related expenses.
Free Cash Flow (FCF): We define as cash and cash equivalents provided by or used in operating activities less purchases of property and equipment, capitalization of software development costs, plus repayments of convertible notes attributable to debt discount.
Install Base Average Sales Price (ASP): Total Install Base divided by the total number of paying customers as of the end of a given period (i.e. average ARR per customer). Install Base ASP non-Starter excludes Starter only customers.
Annual Recurring Revenue: We define “ARR” as the annual value of our customer subscription contracts as of the specified point in time excluding any commissions owed to our partners. For each Hub, this is the sum of customer ARR for the Starter, Basic, Professional and Enterprise subscriptions, plus applicable Contacts (Marketing Only) or Add-Ons (e.g. Reporting or Ads). For multi-product customers, their ARR would be distributed across based on the value of each SKU/Hub for which they pay. ARR can differ from Revenue due to several factors. ARR is converted into USD at fixed rates that are held consistent over time and may vary from those used for Revenue or Deferred Revenue. ARR would exclude any impact for Bad Debt and Partner Commissions (as noted above) and would also differ from Revenue due to timing of revenue recognition.
*Calculated using both internal and externally-provided data points.