Step-Change Productivity - Analyst & Journalist Briefing 2014
Upload
tele2Category
view
5.657download
1
TELE2 UPDATE
December 9, 2016

Agenda
Registration and lunchIntroduction Allison KirkbySweden Samuel Skott, Francois Mairey Q&ABreakBaltics Guillaume van Gaver, Petras Masiulis, Ervins Kampans IoT Rami Avidan, Ingrid WistrandClosing Allison Kirkby, Lars NordmarkQ&AMingle

Today’s presenters
Guillaume van GaverEVP International
Allison Kirkby President & CEO
Samuel SkottCEO Sweden
Lars NordmarkGroup CFO
Ingrid WistrandManaging Director
Tele2 IoT
Ervins KampansCTIO Estonia
Francois MaireyCTIO Shared
Operations
Rami AvidanManaging Director
Tele2 IoT
Petras MasiulisCEO Lithuania &
Head of the Baltics
Francois Mairey CTIO Shared Operations

This is Tele2
Fearless BrandsAward winning campaigns
Baltic Sea StrengthROCE >25%
Connectivity InnovatorTop 20 MNO in Global IoT
Mobility First
High Growth Investment Markets
World’s first 4G only MNO
The Tele2 WayBest in Class Employee Engagement

The Tele2 Way
We are challengers, fast-movers and will always offer our customers what they need for less
We will be champions of customer value in everything we do
How we win
Focused Technology
Choices
Value Champion
Step-Change Productivity
Winning People & Culture
Vision
Mission
Where we play
Mobile access
Our current footprint
Residential and Business
IoT
Responsible Challenger
Tele2’s Way2Win
5

Our goals
Happiest Customers
Profitable Growth
Engaged Employees
Return to 20% ROCE Engagement Index ~85%
NPS above 50%
6

We are more mobile than ever before
7 Sources: Tefficient, 2016, GSMA 2016, Ericsson, 2016
2GB18GB
44%60%
3.2Bn5.8Bn
2015
Average dataConsumption/
Smartphone(w. Europe)
Global mobileinternet
Penetration
Number ofsmartphones
Globally
2015
2015
2020
2020
2020

Mobile connections continue to grow
8 Source: GSMA 2016, World Bank 2016
2011 2012 2013 2014 2015 2016 2017 2018 2019 2020
114%penetration
103%penetration

…as we connect more of the things we love
9

Kazakhstan (LFL) +20%
Sweden +2%
Netherlands +15%
Croatia +3%
Baltics +7%
Market year-on-year development
10 Note: LFL – Like for like, defined as constant currencies and pro forma for Altel
Mobile end-user service revenue, Q3 2016

Where we focus
11 Note: *Cash flow - defined as EBITDA - Capex
Country Focus Cash Flow*Market
Sweden Data monetization Strong
Baltics Data monetization Strong
Established
Kazakhstan IntegrationFunded by JV
partner
Netherlands Customer growth Negative
Investment
Today’s focus

12
IOTIoTBalticsSweden

SWEDEN
Samuel Skott, CEO Tele2 Sweden
Francois Mairey, CTIO Shared Operations
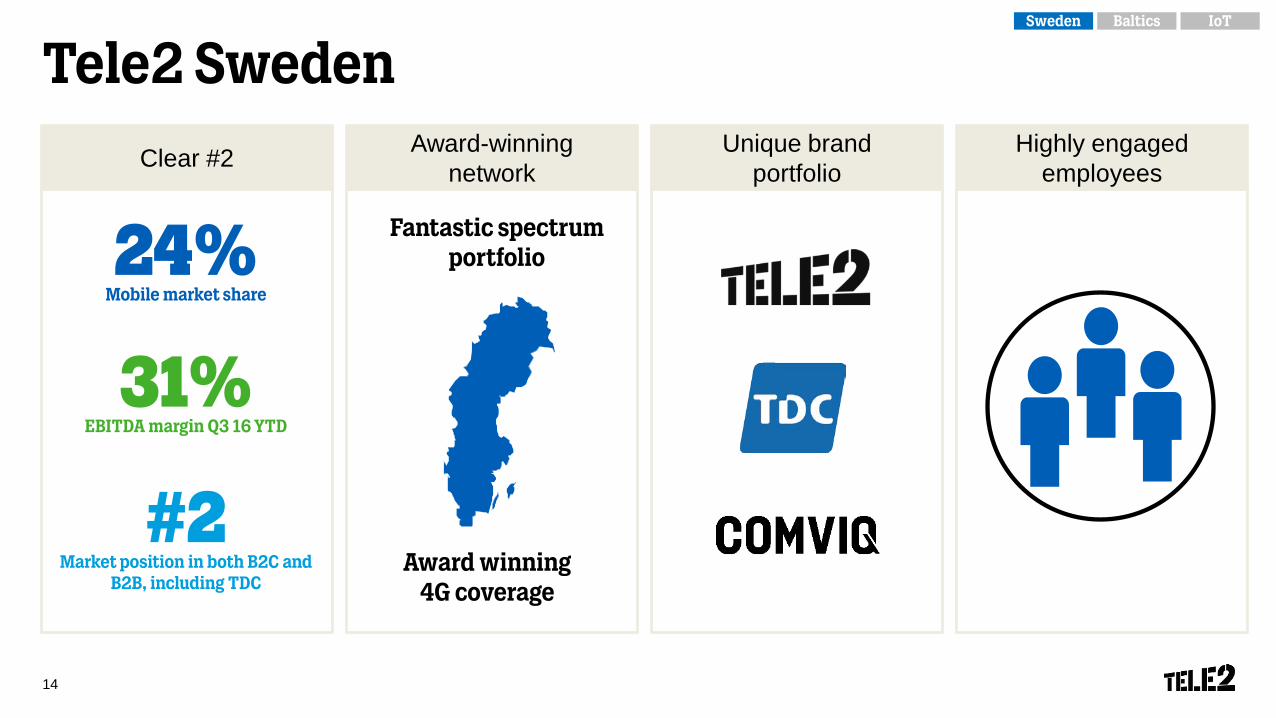
Tele2 Sweden
14
Clear #2 Award-winning network
Unique brand portfolio
Highly engaged employees
Award winning 4G coverage
Fantastic spectrum portfolio24%
Mobile market share
31%EBITDA margin Q3 16 YTD
#2 Market position in both B2C and
B2B, including TDC
IoTBalticsSweden
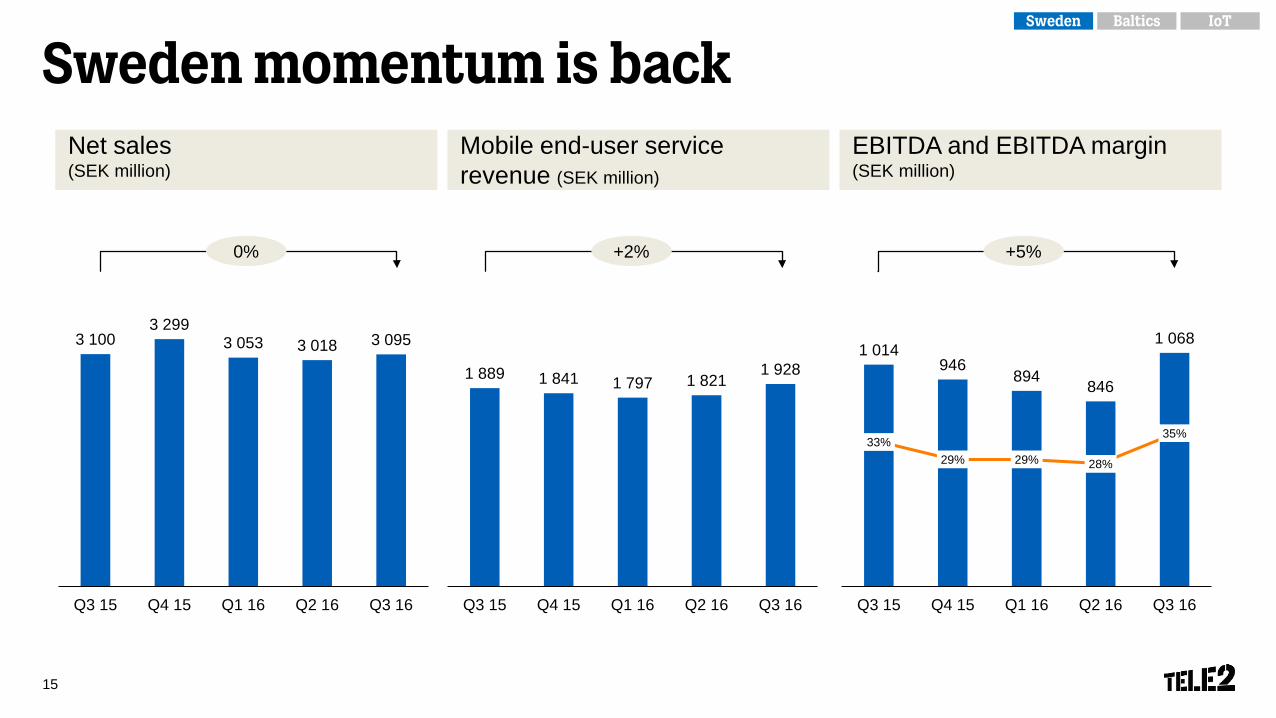
Sweden momentum is back
15
Net sales(SEK million)
Mobile end-user servicerevenue (SEK million)
EBITDA and EBITDA margin (SEK million)
1 889 1 841 1 797 1 8211 928
Q3 15 Q4 15 Q1 16 Q2 16 Q3 160
500
1 000
1 500
2 000
2 500
3 1003 299
3 053 3 018 3 095
Q3 15 Q4 15 Q1 16 Q2 16 Q3 160
500
1 000
1 500
2 000
2 500
3 000
3 500
0% +2% +5%
1 014946
894 846
1 068
33%29% 29% 28%
35%
0%
10%
20%
30%
40%
50%
60%
Q3 15 Q4 15 Q1 16 Q2 16 Q3 160
200
400
600
800
1 000
1 200
IoTBalticsSweden

Q3 15 Q3 16
Sweden – Improving trends
16
Consumer postpaid mobile end-user service revenue
Share of sales with bundle >0.5GB
Geographic coverage2G/4G
73%
84% 85%
Q1 16 Q2 16 Q3 16
83%
88%
Q3 15 Q3 16
+7%
IoTBalticsSweden

Data usage continues to grow, driven by 4G
17
Data consumption Average data consumption per user
Network coverage 4G+ activated
Geographicalcoverage
Population coverage
3.2 GB
4.4 GBQ3 2016
Q3 2015
100 mbit/s
340 Mbit/s
4G+
4G
3G 4G
Q1 2015 Q3 2016
+97%
IoTBalticsSweden
88%
99.9%

Q4 13 Q1 14 Q2 14 Q3 14 Q4 14 Q1 15 Q2 15 Q3 15 Q4 15 Q1 16 Q2 16
Tele2 Telia Telenor Tre
Becoming customer champions
18 Source: (1) Millward Brown Brand-tracking study; (2) Svenskt Kvalitetsindex
2012 2013 2014 2015 2016
Tele2 Consumer Industry Consumer
Delighted customers (%), rolling average (4 quarters)
Customer satisfactionSKI development 2012-2016
IoTBalticsSweden

Key focus areas
19
How we win
FocusedTechnology
Choices
ValueChampion
Step-changeProductivity
WinningPeople &Culture
Dual Brand Strategy World Class Network Challenger Program High Engagement
IoTBalticsSweden

Value champion20

Combination accelerates Tele2’s B2B strategy
21
+
IoTBalticsSweden

4
13
Tele2 Combined
18 20
Tele2 Combined
TDC significantly strengthens our B2B position…
22
Mobile Fixed telephony
Fixed broadband
11
18
Tele2 Combined
Unified Communications
Direct
SME
Networking
Tele2 TDC
B2B market shares, % (2015) Common business areas
IoTBalticsSweden
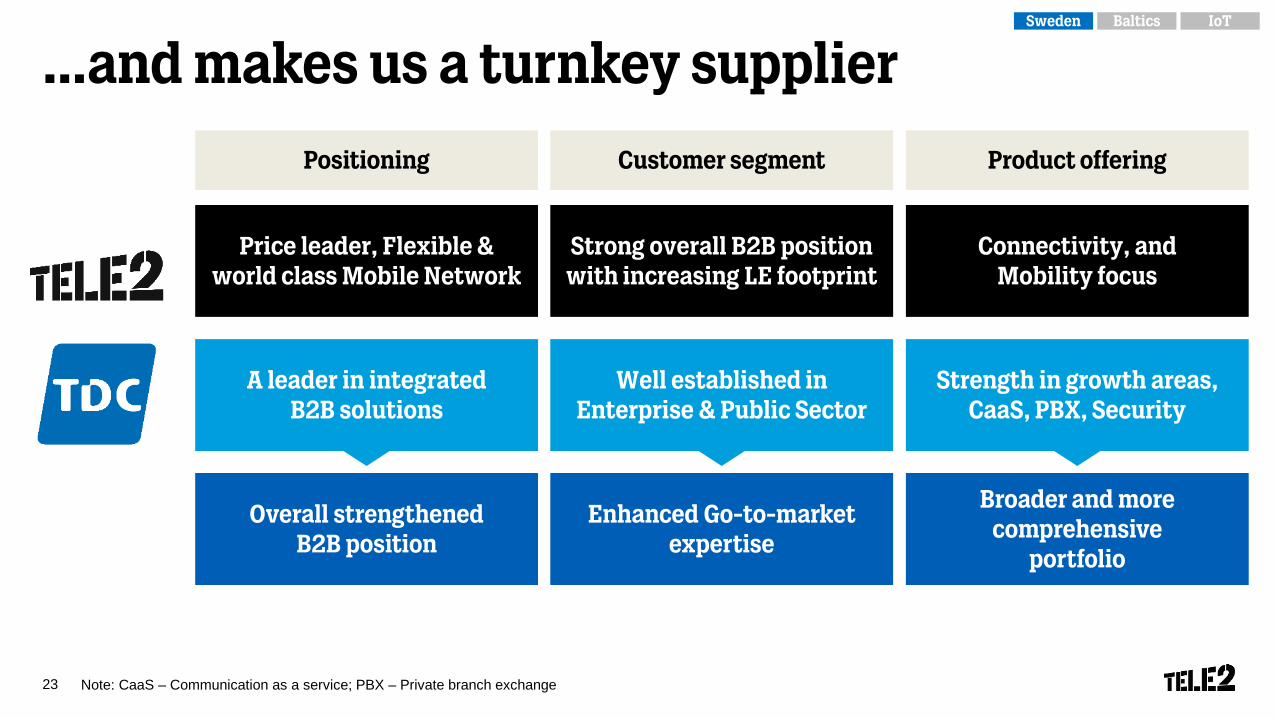
…and makes us a turnkey supplier
23 Note: CaaS – Communication as a service; PBX – Private branch exchange
Enhanced Go-to-market expertise
Overall strengthenedB2B position
Broader and more comprehensive
portfolio
Product offeringCustomer segmentPositioning
Price leader, Flexible & world class Mobile Network
Strength in growth areas, CaaS, PBX, Security
Well established in Enterprise & Public Sector
A leader in integrated B2B solutions
Connectivity, and Mobility focus
Strong overall B2B position with increasing LE footprint
IoTBalticsSweden

While unlocking significant synergies
24
OPEX synergies
Integration costs
CAPEX synergies
MVNO migration Consolidation of network and migration of IT systems Reduction of SG&A costs
Optimized infrastructure investments Consolidate IT systems and retire legacy
Network, IT systems and billing integration SG&A restructuring
OPEX/CAPEX ~SEK 300m run-rate Starting year 1 Fully achieved in year 4
CAPEX ~SEK 200m one-off Majority during first 2 years
~SEK 750m Majority during first 2 years
IoTBalticsSweden
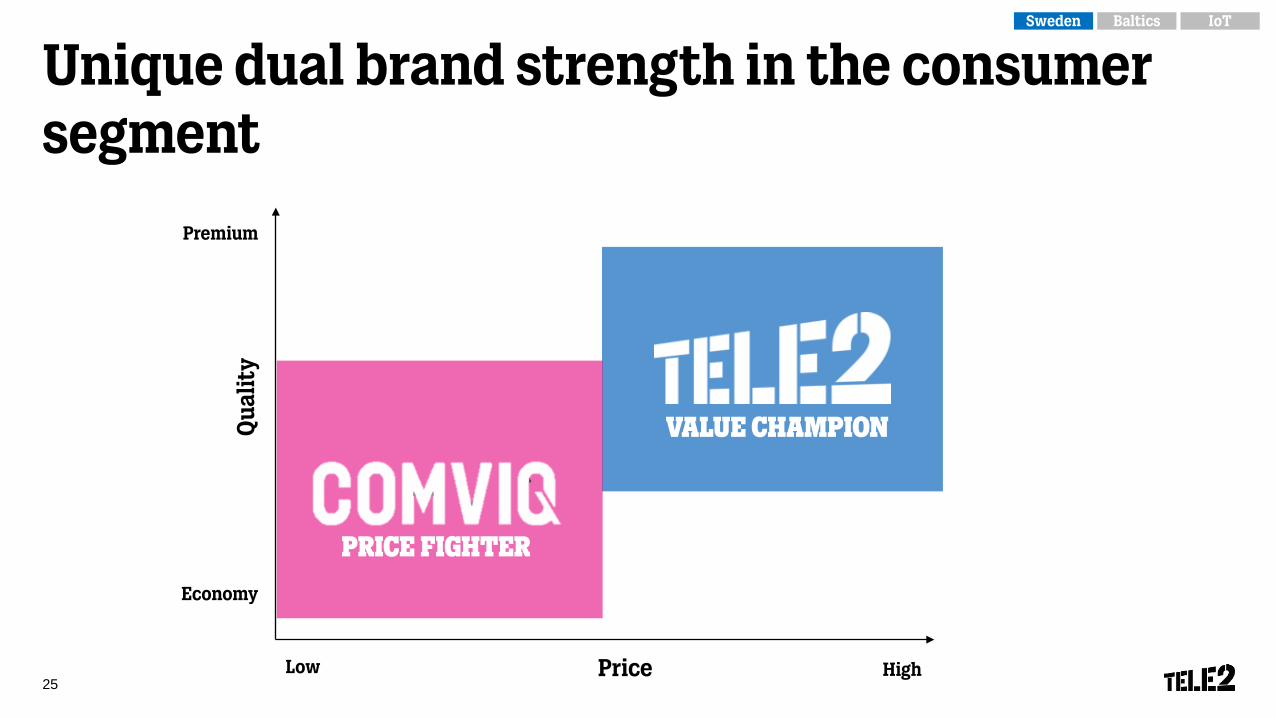
Unique dual brand strength in the consumer segment
25Price
Qua
lity
High
Premium
Economy
Low
price fighter
Value champion
price fighterprice fighter
25
IoTBalticsSweden
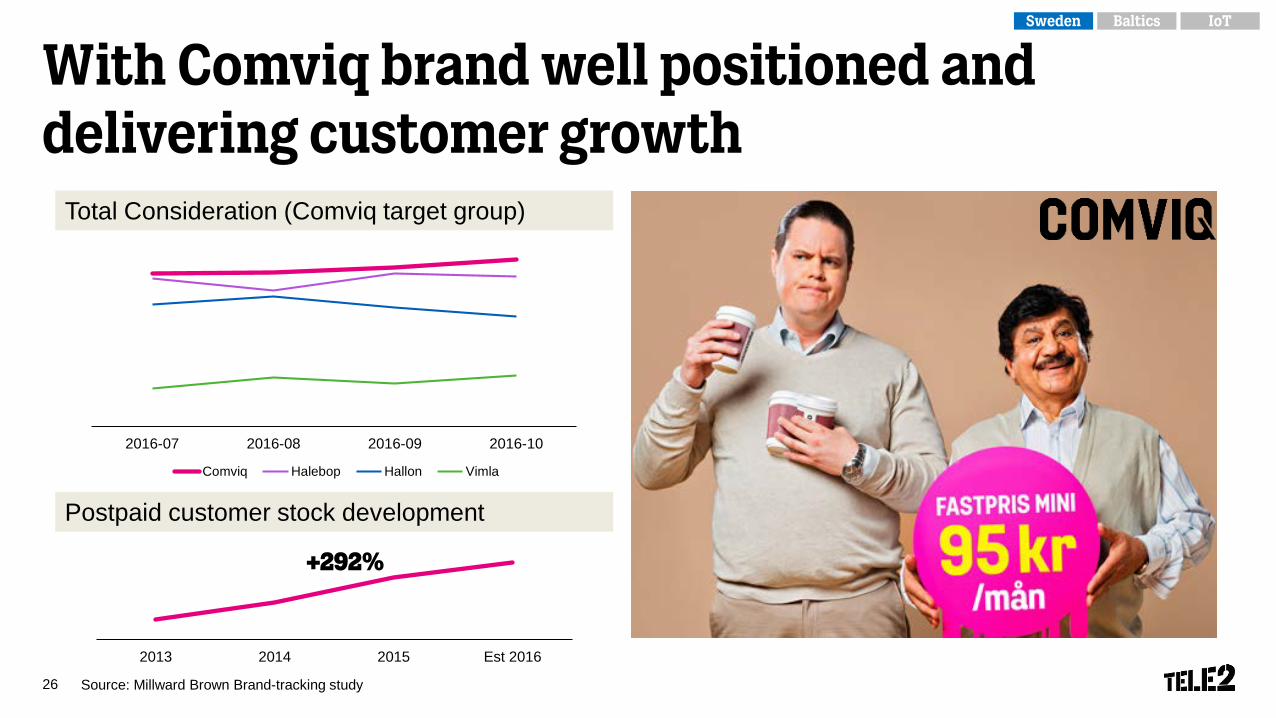
With Comviq brand well positioned and delivering customer growth
26 Source: Millward Brown Brand-tracking study
Total Consideration (Comviq target group)
Postpaid customer stock development
2016-07 2016-08 2016-09 2016-10
Comviq Halebop Hallon Vimla
2013 2014 2015 Est 2016
+292%
IoTBalticsSweden
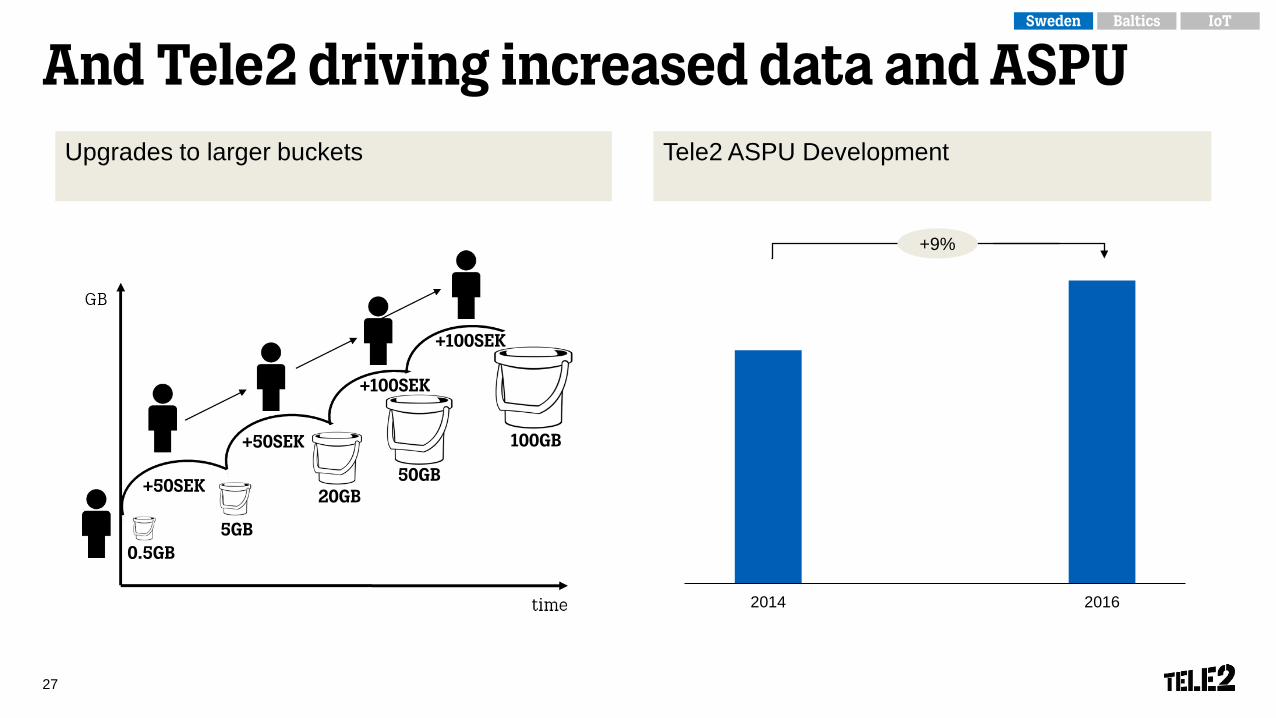
And Tele2 driving increased data and ASPU
27
2014 2016
+50SEK
+50SEK
+100SEK
+100SEK
0.5GB5GB
20GB50GB
100GB
Upgrades to larger buckets Tele2 ASPU Development
+9%
IoTBalticsSweden
Connectivity is expanding into more devices and aspects of life
28
IoTBalticsSweden

Tele2 taking the lead as it moves towards a unique position
29
The natural leader and enthusiast of connectivity
1 No binding periods
2 Most data for the buck
3 Connectivity for you and all your things made simple
IoTBalticsSweden

BE CONTENTWITH MORE!
30
THE FIRST CAMPAIGN ON THE TELE2 JOURNEY

ENTER THE MIND OF A STRANGER.YOUR OWN ISN’T BIG ENOUGH.
31
32
JoelKinnaman
when Swedenisn’t big enough.

33
cristinastenbeck
whenowning companies
isn’t enough.

Focused technology choices34

We have a world class network
35
NO CA 2CC 3CC 4CC 5CC
4G+ activated on ~1 500 sites
4G along railroads and in subway Vast 4G coverage
June, 2016: 4G+ (Carrier Aggregation) activated
July, 2016: LTE 900 MHz activated on 160 sites along
the railroads
Geographical coverage Population coverage
September, 2016: Towards higher speeds with 3CC CA activated
Indoor 4G coverage will reach 100% in 2017
IoTBalticsSweden
88%
99.9%

And a fantastic spectrum portfolio
36
Net4Mobility
SUNAB
3GIS
Own networks
Telia 2G/4G and 3G900; ”3” 4G and 3G900
10 MHz
20 MHz
35 MHz
40MHz
10 MHz
5 MHz 10 MHz
10 MHz
35 MHz
20 MHz
900 MHz
1 800 MHz
2 600 MHz
2 100 MHz 20 MHz
10 MHz
40 MHz
800 MHz
900 MHz
1 800 MHz
2 600 MHz
2 100 MHz
IoTBalticsSweden

We are well positioned for the shift to 5G
37Note: CoMP - Coordinated Multi Point function, NFV - Network Function Virtualization, SDN - Software Defined Network, TTI - Transmit Time Interval
CoMP and LTE peak rates >600 Mbps
Full cloudification NFV/SDN – Own
orchestration
VoLTEand
LTE Roaming
Ultra Low latency with reduced TTI
Video over LTE
5G
LTE peak rates >800 Mbps with 5CC
Carrier Aggregation
2020Now2017 2018 2019
IoTBalticsSweden

Step-Change productivity38
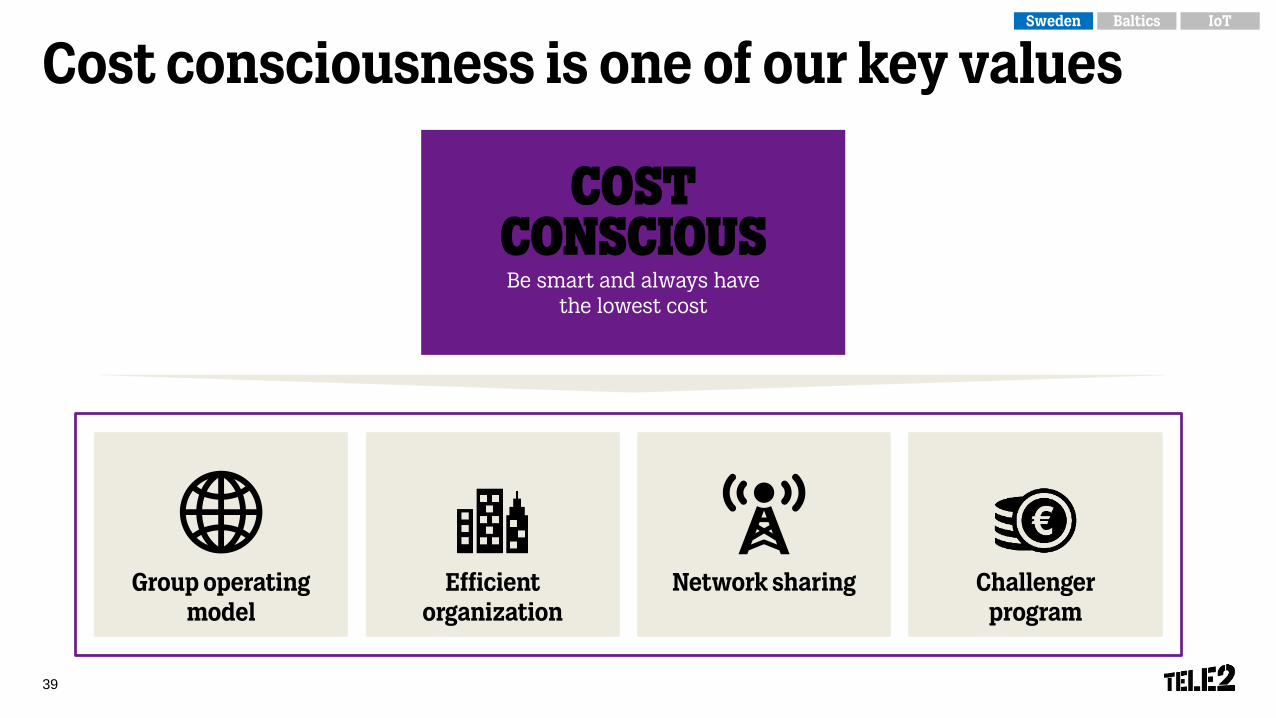
Cost consciousness is one of our key values
39
Group operating model
Efficient organization
Network sharing Challenger program
COST CONSCIOUSBe smart and always have
the lowest cost
IoTBalticsSweden
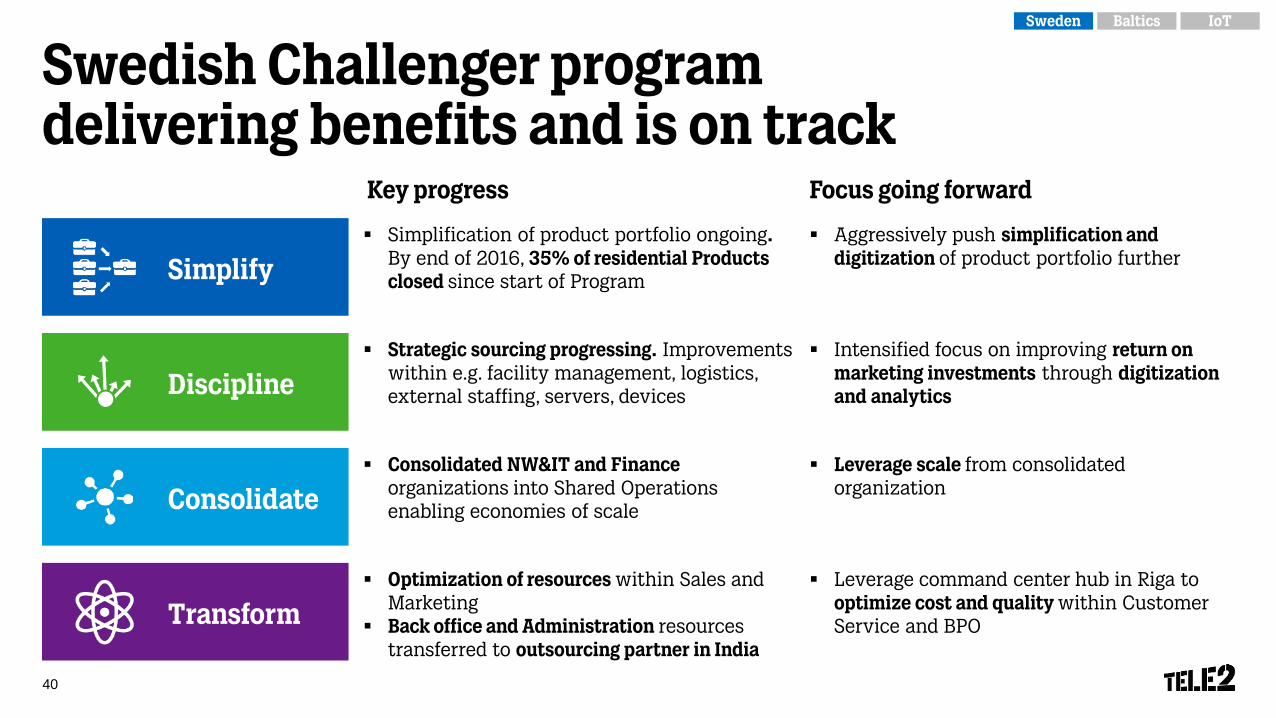
Swedish Challenger program delivering benefits and is on track
40
Simplification of product portfolio ongoing. By end of 2016, 35% of residential Products closed since start of Program
Strategic sourcing progressing. Improvements within e.g. facility management, logistics, external staffing, servers, devices
Optimization of resources within Sales and Marketing
Back office and Administration resources transferred to outsourcing partner in India
Consolidated NW&IT and Finance organizations into Shared Operations enabling economies of scale
Transform
Simplify
Consolidate
Discipline
Aggressively push simplification and digitization of product portfolio further
Intensified focus on improving return on marketing investments through digitization and analytics
Leverage command center hub in Riga to optimize cost and quality within Customer Service and BPO
Leverage scale from consolidated organization
Key progress Focus going forward
IoTBalticsSweden

Winning People & Culture
41
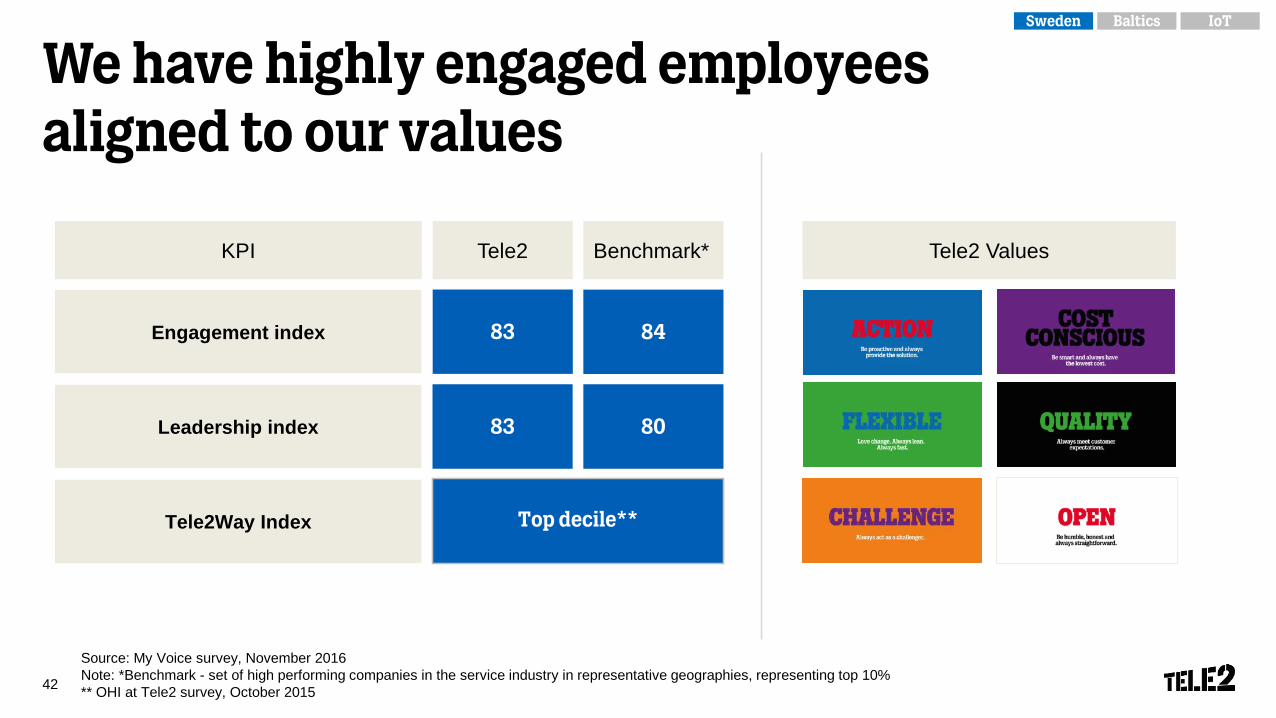
We have highly engaged employeesaligned to our values
42
Source: My Voice survey, November 2016Note: *Benchmark - set of high performing companies in the service industry in representative geographies, representing top 10%** OHI at Tele2 survey, October 2015
Engagement index
Leadership index
Tele2Way Index
KPI Tele2
83
83
Benchmark*
84
Top decile**
80
Tele2 Values
IoTBalticsSweden

We have a foundation set for growth
43
Clear #2 Award-winning network
Unique brand portfolio
Highly engaged employees
Award winning 4G coverage
Fantastic spectrum portfolio24%
Mobile market share
31%EBITDA margin Q3 16 YTD
#2 Market position in both B2C and
B2B, including TDC
IoTBalticsSweden
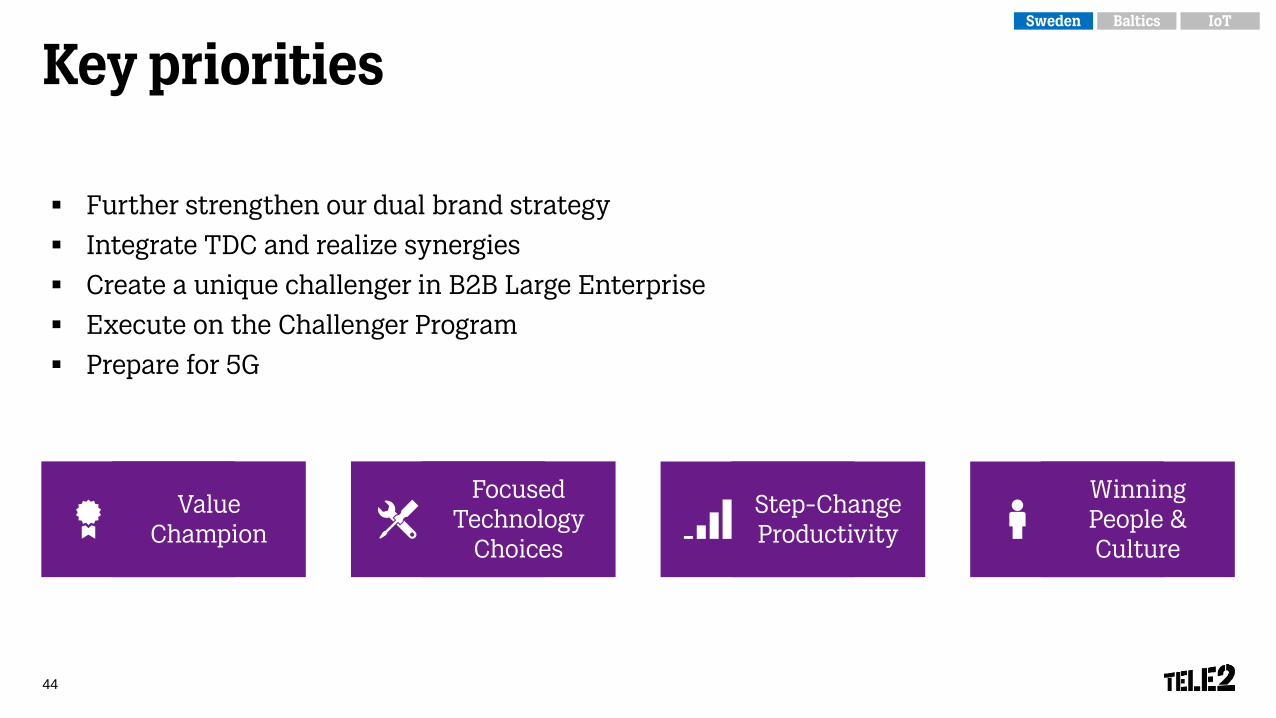
Further strengthen our dual brand strategy
Integrate TDC and realize synergies
Create a unique challenger in B2B Large Enterprise
Execute on the Challenger Program
Prepare for 5G
Key priorities
44
Winning People & Culture
Value Champion
Step-Change Productivity
Focused Technology
Choices
IoTBalticsSweden

Q&A

BREAK

Agenda
Registration and lunchIntroduction Allison KirkbySweden Samuel Skott, Francois Mairey Q&ABreakBaltics Guillaume van Gaver, Petras Masiulis, Ervins Kampans IoT Rami Avidan, Ingrid WistrandClosing Allison Kirkby, Lars NordmarkQ&AMingle

BALTICS
Guillaume van Gaver, EVP InternationalPetras Masiulis, CEO Lithuania & Head of the BalticsErvins Kampans, CTIO Estonia

Tele2 Baltics
49
Brands Market share Network
Leading position in4G availability
Strong spectrum portfolio
Lithuania #1 40%
Latvia #2 30%
Estonia #3 25%
IoTBalticsSweden

Continued strong performance
50
Net sales(SEK million)
EBITDA and EBITDA margin(SEK million)
Mobile end-user service revenue (SEK million)
488 476 468 477521
Q3 15 Q4 15 Q1 16 Q2 16 Q3 160
100
200
300
400
500
600
263 257 246 256287
32% 32% 32% 33% 32%
0%
10%
20%
30%
40%
50%
60%
Q3 15 Q4 15 Q1 16 Q2 16 Q3 160
50
100
150
200
250
300
350
832 815770 787
884
Q3 15 Q4 15 Q1 16 Q2 16 Q3 160
100
200
300
400
500
600
700
800
900
1 000
+7%+6% +9%
IoTBalticsSweden
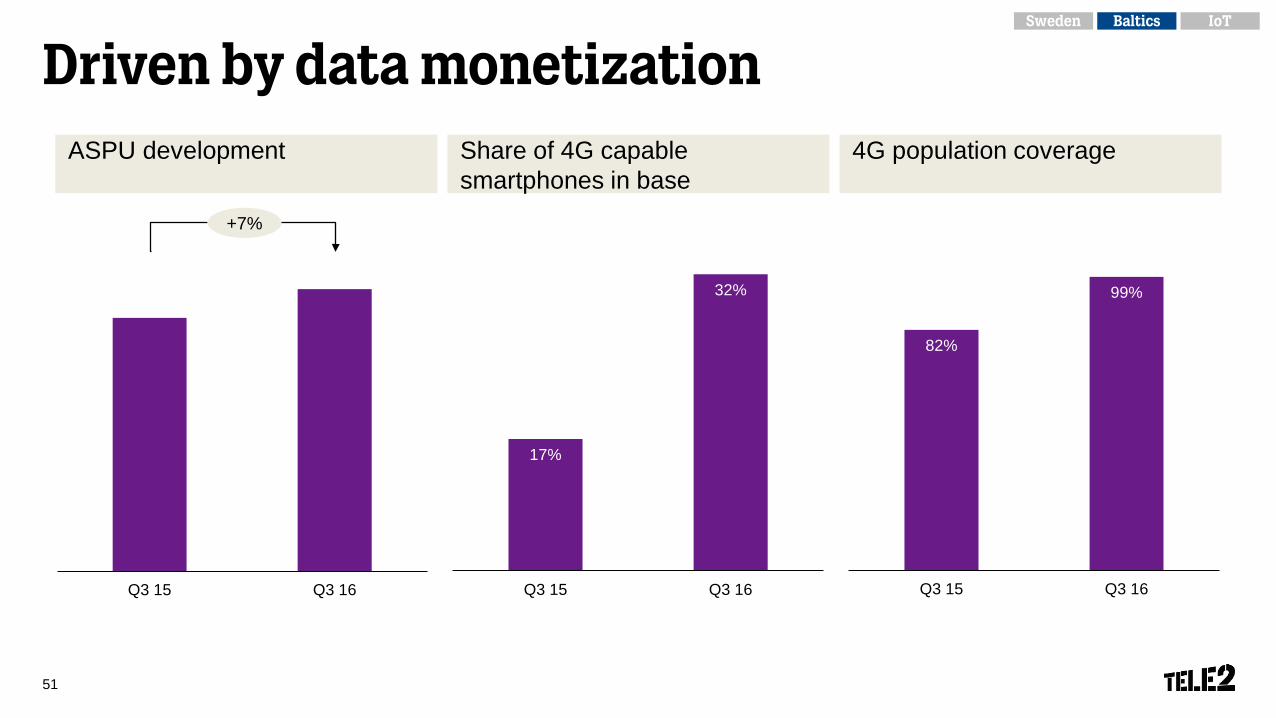
Driven by data monetization
51
ASPU development Share of 4G capable smartphones in base
4G population coverage
82%
99%
Q3 15 Q3 16Q3 15 Q3 16
17%
32%
Q3 15 Q3 16
+7%
IoTBalticsSweden

Data growth driven by transition from 3G to 4G
52
1.5 GB
2.3 GBQ3 2016
Q3 2015
43%
99% 98%
Populationcoverage
Geographiccoverage
LTE-Advanced3G 4G
2014 2016
Data consumption Average monthly data consumption per user
Network coverage
IoTBalticsSweden
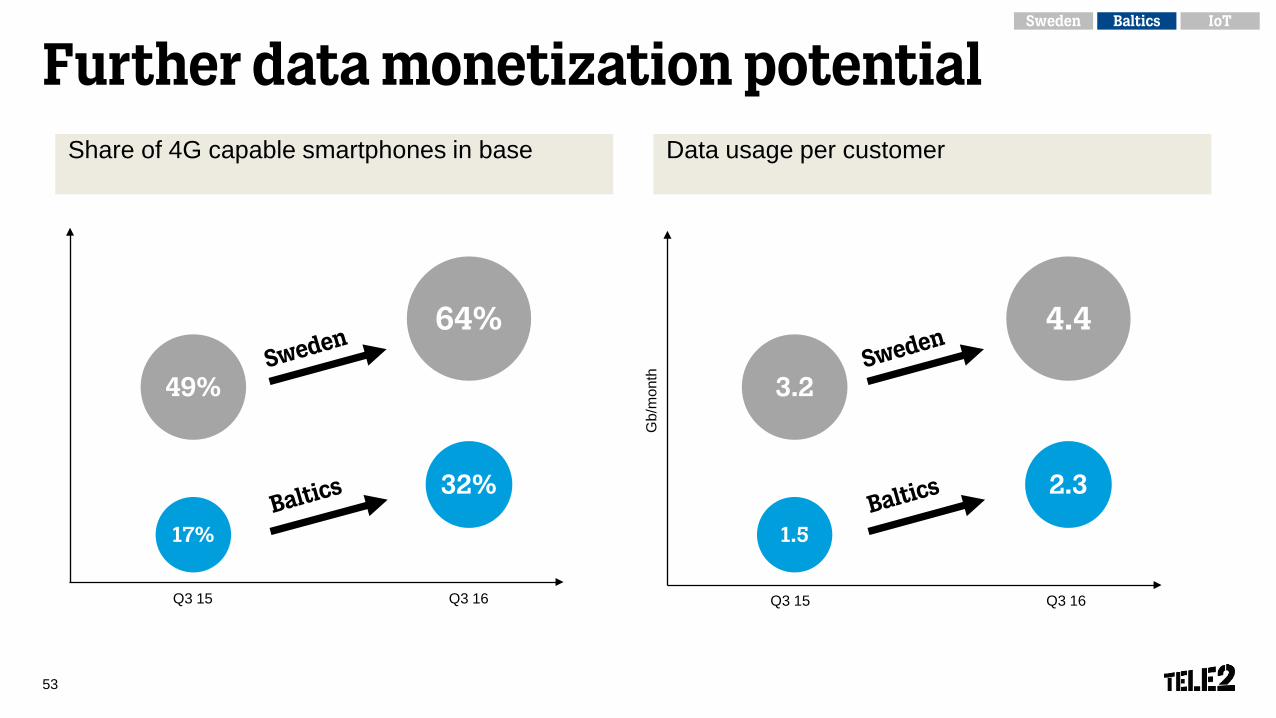
Further data monetization potential
53
Share of 4G capable smartphones in base
Q3 16Q3 15
Data usage per customer
1.5
2.3
3.2
4.4
Gb/
mon
th
Q3 16Q3 15
17%
32%
49%
64%
IoTBalticsSweden

Key focus areas
54
Price Fighter to Value Champion
High Quality Network Shared Service Center High Engagement
How we win
FocusedTechnology
Choices
ValueChampion
Step-changeProductivity
WinningPeople &Culture
IoTBalticsSweden

Value champion55

Move from Price Fighter to Value ChampionLithuania Latvia Estonia
NewOld Old OldNew New
56
IoTBalticsSweden

57 Source: Millward Brown
2014 2016
+20%
2014 2016 2014 2016
+19% +22%
Leading to improved quality perceptionNetwork coverage Voice Internet
IoTBalticsSweden

And growth in Postpaid customer base
58
Lithuania Latvia Estonia
Baltic postpaid customer growth Churn reduction(Q3 2016 vs. Q3 2015)
2013 2014 2015 Q3 16
+8%
-33% -31% -6%
IoTBalticsSweden

Q3 15 Q4 15 Q1 16 Q2 16 Q3 16
Value Champion enables growth in all segments
59
Q3 15 Q4 15 Q1 16 Q2 16 Q3 16
Mobile broadband Net sales B2B Net sales
+9%+37%
IoTBalticsSweden
Focused technology choices60

Strong frequency portfolio
61 Note: TDD - Time Division Duplex
Lithuania
Latvia
Estonia
450 MHz
4.4 MHz
800 MHz
10 MHz
10 MHz
10 MHz
900 MHz
11.6 MHz
11.7 MHz
11.4 MHz
1 800 MHz
24.6 MHz
24.8 MHz
24.8 MHz
2 100 MHz
19.8 MHz
20 MHz + 5 MHz TDD
29.8 MHz + 10 MHz TDD
2 300 MHz
60 MHzTDD
2 600 MHz
20 MHz
20 MHz
2G
3G
LTE
Successfully secured 900 MHz and 1 800 MHz licenses in Lithuania
Technology neutrality granted for 450 MHz in Estonia
IoTBalticsSweden

LTE is just at its beginning
62Note: NFV - Network Functions Virtualization; SDN - Software Defined Networks
LTE speeds up to 600 Mbps
LTE speeds up to 1 Gbps
First NFV/SDN deployments
in Baltics
Trials of 5G ”New Radio” and Core
concepts
Initial stage of network
transformation
2017
Now 2020
5G
2018 2019
LTE speeds up to 800 Mbps
2020
IoTBalticsSweden

Step-Change productivity63

Strong operational discipline
64
Baltics products move to Group product platform
50% of products closed since start of Program
Data analytics and optimized marketing spend driving improved ROI
Centralized approach to International wholesale leveraging scale and optimizing efficiency
Consolidated Baltic NW&IT and Finance organizations into Shared Operations enabling economies of scale
Transform
Simplify
Consolidate
Discipline
Aggressively push simplification and digitization of product portfolio further
Intensified focus on improving return on marketing investments through digitization and analytics
Leverage command center hub in Riga to optimize cost and quality within Customer Service and BPO
Leverage scale from consolidated organization
Key progress Focus going forward
IoTBalticsSweden

Our SSC in Riga has been a Group enabler to cost and quality transformation
65 Note: *in relation to total Group FTEs
IT
Finance
NetworkOperations
CustomerService
45%of FTEs in SSC Riga*
Consolidated IT factory, taking advantage of the scale and skill benefit of co-locating our IT personnel across the Group
During the last 12 months we have moved 20% of our finance organization from high cost markets to Riga
Consolidation of NOC supporting most of our markets
Exceptional performance in customer service contact satisfaction level in the Baltics in Q3 2016
20%of FTEs in SSC Riga*
100 FTE
85%Call center end-user satisfaction
IoTBalticsSweden

Costs kept under control despite data growth
66
2013 2014 2015 Q3 16 YTD Q1 14 Q2 14 Q3 14 Q4 14 Q1 15 Q2 15 Q3 15 Q4 15 Q1 16 Q2 16 Q3 16
3G 4G
Network costs as % of Net sales Data consumption 3G vs. 4G
-9%
5increase
X
IoTBalticsSweden

Winning People & Culture
67

We have highly engaged employees
68
Source: My Voice survey, November 2016Note: *Benchmark - set of high performing companies in the service industry in representative geographies, representing top 10%** OHI at Tele2 survey, October 2015
Engagement index
Leadership index
Tele2Way Index
KPI Tele2
89
90
Benchmark*
84
80
Valdis VancovicsCEO Latvia
Argo VirkebauCEO Estonia
Petras MasiulisCEO Lithuania & Head of the Baltics
IoTBalticsSweden
Top decile**

Key priorities
69
Winning People & Culture
Focused Technology
Choices
Step-Change Productivity
Value Champion
Data monetization to continue
Mobile broadband and B2B are growth opportunities
Execute on Challenger Program
Well positioned for 5G
IoTBalticsSweden
IOT
Rami Avidan & Ingrid Wistrand Managing Directors, Tele2 IoT

Transportation
Energy
Utilities
Infrastructure
Healthcare
Security
Agriculture
Ecology
Internet of Things is about enabling automated, informed, real-time decision making
Control Analysis Action
DATA
71
IoTBalticsSweden

IoT model differs from traditional mobile telecom services
10-15 kAverage number of connections for a customer
2-3 MBAverage monthly data usage per connection
7-8 yearsLong end-product lifecycles resulting in stable revenues
< 2 EuroARPU per connection and month,
generated through long-term subscriptionsComplex solutions involving multiple layers
Average sales cycle for an IoT opportunity
0.5-1 year
B2B2B2B2C
72
IoTBalticsSweden

2020
IoT has enormous growth potential
73
10 million IoT developers
Billions ofconnected devices
90% of all carswill be connected
Global IoT Revenue (SEK billion)
Source: Ovum, Berg Insight, Vision Mobile & Tele2 estimate
322389
463
545
632
727
2015 2016 2017 2018 2019 2020
IoTBalticsSweden

400+ operators
Devices in 160+
countries
100+experts
100+ partners
300+ customers
We have set-up a global IoT business enabling communication between devices and machines
74
IoTBalticsSweden

Tele2 IoT – one of the top 20 IoT operators globally
75 Source: “Internet of Things (IoT) Communications Service Provider Benchmarking 2016”, Machina Research
There is absolutely room in the market for a CSP taking such an approach and the contrast with other operators is noteworthy in itself; Tele2 ‘zigs’ while the CSP community ‘zags’.
IoTBalticsSweden

The Tele2 Way
Where we play
MissionTogether, we develop a smarter world through real-time information,
enabling actionable insights for businesses to excel and societies to thrive.
IoT-enabling services
We are a global player, with
initial focus on Europe
B2B(B2B2B)
(B2B2B2C)
How we win
Open,enduring and
inspiring products
Crawl, walk,run approach
Success Factory
World Class Operations
The orchestrator of a smarter world.
Vision
IoT
Tele2’s Way2Win in IoT
76
IoTBalticsSweden

The orchestrator of a smarter world.
Vision
Go to Market Orchestration
Data Orchestration
77
IoTBalticsSweden

Tele2 IoT key differentiating factors
78
Unified and Smarter Connectivity
Customer-driven Business Models
Go-To-Market & Product Partners
Quality of service
How we win
Open,enduring and
inspiring products
Crawl, walk,run approach
Success Factory
World Class Operations
IoTBalticsSweden
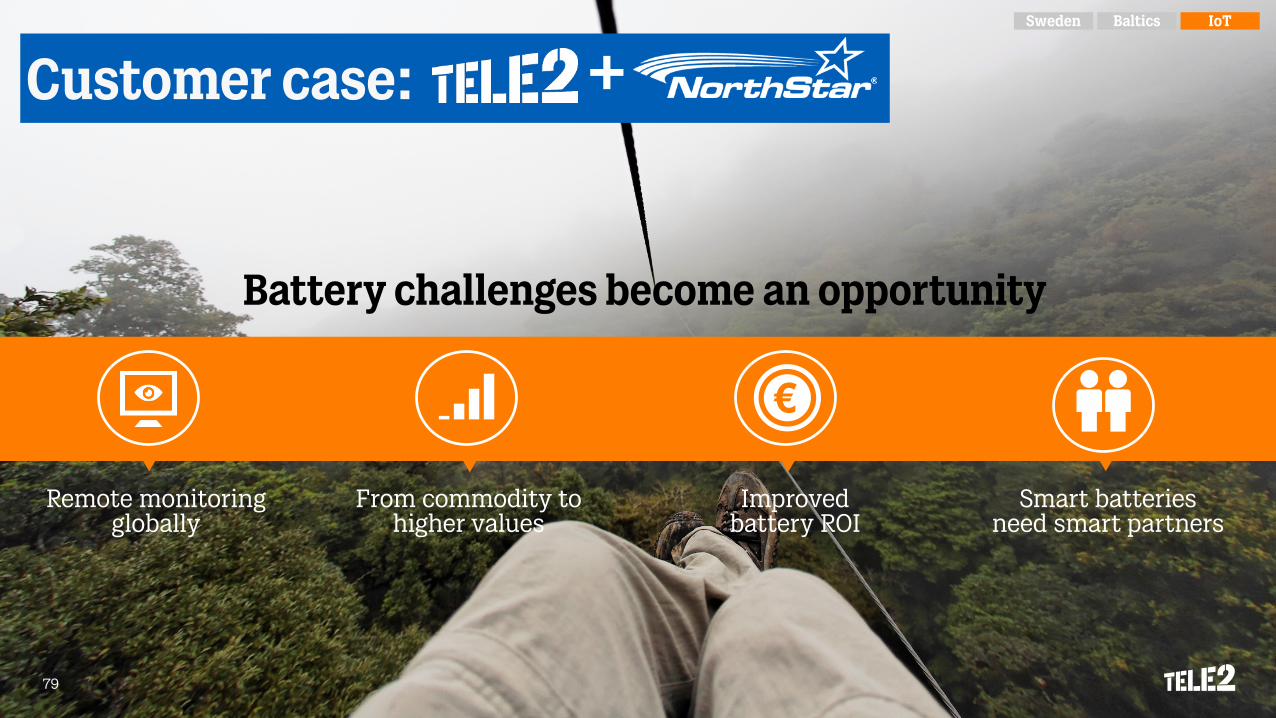
Remote monitoring globally
From commodity to higher values
Improved battery ROI
Smart batteries need smart partners
79
+Customer case:
Battery challenges become an opportunity
IoTBalticsSweden

Solution Architecture
80
Connectivity options Short time to market
Powered by
IoTBalticsSweden

81
TO WRAPIOT UP…

To wrap IoT up...
82
IoT love
Horizontal market positionGo to market and data
orchestration
IoT Team excellence
IoT market opportunity Tele2 Iot in the top 20
IoTBalticsSweden
2SUM IT UP
Lars Nordmark, Group CFOAllison Kirkby, President and CEO

3 422 3 282 3 168 3 3503 641
Q3 15 Q4 15 Q1 16 Q2 16 Q3 16
Strong Q3 Group performance
-2% +17%
84
1 599
1 3371 226
1 087
1 562
Q3 15 Q4 15 Q1 16 Q2 16 Q3 16
667
114 72
267
783
Q3 15 Q4 15 Q1 16 Q2 16 Q3 16
+6%
Mobile end-user service revenue (SEK million)
EBITDA (SEK million)
EBITDA - CAPEX(SEK million)
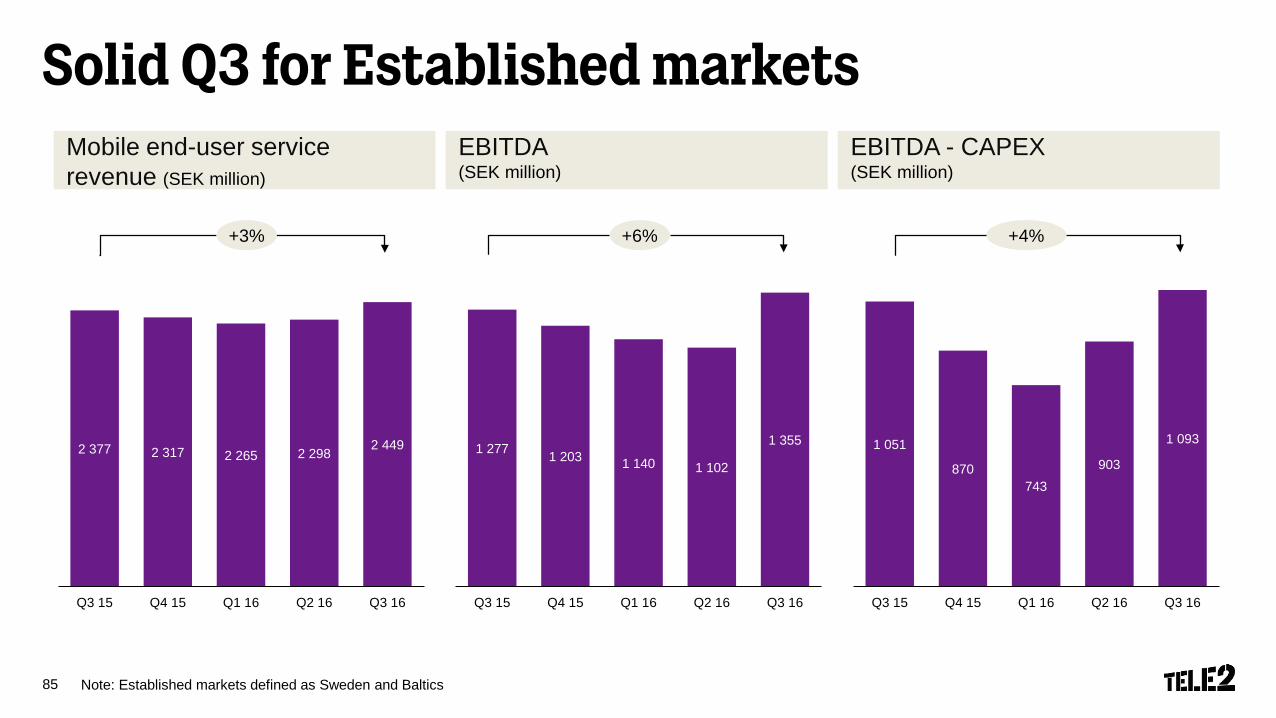
2 377 2 317 2 265 2 298 2 449
Q3 15 Q4 15 Q1 16 Q2 16 Q3 16
Solid Q3 for Established markets
+6% +4%
Note: Established markets defined as Sweden and Baltics85
1 277 1 203 1 140 1 102
1 355
Q3 15 Q4 15 Q1 16 Q2 16 Q3 16
1 051
870743
903
1 093
Q3 15 Q4 15 Q1 16 Q2 16 Q3 16
+3%
Mobile end-user service revenue (SEK million)
EBITDA (SEK million)
EBITDA - CAPEX(SEK million)

Our Established markets have strong financials
Note: Established markets defined as Sweden and Baltics, LTM – last 12 months,*Excluding one-off items
86
EBITDA margin EBITDA - CAPEX(SEK million)
Normalized ROCE*
29% 31% 30%
23% 21%19%
2014 2015 Q3 16 LTM
Established Group
3 636 3 738 3 609
2 476
1 5301 236
2014 2015 Q3 16 LTM
Established Group
28% 27% 27%
12%10%
8%
2014 2015 Q3 16 LTM
Established Group

83% 80% 79%
66% 69%62%
79% 77% 75%
2014 2015 Q3 16 LTM
SE Baltics Established
Cash generation in Established markets
87Note: Cash conversion rate defined as (EBITDA-CAPEX)/EBITDA,Established markets defined as Sweden and Baltics
Cash conversion rate development Cash conversion rate, peer comparison
55%
67%
76%
Telia
Elisa
Tele2 Established
Note: European operations, unless stated otherwise. Q3 2016 YTD, constant currency Source: Interim reports

Tele2 has outperformed
88 Source: Bloomberg
0
50
100
150
200
250
jan-11 jun-11 nov-11 apr-12 sep-12 feb-13 jul-13 dec-13 maj-14 okt-14 mar-15 aug-15 jan-16 jun-16 nov-16
Tele2 Eurostoxx 50 Telecoms
+28%
+12%
Jan-11 Jun-11 Nov-11 Apr-12 Sep-12 Feb-13 Jul-13 Dec-13 May-14 Oct-14 Mar-15 Aug-15 Jan-16 Jun-16 Nov-16
Tele2 vs peers - Total Shareholder Return including dividend reinvested in the stock

Financial guidance 2016
*Based on LFL which is constant currencies and pro forma for Altel89
Net sales(SEK billion)
EBITDA(SEK billion)
26 – 27
4.6 – 5.0
CAPEX(SEK billion) 3.7 – 4.1
Mobile end-user service revenue
Mid-single digit % growth*

REASONS2BELIEVE
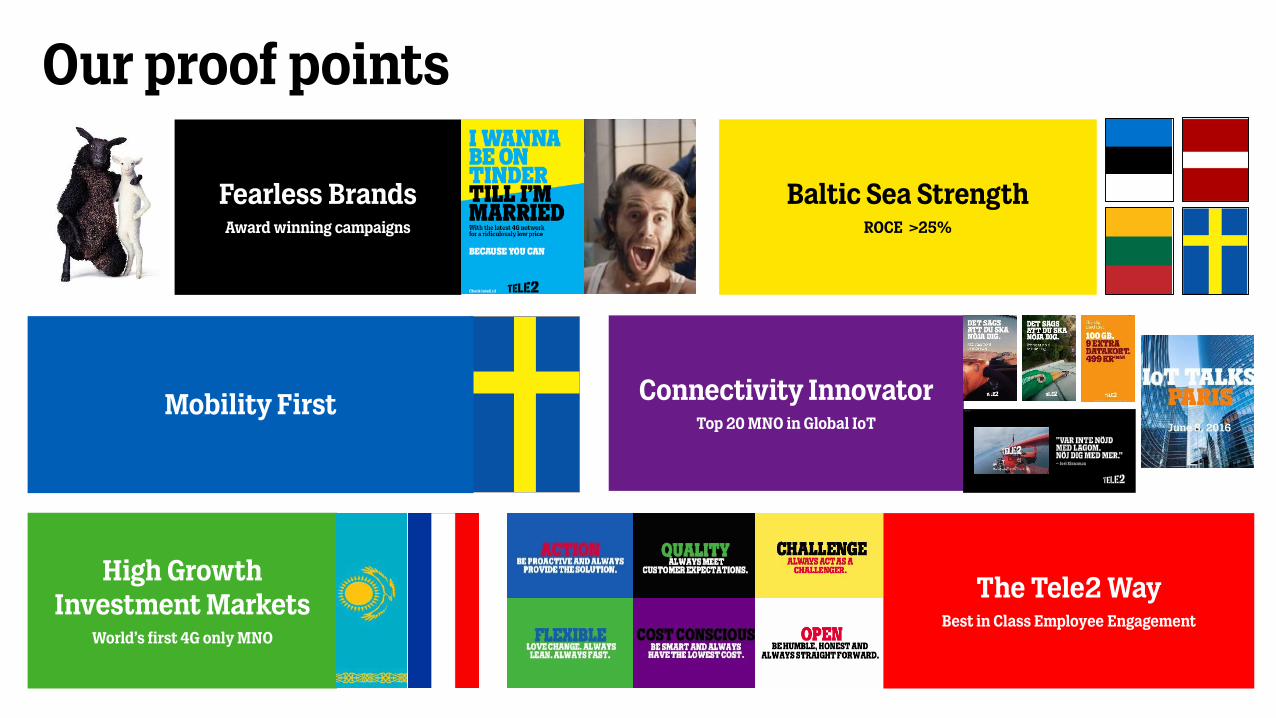
Our proof points
Fearless BrandsAward winning campaigns
Baltic Sea StrengthROCE >25%
Connectivity InnovatorTop 20 MNO in Global IoT
Mobility First
High Growth Investment Markets
World’s first 4G only MNO
The Tele2 WayBest in Class Employee Engagement

The Tele2 Way
We are challengers, fast-movers and will always offer our customers what they need for less
We will be champions of customer value in everything we do
How we win
Focused Technology
Choices
Value Champion
Step-Change Productivity
Winning People & Culture
Vision
Mission
Where we play
Mobile access
Our current footprint
Residential and Business
IoT
Responsible Challenger
Our Way2Win
92

Q&A

THEBEGINNING

Forward looking statements
Statements made in this document relating to the future, including future performance and other trend projections, are forward-looking statements. By their nature, forward-looking statements involve risks and uncertainties because they relate to events and depend on circumstances that will occur in the future. There can be no assurance that actual results will not differ materially from those expressed or implied by these forward-looking statements, due to many factors, many of which are outside of Tele2’s control.
95
![Presentation on Analyst Meet [Company Update]](https://static.fdocuments.in/doc/165x107/577cb26e1a28aba7118c0390/presentation-on-analyst-meet-company-update.jpg)