Analysis(of(Proppants( - Total Solutions in Particle ...manual%ensemble%sieve%...
5
Analysis of Proppants The unique advantages of PartAn 3D Image Analysis over sieves and microscopic analysis Terry Stauffer July, 2014 Provided By: Microtrac, Inc. Particle Size Measuring Instrumentation SLAN45 rev A
Transcript of Analysis(of(Proppants( - Total Solutions in Particle ...manual%ensemble%sieve%...

Analysis of Proppants The unique advantages of PartAn3D Image
Analysis over sieves and microscopic analysis
Terry Stauffer July, 2014
Provided By: Microtrac, Inc.
Particle Size Measuring Instrumentation
SL-‐AN-‐45 rev A

2
2
BACKGROUND Hydraulic fracturing (fracking) has been used to reach deep petroleum deposits for some 60 years, but it has only recently been exploited to reach natural gas reserves, generally found closer to ground surface. So fracking for natural gas deposits involves some vertical drilling but then turns horizontally toward the gas reserve. Proppants (finely sized particulates), water and chemicals are injected at high pressures to blast open shale rock and release the trapped gas inside. The proppants (propping agents) “prop” the fracture open to allow a path for the gas to flow. Proppants can be sand (quartz/silica or sandstone), resin-‐coated sand or ceramic crystals. Since the recent large scale discovery of many rich natural gas reserves, fracking has increased to a rate that in 2013 used 20 million tons of frac sand alone in North America. Many sandstone deposits with sand suitable for fracking are located in Wisconsin, Minnesota, Illinois, Missouri and Texas. Proppants have to meet very strict specifications for, among others, size distribution, and two particle shape parameters. Uniform sizes and smooth rounded shapes maximize the flowability, or conductivity, of the gas from the reserve to the surface. The American Petroleum Institute (API) sets these specifications, current API RP 19C (ISO 13503-‐2:2006, Identical). The current API-‐specified size ranges for proppants are: 2.38x1.68 mm, 2.00x0.84 mm, 0.84x0.42 mm and 210x105 microns. The current particle shape standards remain the same as those established in the 1960’s by Krumbein and Sloss, who created a 2-‐dimensional chart of silhouettes of variously shaped sand particles based on their terms for Sphericity in the Y axis and Roundness in the X axis
These Krumbein-‐Sloss shape factors for sand particles are, according to API RP 19C, determined by a technician observing at least 20 grains of a representative sample on a manual optical microscope and subjectively assigning a Roundness and Sphericity value to each by visually comparing the particles to the images in the table and assigning values listed on the chart. Calculations of these shape values, which were based on rather archaic formulae, are never made. Of note, however, is that this current version of the API standard states that methods using digital technology are now available and acceptable. This means that dynamic image analyzers like Microtrac’s PartAn3D are acceptable for determining these values. No preferred procedures for use of these image analyzers, nor the parameters to report, are mentioned. The Krumbein-‐Sloss Sphericity and Roundness values turn out to be measures of form and surface roughness respectively, which means that the PartAn3D parameters reported for Sphericity, Circularity and Ellipse Aspect Ratio could be used for form, and Convexity, Solidity and Concavity could be used for surface roughness values. These shape parameters are given on a scale from 0 to 1.0. A value of 1.0 for Sphericity, Circularity and Ellipse Aspect Ratio would indicate the particle to be a perfect sphere. Values of 1.0 for Convexity and Solidity would indicate particles with a completely smooth surface with no indentations, and a value of 0 for Concavity would indicate a particle with a completely smooth, convex surface.
Krumbein-‐Sloss Chart
3
2
EXPERIMENTAL A sample of a processed fracking sand was measured on the Microtrac PartAn3D particle image analyzer. The PartAn 3D is a dry dynamic particle image analyzer. A sample is placed in a hopper feeding on to a vibratory feeder which delivers the particles to a point where they drop by gravity down through the sensing zone of the analyzer. A high speed strobe light strikes the particles from one side of the sensing zone while a digital camera captures the back-‐lighted images of the particles. The images are maintained in a video file for analysis. Thirty-‐two different size, shape and intensity parameters (13 size, 17 shape, 2 intensity) are measured for each particle in the image file and reported as graphical and tabular Number or Volume distributions, along with user-‐selectable summary data like means, percentiles and many more. The image file is also viewable and can be sorted in descending or ascending order on any parameter. The saved video file can be later re-‐run under different measurement conditions. Both size distributions and the various form and roughness shape parameter distributions were calculated and reported, graphically and in tabular form, along with summary statistical data. This analyzer has many unique advantages over sieve and microscopic analysis for measuring the size and shape factors required by the API standard for proppants, and are listed in the table below.
Description PartAn3D Sieves/Microscope Ease and accuracy of measurement.
Thirty different size and shape parameters reported in one automated measurement of up to hundreds of thousands of measurements each individual particle, taking only a few minutes to complete.
Fifteen-‐minute manual ensemble sieve analysis subject to operator error and worn sieves giving one size, equivalent spherical diameter. / Up to a day-‐long subjective manual microscopic analysis to get representative sample, giving two estimated mean shapes.
Data reported. Fifteen different size, twelve different shape and two translucence parameters reported as graphical and tabular number or volume distributions, with means and much more summary data plus a two-‐ parameter comparative scatter diagram isolating the relationship between any two parameters and a stored re-‐measurable sortable viewable printable image file of each particle.
One size analysis as a mass distribution with mean values and a few other summary data. No data is given for each individual particle, only for the entire ensemble sample. / A subjective operator-‐dependent estimate of two shape factors, as mean values of the entire population measured.
Dimensionality. PartAn3D is the only image analyzer with a patented 3-‐D mode of analysis. All three major axes of each particle are measured and reported. The volume of each particle is calculated as the product of its length, width and thickness. This provides a far more accurate volume size distribution than equivalent spherical diameter calculated as an ensemble volume distribution. / Shape parameters are ratios of various size parameters, which gives the PartAn3D the most accurate and automatic shape data quickly and easily measured.
Sieve analysis gives only an equivalent spherical diameter size parameter / Manual microscopic analysis gives only operator-‐estimated means of a 2-‐D analysis for two shapes.
Results
4
2
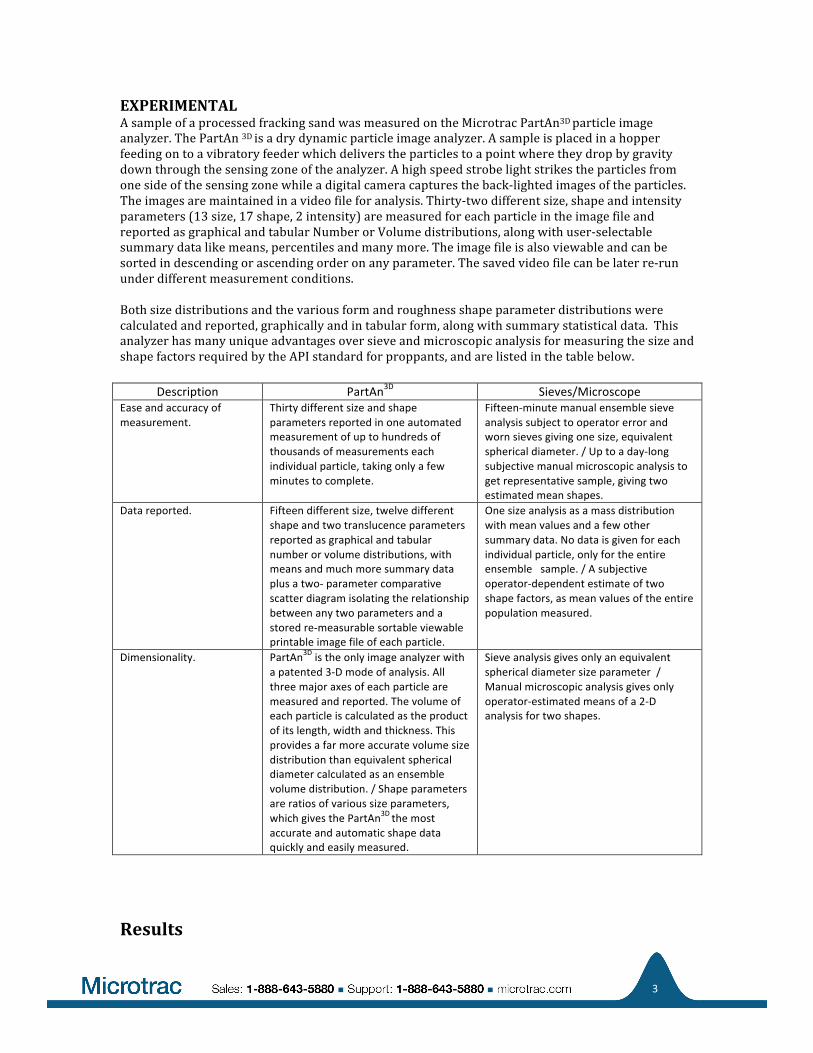
Figure 1. Partial rows of images from the video file of a processed frac sand. In the PartAn3D 3-‐D mode, each row represents a series of photos of one particle in random orientations as it tumbles through the sensing zone. The top row shows a large particle made up of agglomerates of individual grains. In the bottom row one image is in an orientation which shows the particle to be an agglomerate of 5 grains. Agglomerates are likely de-‐agglomerated under the high pressure and abrasion which occurs during the fracturing process, as well as they likely are during the physical pounding during a sieve analysis. This makes a point that image analysis run on a fresh sample would report the degree and type of agglomeration in the process product, and then, after a short period of vigorous shaking of the sample, which is always recovered after an analysis, the de-‐agglomerated sample could be measured, representing the sizes and shapes that would exist when packed in the fracture.
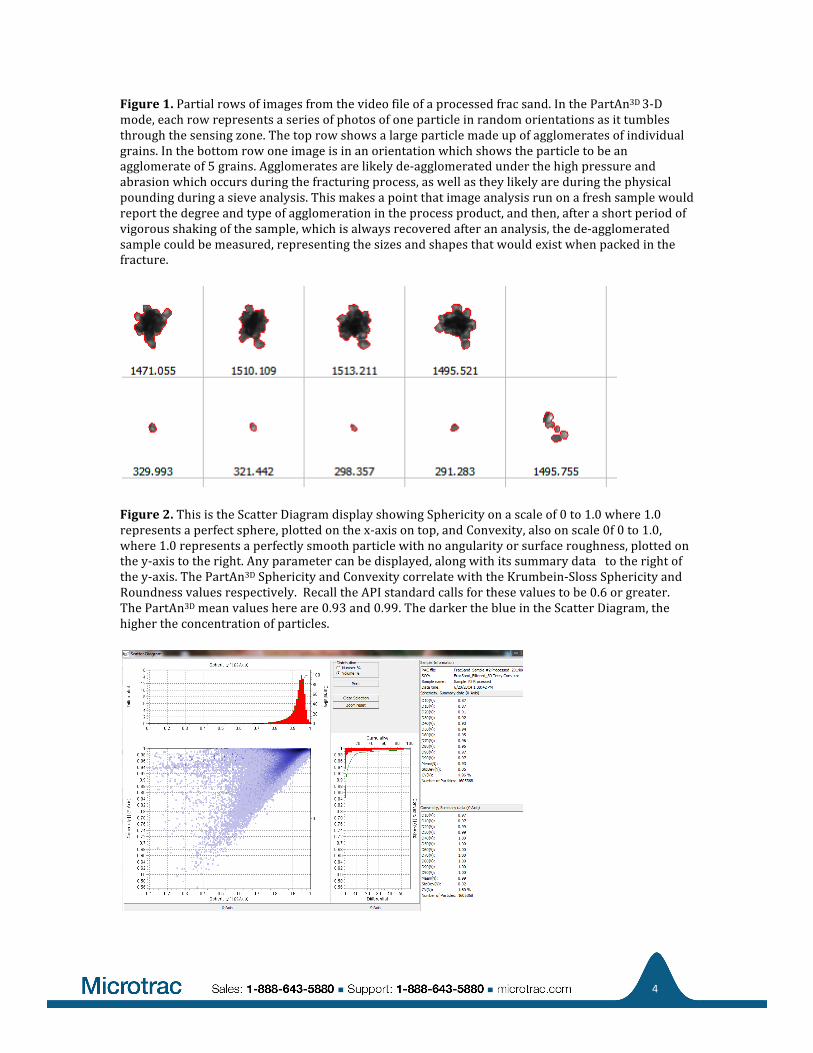
Figure 2. This is the Scatter Diagram display showing Sphericity on a scale of 0 to 1.0 where 1.0 represents a perfect sphere, plotted on the x-‐axis on top, and Convexity, also on scale 0f 0 to 1.0, where 1.0 represents a perfectly smooth particle with no angularity or surface roughness, plotted on the y-‐axis to the right. Any parameter can be displayed, along with its summary data to the right of the y-‐axis. The PartAn3D Sphericity and Convexity correlate with the Krumbein-‐Sloss Sphericity and Roundness values respectively. Recall the API standard calls for these values to be 0.6 or greater. The PartAn3D mean values here are 0.93 and 0.99. The darker the blue in the Scatter Diagram, the higher the concentration of particles.

5
2
Figure 3. This is the X-‐Y Graph plot of four different size parameters: length, width, thickness and area equivalent diameter for the processed frac sand sample with size channel edges set at the API standard required sizes, plotted as volume distributions with tabular data listed to the right. Any of these parameters can be correlated with the standard sieve distribution, and once correlated, reported as the % values of a sieve measurement for each size fraction. User selected summary data are shown in the lower right window.
Figure 4. This is the upper right corner of the View Particles display showing all 2-‐D and 3-‐D parametric data for the particle chosen by the user, highlighted inside the blue box in the frame window.


![Sieves in discrete groups, especially sparselibrary.msri.org/books/Book61/files/35kowa.pdf · 2010]on the affine sieve. Another survey of sieves in discrete groups, with a particular](https://static.fdocuments.in/doc/165x107/604a6d70223ac20b9d2ea0ca/sieves-in-discrete-groups-especially-2010on-the-afine-sieve-another-survey.jpg)