Analysis Tools
12
Analysis Tools • Analysis Tools – Vector Analysis • Spatial Analyst – Raster Analysis • Geostatistical Analyst – Interpolation • Spatial Statistics – Patterns – Clusters
-
Upload
adena-mendoza -
Category
Documents
-
view
36 -
download
0
description
Analysis Tools. Analysis Tools Vector Analysis Spatial Analyst Raster Analysis Geostatistical Analyst Interpolation Spatial Statistics Patterns Clusters. Auto-Correlation. Auto – self Correlation - related. Does this signal have auto-correlation?. Signal Components. Random Component. - PowerPoint PPT Presentation
Transcript of Analysis Tools

Analysis Tools
• Analysis Tools– Vector Analysis
• Spatial Analyst– Raster Analysis
• Geostatistical Analyst– Interpolation
• Spatial Statistics– Patterns– Clusters

Auto-Correlation
• Auto – self• Correlation - related
Does this signal have auto-correlation?

Is Correlation Bad?
• Most statisticians see correlation as bad because it can lead to results that are misinterpreted
• Spatial auto-correlation can be bad for the same reason so we must detect it
• Without spatial auto-correlation, we should not be doing spatial interpolation

First Law of Geography
• "Everything is related to everything else, but near things are more related than distant things.“– Waldo Tobler– (1970) "A computer movie simulating urban
growth in the Detroit region". Economic Geography
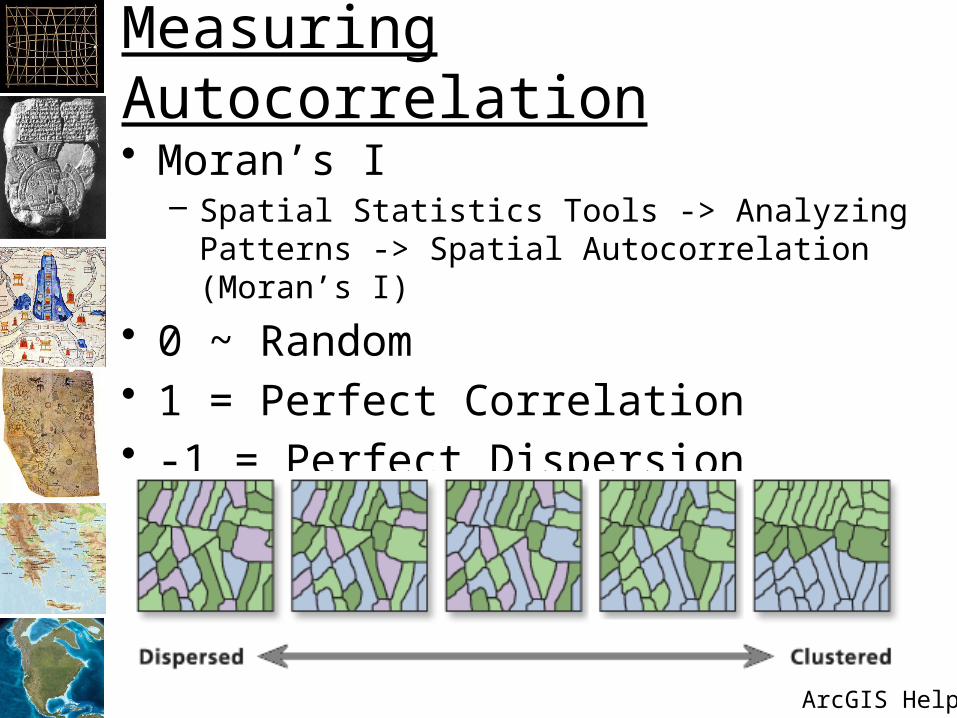
Measuring Autocorrelation
• Moran’s I– Spatial Statistics Tools -> Analyzing Patterns ->
Spatial Autocorrelation (Moran’s I)
• 0 ~ Random• 1 = Perfect Correlation• -1 = Perfect Dispersion (pattern)
ArcGIS Help
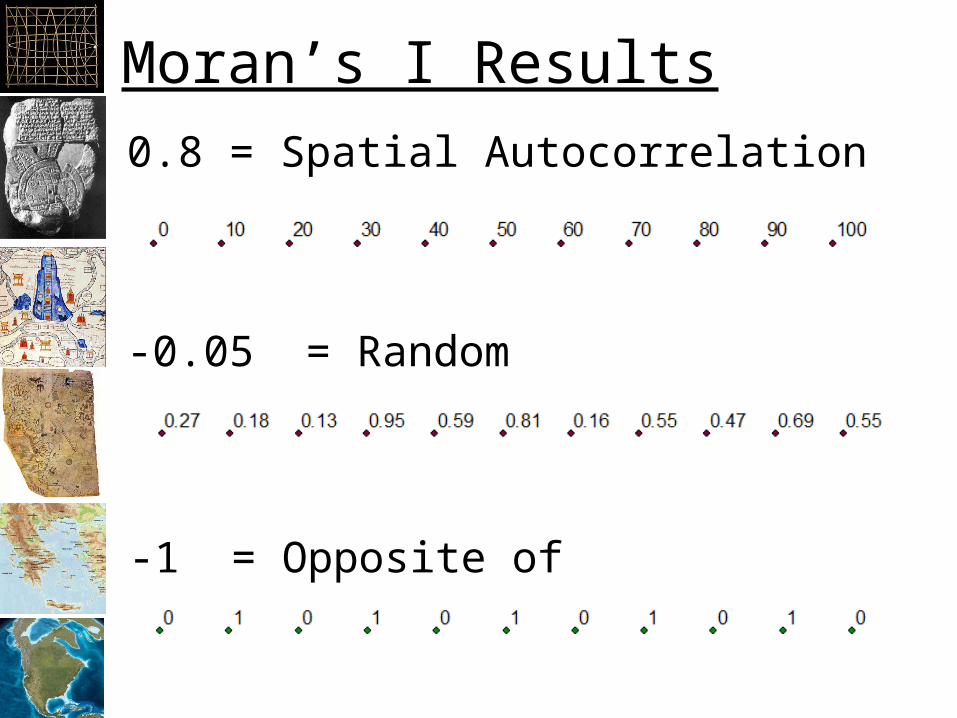
Moran’s I Results
-0.05 = Random
-1 = Opposite of autocorrelation
0.8 = Spatial Autocorrelation

Moran’s I
• If the and in the numerator vary in the same way from the mean (positively or negatively), the numerator will be positive.
• If and vary in opposite ways from the mean, the numerator will be negative.

Spatial Autocorrelation Game
• Northern Kentucky University– http://www.nku.edu/~longa/cgi-bin/cgi-tcl-
examples/generic/SA/SA.cgi
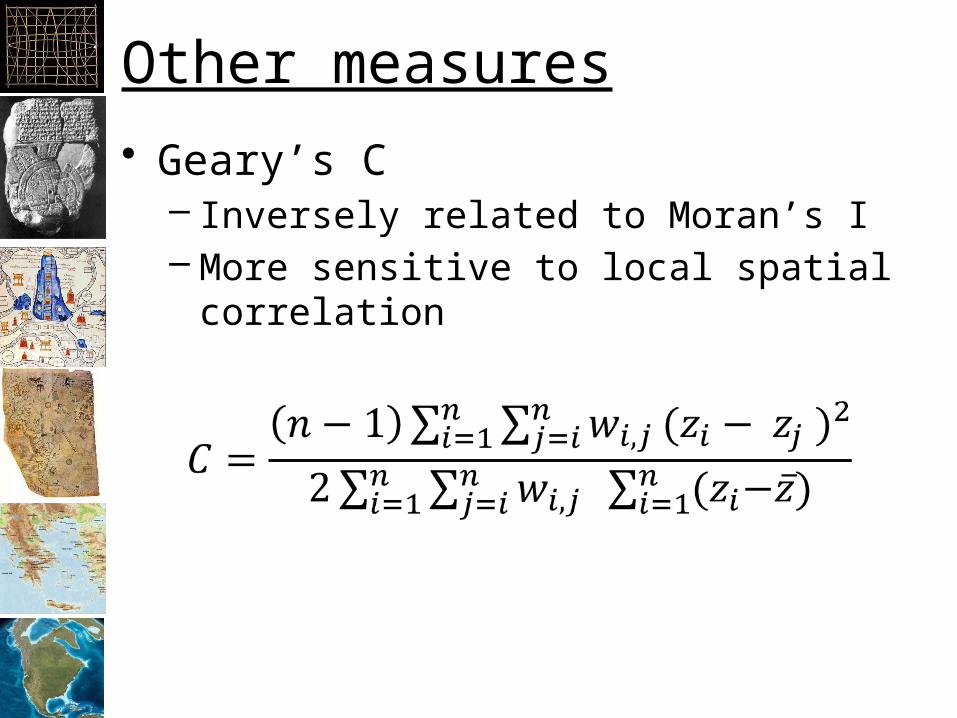
Other measures
• Geary’s C– Inversely related to Moran’s I– More sensitive to local spatial correlation