ANALYSIS REPORT 2016 - documents.wfp.org · The effects of the El Nino induced drought experienced...
52
KINGDOM OF SWAZILAND SWAZILAND ANNUAL VULNERABILITY ASSESSMENT & ANALYSIS REPORT 2016 July 2016 ___________________________________________________________________________
Transcript of ANALYSIS REPORT 2016 - documents.wfp.org · The effects of the El Nino induced drought experienced...
KINGDOM OF SWAZILAND
SWAZILAND ANNUAL VULNERABILITY ASSESSMENT &
ANALYSIS REPORT 2016
July 2016
___________________________________________________________________________
i
A. ACKNOWLEDGEMENT The effects of the El Nino induced drought experienced during 2015/2016 agricultural season made it extremely important for Swaziland to conduct this year’s Annual Vulnerability and Livelihoods Assessment to inform short to medium term interventions. In this regard, Swazi VAC would like to express sincere gratitude to all stakeholders who contributed immensely to the success of this year’s assessment. Swazi VAC is extremely appreciative of the logistical and technical support received from the Swaziland Government. We also want to appreciate ongoing support from the National Disaster Management Agency and the United Nations Agencies. Technical support received from World Food Program, FEWS NET and Food and Agricultural Organisation (FAO) during the analysis is highly appreciated. We are also indebted to all individuals from different government ministries and NGOs who diligently collected all the required data across the country. Equally, we would like to send our most heartfelt appreciation to respondents of our questions ranging from: community leaders, government officials at local and regional levels, and sampled women and men who provided crucial information to form the vulnerability picture across different geographical areas. Finally and most importantly, the Swazi VAC would like to highly commend the Southern Africa Development Community's Regional Vulnerability Assessment and Analysis (SADC-RVAA) Programme for providing the financial support towards this year’s assessment. Financial contribution made by both FAO and World Vision Swaziland is also appreciated.
Robert Fakudze
Chairperson Swazi VAC
ii
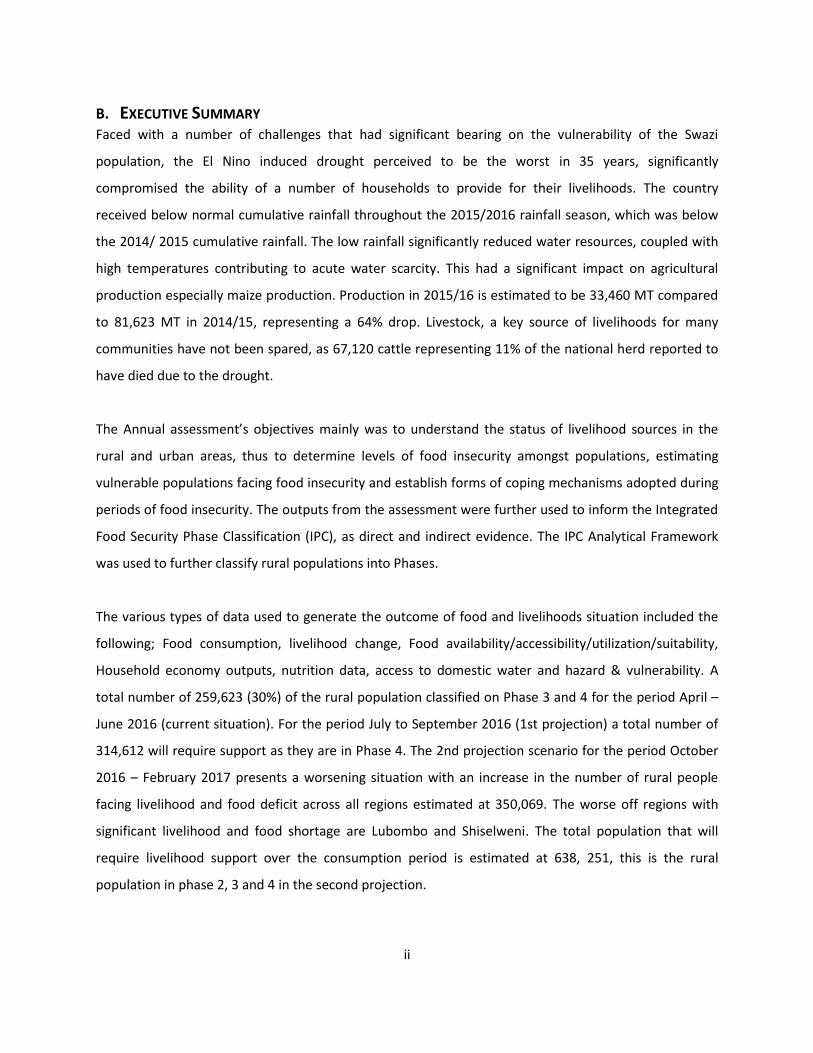
B. EXECUTIVE SUMMARY Faced with a number of challenges that had significant bearing on the vulnerability of the Swazi
population, the El Nino induced drought perceived to be the worst in 35 years, significantly
compromised the ability of a number of households to provide for their livelihoods. The country
received below normal cumulative rainfall throughout the 2015/2016 rainfall season, which was below
the 2014/ 2015 cumulative rainfall. The low rainfall significantly reduced water resources, coupled with
high temperatures contributing to acute water scarcity. This had a significant impact on agricultural
production especially maize production. Production in 2015/16 is estimated to be 33,460 MT compared
to 81,623 MT in 2014/15, representing a 64% drop. Livestock, a key source of livelihoods for many
communities have not been spared, as 67,120 cattle representing 11% of the national herd reported to
have died due to the drought.
The Annual assessment’s objectives mainly was to understand the status of livelihood sources in the
rural and urban areas, thus to determine levels of food insecurity amongst populations, estimating
vulnerable populations facing food insecurity and establish forms of coping mechanisms adopted during
periods of food insecurity. The outputs from the assessment were further used to inform the Integrated
Food Security Phase Classification (IPC), as direct and indirect evidence. The IPC Analytical Framework
was used to further classify rural populations into Phases.
The various types of data used to generate the outcome of food and livelihoods situation included the
following; Food consumption, livelihood change, Food availability/accessibility/utilization/suitability,
Household economy outputs, nutrition data, access to domestic water and hazard & vulnerability. A
total number of 259,623 (30%) of the rural population classified on Phase 3 and 4 for the period April –
June 2016 (current situation). For the period July to September 2016 (1st projection) a total number of
314,612 will require support as they are in Phase 4. The 2nd projection scenario for the period October
2016 – February 2017 presents a worsening situation with an increase in the number of rural people
facing livelihood and food deficit across all regions estimated at 350,069. The worse off regions with
significant livelihood and food shortage are Lubombo and Shiselweni. The total population that will
require livelihood support over the consumption period is estimated at 638, 251, this is the rural
population in phase 2, 3 and 4 in the second projection.

iii
Food security outcomes presented a deteriorated situation in all the regions in the country. Of the rural
population, 73% of households have acceptable food consumption, 22% borderline and 5% poor food
consumption. The Manzini and Lubombo regions have a higher percentage of households with
borderline and poor food consumption. The Household Dietary Diversity Score presents low levels of
dietary diversity among households. Of the households 31% have low dietary diversity consisting mainly
of cereals and pulses, while 54% with medium dietary diversity. The Manzini, Shiselweni and Lubombo
regions have more than 30% of households with low dietary diversity. Overall 21% of households spends
more than 75% of their income on food with Manzini and Shiselweni regions representing a higher
proportion of households in this category. Rapid inflationary changes influencing prices will have a
greater impact on household’s purchasing power, reducing expenditure on non-food items and savings,
predisposing households to further food security shock increasing their vulnerability.
The Lubombo region has the highest levels of negative coping strategies. The Coping Strategy Index (CSI)
of 17.7 indicates that households in the regions are employing more negative coping strategies as a
result of the shocks affecting households. The region faced higher shocks, such as prolonged drought
spells and poor rains leading to crop failure when compared to other regions mainly due to the drought.
Female headed households have a higher CSI (15) compared to male headed households (CSI 14),
indicating the differences and impact of gender difference with regards to shocks within the households.
The Lubombo region also reported the highest percentage (39%) of households employing emergency
coping strategies. Using the IPC thresholds, 5% of the country’s households are using high levels of
coping while 35% is employing medium levels of coping while 60% employs either very low coping
strategies or none at all.
Water, sanitation and hygiene remain a challenge, where low access to clean drinking water, precarious
household health environment, and poor feeding practices are wide-spread across the country. Overall,
63% of the households use improved water sources for domestic purposes. The levels in Manzini and
Shiselweni regions are considerably lower than the other regions as only 58% and 56% respectively of
the rural households gets domestic water supply from improved sources. Hhohho region has the highest
(71%) households with access to improved water sources. Distance to water source is still a challenge in
the country as more than 7.5% of the population travels more than 0.5km to access their water source.
The Lubombo region has the highest proportion of households with poor access to water. Poor
iv
households have poor access to water with only 11.7% having access to water within their households in
comparison to the 66.5% of households in the richest wealth quintile.
Household food insecurity has effects on health and development of children and adults leading to
increased hospitalization, poor health, iron deficiencies, developmental risks and behaviour problems.
Morbidity in terms of household head sex, households hosting a chronically ill person was higher in
female headed households (25.7%) compared to male headed households (23.3%). Severe Acute
Malnutrition (SAM) is high in the Manzini region and low in the Shiselweni region. Higher morbidity was
reported in Lubombo region in comparison to the other regions.
In view of the magnitude of the impact of the drought on the population, the Swazi government
declared it a national emergency. The Government has made efforts to address the growing
humanitarian needs in collaboration with partners, coordinated by the National Disaster Management
Agency. A donor conference was held to brief the donor community on the National Drought Emergency
Mitigation and Adaptation Plan (NERMAP) 2016-2022 and the current situation of the drought in the
country. The NERMAP 2016-2022 had estimated that from March 2016 a minimum of 300,000 people,
(about one third of the population), will be in need of food assistance. The government has committed
substantial resources for the emergency and has requested technical and financial assistance from the
international community to support the emergency response plan
v
C. ABBREVIATIONS AND ACRONYMS ACAT : AFRICA COOPERATION ACTION TRUST
AIDS : ACQUIRED IMMUNE-DEFICIENCY SYNDROME
ART : ANTI-RETROVIRAL THERAPY
ARV : ANTI-RETROVIRAL
CSO : CENTRAL STATISTICS OFFICE
EA : ENUMERATION AREA
FAO : FOOD AND AGRICULTURE ORGANIZATION
GDP : GROSS DOMESTIC PRODUCT
GOS : GOVERNMENT OF SWAZILAND
HIV : HUMAN IMMUNE-DEFICIENCY VIRUS
IPC : INTEGRATED FOOD SECURITY PHASE CLASSIFICATION
LZ : LIVELIHOOD ZONE (ALSO KNOWN AS FOOD ECONOMY ZONE)
MEPD : MINISTRY OF ECONOMIC DEVELOPMENT AND PLANNING
MICS : MULTIPLE CLUSTER INDICATOR SURVEY
MOA : MINISTRY OF AGRICULTURE
MT : METRIC TONNES
NEWU : NATIONAL EARLY WARNING UNIT
NHSSP : NATIONAL HEALTH SECTOR STRATEGIC PLAN
NMC : NATIONAL MAIZE CORPORATION
NMS : NATIONAL METEOROLOGICAL SERVICES
SADC RVAA : SOUTHERN AFRICAN DEVELOPMENT COMMUNITY REGIONAL VULNERABILITY
ASSESSMENTAND ANALYSIS
SHIES : SWAZILAND HOUSEHOLD INCOME AND EXPENDITURE SURVEY
SNL : SWAZI NATION LAND

vi
SNAIP : SWAZILAND NATIONAL AGRICULTURAL INVESTMENT PLAN
SWAZI VAC : SWAZILAND VULNERABILITY ASSESSMENT COMMITTEE
UNICEF : UNITED NATIONS CHILDREN’S FUND
VAA : VULNERABILITY ASSESSMENTAND ANALYSIS
WFP : WORLD FOOD PROGRAMME
WHO : WORLD HEALTH ORGANIZATION

vii
D. TABLE OF CONTENTS
A. ACKNOWLEDGEMENT .................................................................................................................... I
B. EXECUTIVE SUMMARY ................................................................................................................... II
C. ABBREVIATIONS AND ACRONYMS ............................................................................................ V
D. TABLE OF CONTENTS ................................................................................................................. VII
E. LIST OF TABLES ............................................................................................................................. IX
F. LIST OF MAPS.................................................................................................................................. IX
G. TABLE OF FIGURES ........................................................................................................................ IX
1.0 BACKGROUND AND OVERVIEW .................................................................................................. 1
1.1 MACRO- ECONOMIC INDICATORS ............................................................................................................................ 1
1.2 AGRICULTURE ...................................................................................................................................................... 2
1.3 LABOUR MARKETS ................................................................................................................................................ 2
1.4 WATER AND SANITATION ....................................................................................................................................... 2
1.5 HEALTH AND NUTRITION........................................................................................................................................ 2
1.6 EDUCATION ......................................................................................................................................................... 3
2.0 METHODOLOGY .............................................................................................................................. 4
2.1 OBJECTIVES ......................................................................................................................................................... 4
2.2 METHODOLOGICAL APPROACH ............................................................................................................................... 4
2.2.1 Field work Operation and Data Quality ................................................................................................. 6
2.2.2 Data Processing and Analysis ................................................................................................................ 6
2.2.3 Report Writing and IPC Acute Analysis .................................................................................................. 6
2.3 INTEGRATED FOOD SECURITY PHASE CLASSIFICATION (IPC) FRAMEWORK ....................................................................... 6
3.0 SECTORAL ANALYSIS ..................................................................................................................... 8
3.1 SEASONAL RAINFALL PERFORMANCE FOR 2015/16 .................................................................................................... 8
3.1.1 Temporal rainfall distribution curves ..................................................................................................... 9
3.1.2 Cumulative temporal rainfall curves .................................................................................................... 10
3.1.3 Maize yield response ............................................................................................................................ 12
3.1.4 Vegetation response ............................................................................................................................ 12
3.2 WATER AVAILABILITY .......................................................................................................................................... 13
3.2.1 Major River Flows ................................................................................................................................ 13
3.2.2 Major Reservoirs .................................................................................................................................. 14
viii
3.3 AGRICULTURE .................................................................................................................................................... 15
3.3.1 National Maize Production .................................................................................................................. 15
3.3.2 National Food Balance Sheet ............................................................................................................... 17
3.3.3 Livestock Deaths .................................................................................................................................. 17
3.4 ACCESS TO ARABLE LAND ..................................................................................................................................... 19
4.0 KEY FINDINGS................................................................................................................................. 20
4.1 FOOD SECURITY ................................................................................................................................................. 20
4.1.1 Food Consumption Score ..................................................................................................................... 20
4.1.2 Food Consumption Score - Nutrition .................................................................................................... 21
4.2 HOUSEHOLD DIETARY DIVERSITY ........................................................................................................................... 22
4.3 MEALS PER DAY ................................................................................................................................................. 23
4.4 FOOD EXPENDITURE SHARE .................................................................................................................................. 23
4.5 SHOCK AND COPING STRATEGIES ........................................................................................................................... 24
4.6 LIVELIHOOD COPING STRATEGIES ........................................................................................................................... 26
4.7 WATER AND SANITATION ..................................................................................................................................... 27
4.7.1 Use of improved water source ............................................................................................................. 27
4.7.2 Household Water Availability, Distance and Use ................................................................................. 28
4.7.3 Use of improved sanitation .................................................................................................................. 29
4.8 HEALTH ............................................................................................................................................................ 30
4.8.1 Morbidity ............................................................................................................................................. 30
4.8.2 Capacity of the Health Sector to Respond to Emergencies .................................................................. 31
4.8.3 NUTRITIONAL STATUS ..................................................................................................................................... 32
5.0 ANALYSIS OF ACUTE FOOD INSECURITY SITUATION ........................................................ 37
5.1 CURRENT ACUTE FOOD INSECURITY CONDITIONS – APRIL – JUNE 2016 ....................................................................... 37
5.2 ACUTE FOOD INSECURITY SITUATION: 1ST PROJECTION SCENARIO – JULY – SEPTEMBER 2016........................................... 38
5.3 ACUTE FOOD INSECURITY SITUATION: 2ND PROJECTION SCENARIO OCTOBER 2016 – FEBRUARY 2017 ............................... 39
6.0 CONCLUSION ................................................................................................................................. 40
6.1 COORDINATION AND MONITORING ........................................................................................................................ 40
6.2 WATER AND SANITATION ..................................................................................................................................... 40
6.3 AGRICULTURE AND FOOD SECURITY ....................................................................................................................... 40
ix
6.4 EDUCATION ....................................................................................................................................................... 40
6.5 HEALTH ............................................................................................................................................................ 41
6.6 PROTECTION...................................................................................................................................................... 41
6.7 ENVIRONMENT .................................................................................................................................................. 41
E. LIST OF TABLES TABLE 1: IPC PHASE CLASSIFICATION CHART ........................................................................................................................... 7
TABLE 2: MAJOR CROPS PLANTED FOR THE 2015/16 AGRICULTURAL SEASON ............................................................................ 15
TABLE 3: NATIONAL FOOD BALANCE SHEET ........................................................................................................................... 17
TABLE 4: DISTANCE TO WATER SOURCE (KM) BY REGION .......................................................................................................... 28
TABLE 5: DISTANCE TO WATER BY WEALTH INDEX QUINTILES .................................................................................................... 29
TABLE 6: WATER SOURCE DURING THE RAINY SEASON ............................................................................................................ 29
TABLE 7: TYPE OF SANITATION FACILITY BY REGION (%) ........................................................................................................... 30
TABLE 8: TYPE OF SANITARY FACILITY BY WEALTH INDEX QUINTILE (%) ...................................................................................... 30
TABLE 9: PERCENTAGE HOUSEHOLDS HOSTING A CHRONICALLY ILL MEMBER ................................................................................. 31
TABLE 10: MORBIDITY BY GENDER (%) ................................................................................................................................ 31
TABLE 11: VULNERABLE POPULATION BY REGIONS UNDER CURRENT PROJECTIONS (APRIL – JUNE 2016). ......................................... 38
TABLE 12: VULNERABLE POPULATION BY REGIONS - 1ST PROJECTION (MAY - SEPTEMBER 2016) ................................................... 38
TABLE 13: VULNERABLE POPULATION BY REGIONS - 2ND PROJECTION OCTOBER 2016 – FEBRUARY 2017 ....................................... 39
F. LIST OF MAPS MAP 1: ENUMERATION AREAS SAMPLED FOR VAA 2016 ......................................................................................................... 5
MAP 2: RAINFALL SPATIAL DISTRIBUTION FOR THE 2015/16 SEASON .......................................................................................... 8
MAP 3: 2015/16 SEASON'S RAINFALL DEPARTURE FROM LONG TERM AVERAGE ........................................................................... 9
MAP 4: WATER REQUIREMENT STRESS INDEX FOR THE 2015/16 SEASON ................................................................................... 12
G. TABLE OF FIGURES FIGURE 1: CONSUMER INFLATION YEAR ON YEAR (2015 – 2016) ............................................................................................... 1
FIGURE 2: NATIONAL TEMPORAL RAINFALL DISTRIBUTION FOR THE 2015/16 SEASON .................................................................... 10
FIGURE 3: NATIONAL CUMULATIVE RAINFALL FOR THE 2015/16 SEASON .................................................................................... 11
FIGURE 4: MEAN MONTHLY WATER FLOWS IN THE NGWAVUMA RIVER GAUGING STATION 8 (LUBULINI) .......................................... 13
x
FIGURE 5: MEAN MONTHLY KOMATI RIVER FLOWS AT GAUGING STATION 30 (MANANGA) ........................................................... 13
FIGURE 6: MEAN MONTHLY GREAT USUTHU RIVER FLOWS AT GAUGING STATION 6 (SIPHOFANENI) ................................................ 14
FIGURE 7: REMAINING WATER AS A PERCENTAGE OF FULL STORAGE CAPACITY IN MNJOLI AND MAGUGA DAM MARCH 2016 ............... 14
FIGURE 8: NATIONAL MAIZE PRODUCTION TRENDS (MT) 2012-2016 ...................................................................................... 16
FIGURE 9: CONSUMPTION REQUIREMENTS AND PRODUCTION TRENDS (2007 – 2016) ................................................................. 17
FIGURE 10: PROPORTION OF CATTLE DEATHS BY REGION ......................................................................................................... 18
FIGURE 11: CATTLE DEATHS, MAY 2015 TO MAY 2016 ......................................................................................................... 18
FIGURE 12: ACCESS TO ARABLE LAND BY LIVELIHOOD ZONE 2016 ............................................................................................. 19
FIGURE 13: FOOD CONSUMPTION SCORE 2016 ..................................................................................................................... 20
FIGURE 14: FOOD CONSUMPTION SCORE 2012 - 2016 .......................................................................................................... 21
FIGURE 15: FOOD CONSUMPTION SCORE-NUTRITION 2016 .................................................................................................... 22
FIGURE 16: HOUSEHOLD DIETARY DIVERSITY GROUPS ............................................................................................................. 23
FIGURE 17: NUMBER OF MEALS PER DAY BY AGE GROUPS ........................................................................................................ 23
FIGURE 18: HOUSEHOLD FOOD EXPENDITURE SHARE .............................................................................................................. 24
FIGURE 19: MEAN COPING STRATEGY INDEX BY REGION AND HOUSEHOLD HEAD ......................................................................... 25
FIGURE 20: CSI IPC CATEGORIES ........................................................................................................................................ 26
FIGURE 21: LIVELIHOOD COPING STRATEGIES ........................................................................................................................ 26
FIGURE 22: HOUSEHOLD ASSETS DEPLETION AND FOOD SECURITY STATUS BY LIVELIHOOD ZONE..................................................... 27
FIGURE 23: USE OF IMPROVED WATER SOURCES BY REGION .................................................................................................... 28
FIGURE 24: NUTRITIONAL STATUS BY REGION ........................................................................................................................ 33
FIGURE 25: NUTRITIONAL STATUS BY SEX ............................................................................................................................. 33
FIGURE 26: MALNUTRITION TRENDS (2010 - 2016) .............................................................................................................. 34
FIGURE 27: NATIONAL IMMUNIZATION LEVELS ...................................................................................................................... 34
FIGURE 28: MORBIDITY LEVELS IN CHILDREN ......................................................................................................................... 36

1
1.0 BACKGROUND AND OVERVIEW Swaziland, among most other countries in the Southern Africa sub-region has suffered the
devastating effects of the drought due to the El-Nino conditions and sectors severely
affected include agriculture, energy, manufacturing and other utilities. Other factors further
compounding the situation is the country’s economic performance which compromises
availability of domestic resources for the implementation of sustainable relief and recovery
programmes.
1.1 Macro- Economic Indicators
The country’s Gross Domestic Product (GDP) growth rate for 2015 was estimated at 1.7%
and predicted to shrink even further to about 1.4% in 2016 (MEPD, 2016). The Lilangeni
(SZL) has been steadily depreciating in value against the US Dollar since 2014. According to
the data of the Central Bank of Swaziland (CBS), the local currency depreciated 12.4 percent
in 2014 from an average rate of E9.7/US$ in 2013 to E10.8/US$ in 2014. By mid-June 2016
the exchange rate was standing at E15.3/US$. Downward pressures on the currency came
mainly from the effects around the winding up of the US quantitative easing program and
weakening South African economy particularly in the mining industry as a result of
unfavourable labour conditions as well as falling commodity prices.
Inflationary pressures were mainly from increases in the prices of essentials commodities
like food, housing and utilities, transport and other amenities. The consumer inflation levels
have been on an upward trend as depicted in the figure 1 below:
Figure 1: Consumer Inflation Year on Year (2015 – 2016)
2
1.2 Agriculture The 2014/15 and 2015/16 agricultural season have been poor in terms of rainfall performance
(cumulative and distribution) with the latter year being the worst in the last two decades. As part of
the long-term agriculture investment programme, the country has developed a Swaziland National
Agricultural Investment Plan (SNAIP), which spans over a period of 10 years (2015-2025) and covers
the following areas:
1. Natural resources management with a focus on water harvesting and irrigation
development;
2. Improved markets and value chain development;
3. Food supply and hunger reduction with a focus on crop and livestock production
intensification;
4. Agriculture research , extension, training and education with a focus on strengthening
agricultural research and extension services and ;
5. Institutional strengthening and knowledge management with the objective of capacity
development and institutional reform.
1.3 Labour Markets The agricultural sector was hard hit by the drought particularly casual labour (from household
production to industrial level). A number of households could not engage in agricultural (crop)
production while others experienced livestock losses due to feed and water shortages. Casual labour
opportunities from other subsectors that utilize water (such as car wash, smallholder irrigation,
domestic laundry services etc.), suffered significantly due to the drought. The threat of reduced
employment opportunities still lingers on as the drought persists, notwithstanding the fact that at
the time of the current assessment the dry season had set on.
1.4 Water and Sanitation Domestic water shortages remains a challenge, with particular negative effects on human health,
posing increased risk of contracting waterborne diseases. Water and sanitation remain a challenge
of critical importance for the overall food security and health of the population. The use of improved
water sources is at 72% overall with rural areas at 63%. Water treatments for those not having
access to improved water sources at 16.8% (MICS, 2014). The use of improved sanitation at 53%. In
view of this sector being critically affected by the drought a number of cases are projected. Domestic
water supply in the rural areas is of great concern as protected springs and boreholes are drying up.
Potable water scarcity has affected rural and urban domestic supply even in areas previously not
vulnerable to drought and institutions including health facilities and schools.
1.5 Health and Nutrition The health status in Swaziland is below expectations, life expectancy at birth estimated at 54 years
(52 years for males, and 55 years for females) (WHO, 2014). Relative to other middle-income
countries where average life expectancy (at birth) ranges from 63.8 – 72 years for males and 67.9 –
76.2 years for females this is very low. This rate is even lower than that of low-income countries
(60.2 years for males, and 63.1 years for females). Life expectancy at birth dropped from 60 years in
1997 to 45.3 years in 2012 and under-five mortality rate increased from 78 per 1000 live births in
1993 to 105 in 2008. The Swaziland ICDP Country Report noted that the maternal mortality ratio
increased from 229 per 100,000 live births in 1991 to 589 deaths per 100,000 live births in 2007, in

3
spite of the fact that 77% of women aged 15-49 years made at least four visits to antenatal clinics
during pregnancy. The proportion of deliveries attended by skilled health workers was estimated at
82% in 2010, (NHSSP 11, 2014).
Like any other developing country in the world the country is still faced with the double burden of
nutrition. Over the years government working with partners has endeavoured to improve the
nutritional status of the population especially children. Those facing undernutrition during their
most critical period for growth are faced with terrible and irreversible conditions. According to the
MICS (2014), 5% of children under 5 years are underweight, 26% stunted, 2% wasted and 9%
overweight. Immunization coverage at higher levels as 70% of children (12-23) months has received
all the all vaccinations recommended in the national immunization schedule by their first birthday
HIV prevalence among 15-49 year olds is currently estimated at 27.7% (UNAIDS, 2015) and is one of
the highest in the world. The rate is higher among women (31%) than men (20%) (DHS 2007) and
prevalence in women peaks at 49% within the 25-29 age group. Unsafe sex practices,
intergenerational sex, multiple concurrent partners and misconceptions about HIV transmission
account for high levels of HIV prevalence among young persons, pregnant women and other
population groups. Tuberculosis constitutes a major public health problem in the country. With an
estimated TB incidence rate of 1350 per 100,000 population, the country has consistently had the
highest TB burden per capita in the world (WHO 2012). Compared to a 1990 level of 267 per
100,000 population, TB incidence has increased five-fold since then. The TB/HIV co-infection rate
among incident TB cases has remained above 80% (TB Annual Report 2012).
1.6 Education The effects of the drought have not spared the education sector as school feeding programmes,
water and sanitation and curriculum of practical subjects such as agriculture were affected. Water
shortages in schools has greatly affected the implementation of a number of vocational subject such
as agriculture leading to difficulties in teaching and learning of the subjects. The drought has also
exerted much pressure on the school feeding programme as a number of school going children were
now dependent on it as the source of their nutritional needs.

4
2.0 METHODOLOGY
2.1 Objectives The main objective of the annual vulnerability assessment was to generate a current context of
livelihoods and vulnerability both in rural and urban areas and specifically:
I. To understand the status of livelihood sources (income and food sources) in the rural and
urban settings.
II. To determine levels of food insecurity amongst rural and urban populations and estimate
vulnerable populations facing food insecurity.
III. To establish forms of coping mechanisms households adopt during periods of food
insecurity.
IV. To identify and understand underlying causes of food and nutrition insecurity.
V. Identify and recommend appropriate policy interventions to mitigate current and future
impacts of shocks and vulnerability.
2.2 Methodological Approach The 2016 Swaziland vulnerability assessment and analysis exercise was carried out using both
qualitative and quantitative approaches for both urban and rural areas. In total, Swaziland has 10
zones (Rural livelihoods and urban zones) (Map 1)
Given the size and the number of the urban population for each urban area in each region, it
became apparent that for the urban component of the assessment, the focus was only in the two
regions: the Hhohho and Manzini.

5
Map 1: Enumeration Areas Sampled For VAA 2016
A probability proportion to size of these zones from both rural and urban areas was used to select
enumeration areas that were included in the assessment using the sampling frame from the 2007
population and housing census, from the Central Statistical Office. A total number of 12 households
from each numeration area was selected for the assessment using a systematic sampling method
with 2,388 households sampled.
6
2.2.1 Field work Operation and Data Quality The assessment covered both rural and urban areas, as well as integrating nutrition during the
analysis. A total number of 33 enumerators were employed. Out of these enumerators, two teams
were assigned to Manzini and Mbabane, the major part of Swaziland’s urban area. The rest of the
teams were deployed in the four regions of Swaziland: Hhohho, Manzini, Shiselweni and Lubombo.
These teams were covering both rural and urban areas falling within their regions. Each team had a
person assigned to nutrition related issues including measurements of under-fives. Data was
collected using ODK platform (tablets).
2.2.2 Data Processing and Analysis Data cleaning, editing and generation of analysis tables done using SPSS software. Data was
collected using ODK and sent to WFP server almost on real time. Editing and cleaning began as soon
as the files came from the field to avoid uncalled for delays for analysis.
The Swazi VAC has been collecting data using its tool that has HIV proxy variables as well as gender.
In order to integrate gender and HIV in the analysis, these variables formed part of basic variables by
which all analysis were to be cross tabbed.
2.2.3 Report Writing and IPC Acute Analysis The outputs from the assessment were further used to inform the Integrated Food Security Phase
Classification (IPC), as direct and indirect evidence. A dedicated team of IPC TWG worked in
collaboration with the Swazi VAC core team in conducting the IPC analysis of the VAC outputs
incorporating secondary data.
2.3 Integrated Food Security Phase Classification (IPC) Framework The IPC Analytical Framework was used to further classify rural populations into Phases. The IPC
Analytical Framework has Phase 1 that depicts populations that were minimally impacted by the
hazard with up to 80% able to meet their basic food needs. Phase 2 is an indication of a stressed
population minimally meeting their basic food needs but struggling to meet some of their essential
non-food requirements. Phase 3 is a crisis classification with significant proportion of the population
experiencing food consumption gaps. Phase 4 indicate a point where significant share of the
population that are facing an emergency with huge food consumption gaps. Phase 5 is considered as
famine depicting lack of basic food and non-essential basic needs resulting in starvation, death and
destitution. Table 1 below summarises description of all five IPC Phases colour coded to indicate the
severity.

7
Table 1: IPC Phase Classification Chart
Source: IPC Manual Version 2
8
3.0 SECTORAL ANALYSIS
3.1 Seasonal rainfall performance for 2015/16 The 2015/16 season was characterized by the much below long term average rains over most parts
of the country as a consequence of the El Nino induced drought effects that engulfed the entire
Southern African region. This is evident in both temporal rainfall distribution and spatial distribution.
Rainfall dependent sectors of the country's economy experienced severe water constraints and in
the process-incurred lots of revenue losses and some instances, jobs were lost. Grazing areas were
decimated by the prolonged dryness in most parts of the Lowveld and high numbers of cattle died as
result. Subsistence farmers who are reliant only on rain fed farming also experienced immense
reduction in harvest.
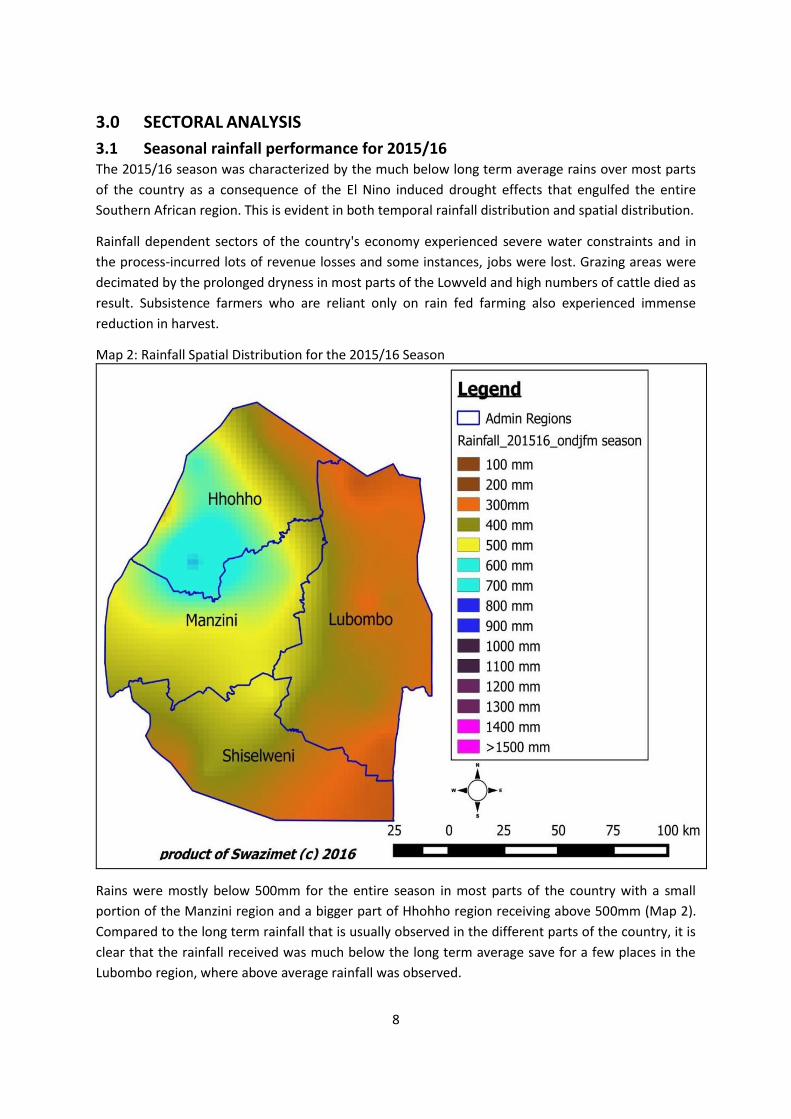
Map 2: Rainfall Spatial Distribution for the 2015/16 Season
Rains were mostly below 500mm for the entire season in most parts of the country with a small
portion of the Manzini region and a bigger part of Hhohho region receiving above 500mm (Map 2).
Compared to the long term rainfall that is usually observed in the different parts of the country, it is
clear that the rainfall received was much below the long term average save for a few places in the
Lubombo region, where above average rainfall was observed.

9
Map 3: 2015/16 Season's Rainfall Departure from Long term Average
Although certain parts of the Hhohho region in the northern Highveld received rainfall in the range
of 700mm, it was not anywhere near the long term average (Map 3). Only a small portion in the
Manzini region recorded above average seasonal rainfall otherwise the whole country received
much below average rainfall.
3.1.1 Temporal rainfall distribution curves The distribution of the rainfall during the season shows that the onset of the season was much
delayed as above average rainfall only fell during the first ten days of December 2015. This was only
one of three occasions when the recorded amounts were above the long-term average, the other
times being the second dekad of January and the first dekad of March 2016. Throughout the bulk of
the season, rains were much below average.

10
Figure 2: National temporal rainfall distribution for the 2015/16 season
3.1.2 Cumulative temporal rainfall curves Generally, the country received below normal cumulative rainfall throughout the whole country
during the 2015/2016 rainfall season and more so below the 2014/ 2015 cumulative rainfall. This is
attributed to the ENSO condition that was prevailing globally and resulted into prolonged dry spells
in the region

11
Figure 3: National cumulative rainfall for the 2015/16 season
The four agro-ecological zones namely; Highveld, Middleveld, Lowveld and Lubombo Plateau
received below average cumulative rainfall during the 2015/16 rainfall season and it was far below
the 2014/15 season and that of the Long-term average (as per Figure 3 above; HV, MV, LV and LP
respectively).
12
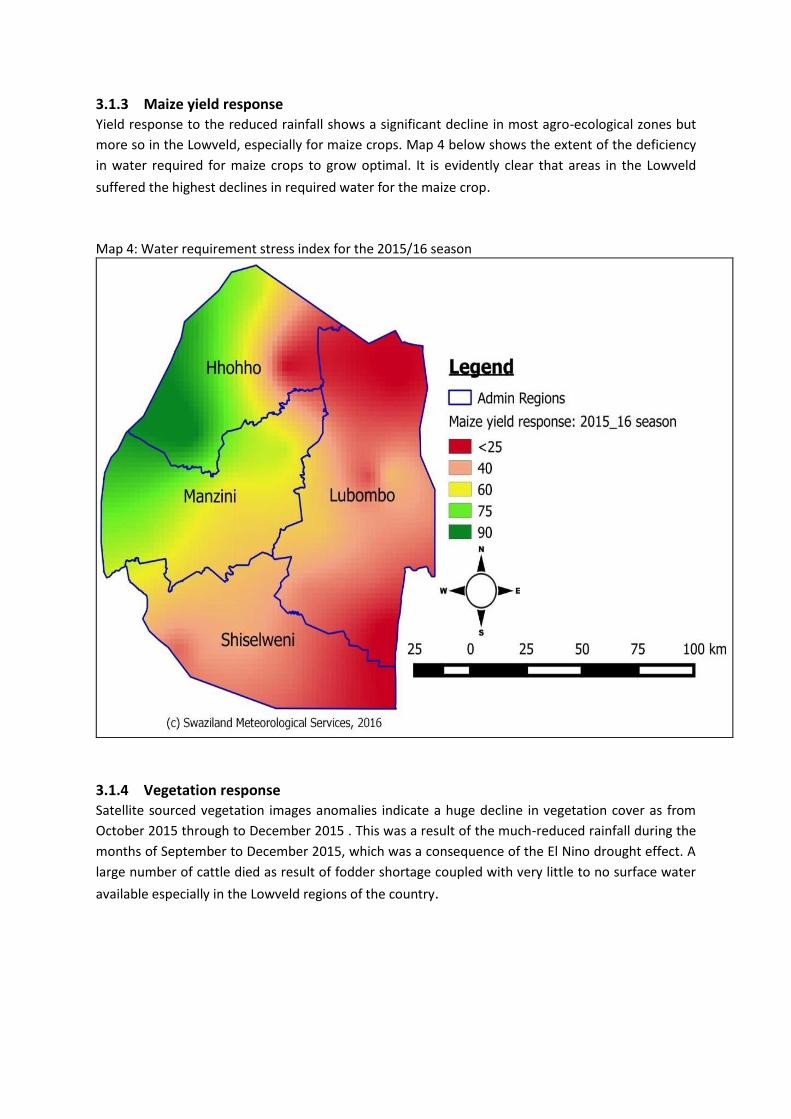
3.1.3 Maize yield response Yield response to the reduced rainfall shows a significant decline in most agro-ecological zones but
more so in the Lowveld, especially for maize crops. Map 4 below shows the extent of the deficiency
in water required for maize crops to grow optimal. It is evidently clear that areas in the Lowveld
suffered the highest declines in required water for the maize crop.
Map 4: Water requirement stress index for the 2015/16 season
3.1.4 Vegetation response Satellite sourced vegetation images anomalies indicate a huge decline in vegetation cover as from
October 2015 through to December 2015 . This was a result of the much-reduced rainfall during the
months of September to December 2015, which was a consequence of the El Nino drought effect. A
large number of cattle died as result of fodder shortage coupled with very little to no surface water
available especially in the Lowveld regions of the country.

13
3.2 Water Availability
3.2.1 Major River Flows Generally water flows was at an all-time low in February 2016 with the rivers originating in the
country such as Mbuluzi and Ngwavuma, the most severely affected. The reduction of up to 65% in
rainfall in the west of Swaziland where the sources of the Mbuluzi and Ngwavuma Rivers are
located, had significant negative effect on river flows. The flow in the rivers have dropped to an all-
time low (0.25m3 and 0m3 per second respectively) in February 2016. This affected dam levels such
as Hawane significantly reducing the supply portable water to Mbabane City and Ngwenya town. In
other areas it affected production in a number of irrigated agricultural production enterprises,
portable water schemes as they struggled to extract from the low flows. In the Ngwavuma River
(Figure 4) water flow reduced to zero during February causing excessive damage to sugarcane fields
around Nsoko.
Figure 4: Mean Monthly water flows in the Ngwavuma River Gauging Station 8 (Lubulini)
Source: Department of Water Resources 2016
Figure 5: Mean Monthly Komati River Flows at Gauging Station 30 (Mananga)
Source: Department of Water Resources 2016

14
Figure 6: Mean Monthly Great Usuthu River flows at Gauging Station 6 (Siphofaneni)
Source: Department of Water Resources 2016
While Usuthu River (Figure 6) and Komati River (Figure 5) flows remained above normal. The Komati
healthy and above normal flows in the Komati river was due to the extensive development of dams
(Maguga), effective river flow control and basin management.
3.2.2 Major Reservoirs The low rainfall in the last two years have significantly reduced water resources in the country. The
general overview was that the major dams’ storage at critically low levels. As of the 20th of February,
2016 major dams’ storage levels were recorded as follows: Hawane Dam 8%, Lubovane Dam at 65%.
Maguga Dam at 31% and Mnjoli Dam at 4.9%.The situation is very critical with the Mnjoli dam where
water extraction has been completely suspended since the dam is below dead storage. Reduced
water storage at Mnjoli Dam to less than 5%, resulted in 80% reduction of sugarcane irrigation at
Simunye plantations and surrounding estates greatly affecting sugarcane production.
Figure 7: Remaining Water as a percentage of full storage capacity in Mnjoli and Maguga dam March 2016
Source: Ministry of Natural Resources and Energy, 2016
Generally, the flow in all of the country’s rivers is critically low as compared to previous seasons.
Earth dams are also at critical levels with a majority running completely dry. Springs and boreholes
are also indicating high level of dryness as reported by the community and household surveys. The
majority of these groundwater sources are depleted. This is as a result of insufficient rainfall and
less recharge of groundwater sources. High temperatures are also contributing to this acute water
15
scarcity.
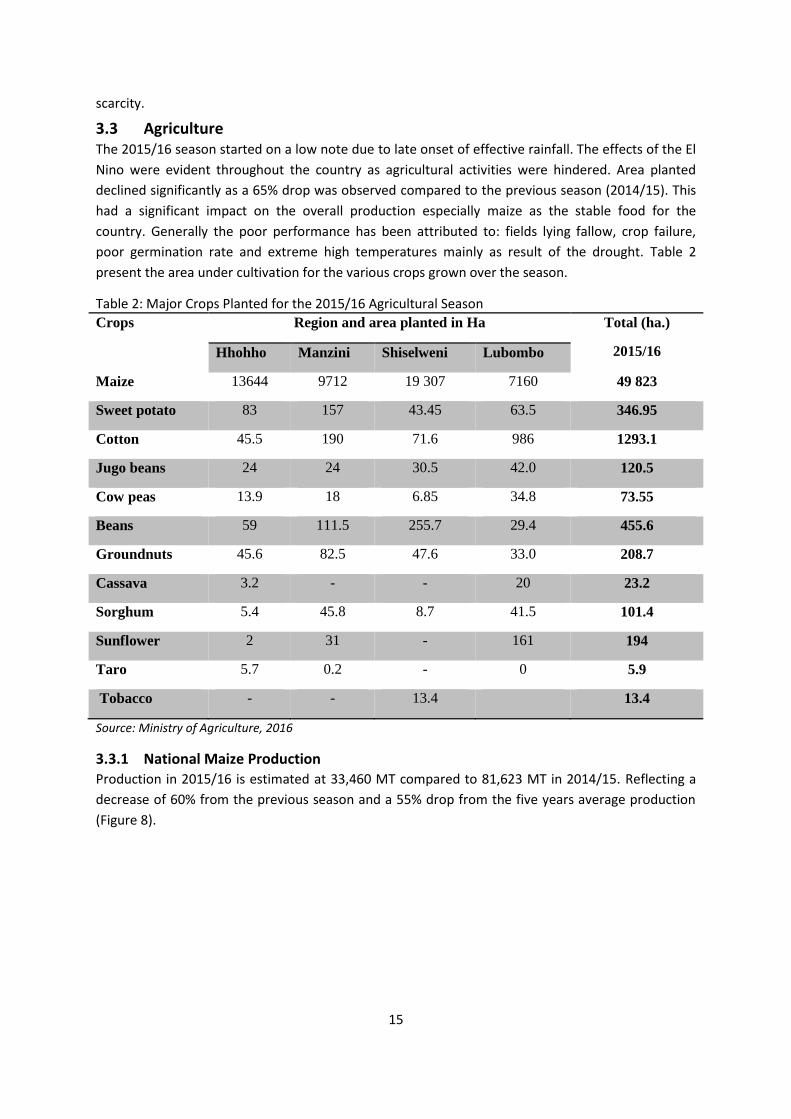
3.3 Agriculture The 2015/16 season started on a low note due to late onset of effective rainfall. The effects of the El
Nino were evident throughout the country as agricultural activities were hindered. Area planted
declined significantly as a 65% drop was observed compared to the previous season (2014/15). This
had a significant impact on the overall production especially maize as the stable food for the
country. Generally the poor performance has been attributed to: fields lying fallow, crop failure,
poor germination rate and extreme high temperatures mainly as result of the drought. Table 2
present the area under cultivation for the various crops grown over the season.
Table 2: Major Crops Planted for the 2015/16 Agricultural Season
Crops Region and area planted in Ha Total (ha.)
2015/16 Hhohho Manzini Shiselweni Lubombo
Maize 13644 9712 19 307 7160 49 823
Sweet potato 83 157 43.45 63.5 346.95
Cotton 45.5 190 71.6 986 1293.1
Jugo beans 24 24 30.5 42.0 120.5
Cow peas 13.9 18 6.85 34.8 73.55
Beans 59 111.5 255.7 29.4 455.6
Groundnuts 45.6 82.5 47.6 33.0 208.7
Cassava 3.2 - - 20 23.2
Sorghum 5.4 45.8 8.7 41.5 101.4
Sunflower 2 31 - 161 194
Taro 5.7 0.2 - 0 5.9
Tobacco - - 13.4 13.4
Source: Ministry of Agriculture, 2016
3.3.1 National Maize Production Production in 2015/16 is estimated at 33,460 MT compared to 81,623 MT in 2014/15. Reflecting a
decrease of 60% from the previous season and a 55% drop from the five years average production
(Figure 8).

16
Figure 8: National Maize Production Trends (MT) 2012-2016
Source: Ministry of Agriculture, 2016
Maize production trends over the last 10 years have shown that the country has been unable to
meet its national maize requirement (Figure 9). The production season 2006/07 to 2010/11 maize
production was steadily increasing positively, and in 2011/12 it dropped and slowly picked in
2012/13, and reached its peak in 2013/14 (bumper harvest). Even the 2013/14 bumper harvest
could not meet the national requirement. The 2015/16 season is the worst season ever recorded in
the history of maize production in the country. Currently maize requirement is at 132,780.71 MT,
harvest is estimated at 33,460.00 MT, and the gap is 99,320 MT (66%).
Drop in production was observed on other crops mainly due to the drought when compared to the 2014/15 agricultural season. The dry conditions have also limited the type and variety of crops grown in a number of areas in the country. Crop failure and some households decided to concentrate on maize and some left their fields fallow.
17
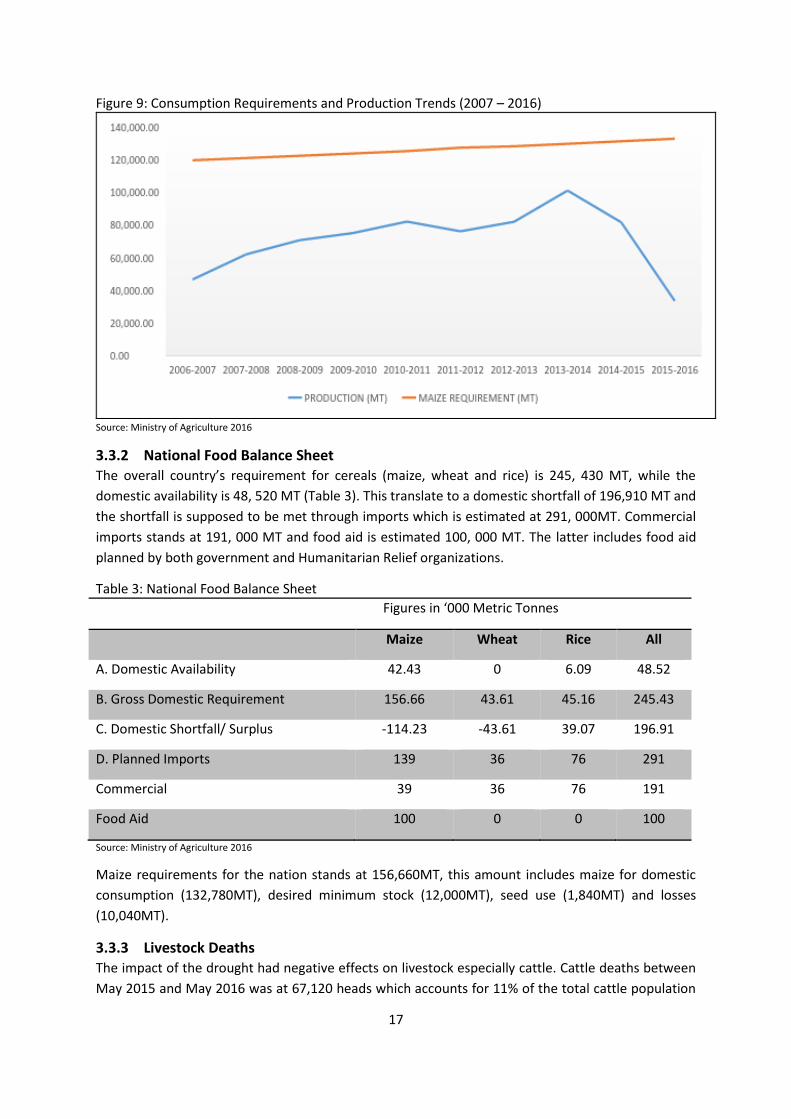
Figure 9: Consumption Requirements and Production Trends (2007 – 2016)
Source: Ministry of Agriculture 2016
3.3.2 National Food Balance Sheet The overall country’s requirement for cereals (maize, wheat and rice) is 245, 430 MT, while the
domestic availability is 48, 520 MT (Table 3). This translate to a domestic shortfall of 196,910 MT and
the shortfall is supposed to be met through imports which is estimated at 291, 000MT. Commercial
imports stands at 191, 000 MT and food aid is estimated 100, 000 MT. The latter includes food aid
planned by both government and Humanitarian Relief organizations.
Table 3: National Food Balance Sheet
Figures in ‘000 Metric Tonnes
Maize Wheat Rice All
A. Domestic Availability 42.43 0 6.09 48.52
B. Gross Domestic Requirement 156.66 43.61 45.16 245.43
C. Domestic Shortfall/ Surplus -114.23 -43.61 39.07 196.91
D. Planned Imports 139 36 76 291
Commercial 39 36 76 191
Food Aid 100 0 0 100
Source: Ministry of Agriculture 2016
Maize requirements for the nation stands at 156,660MT, this amount includes maize for domestic
consumption (132,780MT), desired minimum stock (12,000MT), seed use (1,840MT) and losses
(10,040MT).
3.3.3 Livestock Deaths The impact of the drought had negative effects on livestock especially cattle. Cattle deaths between
May 2015 and May 2016 was at 67,120 heads which accounts for 11% of the total cattle population

18
compared to the annual cattle mortality average of 5.9%. The Lubombo region had the highest cattle
deaths 18%, compared to Shiselweni region 15%, Manzini region 7% and Hhohho with the lowest 4%
(Figure 10).
Figure 10: Proportion of Cattle Deaths by Region
Source: Ministry of Agriculture 2016
In March 2016 the cattle deaths were minimised (Figure 11) since veld conditions had improved
after receiving some rains and other intervention by the Ministry of Agriculture that include the
supply of hay, bales and water distribution to the affected areas.
Prospects from Early Warning signs predicts that from June 2016, cattle deaths might be on the rise
again since the grazing conditions are starting to deteriorate, pasture conditions dry and hay/bales
are becoming scarce.
Figure 11: Cattle Deaths, May 2015 to May 2016
Source: Ministry of Agriculture 2016
19
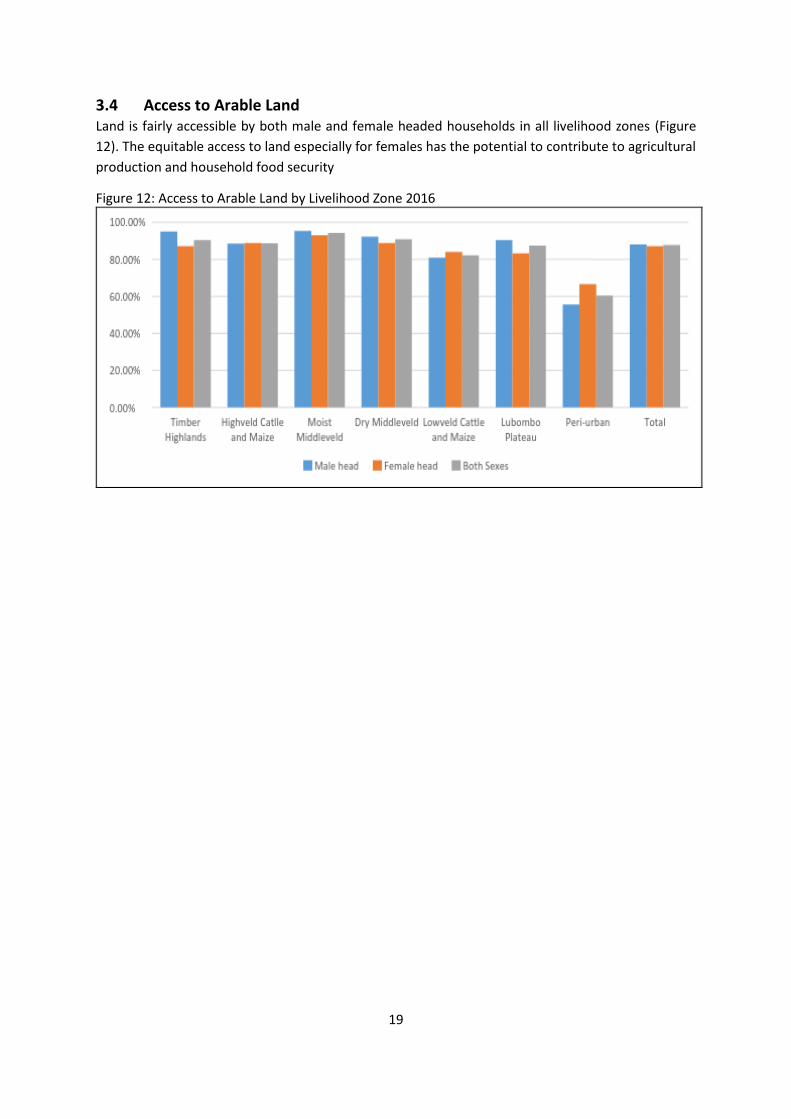
3.4 Access to Arable Land Land is fairly accessible by both male and female headed households in all livelihood zones (Figure
12). The equitable access to land especially for females has the potential to contribute to agricultural
production and household food security
Figure 12: Access to Arable Land by Livelihood Zone 2016
20
4.0 KEY FINDINGS
4.1 Food Security
4.1.1 Food Consumption Score
The survey collected information on household food consumption for analysis of the Food
Consumption Score (FCS), which is used as a proxy for household food security. The FCS is a measure
of dietary diversity, food frequency and the relative nutritional importance of the food items
consumed by household members over a recall period of seven days. A high FCS increases the
probability that a household’s nutrient intake is adequate. The FCS is used to classify households into
three groups: poor, borderline or acceptable food consumption, by aggregating households that
have similar dietary patterns and access to food. The food consumption score for Swaziland is
reported based on the standard thresholds: Poor food consumption (0—21), Borderline food
consumption (21.5—35), Acceptable food consumption (> 35).
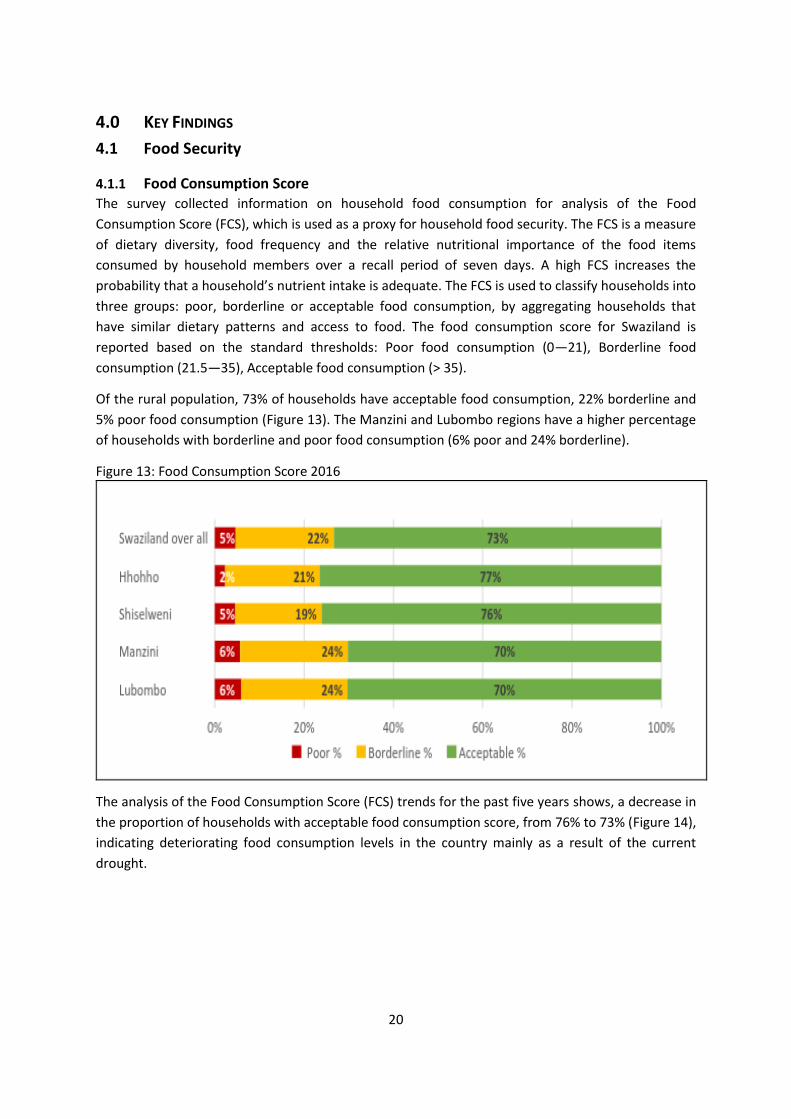
Of the rural population, 73% of households have acceptable food consumption, 22% borderline and
5% poor food consumption (Figure 13). The Manzini and Lubombo regions have a higher percentage
of households with borderline and poor food consumption (6% poor and 24% borderline).
Figure 13: Food Consumption Score 2016
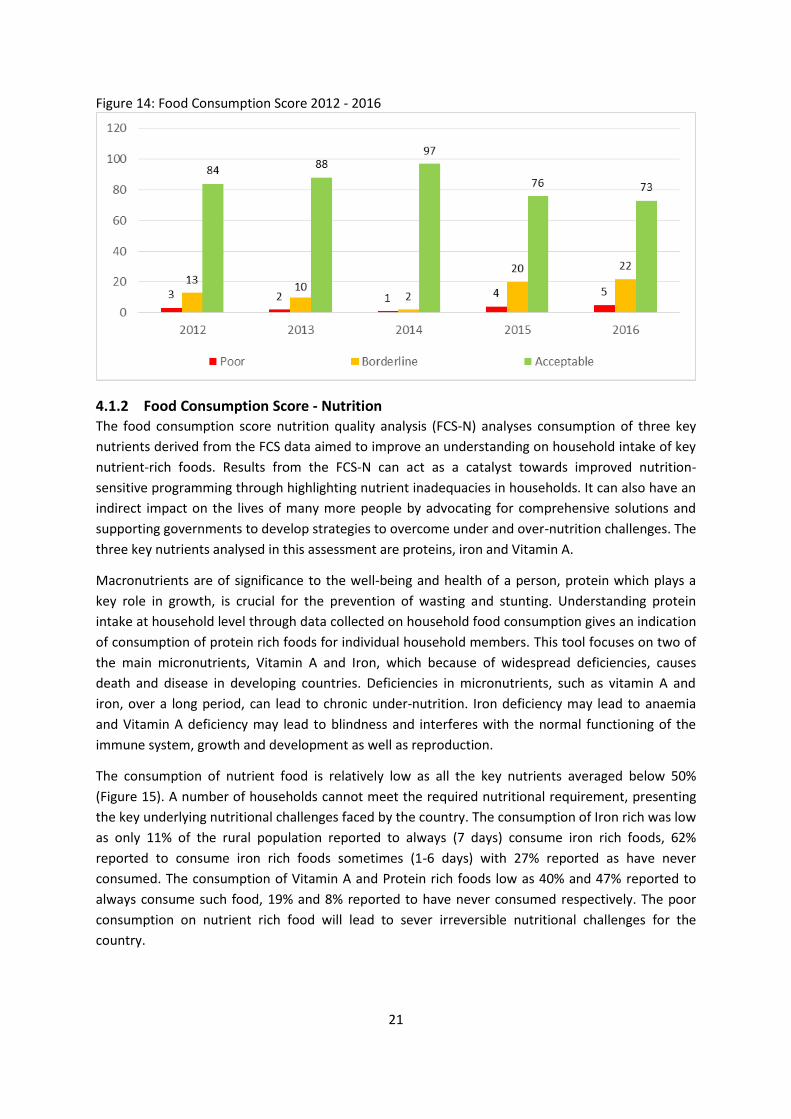
The analysis of the Food Consumption Score (FCS) trends for the past five years shows, a decrease in
the proportion of households with acceptable food consumption score, from 76% to 73% (Figure 14),
indicating deteriorating food consumption levels in the country mainly as a result of the current
drought.
21
Figure 14: Food Consumption Score 2012 - 2016
4.1.2 Food Consumption Score - Nutrition The food consumption score nutrition quality analysis (FCS-N) analyses consumption of three key
nutrients derived from the FCS data aimed to improve an understanding on household intake of key
nutrient-rich foods. Results from the FCS-N can act as a catalyst towards improved nutrition-
sensitive programming through highlighting nutrient inadequacies in households. It can also have an
indirect impact on the lives of many more people by advocating for comprehensive solutions and
supporting governments to develop strategies to overcome under and over-nutrition challenges. The
three key nutrients analysed in this assessment are proteins, iron and Vitamin A.
Macronutrients are of significance to the well-being and health of a person, protein which plays a
key role in growth, is crucial for the prevention of wasting and stunting. Understanding protein
intake at household level through data collected on household food consumption gives an indication
of consumption of protein rich foods for individual household members. This tool focuses on two of
the main micronutrients, Vitamin A and Iron, which because of widespread deficiencies, causes
death and disease in developing countries. Deficiencies in micronutrients, such as vitamin A and
iron, over a long period, can lead to chronic under-nutrition. Iron deficiency may lead to anaemia
and Vitamin A deficiency may lead to blindness and interferes with the normal functioning of the
immune system, growth and development as well as reproduction.
The consumption of nutrient food is relatively low as all the key nutrients averaged below 50%
(Figure 15). A number of households cannot meet the required nutritional requirement, presenting
the key underlying nutritional challenges faced by the country. The consumption of Iron rich was low
as only 11% of the rural population reported to always (7 days) consume iron rich foods, 62%
reported to consume iron rich foods sometimes (1-6 days) with 27% reported as have never
consumed. The consumption of Vitamin A and Protein rich foods low as 40% and 47% reported to
always consume such food, 19% and 8% reported to have never consumed respectively. The poor
consumption on nutrient rich food will lead to sever irreversible nutritional challenges for the
country.

22
Figure 15: Food Consumption Score-Nutrition 2016
4.2 Household Dietary Diversity Dietary diversity is a qualitative measure of food consumption that reflects households’ access to a
variety of foods, and is also a proxy for nutrient adequacy of the diet of individuals. The household
dietary diversity score (HDDS) is meant to reflect, in a snapshot form, the economic ability of a
household to access a variety of foods. The HDDS is meant to provide an indication of household
economic access to food, thus items that require household resources to obtain, such as
condiments, sugar and sugary foods, and beverages, are included in the score. It represents the
number of food groups consumed over a given period. It targets individuals, households and
women. The International Food Policy Research Institute (IFPRI) thresholds for Household Dietary
Diversity Score (DDS) are used in this report: 6+ = good dietary diversity, 4.5–6 = medium dietary
diversity, <4.5 = low dietary diversity.
Overall, 31% of the total rural population has low HDDS, with 54% at medium and 15% with high
dietary diversity (Figure 16). The Lubombo region (35%) had the highest number of households
(35%) with low HDDS implying that households were consuming very few food groups such as
cereals and pulses, resulting in poor nutrition. Shiselweni and Manzini had above 30% of households
with poor HDDS. The Shiselweni region and the Hhohho region had the highest percentage of
households with medium HDDS, which places the households at risk as due to the number of shocks
faced households might fall to the low HDDS.
23
Figure 16: Household Dietary Diversity Groups
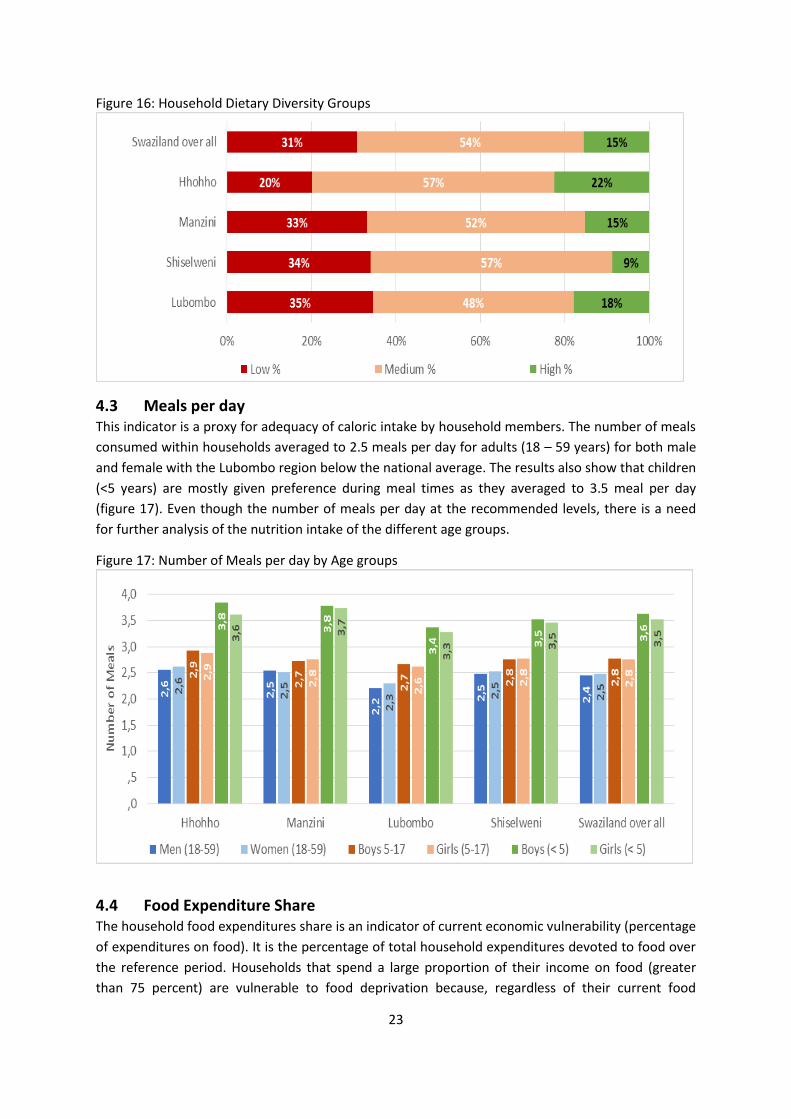
4.3 Meals per day This indicator is a proxy for adequacy of caloric intake by household members. The number of meals
consumed within households averaged to 2.5 meals per day for adults (18 – 59 years) for both male
and female with the Lubombo region below the national average. The results also show that children
(<5 years) are mostly given preference during meal times as they averaged to 3.5 meal per day
(figure 17). Even though the number of meals per day at the recommended levels, there is a need
for further analysis of the nutrition intake of the different age groups.
Figure 17: Number of Meals per day by Age groups
4.4 Food Expenditure Share The household food expenditures share is an indicator of current economic vulnerability (percentage
of expenditures on food). It is the percentage of total household expenditures devoted to food over
the reference period. Households that spend a large proportion of their income on food (greater
than 75 percent) are vulnerable to food deprivation because, regardless of their current food

24
consumption status, any reduction in income would likely be accompanied by a reduction in food
consumption or the quality of food eaten.
Overall, 21% of households spends more than 75% of their income on food (Figure 18), with the
Manzini (26%) and Shiselweni (25%) region having a higher percentage of households in this
category. Rapid inflationary changes influencing prices will have a greater on household’s purchasing
power, reducing expenditure on non-food items and savings, predisposing households to further
food security shock increasing their vulnerability. The Hhohho region has the highest proportion of
households spending less than 50% of their income on food (63.6%). This can be attributed that
mainly food sources from the region are from own production. This allows investment on productive
assets key for the resilience of households to food shocks.
Figure 18: Household Food Expenditure Share
4.5 Shock and Coping Strategies The Coping Strategy Index (CSI) measures behaviour, the strategies that people or households
employ when they cannot access enough food. These coping strategies are easy to observe. An
increased CSI indicates a worsening food security condition.
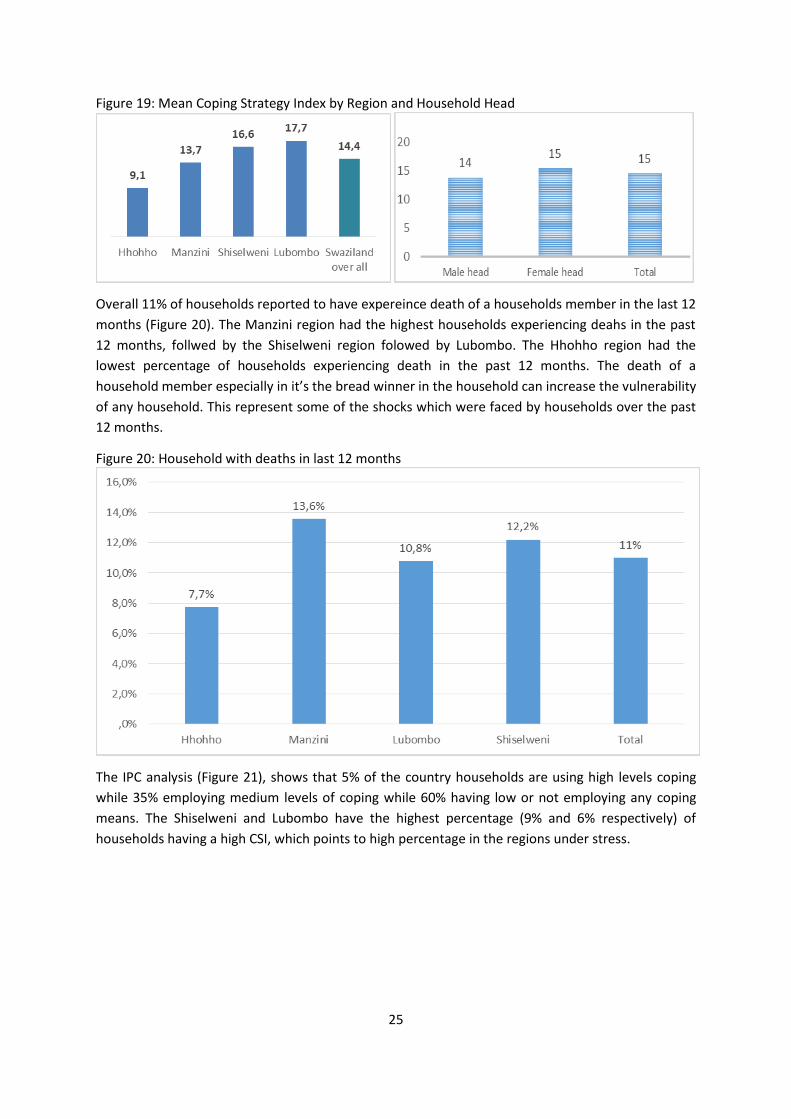
The Lubombo region (Figure 19) had the highest mean coping strategy index 17.7, above the
national average of 14.4. This was followed by the Shiselweni region (16.6). This indicates that
households in the regions were employing more negative higher coping strategies as a result of the
shocks affecting households. The regions faced higher food insecurities when compared to the other
regions mainly due to the impact of the drought and other shocks i.e. death of a household member.
The level of negative coping in Manzini and Hhohho regions are lower than the national average at
13.7 and 9.0 respectively. Female headed households have a higher CSI (15) compared to male
headed households (CSI 14) indicating the varying vulnerability degrees due to gender. This also
represents the varying degrees in the impact of shocks and the implemented coping strategies in the
various households and their response.
25
Figure 19: Mean Coping Strategy Index by Region and Household Head
Overall 11% of households reported to have expereince death of a households member in the last 12
months (Figure 20). The Manzini region had the highest households experiencing deahs in the past
12 months, follwed by the Shiselweni region folowed by Lubombo. The Hhohho region had the
lowest percentage of households experiencing death in the past 12 months. The death of a
household member especially in it’s the bread winner in the household can increase the vulnerability
of any household. This represent some of the shocks which were faced by households over the past
12 months.
Figure 20: Household with deaths in last 12 months
The IPC analysis (Figure 21), shows that 5% of the country households are using high levels coping
while 35% employing medium levels of coping while 60% having low or not employing any coping
means. The Shiselweni and Lubombo have the highest percentage (9% and 6% respectively) of
households having a high CSI, which points to high percentage in the regions under stress.

26
Figure 21: CSI IPC Categories
4.6 Livelihood Coping Strategies The livelihood coping strategies are used to better understand longer-term coping capacity of
households and are divided into 3 categories i.e. Stress, Crisis and Emergency. Responses are used to
understand the stress and insecurity faced by households and describes their capacity regarding
future productivity. Unlike the consumption based coping strategies, the recall period is 30 days
instead of 7, and it does not capture the number of times each strategy was undertaken.
Figure 22: Livelihood Coping Strategies
Close to 21% of the households surveyed stated that they are employing emergency coping
strategies such as selling of productive assets. Emergency coping strategies are more difficult to
reverse and more dramatic in nature. 5% of households are employing crisis strategies such as
selling productive assets directly reduce future productivity, including human capital formation. 30%
of households are employing stress strategies such as spending savings, selling of assets and 44% of
households are not using any negative coping strategies. The Lubombo region reported the highest
percentage (39%) of households employing emergency coping strategies. Figure 22 shows the
proportion of households who employ livelihood coping strategies by administrative regions.

27
Figure 23: Household Assets Depletion and Food Security Status by Livelihood Zone
Figure 23 represent a summary of assets depletions and household food security levels by livelihood
zones. As in line with Figure 19, the Lowveld cattle and Maize and the Lubombo Plateau employed
higher emergency coping strategies and had the highest food insecure population. The marginally
food secured households averaged above 40% in all the livelihood zones besides the Peri-urban.
4.7 Water and Sanitation Domestic water shortages remains a challenge, with particular negative effects on human health,
posing increased risk of contracting waterborne diseases. Water, sanitation and hygiene remain a
challenge, where low access to drinking water, precarious household health environment, and poor
feeding practices are wide-spread across the country. Domestic water supply in the rural areas of
Lubombo and Shiselweni is of great concern as protected springs and boreholes are drying up.
Potable water scarcity has affected rural and urban domestic supply even in areas previously not
vulnerable to drought and institutions including health facilities and schools.
4.7.1 Use of improved water source Overall, 63% of the interviewed households uses improved water sources for domestic purposes.
Manzini region is considerably lower than the other regions as only 58% of the households get
domestic water supply from improved sources. Hhohho region has the highest proportion of
households (71%) with access to improved water sources (Figure 24). The Shiselweni region is
worse than the other regions; as 56%of households gets drinking water from an improved
source.

28
Figure 24: Use of Improved Water sources by Region
4.7.2 Household Water Availability, Distance and Use Overall, 31.7% of the population have access to water within the household, while 42.5% travel
between 0 - <0.5km to access water. Those showing poor access to water (distance >2km) accounts
for 2.3%, with 5.2% between 1 - <2km. the Hhohho region has the highest percentage (53.4%) of
households with access within the household, while the Shiselweni (21.9%) has the lowest. The
Lubombo region shows a higher percentage of households with poor access as 4.1% travel more
than 2 km to draw water (Table 4).
Table 4: Distance to water source (km) by region Administrative Region
0 - <0.5km 0.5 - <1km 1 - <2km 2 km and above Don't know Within the house
Hhohho 30.9% 8.4% 3.4% 3.7% .3% 53.4%
Manzini 39.8% 20.1% 6.8% 1.9% 31.4%
Lubombo 45.7% 20.4% 7.1% 4.1% .4% 22.3%
Shiselweni 51.7% 21.9% 3.8% .5% .3% 21.9%
Total 42.5% 18.1% 5.2% 2.3% .2% 31.7%
Table 5 below shows that water access across the wealth groups varies significantly. The poor have
the least access to water within the house (11.7%), however 54.1% of poor households access water
within 500 meters.
29
Table 5: Distance to water by Wealth Index Quintiles Wealth index quintiles
0 - <0.5km 0.5 - <1km 1 - <2km 2 km and above
Don't know Within the house
Poorest 54.1% 26.7% 5.6% 1.9% 11.7%
Second 50.0% 20.7% 6.8% 1.9% .4% 20.3%
Middle 48.9% 13.2% 4.5% 3.4% .4% 29.7%
Fourth 38.3% 21.8% 6.4% 3.4% 30.1%
Richest 21.1% 8.3% 2.6% 1.1% .4% 66.5%
Total 42.5% 18.1% 5.2% 2.3% .2% 31.7%
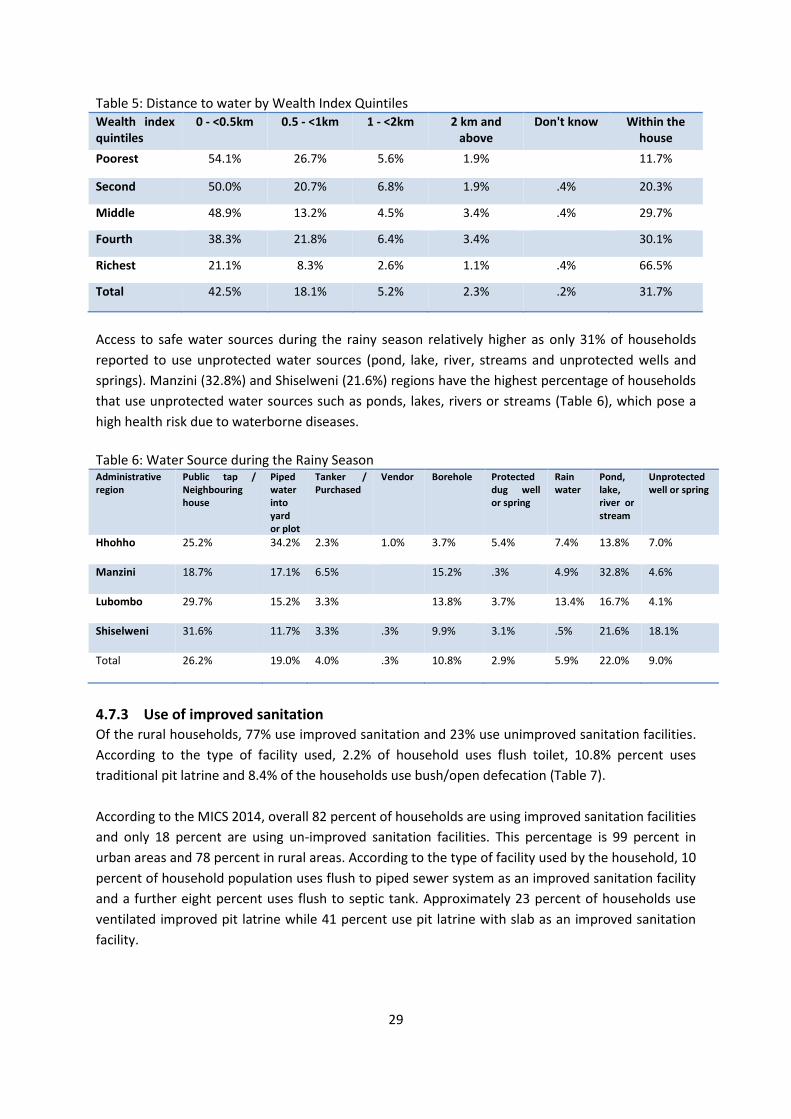
Access to safe water sources during the rainy season relatively higher as only 31% of households
reported to use unprotected water sources (pond, lake, river, streams and unprotected wells and
springs). Manzini (32.8%) and Shiselweni (21.6%) regions have the highest percentage of households
that use unprotected water sources such as ponds, lakes, rivers or streams (Table 6), which pose a
high health risk due to waterborne diseases.
Table 6: Water Source during the Rainy Season Administrative region
Public tap / Neighbouring house
Piped water into yard or plot
Tanker / Purchased
Vendor Borehole Protected dug well or spring
Rain water
Pond, lake, river or stream
Unprotected well or spring
Hhohho 25.2% 34.2% 2.3% 1.0% 3.7% 5.4% 7.4% 13.8% 7.0%
Manzini 18.7% 17.1% 6.5% 15.2% .3% 4.9% 32.8% 4.6%
Lubombo 29.7% 15.2% 3.3% 13.8% 3.7% 13.4% 16.7% 4.1%
Shiselweni 31.6% 11.7% 3.3% .3% 9.9% 3.1% .5% 21.6% 18.1%
Total 26.2% 19.0% 4.0% .3% 10.8% 2.9% 5.9% 22.0% 9.0%
4.7.3 Use of improved sanitation Of the rural households, 77% use improved sanitation and 23% use unimproved sanitation facilities.
According to the type of facility used, 2.2% of household uses flush toilet, 10.8% percent uses
traditional pit latrine and 8.4% of the households use bush/open defecation (Table 7).
According to the MICS 2014, overall 82 percent of households are using improved sanitation facilities
and only 18 percent are using un-improved sanitation facilities. This percentage is 99 percent in
urban areas and 78 percent in rural areas. According to the type of facility used by the household, 10
percent of household population uses flush to piped sewer system as an improved sanitation facility
and a further eight percent uses flush to septic tank. Approximately 23 percent of households use
ventilated improved pit latrine while 41 percent use pit latrine with slab as an improved sanitation
facility.

30
Table 7: Type of Sanitation Facility by Region (%) Administrative region
Flush latrine Ventilated Improved Pit (VIP) Latrine
Traditional pit latrine
Open pit (no walls)
Bush
Hhohho 4.4 83.9 4.4 2.3 5.0
Manzini 1.9 70.7 14.1 4.6 8.7
Lubombo 1.5 76.2 10.4 5.2 6.7
Shiselweni .8 69.0 14.2 2.8 13.2
Total 2.2 75 10.8 3.7 8.4
The poor and middle quintile has no access to flush sanitary facilities, while 28.2% of the poor uses
the bush/open defecation. The findings has shown that the poorest category is the leading wealth
index quintile in terms of households who are using the bush as the type of toilet facility (28.2%)
followed by the second category with 9.4% household uses the bush (Table 8).
Table 8: Type of Sanitary Facility by Wealth Index Quintile (%)
Wealth index quintiles
Flush latrine Ventilated Improved Pit (VIP) Latrine
Traditional pit latrine
Open pit (no walls)
Bush
Poorest 60.9% 3.0% 7.9% 28.2%
Second .4% 80.5% 4.5% 5.3% 9.4%
Middle 82.0% 10.5% 3.0% 4.5%
Fourth 1.5% 82.0% 13.9% 1.1% 1.5%
Richest 8.3% 66.2% 24.1% 1.1% .4%
Total 2.2% 75% 10.8% 3.7% 8.4%
4.8 Health Household food insecurity has effects on health and development of children and adults alike, which
leads to poor health, iron deficiencies, developmental risks and behaviour problems. Good health is
dependent on the daily intake of nutrients over the lifespan of the population.
4.8.1 Morbidity
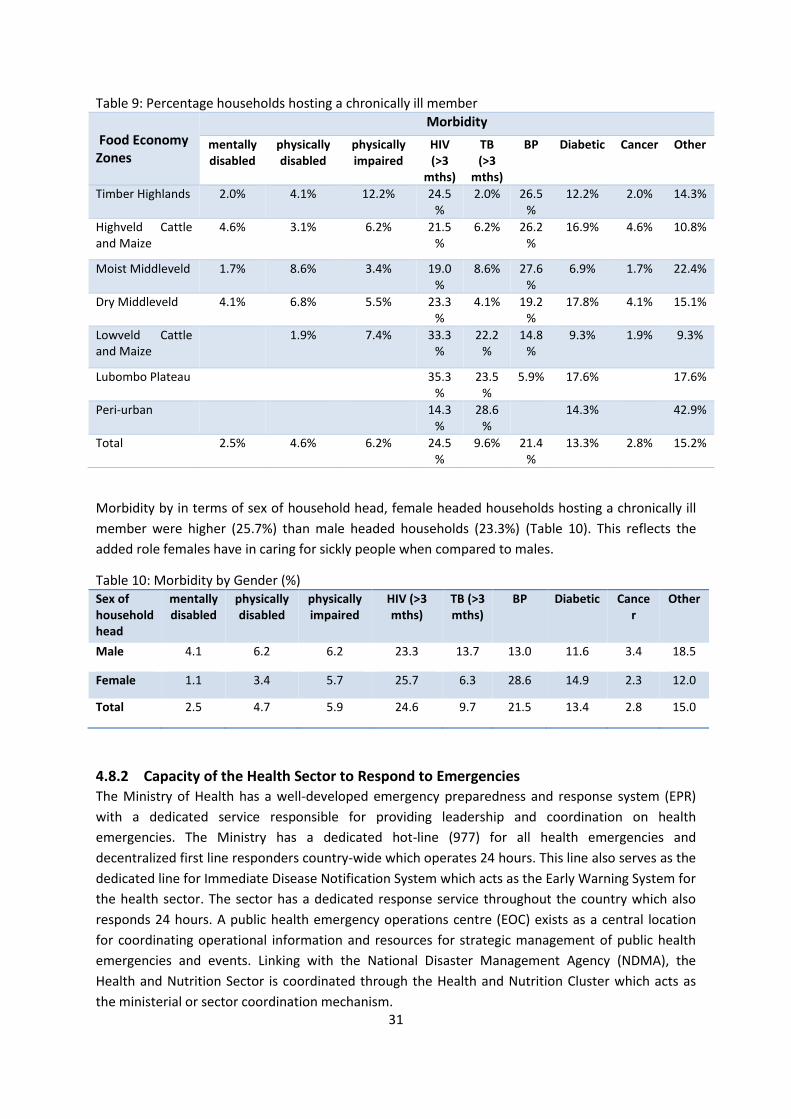
Overall, 24.4 % of the households are hosting a member with chronic illnesses (HIV-related >3
months), the Lubombo Plateau is the leading with 35.3% followed by Lowveld Cattle and Maize with
33.3% of households hosting a chronically ill member. In the Dry Middleveld 23.3 percent of
households have chronically ill members, 21 percent are in the Highveld Cattle and Maize and the
Moist Middle Veld has only 19 percent of households hosting a chronically ill member (Table 9).
31
Table 9: Percentage households hosting a chronically ill member
Food Economy Zones
Morbidity
mentally disabled
physically disabled
physically impaired
HIV (>3
mths)
TB (>3
mths)
BP Diabetic Cancer Other
Timber Highlands 2.0% 4.1% 12.2% 24.5%
2.0% 26.5%
12.2% 2.0% 14.3%
Highveld Cattle and Maize
4.6% 3.1% 6.2% 21.5%
6.2% 26.2%
16.9% 4.6% 10.8%
Moist Middleveld 1.7% 8.6% 3.4% 19.0%
8.6% 27.6%
6.9% 1.7% 22.4%
Dry Middleveld 4.1% 6.8% 5.5% 23.3%
4.1% 19.2%
17.8% 4.1% 15.1%
Lowveld Cattle and Maize
1.9% 7.4% 33.3%
22.2%
14.8%
9.3% 1.9% 9.3%
Lubombo Plateau 35.3%
23.5%
5.9% 17.6% 17.6%
Peri-urban 14.3%
28.6%
14.3% 42.9%
Total 2.5% 4.6% 6.2% 24.5%
9.6% 21.4%
13.3% 2.8% 15.2%
Morbidity by in terms of sex of household head, female headed households hosting a chronically ill
member were higher (25.7%) than male headed households (23.3%) (Table 10). This reflects the
added role females have in caring for sickly people when compared to males.
Table 10: Morbidity by Gender (%) Sex of household head
mentally disabled
physically disabled
physically impaired
HIV (>3 mths)
TB (>3 mths)
BP Diabetic Cancer
Other
Male 4.1 6.2 6.2 23.3 13.7 13.0 11.6 3.4 18.5
Female 1.1 3.4 5.7 25.7 6.3 28.6 14.9 2.3 12.0
Total 2.5 4.7 5.9 24.6 9.7 21.5 13.4 2.8 15.0
4.8.2 Capacity of the Health Sector to Respond to Emergencies The Ministry of Health has a well-developed emergency preparedness and response system (EPR)
with a dedicated service responsible for providing leadership and coordination on health
emergencies. The Ministry has a dedicated hot-line (977) for all health emergencies and
decentralized first line responders country-wide which operates 24 hours. This line also serves as the
dedicated line for Immediate Disease Notification System which acts as the Early Warning System for
the health sector. The sector has a dedicated response service throughout the country which also
responds 24 hours. A public health emergency operations centre (EOC) exists as a central location
for coordinating operational information and resources for strategic management of public health
emergencies and events. Linking with the National Disaster Management Agency (NDMA), the
Health and Nutrition Sector is coordinated through the Health and Nutrition Cluster which acts as
the ministerial or sector coordination mechanism.
32
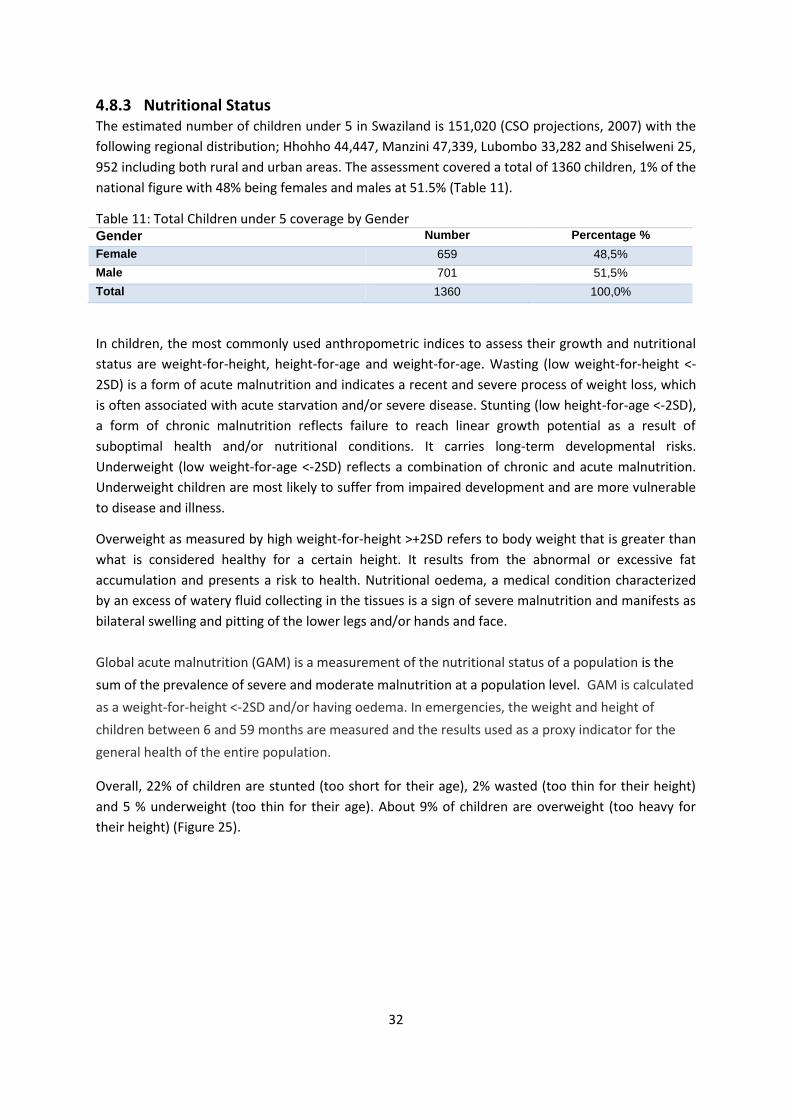
4.8.3 Nutritional Status The estimated number of children under 5 in Swaziland is 151,020 (CSO projections, 2007) with the
following regional distribution; Hhohho 44,447, Manzini 47,339, Lubombo 33,282 and Shiselweni 25,
952 including both rural and urban areas. The assessment covered a total of 1360 children, 1% of the
national figure with 48% being females and males at 51.5% (Table 11).
Table 11: Total Children under 5 coverage by Gender Gender Number Percentage %
Female 659 48,5%
Male 701 51,5%
Total 1360 100,0%
In children, the most commonly used anthropometric indices to assess their growth and nutritional
status are weight-for-height, height-for-age and weight-for-age. Wasting (low weight-for-height <-
2SD) is a form of acute malnutrition and indicates a recent and severe process of weight loss, which
is often associated with acute starvation and/or severe disease. Stunting (low height-for-age <-2SD),
a form of chronic malnutrition reflects failure to reach linear growth potential as a result of
suboptimal health and/or nutritional conditions. It carries long-term developmental risks.
Underweight (low weight-for-age <-2SD) reflects a combination of chronic and acute malnutrition.
Underweight children are most likely to suffer from impaired development and are more vulnerable
to disease and illness.
Overweight as measured by high weight-for-height >+2SD refers to body weight that is greater than
what is considered healthy for a certain height. It results from the abnormal or excessive fat
accumulation and presents a risk to health. Nutritional oedema, a medical condition characterized
by an excess of watery fluid collecting in the tissues is a sign of severe malnutrition and manifests as
bilateral swelling and pitting of the lower legs and/or hands and face.
Global acute malnutrition (GAM) is a measurement of the nutritional status of a population is the
sum of the prevalence of severe and moderate malnutrition at a population level. GAM is calculated
as a weight-for-height <-2SD and/or having oedema. In emergencies, the weight and height of
children between 6 and 59 months are measured and the results used as a proxy indicator for the
general health of the entire population.
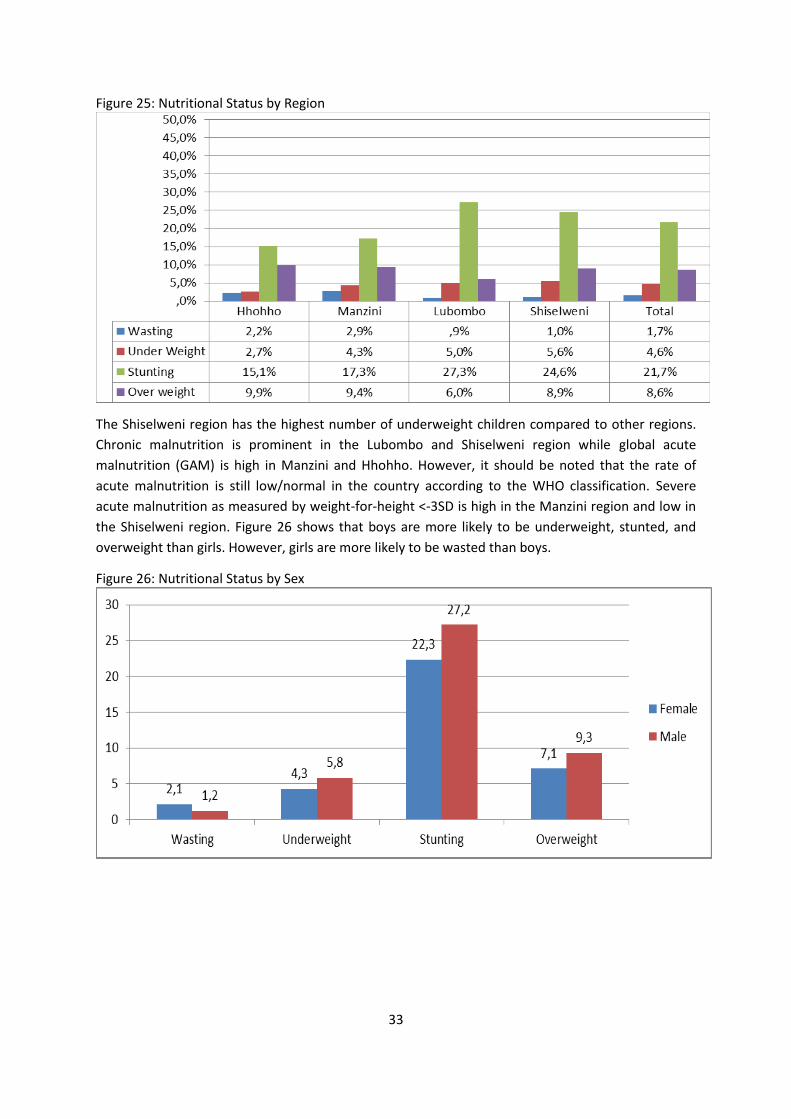
Overall, 22% of children are stunted (too short for their age), 2% wasted (too thin for their height)
and 5 % underweight (too thin for their age). About 9% of children are overweight (too heavy for
their height) (Figure 25).
33
Figure 25: Nutritional Status by Region
The Shiselweni region has the highest number of underweight children compared to other regions.
Chronic malnutrition is prominent in the Lubombo and Shiselweni region while global acute
malnutrition (GAM) is high in Manzini and Hhohho. However, it should be noted that the rate of
acute malnutrition is still low/normal in the country according to the WHO classification. Severe
acute malnutrition as measured by weight-for-height <-3SD is high in the Manzini region and low in
the Shiselweni region. Figure 26 shows that boys are more likely to be underweight, stunted, and
overweight than girls. However, girls are more likely to be wasted than boys.
Figure 26: Nutritional Status by Sex
34
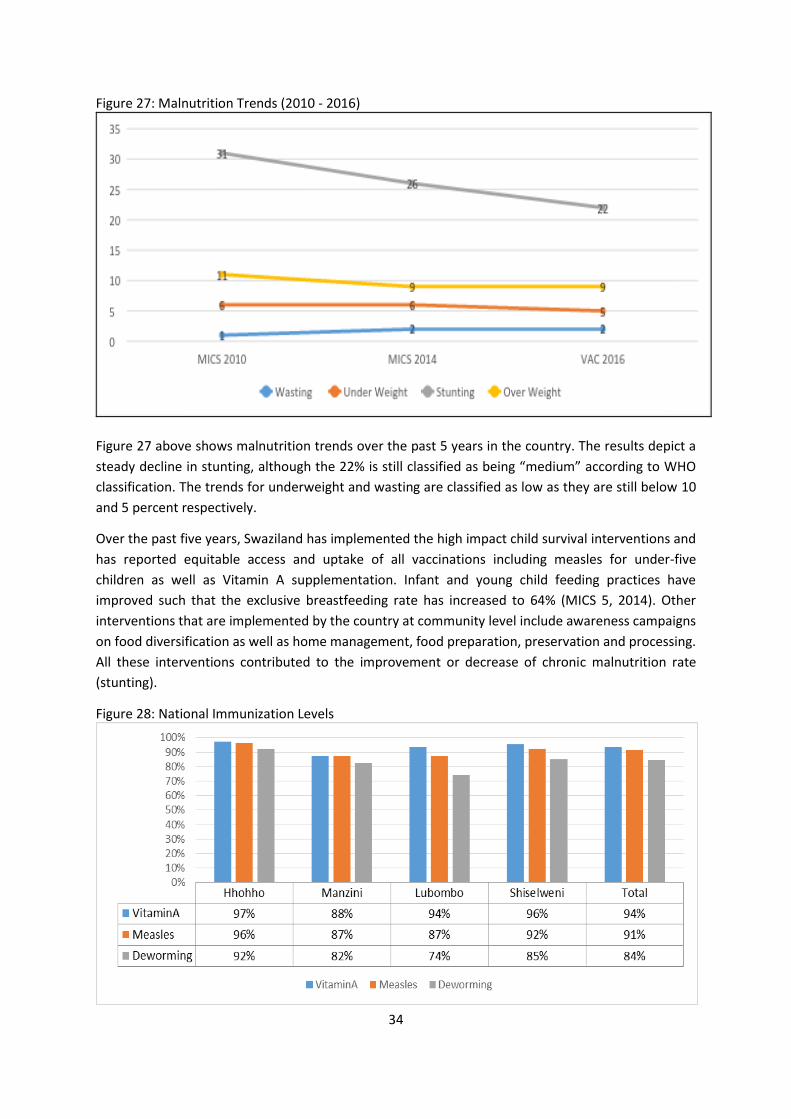
Figure 27: Malnutrition Trends (2010 - 2016)
Figure 27 above shows malnutrition trends over the past 5 years in the country. The results depict a
steady decline in stunting, although the 22% is still classified as being “medium” according to WHO
classification. The trends for underweight and wasting are classified as low as they are still below 10
and 5 percent respectively.
Over the past five years, Swaziland has implemented the high impact child survival interventions and
has reported equitable access and uptake of all vaccinations including measles for under-five
children as well as Vitamin A supplementation. Infant and young child feeding practices have
improved such that the exclusive breastfeeding rate has increased to 64% (MICS 5, 2014). Other
interventions that are implemented by the country at community level include awareness campaigns
on food diversification as well as home management, food preparation, preservation and processing.
All these interventions contributed to the improvement or decrease of chronic malnutrition rate
(stunting).
Figure 28: National Immunization Levels

35
Figure 28 indicates children receiving measles immunisation, supplemental vitamin A and
deworming tablets at any time up to the date of the survey, and are based on information from both
the vaccination cards and mothers’ or caretakers’ recall.
Overall, about 95% of the children received supplemental vitamin A, 91% were immunized for
measles and 84% received deworming tablets. More children in Hhohho region were immunized
against measles than the other regions, with Lubombo region having the least proportion of children
who were dewormed.
In the number of children receiving supplementation by gender (Figure 29), there is no much
significant gender difference observed in the supplementation received. However the use of
supplementation was higher in male when compared to females. Plain water and solid or semi-solid
food were highly used in both sexes.
Figure 29: Children receiving supplements by gender (out of total children)
Overall, 11% of children under-five years were reported to have had diarrhoea in the two weeks
preceding the survey, 13 % had symptoms of ARI, 32% was ill with cough and 25% had at least an
episode of fever (Figure 30). Higher morbidity was reported in Lubombo region in comparison to the
other regions. It is worth noting that the morbidity data collected are subjective in the sense that it
is based on the mother’s or caretaker’s perception of illness without validation by qualified medical
personnel.

36
Figure 30: Morbidity Levels in Children
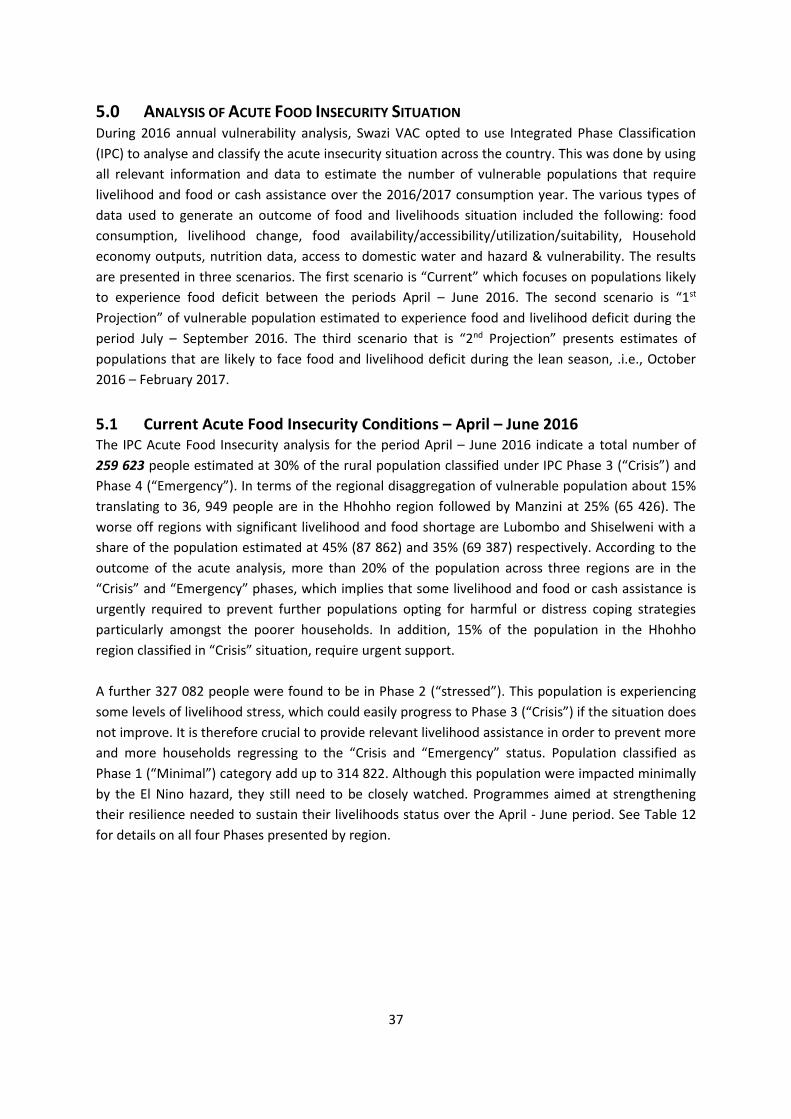
37
5.0 ANALYSIS OF ACUTE FOOD INSECURITY SITUATION During 2016 annual vulnerability analysis, Swazi VAC opted to use Integrated Phase Classification
(IPC) to analyse and classify the acute insecurity situation across the country. This was done by using
all relevant information and data to estimate the number of vulnerable populations that require
livelihood and food or cash assistance over the 2016/2017 consumption year. The various types of
data used to generate an outcome of food and livelihoods situation included the following: food
consumption, livelihood change, food availability/accessibility/utilization/suitability, Household
economy outputs, nutrition data, access to domestic water and hazard & vulnerability. The results
are presented in three scenarios. The first scenario is “Current” which focuses on populations likely
to experience food deficit between the periods April – June 2016. The second scenario is “1st
Projection” of vulnerable population estimated to experience food and livelihood deficit during the
period July – September 2016. The third scenario that is “2nd Projection” presents estimates of
populations that are likely to face food and livelihood deficit during the lean season, .i.e., October
2016 – February 2017.
5.1 Current Acute Food Insecurity Conditions – April – June 2016 The IPC Acute Food Insecurity analysis for the period April – June 2016 indicate a total number of
259 623 people estimated at 30% of the rural population classified under IPC Phase 3 (“Crisis”) and
Phase 4 (“Emergency”). In terms of the regional disaggregation of vulnerable population about 15%
translating to 36, 949 people are in the Hhohho region followed by Manzini at 25% (65 426). The
worse off regions with significant livelihood and food shortage are Lubombo and Shiselweni with a
share of the population estimated at 45% (87 862) and 35% (69 387) respectively. According to the
outcome of the acute analysis, more than 20% of the population across three regions are in the
“Crisis” and “Emergency” phases, which implies that some livelihood and food or cash assistance is
urgently required to prevent further populations opting for harmful or distress coping strategies
particularly amongst the poorer households. In addition, 15% of the population in the Hhohho
region classified in “Crisis” situation, require urgent support.
A further 327 082 people were found to be in Phase 2 (“stressed”). This population is experiencing
some levels of livelihood stress, which could easily progress to Phase 3 (“Crisis”) if the situation does
not improve. It is therefore crucial to provide relevant livelihood assistance in order to prevent more
and more households regressing to the “Crisis and “Emergency” status. Population classified as
Phase 1 (“Minimal”) category add up to 314 822. Although this population were impacted minimally
by the El Nino hazard, they still need to be closely watched. Programmes aimed at strengthening
their resilience needed to sustain their livelihoods status over the April - June period. See Table 12
for details on all four Phases presented by region.
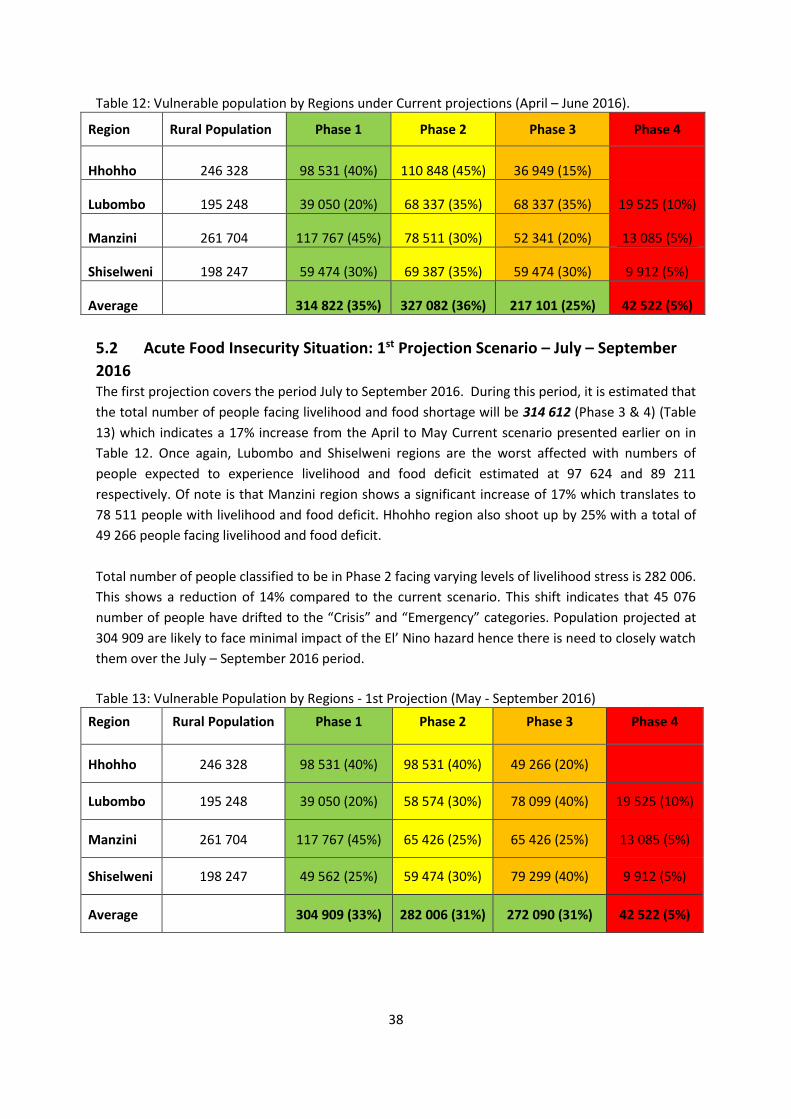
38
Table 12: Vulnerable population by Regions under Current projections (April – June 2016).
Region Rural Population Phase 1 Phase 2 Phase 3 Phase 4
Hhohho 246 328 98 531 (40%) 110 848 (45%) 36 949 (15%)
Lubombo 195 248 39 050 (20%) 68 337 (35%) 68 337 (35%) 19 525 (10%)
Manzini 261 704 117 767 (45%) 78 511 (30%) 52 341 (20%) 13 085 (5%)
Shiselweni 198 247 59 474 (30%) 69 387 (35%) 59 474 (30%) 9 912 (5%)
Average 314 822 (35%) 327 082 (36%) 217 101 (25%) 42 522 (5%)
5.2 Acute Food Insecurity Situation: 1st Projection Scenario – July – September
2016 The first projection covers the period July to September 2016. During this period, it is estimated that
the total number of people facing livelihood and food shortage will be 314 612 (Phase 3 & 4) (Table
13) which indicates a 17% increase from the April to May Current scenario presented earlier on in
Table 12. Once again, Lubombo and Shiselweni regions are the worst affected with numbers of
people expected to experience livelihood and food deficit estimated at 97 624 and 89 211
respectively. Of note is that Manzini region shows a significant increase of 17% which translates to
78 511 people with livelihood and food deficit. Hhohho region also shoot up by 25% with a total of
49 266 people facing livelihood and food deficit.
Total number of people classified to be in Phase 2 facing varying levels of livelihood stress is 282 006.
This shows a reduction of 14% compared to the current scenario. This shift indicates that 45 076
number of people have drifted to the “Crisis” and “Emergency” categories. Population projected at
304 909 are likely to face minimal impact of the El’ Nino hazard hence there is need to closely watch
them over the July – September 2016 period.
Table 13: Vulnerable Population by Regions - 1st Projection (May - September 2016)
Region Rural Population Phase 1 Phase 2 Phase 3 Phase 4
Hhohho 246 328 98 531 (40%) 98 531 (40%) 49 266 (20%)
Lubombo 195 248 39 050 (20%) 58 574 (30%) 78 099 (40%) 19 525 (10%)
Manzini 261 704 117 767 (45%) 65 426 (25%) 65 426 (25%) 13 085 (5%)
Shiselweni 198 247 49 562 (25%) 59 474 (30%) 79 299 (40%) 9 912 (5%)
Average 304 909 (33%) 282 006 (31%) 272 090 (31%) 42 522 (5%)
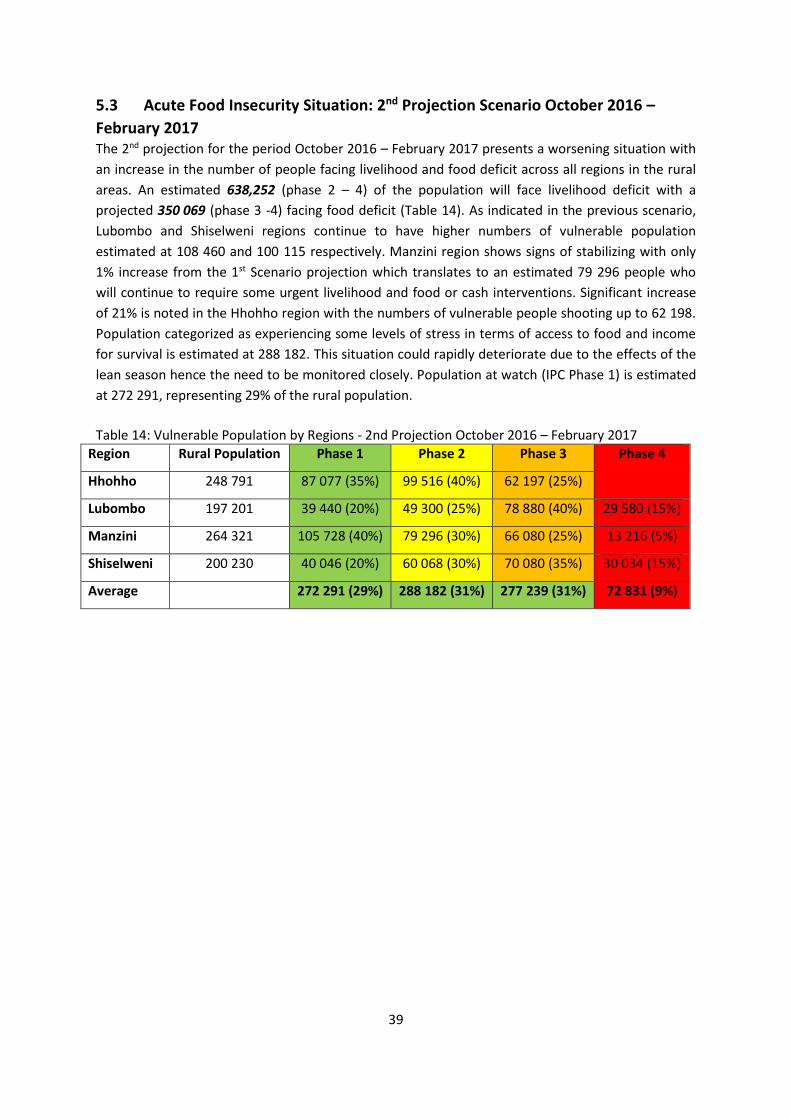
39
5.3 Acute Food Insecurity Situation: 2nd Projection Scenario October 2016 –
February 2017 The 2nd projection for the period October 2016 – February 2017 presents a worsening situation with
an increase in the number of people facing livelihood and food deficit across all regions in the rural
areas. An estimated 638,252 (phase 2 – 4) of the population will face livelihood deficit with a
projected 350 069 (phase 3 -4) facing food deficit (Table 14). As indicated in the previous scenario,
Lubombo and Shiselweni regions continue to have higher numbers of vulnerable population
estimated at 108 460 and 100 115 respectively. Manzini region shows signs of stabilizing with only
1% increase from the 1st Scenario projection which translates to an estimated 79 296 people who
will continue to require some urgent livelihood and food or cash interventions. Significant increase
of 21% is noted in the Hhohho region with the numbers of vulnerable people shooting up to 62 198.
Population categorized as experiencing some levels of stress in terms of access to food and income
for survival is estimated at 288 182. This situation could rapidly deteriorate due to the effects of the
lean season hence the need to be monitored closely. Population at watch (IPC Phase 1) is estimated
at 272 291, representing 29% of the rural population.
Table 14: Vulnerable Population by Regions - 2nd Projection October 2016 – February 2017
Region Rural Population Phase 1 Phase 2 Phase 3 Phase 4
Hhohho 248 791 87 077 (35%) 99 516 (40%) 62 197 (25%)
Lubombo 197 201 39 440 (20%) 49 300 (25%) 78 880 (40%) 29 580 (15%)
Manzini 264 321 105 728 (40%) 79 296 (30%) 66 080 (25%) 13 216 (5%)
Shiselweni 200 230 40 046 (20%) 60 068 (30%) 70 080 (35%) 30 034 (15%)
Average 272 291 (29%) 288 182 (31%) 277 239 (31%) 72 831 (9%)

40
6.0 CONCLUSION The Swazi VAC acknowledges recommendations of the Rapid Assessment conducted in March 2016
and the National Emergency Response Mitigation Adaptation Plan 2015 (NERMAP) as relating to the
various sectors and would affirm and propose that they be implemented. It is strongly advised that
the stakeholders use the NERMAP 2015 report for detailed implementation of the
recommendations. Here below are the recommendations from the above-mentioned reports:
6.1 Coordination and Monitoring
o The Government led response plan, NERMAP, should be reviewed accordingly to ensure
emerging issues are catered for and budget is allocated effectively.
o A national emergency response coordination platform lead by NDMA should be created to
coordinate much needed humanitarian assistance.
o Given the magnitude of the devastation, declaration of the drought should now be followed
by allocation of budgets to assist affected communities with relief
6.2 Water and Sanitation
Led by Ministry of Natural resources and Energy with her partners:
o Water should be immediately provided to areas where water has become scarce and
provision could be through boreholes where underground water is available and through
tankers where there is no other source of potable water as indicated in table 5 of the report.
o Improve water-harvesting structures within public buildings including schools and clinics,
through repairing and installing additional gutters, water tank stands and installing water
tanks.
o Increase existing reservoirs capacities and improving catchment area management
6.3 Agriculture and Food Security
Led by DPMO, NDMA and partners should Food relief should be incrementally provided to
vulnerable population starting with 350,069 people, having immediate need, to 638,252 by May
2017.
Led by Ministry of Agriculture and partners should:
o provide incentives to encourage livestock farmers to destock marginal grazing areas
o provide supplementary water sources and feed as provision of breeding stock
o provide support to affected farmers with Input subsidy, utilising alternative water sources
and training on water conservation technologies.
6.4 Education
Led by the Ministry of Education and Training with partners should:
o Conduct capacity-building workshops for school principals on education in emergencies
(disaster risk reduction and disaster management) within the school.
o Provide at least two meals preferably breakfast to support the current one meal programme
in food insecure areas,

41
o Construct more toilets in order to curb potential disease outbreaks and maintain the national
standards on ratio of toilets to learners.
As an adaptation strategy there is a need to construct dry pit toilets for every school
located within towns.
6.5 Health
Led by Ministry of Health and partners should:
o Develop and disseminate messages targeting prevention of drought related diseases
o Scale-up community based health promotion on prevention of drought related diseases
o Ensure adequate stocks of medicines, drugs and supplies for drought related diseases.
o Procure laboratory supplies to diagnose and isolate drought related diseases
o Revive weekly reporting and improve immediate reporting
o Sensitise health workers on drought related diseases especially emphasising on case
definition, detection, management, prevention and control.
6.6 Protection
o The DPMO and partners should:
o Aggressively sensitise communities on GBV and SGBV.
o Improve GBV and SGBV case reporting and referral systems at community level
6.7 Environment
In view of the environmental degradation that has occurred, communal led environmental
assessment should be conducted to inform a comprehensive understanding of the impact of the
drought and subsequent steps that could be taken to reverse the degradation or at least mitigate
the impact of said degradation.