ANALYSIS ON ADDICTION AND OPIOID CRISIS: IMPLICATIONS …
69
California State University, San Bernardino California State University, San Bernardino CSUSB ScholarWorks CSUSB ScholarWorks Electronic Theses, Projects, and Dissertations Office of Graduate Studies 3-2020 ANALYSIS ON ADDICTION AND OPIOID CRISIS: IMPLICATIONS ANALYSIS ON ADDICTION AND OPIOID CRISIS: IMPLICATIONS AND SOLUTIONS AND SOLUTIONS Bhavika Korat California State University - San Bernardino Follow this and additional works at: https://scholarworks.lib.csusb.edu/etd Part of the Medicine and Health Sciences Commons Recommended Citation Recommended Citation Korat, Bhavika, "ANALYSIS ON ADDICTION AND OPIOID CRISIS: IMPLICATIONS AND SOLUTIONS" (2020). Electronic Theses, Projects, and Dissertations. 981. https://scholarworks.lib.csusb.edu/etd/981 This Project is brought to you for free and open access by the Office of Graduate Studies at CSUSB ScholarWorks. It has been accepted for inclusion in Electronic Theses, Projects, and Dissertations by an authorized administrator of CSUSB ScholarWorks. For more information, please contact [email protected].
Transcript of ANALYSIS ON ADDICTION AND OPIOID CRISIS: IMPLICATIONS …
California State University, San Bernardino California State University, San Bernardino
CSUSB ScholarWorks CSUSB ScholarWorks
Electronic Theses, Projects, and Dissertations Office of Graduate Studies
3-2020
ANALYSIS ON ADDICTION AND OPIOID CRISIS: IMPLICATIONS ANALYSIS ON ADDICTION AND OPIOID CRISIS: IMPLICATIONS
AND SOLUTIONS AND SOLUTIONS
Bhavika Korat California State University - San Bernardino
Follow this and additional works at: https://scholarworks.lib.csusb.edu/etd
Part of the Medicine and Health Sciences Commons
Recommended Citation Recommended Citation Korat, Bhavika, "ANALYSIS ON ADDICTION AND OPIOID CRISIS: IMPLICATIONS AND SOLUTIONS" (2020). Electronic Theses, Projects, and Dissertations. 981. https://scholarworks.lib.csusb.edu/etd/981
This Project is brought to you for free and open access by the Office of Graduate Studies at CSUSB ScholarWorks. It has been accepted for inclusion in Electronic Theses, Projects, and Dissertations by an authorized administrator of CSUSB ScholarWorks. For more information, please contact [email protected].
ANALYSIS ON ADDICTION AND OPIOID CRISIS:
IMPLICATIONS AND SOLUTIONS
A Project
Presented to the
Faculty of
California State University,
San Bernardino
In Partial Fulfillment
of the Requirements for the Degree
Master of Science
in
Information Systems and Technology
by
Bhavika Korat
March 2020
ANALYSIS ON ADDICTION AND OPIOID CRISIS:
IMPLICATIONS AND SOLUTIONS
A Project
Presented to the
Faculty of
California State University,
San Bernardino
by
Bhavika Korat
March 2020
Approved by:
Benjamin Becerra, Committee Chair, Information & Decision Sciences
Conrad Shayo, Committee Member, Information & Decision Sciences
Jay Varzandeh, Chair, Department of Information & Decision Sciences

© 2020 Bhavika Korat
iii
ABSTRACT
Opioids have become a popular way of pain management treatment over
the past decades and although they have proven to be very successful to treat
pain, they require serious attention as they have become the cause of addiction
and overdose deaths. Opioid overdose costs the US government $78.5 billion
each year. This project exhibits the background on opioids, the different types of
opioids and their role in the addiction and overdose epidemic. The objective
behind this project was to demonstrate what kind of people are more vulnerable
to addiction and overdose.
This project shows the statistics of opioid overdose deaths in the United
States which analyze a detailed comparison of the deaths caused by opioid
overdose in various states, within certain age groups, ethnicity, and the types of
opioids causing these issues using Tableau and IBM Cognos. It also involves
what types of providers produce most of the opioid prescriptions.
West Virginia has highest death rate caused by overdose in the United
States. Males and age group of 24 to 35 are more prompt to have addiction
problem and the death rate is high in almost all the states. The white community
also have high death rate in most of the states.
This paper also provides information on what systems are already in place
to minimize the addiction and overdose problem and what is still needed to be
done. Foremost, it will give an overview of what future work can be done in this
iv
field to reduce the addiction and overdose occurrences. Implementation of future
work provides the basic framework of the system needed to accommodate the
needs of patients and providers. This can potentially help the government to
reduce the cost of drug abuse treatment and will also assist patients to get a
better understanding of opioid treatment.
v
TABLE OF CONTENTS
ABSTRACT .......................................................................................................... iii
LIST OF FIGURES ............................................................................................. viii
CHAPTER ONE: PROJECT BACKGROUND ..................................................... 1
Introduction ................................................................................................ 1
Problem Statement ......................................................................... 3
Purpose of the Study ....................................................................... 4
Research Questions ........................................................................ 4
CHAPTER TWO: LITERATURE REVIEW ............................................................ 6
Background ................................................................................................ 6
Opioids ....................................................................................................... 7
Addiction .................................................................................................... 9
How to Identify Addiction and its Symptoms (ARS, 2020): .............. 9
Overdose and its Symptoms .................................................................... 10
Overdose Symptoms (ASA, 2019): ............................................... 10
Prescription Drug Monitoring Systems ..................................................... 11
Control Substance Utilization Review and Evaluation System (CURES) (DOJ, 2019) ................................................................... 12
Drug Enforcement Agency (DEA) ................................................. 14
CHAPTER THREE: DATA DESCRIPTION AND VISUALIZATION TOOLS ....... 16
Dataset Descriptions ................................................................................ 16
State Population ............................................................................ 16
Opioid Death Datasets .................................................................. 17
vi
Characteristics of Each Prescriber Datasets ................................. 18
Visualization Tools ................................................................................... 19
CHAPTER FOUR: ANALYSIS ........................................................................... 20
Population by States in United States ...................................................... 20
Percentage of Opioid Deaths Distributed by State ................................... 21
Opioid Deaths by Age .............................................................................. 22
Opioid Deaths by Age .............................................................................. 23
Opioid Deaths by Age .............................................................................. 24
Death Rate per 10000.............................................................................. 25
Opioid Deaths by Ethnicity ....................................................................... 26
Opioid Deaths by Sex .............................................................................. 27
Death Rate by Sex Normalized by State Population ................................ 28
Death Rate by Sex Normalized by State Population ................................ 29
Average Opioid Prescribing Rate in Top 10 States .................................. 30
Specialty Total Claims Normalized by State Population in Top 9 States . 31
Specialty Opioid Claims Normalized by State Population in Top 9 States32
Adults Ages 18 + (Addiction but Did Not Get Treatment) ......................... 33
All Drug Overdose Death Vs. Opioids Overdose Deaths in Top 10 States ................................................................................................................. 34
Opioid Misused Normalized by State Population ..................................... 35
Opioid Overdose Deaths by Type of Opioid (2016) ................................. 36
Opioid Overdose Deaths by Type of Opioid (2017) ................................. 37
CHAPTER FIVE: MINIMIZING TECHNIQUES ................................................. 39
vii
Limitation ................................................................................................. 43
CHAPTER SIX: FUTURE WORK ...................................................................... 44
Sensor ..................................................................................................... 45
Application ............................................................................................... 45
Modules and their Descriptions ..................................................... 47
Application Interface ................................................................................ 48
Use Case diagram ........................................................................ 48
Data Flow Diagram (DFD) ............................................................. 49
CHAPTER SEVEN: CONCLUSION .................................................................. 50
APPENDIX A ...................................................................................................... 52
REFERENCES ................................................................................................... 56
viii
LIST OF FIGURES
Figure 4.1: States in the US vs. Total Population ............................................... 20
Figure 4.2: States in the US vs. Total % of Deaths ............................................. 21
Figure 4.3a: Age Death Rate by Population vs. States in the US ....................... 22
Figure 4.3b: Age Death Rate by Population vs. States in the US ....................... 23
Figure 4.3c: Age Death Rate by Population vs. States in the US ....................... 24
Figure 4.3d: States in the US vs. Death Rate per 10000 .................................... 25
Figure 4.4: Top 10 States in the US vs. Death Rate by Ethnicity........................ 26
Figure 4.5a: Top 10 States in the US vs. Number of Deaths by Sex .................. 27
Figure 4.5b: States vs. Number of Deaths by Sex .............................................. 28
Figure 4.5c: States vs. Number of Deaths by Sex .............................................. 29
Figure 4.6: States vs. Avg. Opioid Prescribing Rate ........................................... 30
Figure 4.7: Total Claims by Specialties vs. States .............................................. 31
Figure 4.8: Total Opioid Claims by Specialties vs. States .................................. 32
Figure 4.9: States in the US vs. Adults 18+ Population ...................................... 33
Figure 4.10: All Drug Overdose Deaths vs. Opioid Overdose Deaths ................ 34
Figure 4.11: States in the US vs. Opioid Misuse ................................................ 35
Figure 4.12a: States in the US vs. Death by Opioid Types (2016) .................... 36

ix
Figure 4.12b: States in the US vs. Death by Opioid Types (2017) .................... 37
1
CHAPTER ONE:
PROJECT BACKGROUND
Introduction
In the 1990s, pharmaceutical companies started manufacturing opioid-
based painkillers on a large scale and assured the healthcare providers that it will
not lead to addiction. As a result, doctors have started prescribing painkillers as
an effective treatment to relieve pain. This ultimately led to a widespread
movement of drug diversion and misuse. By the time the government realized the
serious consequences of misuse, more than 1.7 million people were addicted to
opioids by 2017 and 47,000 Americans died due to an overdose (NIDA, 2019).
The American Society of Addiction Medicine (ASAM) recognizes addiction
as a chronic condition of the brain in which a person is dependent on a particular
substance, thing or activity which results in serious health problems (Tyler,
2016). Addiction is considered a genetic issue which means an individual with a
family history of addiction is more likely to end up with the same condition if
proper measures are not taken. People with substance abuse history may exhibit
lowered self-confidence and self-efficacy. An addicted person can show signs of
compulsivity and may make poorer choices in regards to obtaining a substance,
with less focus on potential health effects, effect on finances, etc. (Hazelden,
2019).
2
Addiction doesn't develop over a short period of time. The process of
addiction takes place in the part of the brain called the reward center. Reward
center is part of body's basic survival system. Body needs food for survival, this
reward center leads the body for the desire of food, in such way it ensures the
survival of the body (Horvard, Misra, Epner, & Cooper, 2018). This center
regulates the natural rewards that are necessary to sustain our existence. In
other simple words, when we take food or water, the reward center identifies
these ingredients as vital substances for our bodies to function efficiently
(Hazelden, 2019).
Repetitive use of harmful substances leads the brain to identify them as
vital ingredients that are necessary to sustain a normal and natural body
functionality. The brain thinks these substances are required for our continued
existence. On top of that when a person uses these products, it also gives them
a feeling of joy and fulfillment. Because of this behavioral feeling and urge of the
brain, the person becomes more susceptible to use these products routinely and
prioritizes these substances over other basic necessities. Scientists are still trying
to understand the biology of addiction, it is a long lasting brain condition and very
complex to understand. It is very much possible that person who successfully
quit the addiction, may develop it again in future and that is called relapse (Wein,
2017). Studies have also shown that a variety of other factors like genetics,
social and emotional environments also play an important role in making people
more vulnerable to addiction. Due to these other factors that affect addiction, a
3
situation in which two people start using addictive substances together, only one
may develop an addiction (Hazelden, 2019).
The following substances have been identified in addiction cases: alcohol,
opioids, tobacco, heroin, cocaine, marijuana, etc (Bradbury, 2020).
Among all of these substances, tobacco, alcohol and opioids are
responsible for almost 90% of addiction cases. Considering the users of tobacco
and alcohol are more prominent than opioid users, comparative cases of
addiction are more significant in the case of opioid users. What this means is, out
of 100 users of alcohol or tobacco merely a few of them get addicted to those
substances and an even fewer number of people die because of its overdose
(Lopez, 2019). While in the case of opioid users, a significant number of people
develop dependence and addiction, which can lead to death from overdose
(Bradbury, 2020).
Problem Statement
Every day more than 130 people die from opioid overdose in America. The
misuse of these substances affects social and economic welfare. Prescription
drug misuse costs the United States more than $78.5 billion every year (NIDA,
2019). Several regulatory bodies such as Drug Enforcement Administration
(DEA), the Centers for Disease Control and Prevention (CDC) and the National
Institute on Drug Abuse (NIDA) are created to keep a watch on opioid misuse
but still, the problem persists (NIDA, 2019). However, it can be unclear regarding
4
which specific groups are disproportionately suffering from opioid addiction and
increased death rates due to overdose. In addition, some organizations may
show differences in the opioid addiction-related outcomes that they encounter.
Purpose of the Study
This project will attempt to summarize the view of the opioid crisis through
a data analytics approach. By analyzing the data obtained from secondary data
sources (The Henry J. Kaiser Foundation), the research will aim to illustrate the
more susceptible and exposed areas where drugs are being misused.
We will also analyze the drug misuse trends according to sex, ethnicity
and race, and age in different states. The research will endeavor to identify the
type of prescribers and their specialty field who prescribes more opioids.
The study will identify the current measures taken by the regulatory
authorities and what the potential flaws in the current system are. The study will
also show what possible solutions could be considered in the future.
Research Questions
1. What kinds of people are more vulnerable to opioid overdose death?
2. What types of doctors are prescribing more opioids?
3. In which age group the addiction problem is more persistence?
4. What kind of opioid is more responsible for overdose and death?
5
5. Which states are at the highest in drug overdose death?
6. What are the steps the government is taking to keep the situation under
control?
7. What can be the future possible solutions which can be helpful to
spread addiction awareness?
6
CHAPTER TWO:
LITERATURE REVIEW
Background
After drug manufacturing companies started manufacturing opioids in the
1990's, it has become the most successful treatment for pain management.
Soon, it has become the most accepted way of painkiller treatment by patients
and doctors. This ultimately led to widespread drug misuse and overdose due to
its habit-forming nature. In 2017, more than 1.7 million people were addicted to
opioids (NIDA, 2019). Along with opioids, there are several other substances
which cause addiction after repetitive use, such as alcohol, tobacco, marijuana,
cocaine, etc. From all these substances, opioids are more dangerous because
initially they are used in various disease management treatments but users can
gradually develop dependence and lead to overdose and death (Bradbury,
2020).
Opioids are most widely used as painkillers, especially for the more painful
diseases like cancer, kidney stones, and rheumatoid arthritis. They also work
very well as a temporary pain reliever in cases of labor or menstrual pain. Due to
its versatility and effectiveness, it has become so popular over a short period of
time (Højsted & Sjøgren, 2012). This chapter includes an overview of the
different types of opioids, addiction, how opioid and addiction works, its effects
on the body, overdose, overdose symptoms, etc.
7
Opioids
Opioids, also known as narcotics, are substances that bind to the opioid
receptors which are located primarily in the central nervous system and the
gastrointestinal tract to relieve pain by blocking the pain signals between the
body and the brain. Opioids are more widely used as a painkiller and anesthesia
(ASA, 2019).
Types of opioids: Opioids occur naturally and can also be synthesized artificially.
There are main 3 types of opioids (Bellum, 2014):
● Natural- These are naturally occurring substances that contain nitrogen as
a base compound. It is obtained from plants like opium poppy.
Ex: Codeine, Narceine, Morphine, Thebaine, etc.
● Semi-synthetic- These types of opioids are derivatives of natural opioids
created in labs.
Ex: Hydrocodone, Oxycodone, Heroin, Hydromorphone, etc.
● Synthetic- These are completely produced artificially by humans.
Ex: Fentanyl, Methadone, Tramadol, etc.
Some of these are legal prescription drugs such as hydrocodone,
oxycodone, morphine, tramadol, etc. People start receiving these medications as
part of their treatment and after a continuous use of these medications, the brain
adapts them as a vital ingredient for the normal functioning of the body. This is
when the addiction starts developing. If proper measures are not taken at this
point, it may lead to addiction. Best practice to avoid this situation is to regularly
8
consult a doctor to taper down the dose of painkillers as treatment comes to an
end or to use suitable alternatives (Bellum, 2014).
Mechanism of Action (Chahl, 1996). Opioids exert their effect by inhibiting
the release of neurotransmitters by acting on neural cell membrane receptors
located on the central and peripheral nervous systems as well as the
gastrointestinal tract. There are three major types of opioid receptors:
1. μ (mu)
2. ∆ (delta)
3. k (kappa)
A sensation of pain is triggered by stimuli caused by chemicals produced
due to inflammation or damage to the body parts. Neurons are activated by these
chemicals and release the neurotransmitters and the individual feels pain.
Opioids block the production of these transmitters to react with pain stimuli and
prevent the feeling of pain. Different kinds of opioids react differently with μ, ∆,
and k opioid receptors to produce its effects (Chahl, 1996).
Effects of Opioids. The continuous use of opioids has some immediate
and gradual effects on the body. These include (Short and Long, 2006):
● Constipation
● Palpitation
● Sweating
● Stomach upset
● Nausea and vomiting
9
● Drowsiness
● Insomnia
● Diarrhea
Addiction
Addiction is a disorder of the brain in which a person becomes dependent
on a certain substance or habit. Even though the substance is known to be
harmful to the body, the person cannot resist the urge to consume it. Prolonged
use of specific substances results in dependence and that is called addiction.
People can sacrifice a healthy lifestyle, money, relationships or even life to get
what they are urging for (ASA, 2019).
How to Identify Addiction and its Symptoms (ARS, 2020):
● Consistent change in mood or behavior
● Avoid contact with friends or family
● Become more aggressive or cranky
● Sleep pattern change
● Violent behavior
● The drastic change in food intake
● The person denies the use of drugs or medication
● A person lacking motivation or being in a depression
● Mental and emotional instability
● Loss of concentration
● Lose control over the body or responsiveness
10
Overdose and its Symptoms
Uncontrolled use of opioids often results in an overdose. It is extremely
important to use prescription drugs as directed by professionals. In most
overdose cases, the patient overdoses because they intentionally take in more
drugs than prescribed with the hope of getting better and faster effects. Addicted
people try to obtain multiple prescriptions of narcotics from different providers
and pharmacies simultaneously. They consume more than they are supposed to
and become the victim of an overdose (ASA, 2019).
Overdose Symptoms (ASA, 2019):
● Breathing problems
● Seizures and tremors
● Confusion
● Inability to speak properly
● Extreme sleepiness
● Muscle cramps
● Sweating
● Paranoia
● Restlessness
● Discoloration of skin and lips
● Abnormally dilated or constricted pupils
How to help someone with Addiction or Overdose:
11
As soon as you know that someone is an addict, the first thing you should
do is to take them to a doctor. Consult with the doctor to prescribe medication
that helps with addiction and withdrawal symptoms. If the doctor is not a
specialist, ask them for the referral to an addiction doctor. The American Society
of Addiction Medicine has a list of facilities to help addicts on their website. You
can access their website to find the closest location to you and have the addicted
individual admitted. The Substance Abuse and Mental Health Service
Administration (SAMHSA) has a toll free 24/7 national helpline: 1-800-662-4357,
for information and referral for anyone who has a substance abuse disorder. It is
available in English and Spanish (ASA, 2019).
If you see someone overdosing, keep talking to the person and keep them
conscious until help arrives. The goal is to keep the individual engaged through
either conversation or movement in case it is difficult to determine whether they
are really physically. If a person is having difficulty breathing, rub gently on their
back or try to clear the person’s airways if you think it is blocked. Call 911 and
stay with the person (ASA, 2019).
Prescription Drug Monitoring Systems
Controlled substances are mainly classified into 5 different categories (DPVR,
2019):
● Schedule -I
12
These are the substances that have a high potential for abuse. This
category is strictly prohibited in medical use.
Ex: Heroin, marijuana, LSD
● Schedule -II
These are the substances that are accepted to be used for medical
treatment, but they also have a high potential of abuse but lower
than Schedule-I.
Ex: Hydrocodone, oxycodone, morphine, amphetamine, etc.
● Schedule- III to V
This category has a lower potential of abuse than above 2
categories
Ex: Codeine, tramadol, zolpidem, lorazepam, diazepam,
alprazolam, etc.
Control Substance Utilization Review and Evaluation System (CURES) (DOJ,
2019)
CURES is the national database to monitor the use of controlled
substances. It observes various controlled substance prescriptions dispensed to
any particular patient for at least 12 months from the current date. It serves
various parts of the healthcare system such as hospitals, physicians and
pharmacists, regulatory bodies and law enforcement agencies to obtain vital data
about the patient's control substance usage. When a person walks into a medical
clinic and consults a doctor seeking for pain management medication, the
physician can check the CURES data to identify if the patient is already using
any narcotic, the dates of previous fills, day supply and the quantity prescribed in
13
previous prescriptions. It also shows which doctor issued the previous
prescription and which pharmacy filled it. This helps the physician identify the
patient's authenticity regarding narcotic usage. If a patient has a broad history of
different kinds of opioids, changing patterns of usage, overlapping dates of
prescription fills, multiple prescribers for the same medication, multiple pharmacy
usage, etc. it raises a flag for potential misuse of opioids. In such cases, a
physician can deny the new prescription or advise patients to go for a non-
controlled pain killer. Similarly, pharmacists also have access to CURES in the
pharmacy setting. They can also check the history of the particular patient to
understand the opioid usage history and determine potential misuse (DOJ,
2019).
It is compulsory for all licensed physicians and pharmacists to register with
CURES. For prescribers and pharmacists, it is mandatory to check the CURES
profile of a patient before writing or dispensing controlled prescriptions (CSBP,
2016).
All the dispensers are required to submit dispensing data to CURES every
week. Most of the software utilized by clinics or pharmacies automatically submit
weekly dispensing reports to the CURES.
Limitation of CURES. The biggest limitation of CURES is that it takes one
week for the latest data available to be updated on the CURES database.
Therefore, if the patient has obtained the controlled substance in the past 3 to 5
14
days from any other location, it is not possible for the clinic or pharmacy to obtain
that prescription history. This could result in duplication of prescription fill (DOJ,
2019).
Drug Enforcement Agency (DEA)
DEA is the federal agency that monitors drug trafficking and usage of
prescription drugs across the country. DEA has set specific standards for
prescribers and dispensers of opioids to become licensed providers. It is
mandatory for any healthcare organization to obtain a DEA certificate in order to
get a professional license. DEA provides a unique identification number to all
these compliant providers. It serves the purpose of monitoring the distribution of
opioids between manufacturers, wholesalers, retailers, and consumers. It also
regularly conducts audits of the healthcare facilities to ensure the governance of
predetermined standards (DEA, 1973).
Despite its strict actions and agendas, DEA continues to attempt to
maintain control of the distribution of illegal opioids and drugs on local streets.
In the United States hundreds of people die due to opioid overdose every
day. This has economic, societal and governmental impacts (NIDA, 2019).
Further work needs to be done to identify which specific groups are suffering
from opioid addiction and increased death rates due to overdose.
15
The research data in this project summarizes the misuse of the opioids in
various age groups, ethnicity, sex, states and types of opioids. By summarizing
these data, it will help to identify most affected people who are at high risk in
different regions. This will also guide various regulatory agencies to increase
their efforts to high risk people which will increase the agencies’ efficiency and
effectiveness.
16
CHAPTER THREE:
DATA DESCRIPTION AND VISUALIZATION TOOLS
To find solutions to my research questions, I have obtained a few datasets
freely available from The Henry J. Kaiser Foundation. I was able to find state-
level data on opioid overdose. The datasets used in this research project are
from 2017.
Here are some of the variables I will be using throughout my research for
opioid overdose and deaths:
Dataset Descriptions
State Population
● Total Population per States.
■ Includes total population for the 50 US states; federal
district of Washington D.C and the territory of Puerto
Rico
■ Male population per states
■ Female population per states
■ Age 18 year population per states
■ Age 18 to 24 years population per states
■ Age 25 to 34 years population per states
17
■ Age 35 to 44 years population per states
■ Age 45 to 54 years population per states
■ Age 55+ years population per states
Opioid Death Datasets
● States
■ Includes the 50 US states; federal district of
Washington D.C and the territory of Puerto Rico
● Age
■ 0 to 24 years
■ 25 to 34 years
■ 35 to 44 years
■ 45 to 54 years
■ 55+ years
● Sex
■ Female or male
● Ethnicity
■ White not Hispanic, Black not Hispanic, and Hispanic
● Past Year Opioid Misuse
■ Misuse of opioid from 2016 to 2017
● All Drug Overdose Deaths
■ All drug overdose deaths in 2017
18
● Opioid Overdose Deaths
■ Out of all drug overdose deaths in 2017, how many
were opioid related
● Past Year Opioid Use Disorder
● Opioid Overdose Deaths as a Percent of All Drug Overdose Deaths
● Teens Ages 12-17 (did not get treatment)
■ Teenager who had an addiction problem but did not
get a treatment
● Adults Ages 18+ (did not get the treatment)
■ Adults who had an addiction problem but did not get a
treatment
Characteristics of Each Prescriber Datasets
● Sex
■ Female or male
● State
■ Includes the 50 US states; federal district of
Washington D.C and the territory of Puerto Rico
● Specialty
■ Description of what type of medical practice
19
These datasets also include the list of medicines provided by each individual
specialties.
Visualization Tools
To analyze my datasets, I have used Tableau and IBM Cognos
visualization tools. Tableau is considered as one of the fastest-growing business
intelligence and visualization tool. It is easy to explore, learn and create user-
friendly dashboards. Tableau can visualize huge amounts of data. You can also
combine two different datasets with the foreign key. In that case, you can analyze
two data sets at the same time. It also has a drag and drop interface and Tableau
will place the variables where they go. However, you can always undo this and
place the variable anywhere you want.
IBM Cognos Business Intelligence is another great web based analytic
tool. The website provides different types of tool sets which include analytics,
reporting, and monitor events. This tool also has the drop and drag interface. It
works similarly like tableau where you can combine two datasets and also create
a dashboard which can be exported to PowerPoint.
20
CHAPTER FOUR:
ANALYSIS
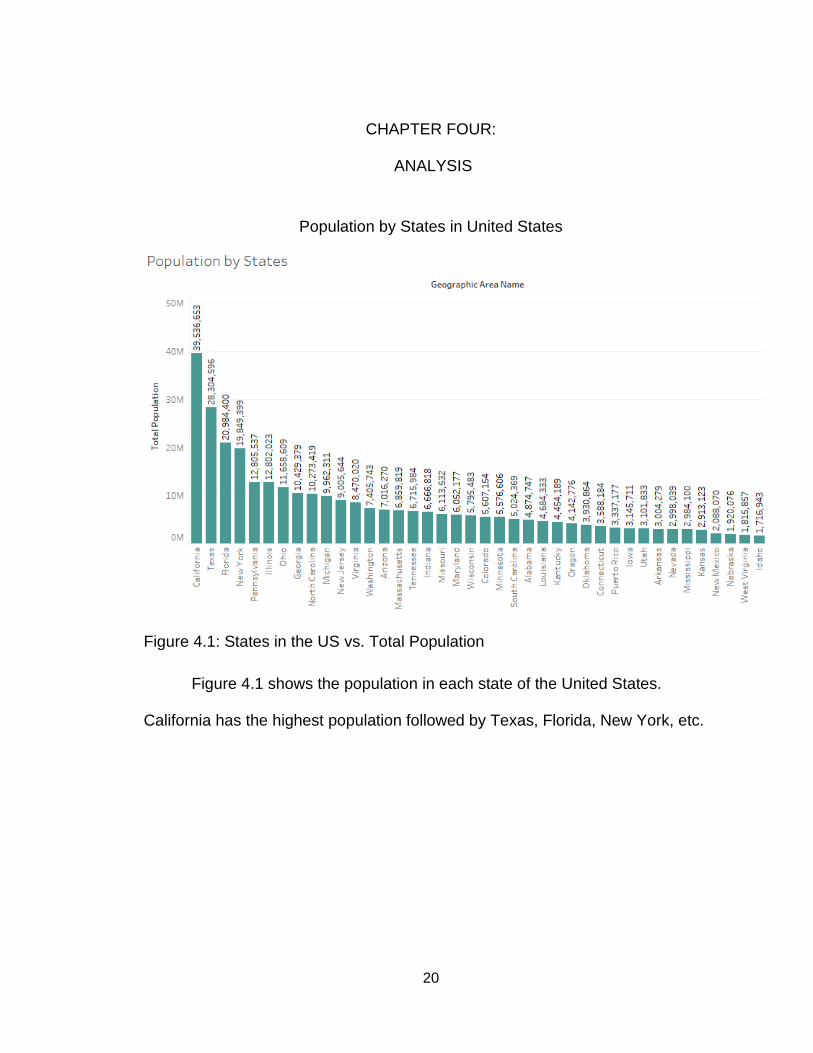
Population by States in United States
Figure 4.1: States in the US vs. Total Population
Figure 4.1 shows the population in each state of the United States.
California has the highest population followed by Texas, Florida, New York, etc.
21
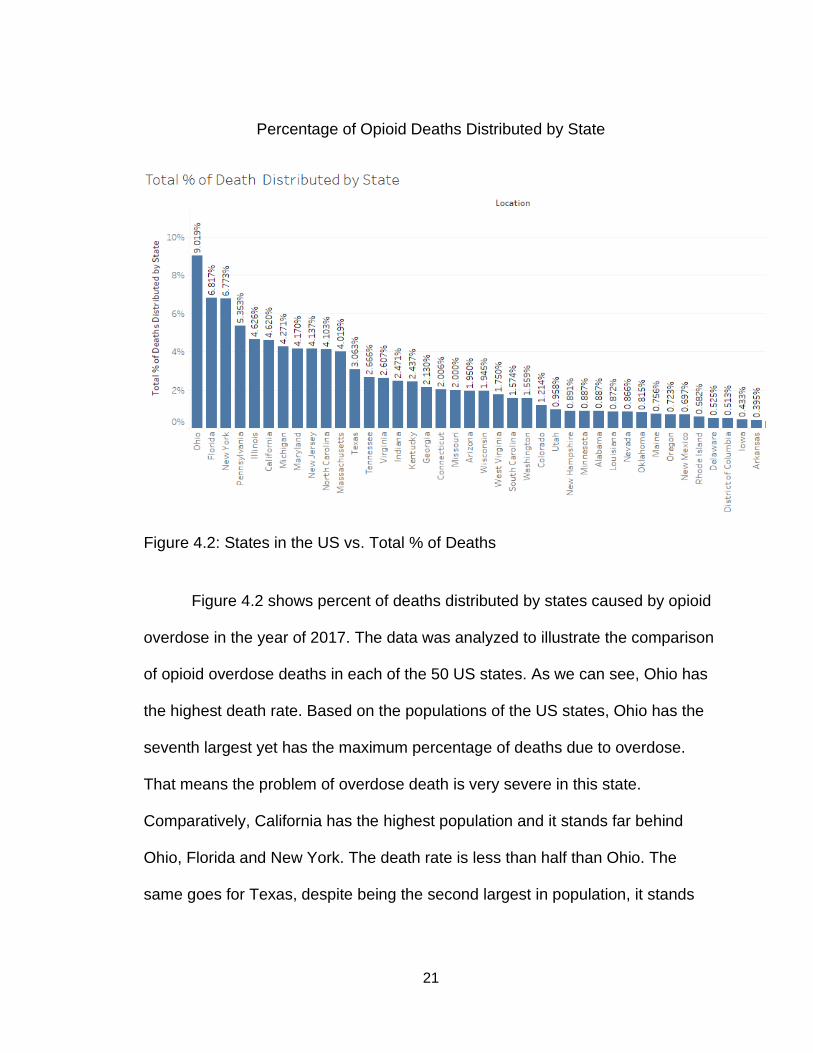
Percentage of Opioid Deaths Distributed by State
Figure 4.2: States in the US vs. Total % of Deaths
Figure 4.2 shows percent of deaths distributed by states caused by opioid
overdose in the year of 2017. The data was analyzed to illustrate the comparison
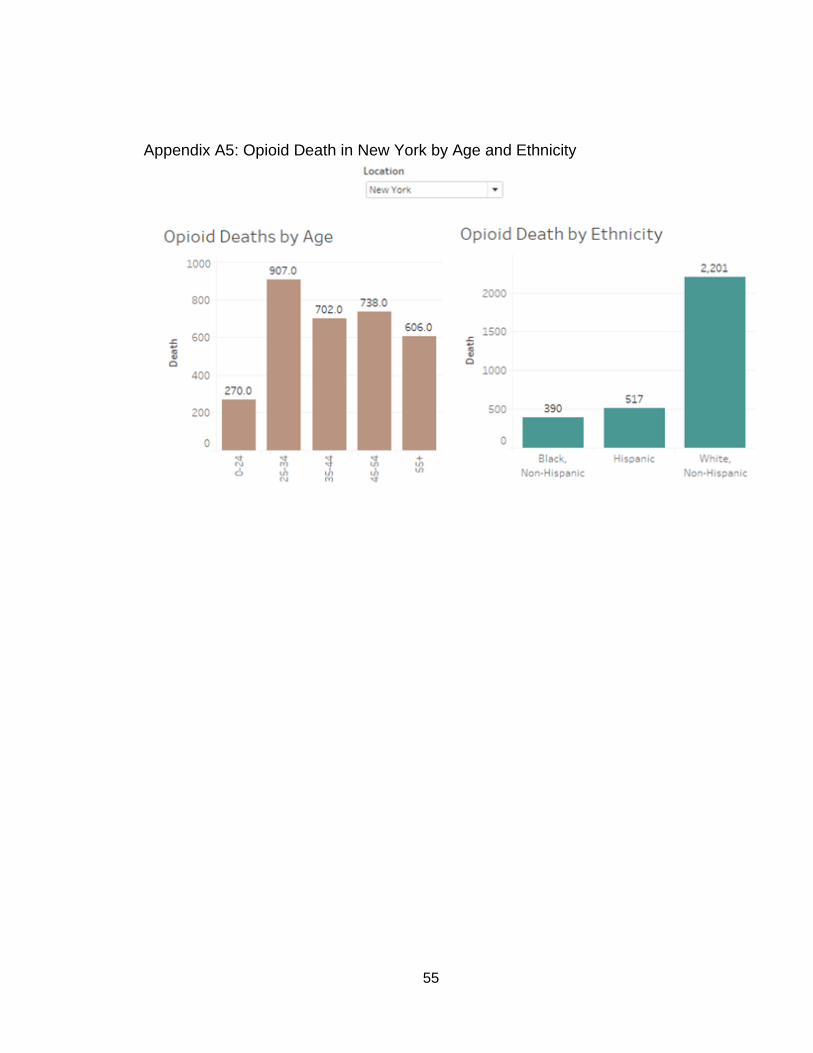
of opioid overdose deaths in each of the 50 US states. As we can see, Ohio has
the highest death rate. Based on the populations of the US states, Ohio has the
seventh largest yet has the maximum percentage of deaths due to overdose.
That means the problem of overdose death is very severe in this state.
Comparatively, California has the highest population and it stands far behind
Ohio, Florida and New York. The death rate is less than half than Ohio. The
same goes for Texas, despite being the second largest in population, it stands
22
quite far from Ohio, Florida and New York. According to the chart, Kansas,
Mississippi and Arkansas have the lowest death rates of opioid overdose.
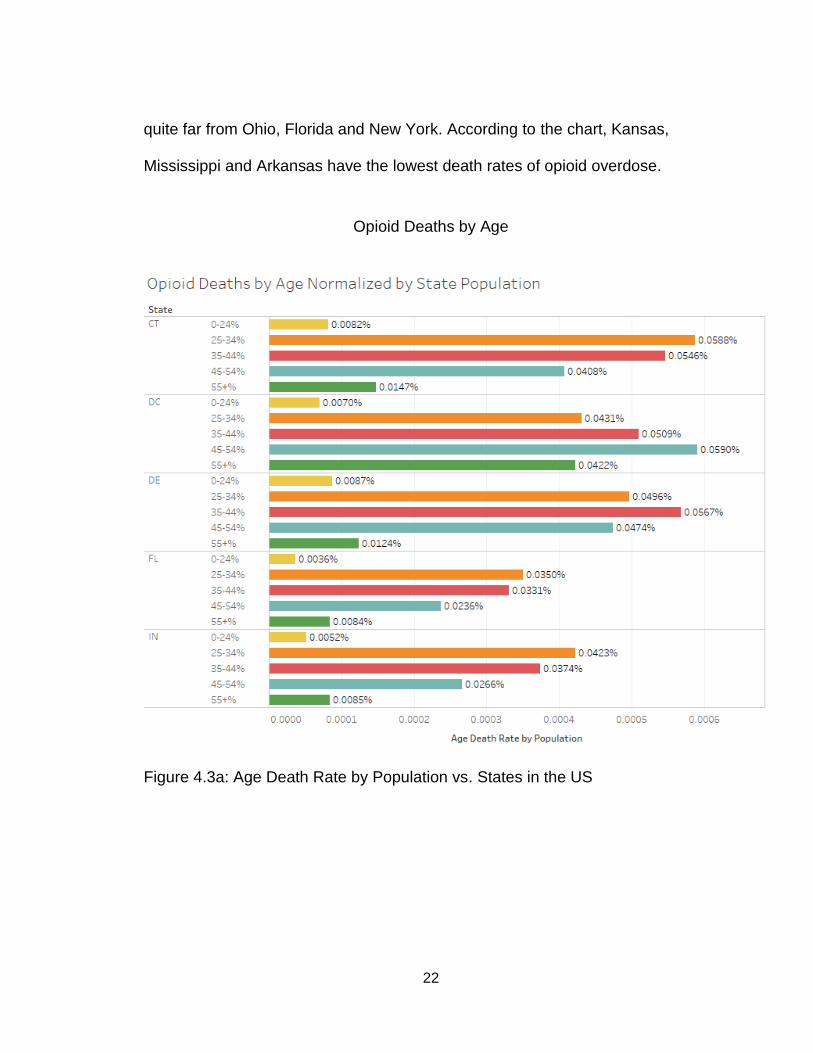
Opioid Deaths by Age
Figure 4.3a: Age Death Rate by Population vs. States in the US
23
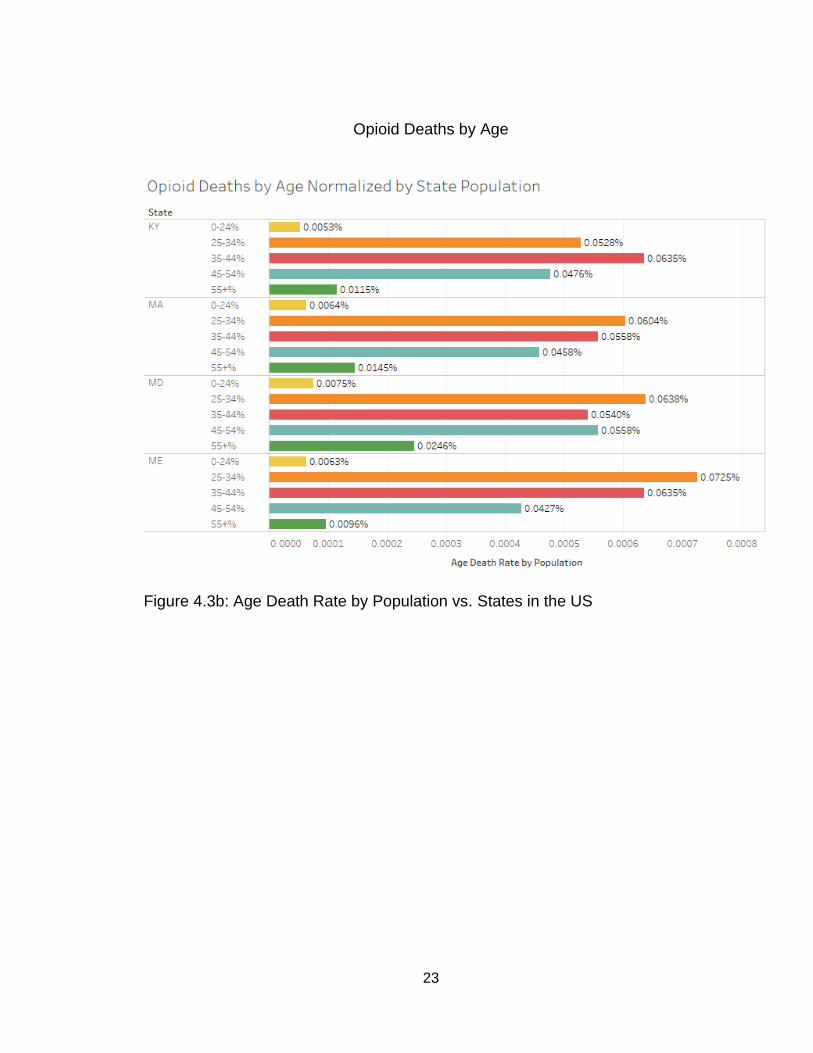
Opioid Deaths by Age
Figure 4.3b: Age Death Rate by Population vs. States in the US
24
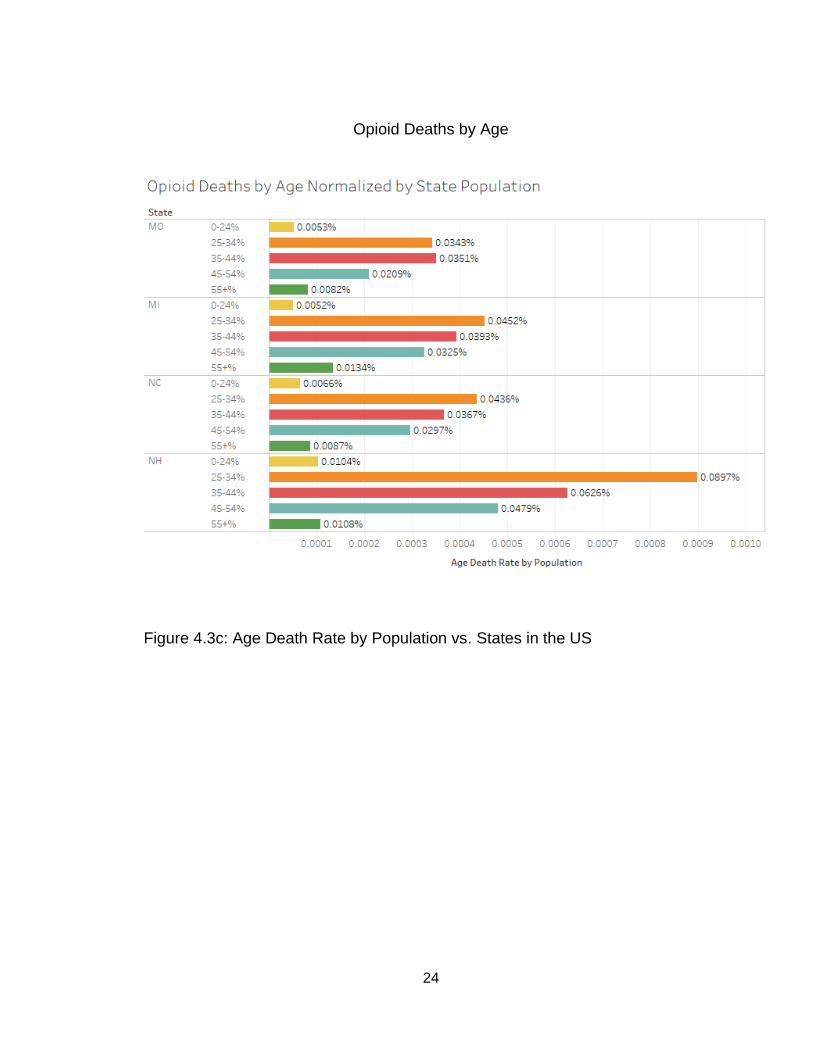
Opioid Deaths by Age
Figure 4.3c: Age Death Rate by Population vs. States in the US
25
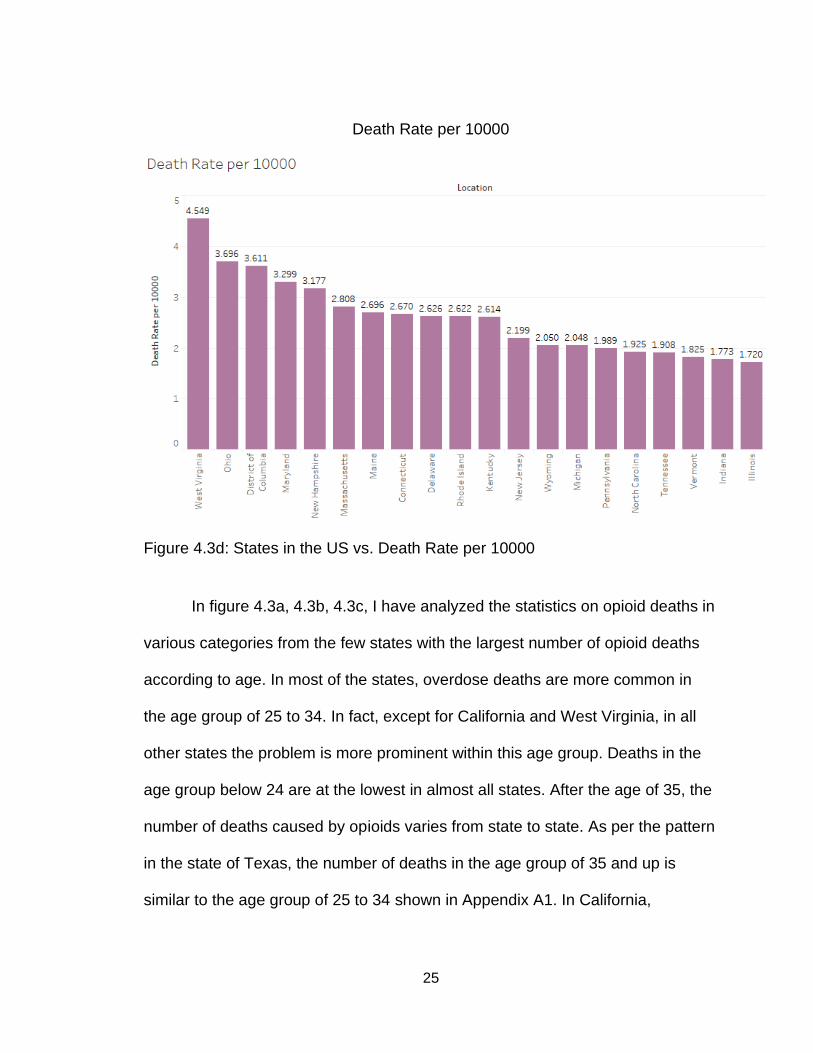
Death Rate per 10000
Figure 4.3d: States in the US vs. Death Rate per 10000
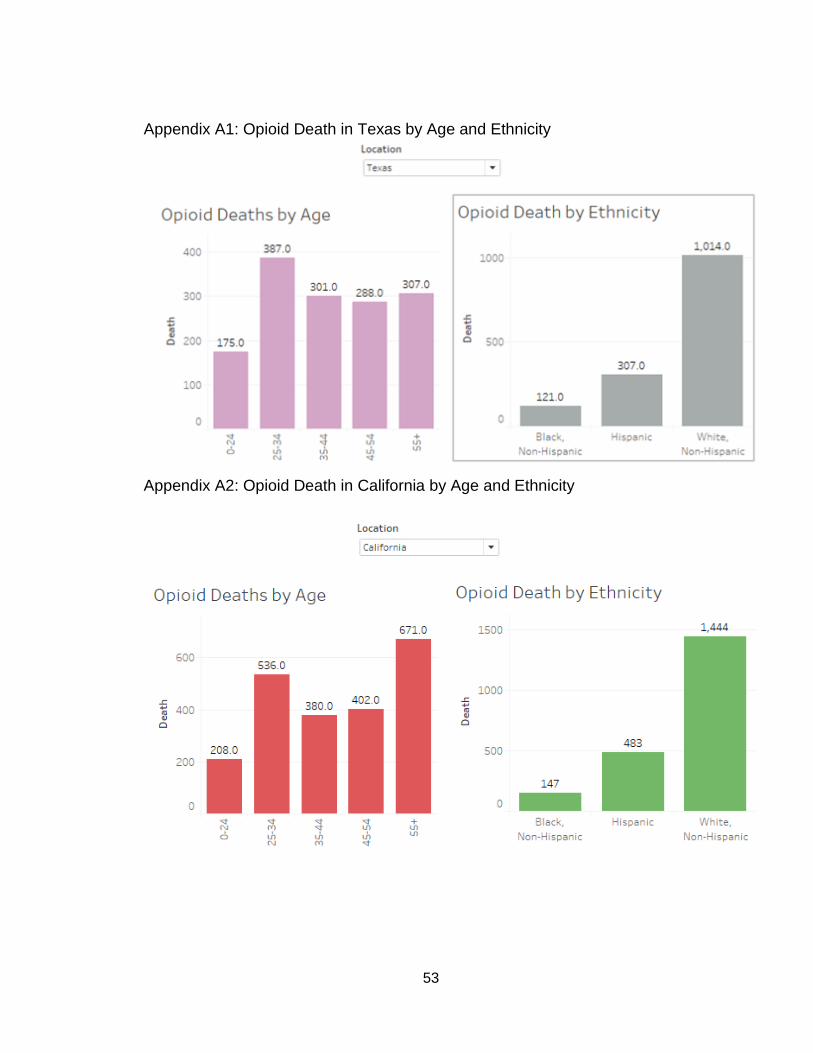
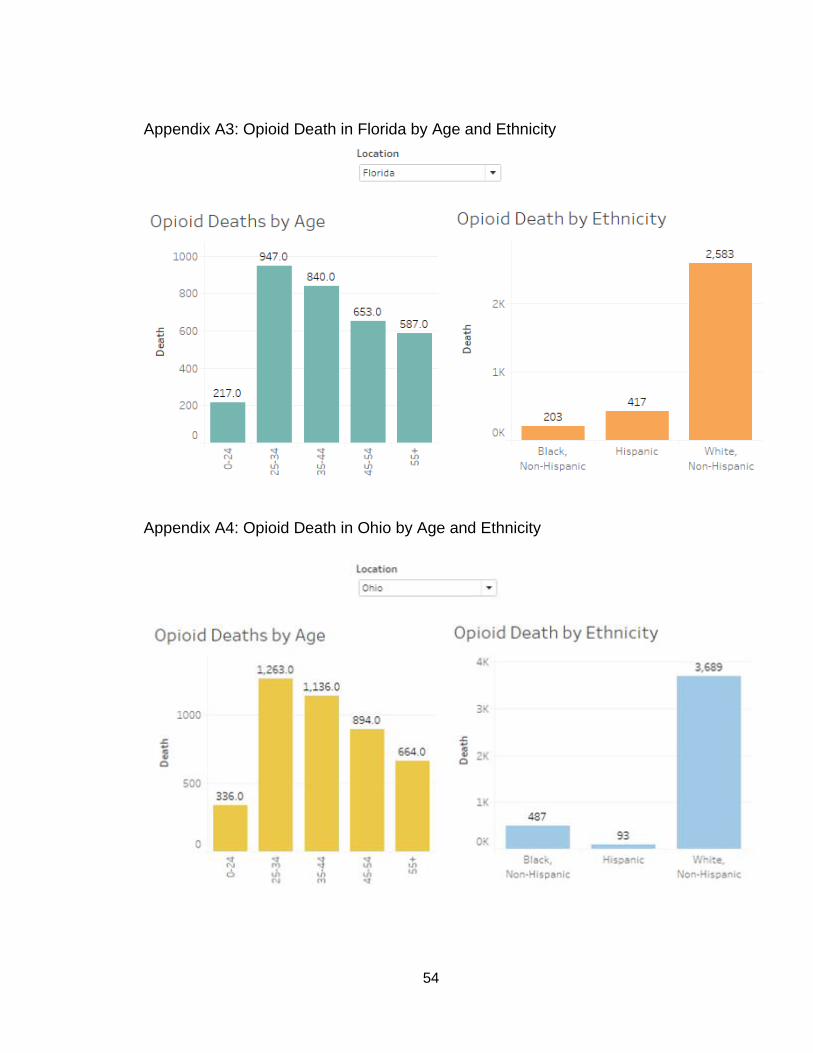
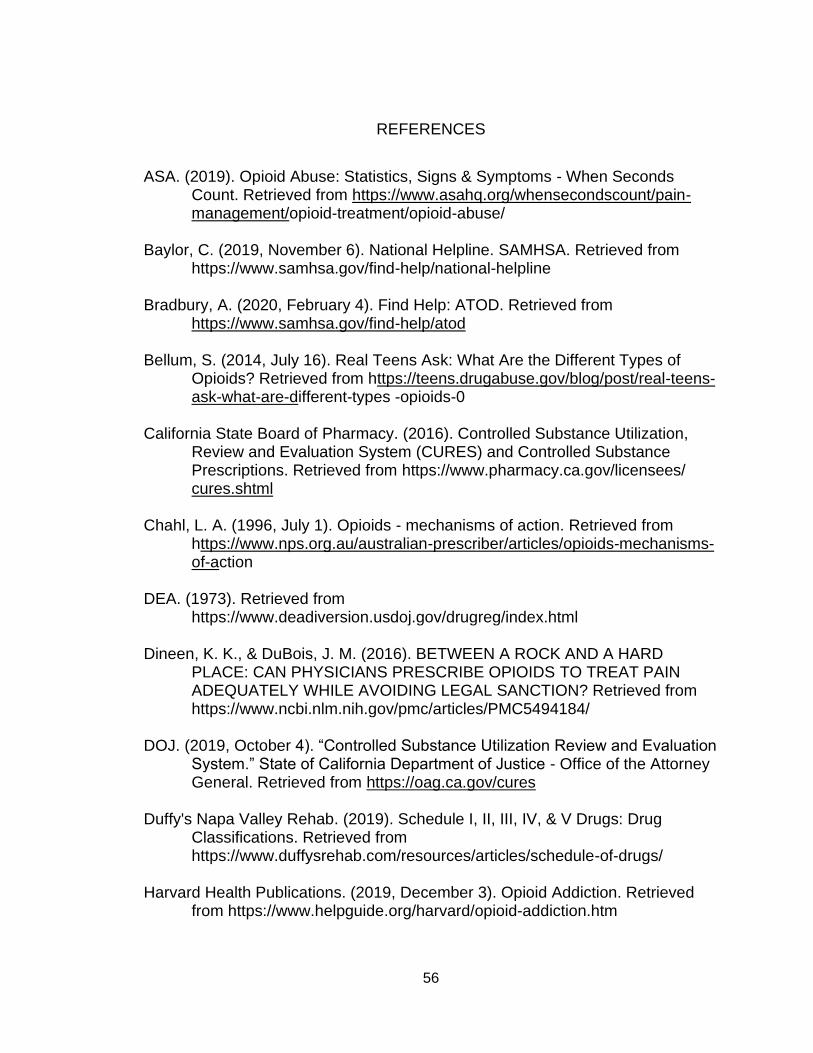
In figure 4.3a, 4.3b, 4.3c, I have analyzed the statistics on opioid deaths in
various categories from the few states with the largest number of opioid deaths
according to age. In most of the states, overdose deaths are more common in
the age group of 25 to 34. In fact, except for California and West Virginia, in all
other states the problem is more prominent within this age group. Deaths in the
age group below 24 are at the lowest in almost all states. After the age of 35, the
number of deaths caused by opioids varies from state to state. As per the pattern
in the state of Texas, the number of deaths in the age group of 35 and up is
similar to the age group of 25 to 34 shown in Appendix A1. In California,
26
surprisingly the number of deaths is more severe in the people of age 55 and
above compared to other states shown in Appendix A2.
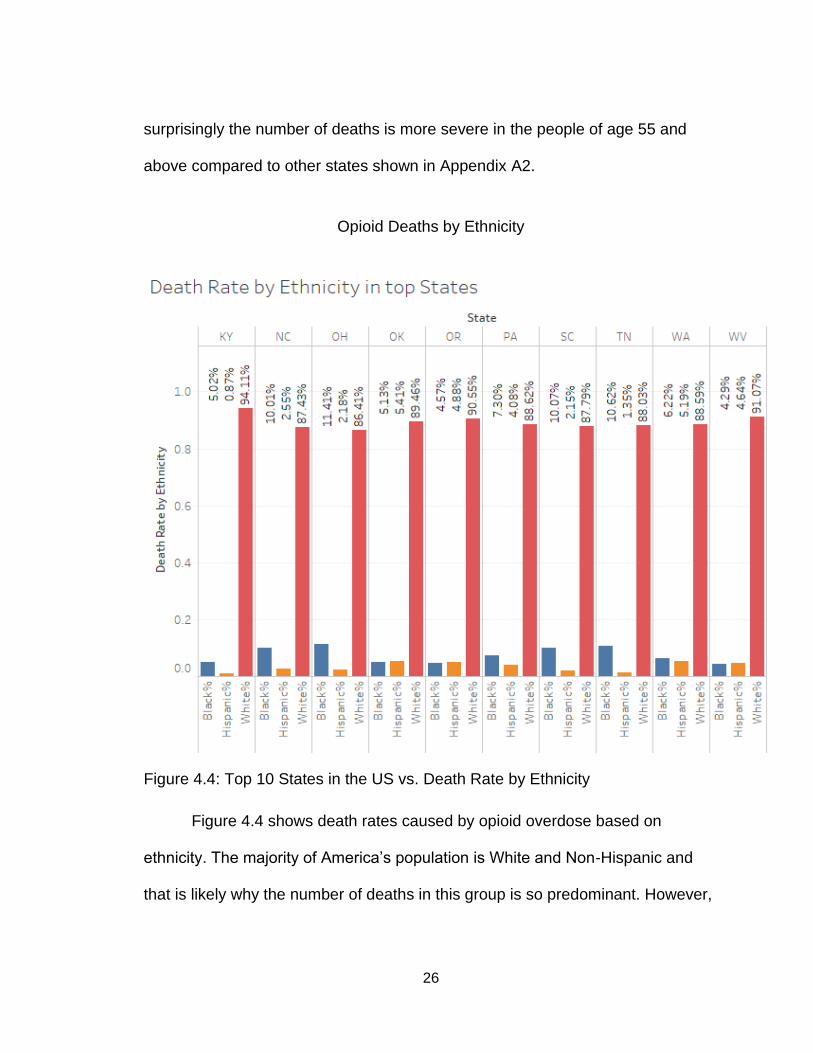
Opioid Deaths by Ethnicity
Figure 4.4: Top 10 States in the US vs. Death Rate by Ethnicity
Figure 4.4 shows death rates caused by opioid overdose based on
ethnicity. The majority of America’s population is White and Non-Hispanic and
that is likely why the number of deaths in this group is so predominant. However,
27
the Hispanic population is ranked second followed by the white population in
most of the states. Black and Non-Hispanic people rank the lowest in these
charts.
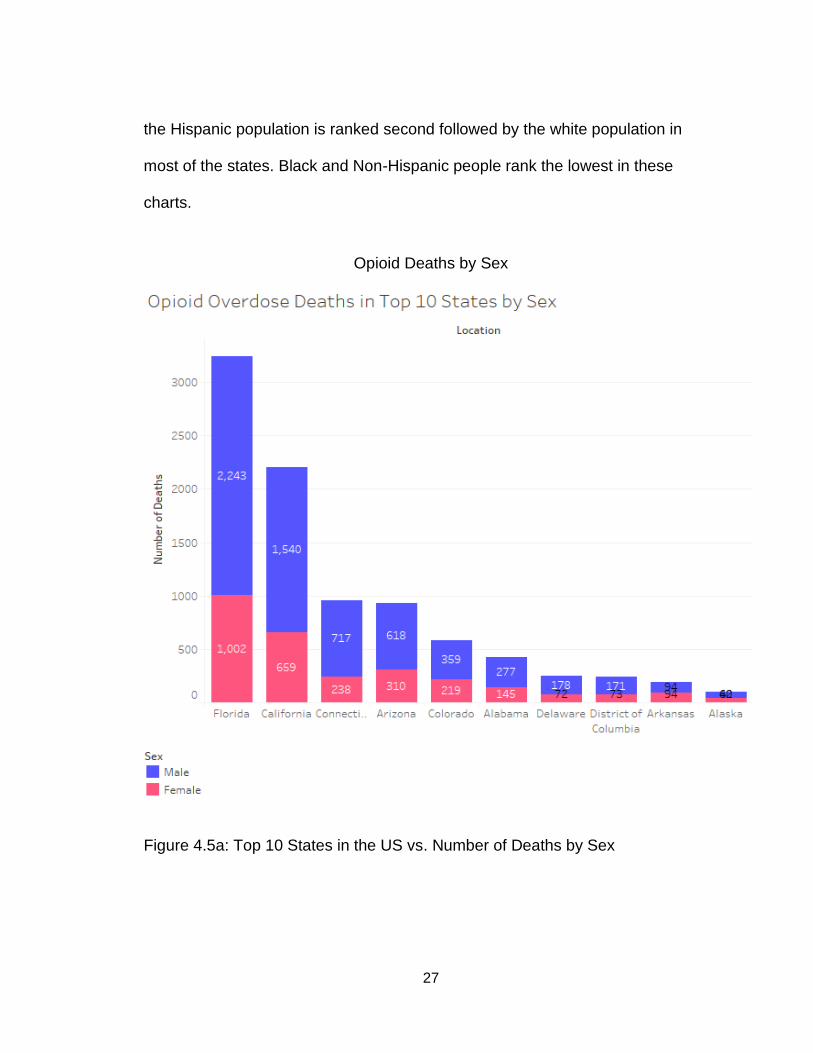
Opioid Deaths by Sex
Figure 4.5a: Top 10 States in the US vs. Number of Deaths by Sex
28
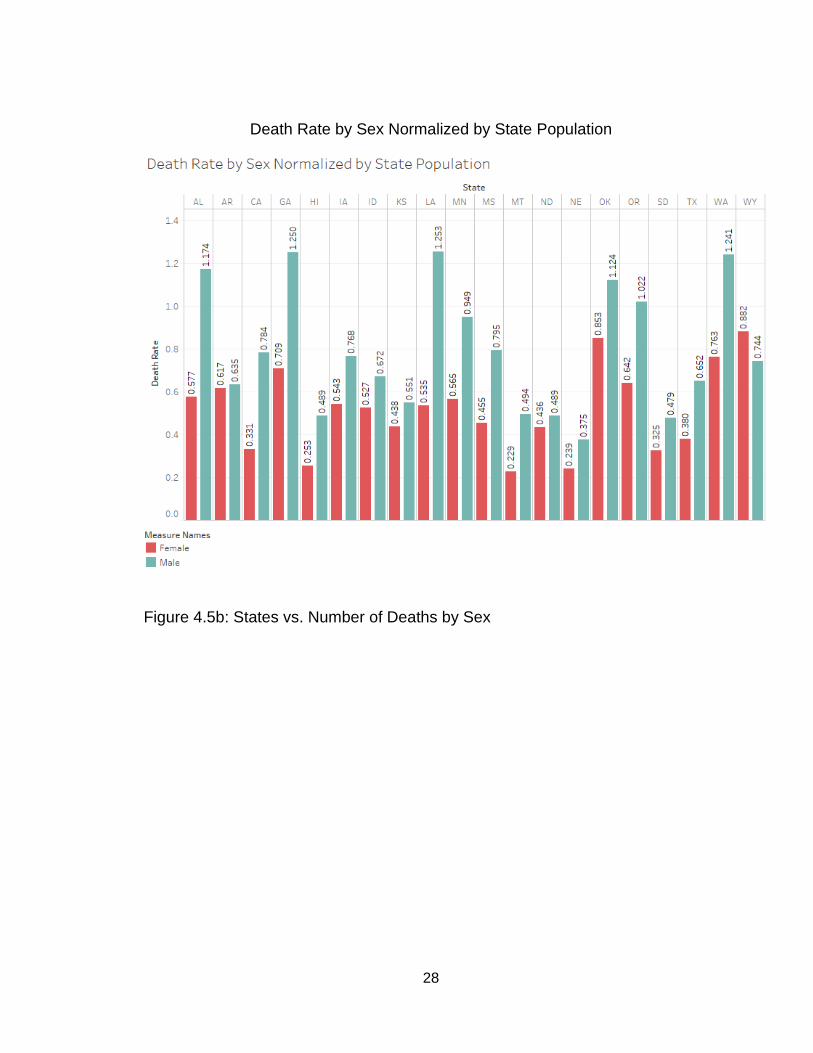
Death Rate by Sex Normalized by State Population
Figure 4.5b: States vs. Number of Deaths by Sex
29
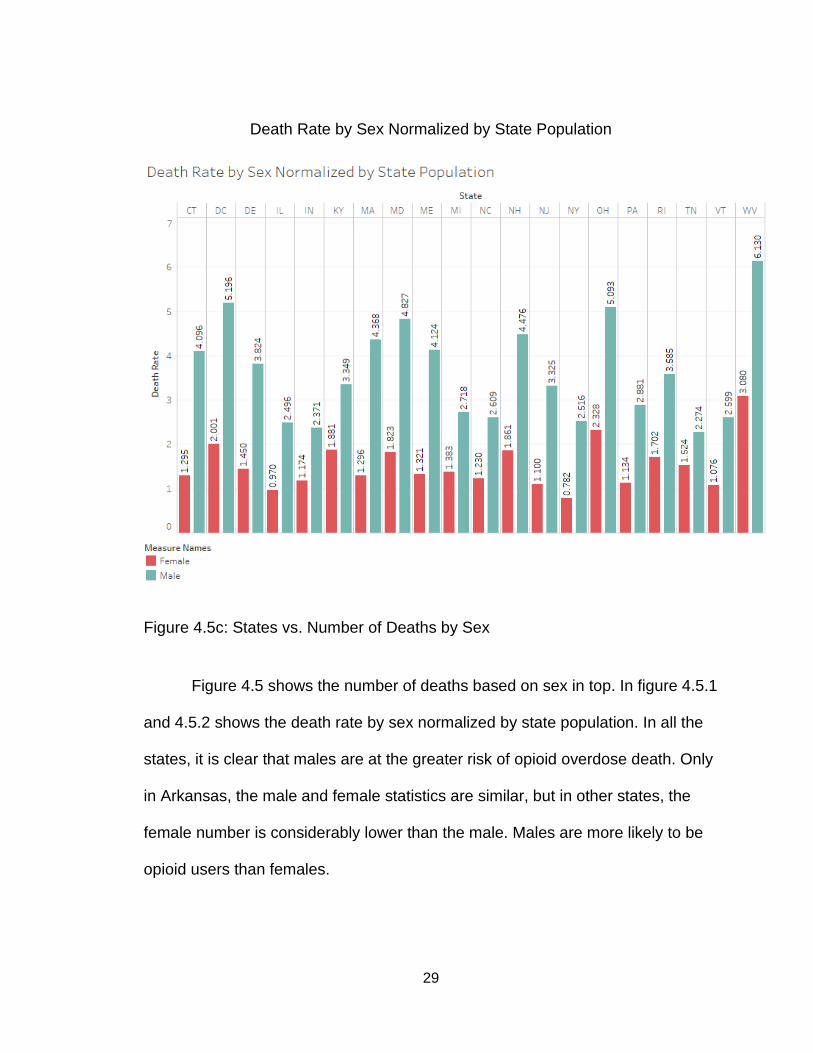
Death Rate by Sex Normalized by State Population
Figure 4.5c: States vs. Number of Deaths by Sex
Figure 4.5 shows the number of deaths based on sex in top. In figure 4.5.1
and 4.5.2 shows the death rate by sex normalized by state population. In all the
states, it is clear that males are at the greater risk of opioid overdose death. Only
in Arkansas, the male and female statistics are similar, but in other states, the
female number is considerably lower than the male. Males are more likely to be
opioid users than females.
30
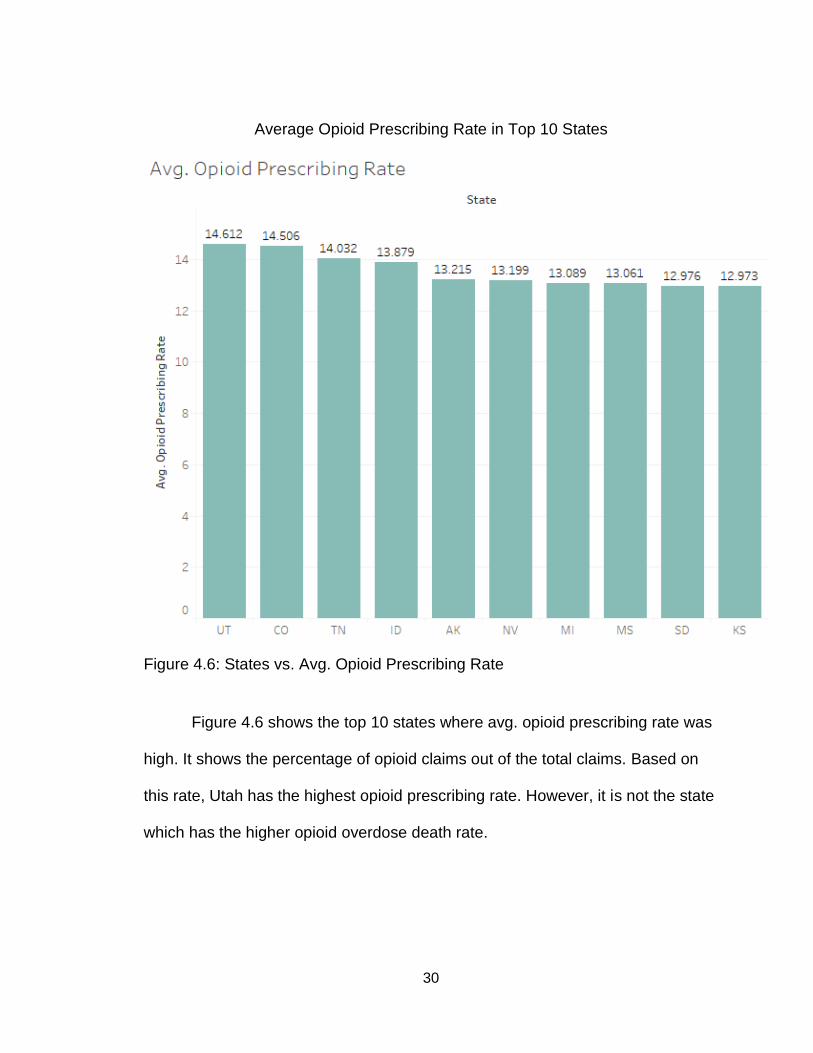
Average Opioid Prescribing Rate in Top 10 States
Figure 4.6: States vs. Avg. Opioid Prescribing Rate
Figure 4.6 shows the top 10 states where avg. opioid prescribing rate was
high. It shows the percentage of opioid claims out of the total claims. Based on
this rate, Utah has the highest opioid prescribing rate. However, it is not the state
which has the higher opioid overdose death rate.
31
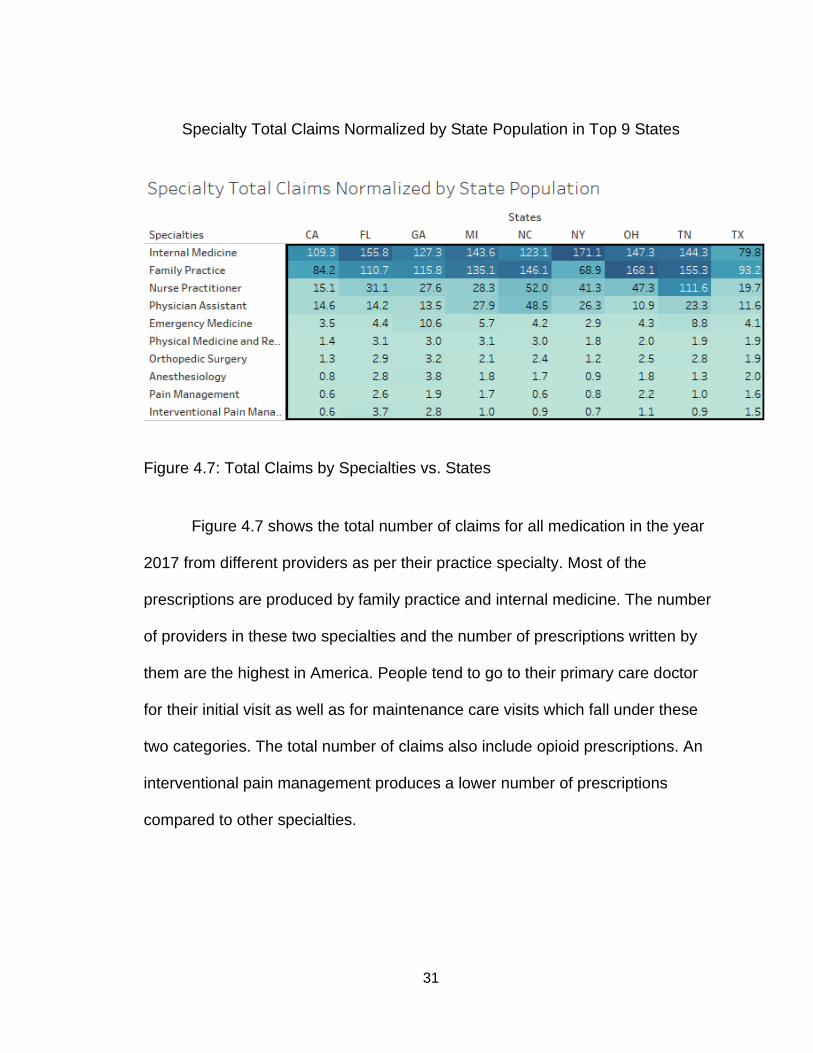
Specialty Total Claims Normalized by State Population in Top 9 States
Figure 4.7: Total Claims by Specialties vs. States
Figure 4.7 shows the total number of claims for all medication in the year
2017 from different providers as per their practice specialty. Most of the
prescriptions are produced by family practice and internal medicine. The number
of providers in these two specialties and the number of prescriptions written by
them are the highest in America. People tend to go to their primary care doctor
for their initial visit as well as for maintenance care visits which fall under these
two categories. The total number of claims also include opioid prescriptions. An
interventional pain management produces a lower number of prescriptions
compared to other specialties.
32
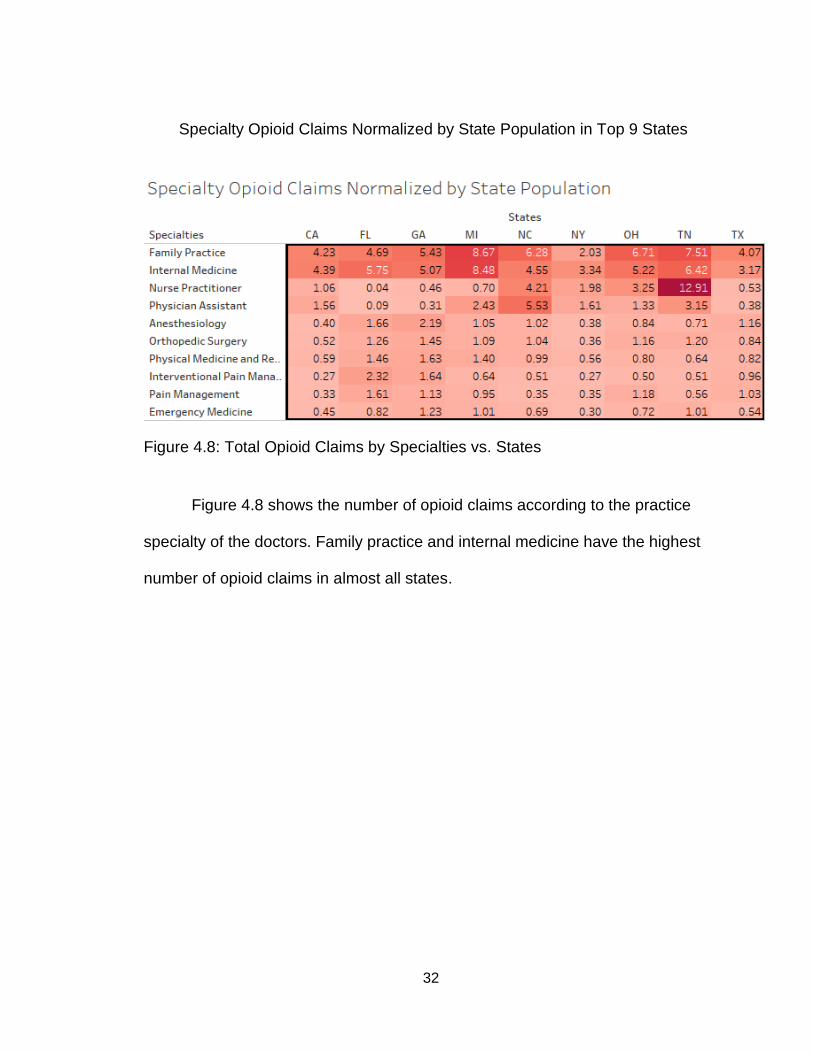
Specialty Opioid Claims Normalized by State Population in Top 9 States
Figure 4.8: Total Opioid Claims by Specialties vs. States
Figure 4.8 shows the number of opioid claims according to the practice
specialty of the doctors. Family practice and internal medicine have the highest
number of opioid claims in almost all states.
33
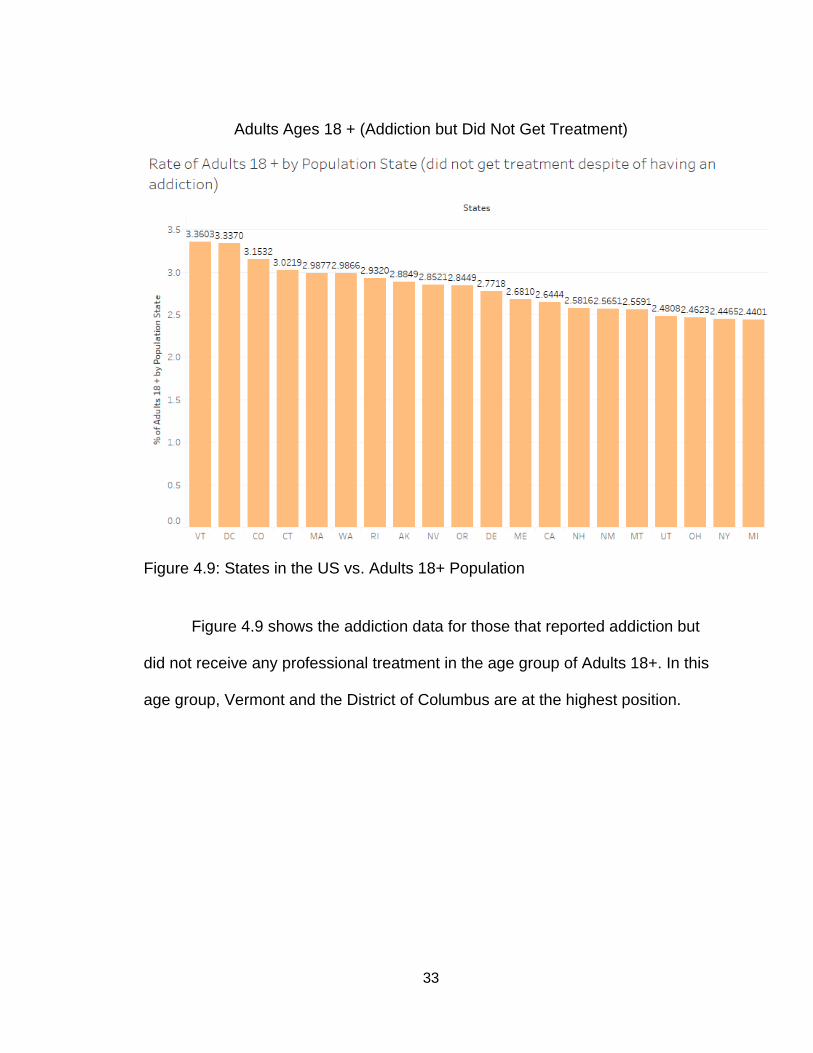
Adults Ages 18 + (Addiction but Did Not Get Treatment)
Figure 4.9: States in the US vs. Adults 18+ Population
Figure 4.9 shows the addiction data for those that reported addiction but
did not receive any professional treatment in the age group of Adults 18+. In this
age group, Vermont and the District of Columbus are at the highest position.
34
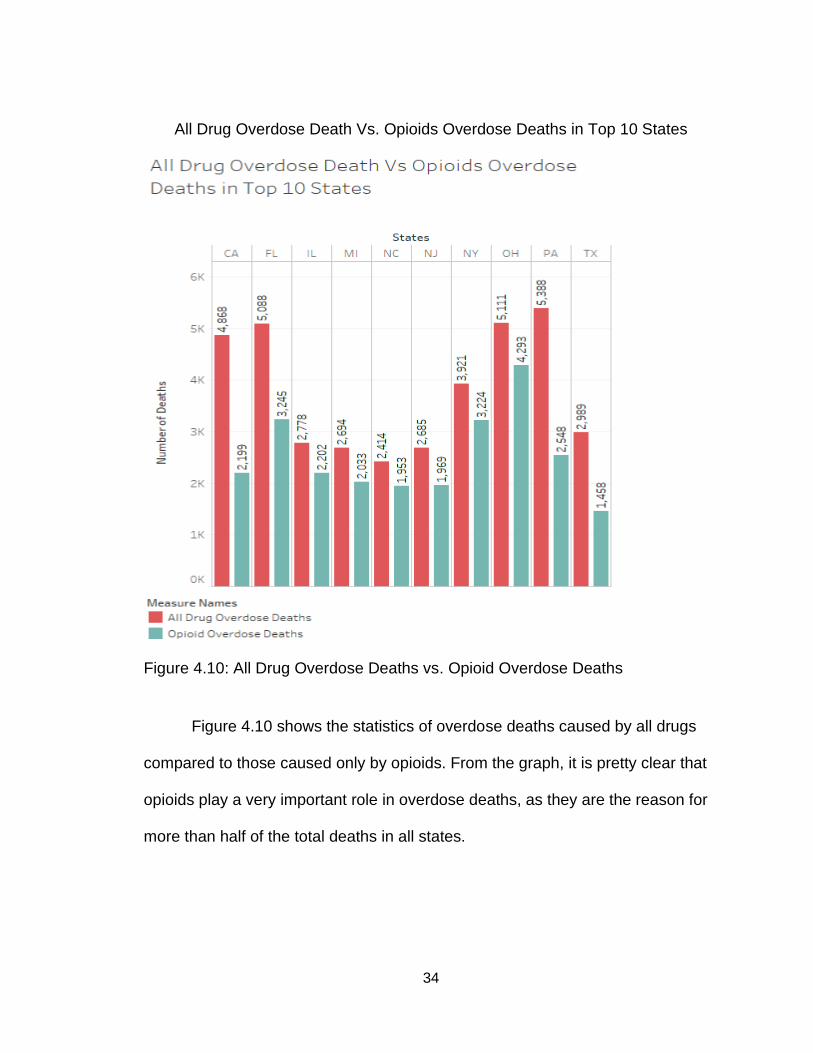
All Drug Overdose Death Vs. Opioids Overdose Deaths in Top 10 States
Figure 4.10: All Drug Overdose Deaths vs. Opioid Overdose Deaths
Figure 4.10 shows the statistics of overdose deaths caused by all drugs
compared to those caused only by opioids. From the graph, it is pretty clear that
opioids play a very important role in overdose deaths, as they are the reason for
more than half of the total deaths in all states.
35
Opioid Misused Normalized by State Population
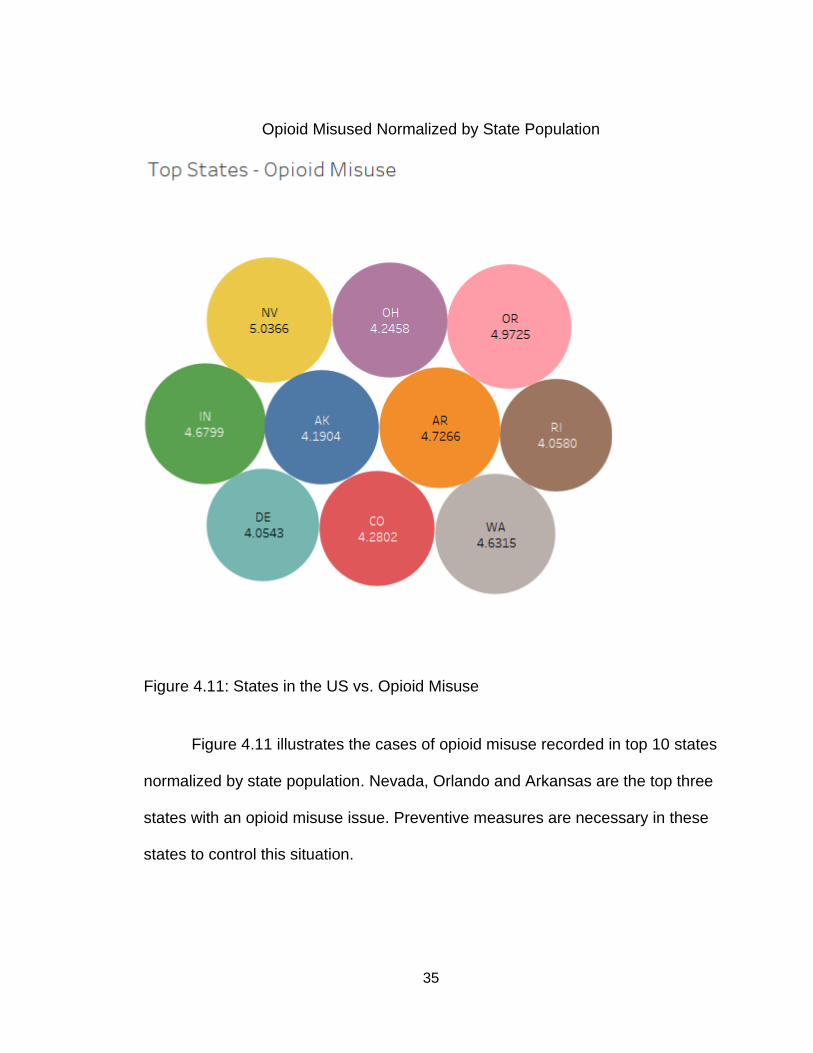
Figure 4.11: States in the US vs. Opioid Misuse
Figure 4.11 illustrates the cases of opioid misuse recorded in top 10 states
normalized by state population. Nevada, Orlando and Arkansas are the top three
states with an opioid misuse issue. Preventive measures are necessary in these
states to control this situation.
36
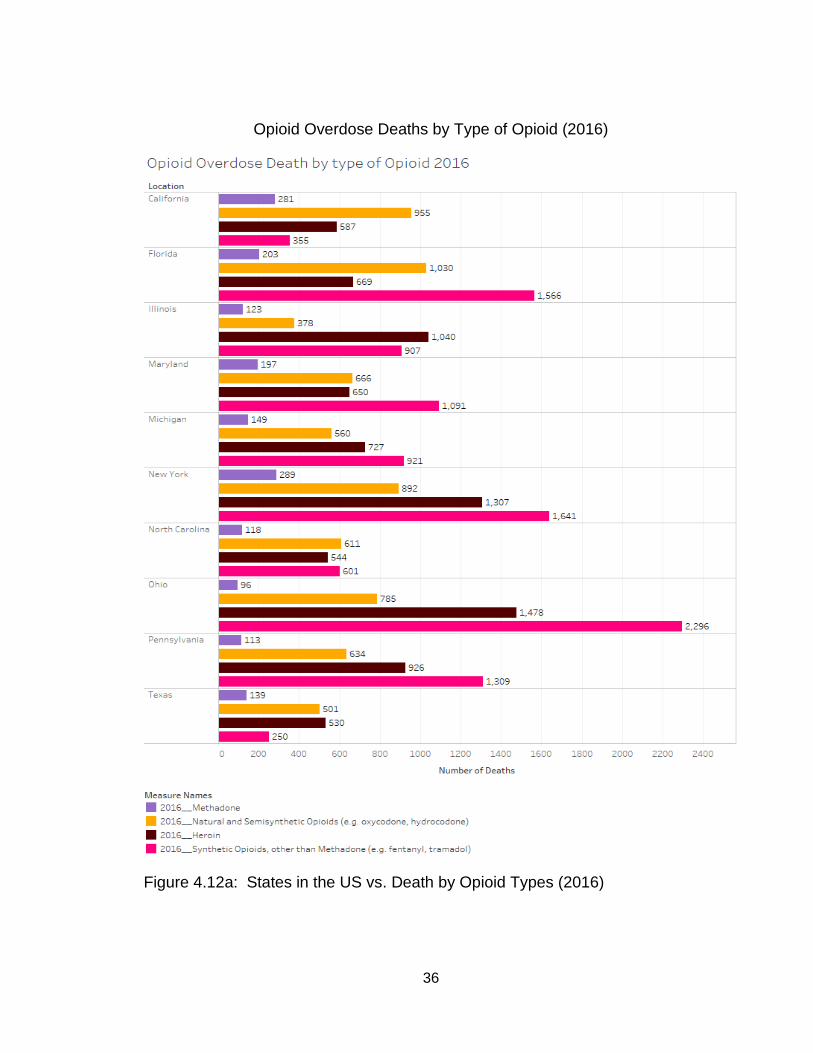
Opioid Overdose Deaths by Type of Opioid (2016)
Figure 4.12a: States in the US vs. Death by Opioid Types (2016)
37
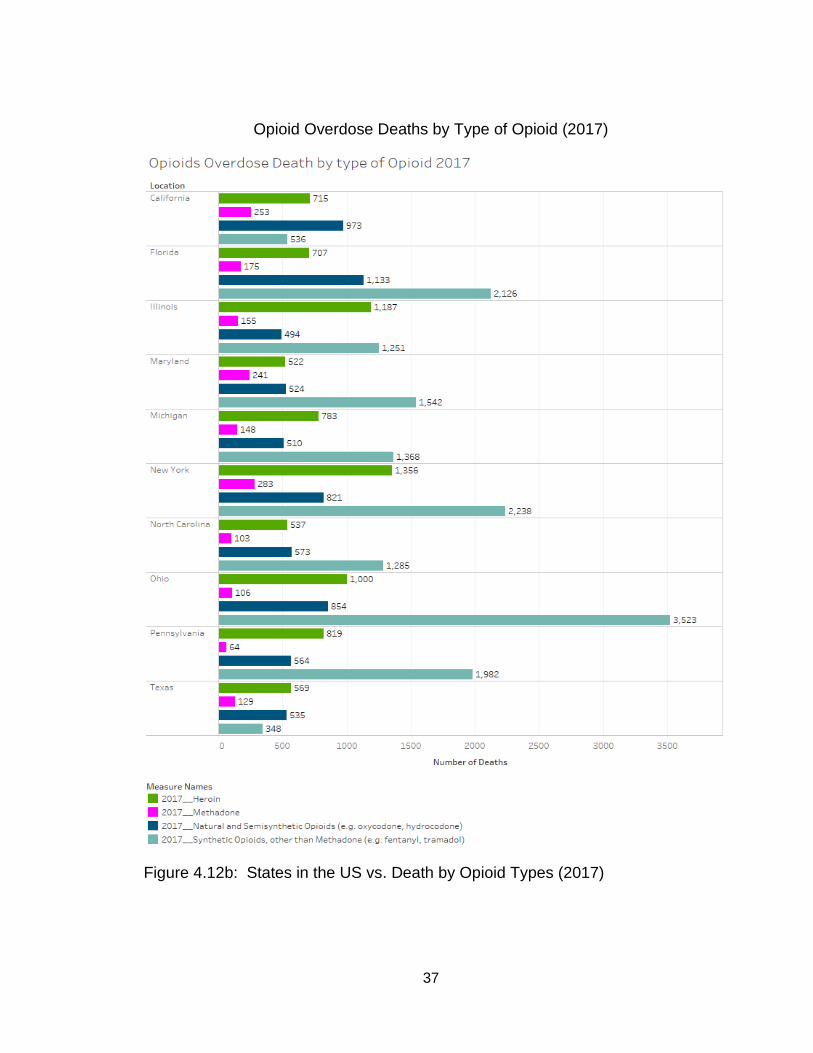
Opioid Overdose Deaths by Type of Opioid (2017)
Figure 4.12b: States in the US vs. Death by Opioid Types (2017)
38
Figure 4.12a and 4.12b shows the comparison of deaths caused by
different kinds of opioids in 2016 and 2017. In both years, synthetic opioids like
Methadone, Fentanyl, etc. are more responsible for the overdose deaths than
natural opioids. This pattern is similar in most of the states. It is also interesting to
see a significant number of deaths caused by heroin even though illegal. Heroin
alone has caused half the total number of deaths that were caused by synthetic
opioids.
By looking at the statistics, it is very clear that the number of overdose
deaths have increased from 2016 to 2017.
39
CHAPTER FIVE:
MINIMIZING TECHNIQUES
By analyzing the above data, it is shown that certain states and
communities are highly affected by addiction problems. We should enhance
education and awareness to high risk areas about opioids and its side effects.
Most of the users of opioids are not aware of its short term and long term effects
on their body. They think of these medications just like any other medication.
These people need to be educated first before initiating the opioid therapy (HHP,
2019). Doctors and other healthcare facilities should provide detailed information
about medication. The patient should be educated about the mechanism of
action of drugs, how it works on the body, what are the usage of the medication
and its side effects, and its interaction with other medication and its side effects.
It is very common that patients are unaware of the adverse drug reaction or
allergic reaction caused by the medication (Staff, 2019). In this case if a patient
gets any reaction after taking the opioid medication, it is possible that they do not
know the reason behind it which could be due to use of that particular
medication. To prevent this situation, the patient must be aware of the effects of
the opioid medication.
Any opioid prescription must be dispensed with the overdose countering
medication such as Narcan Nasal Spray. Sometimes, patients accidentally ingest
more than prescribed dose and may end up in an emergency due to overdose.
40
Narcan nasal spray is very easy to use in such conditions to avoid
hospitalization. Narcan is an opioid antagonist which is used to quickly reverse
effects of opioids.
It should be mandatory to check the CURES profile before dispensing any
control substance prescription. Many doctors and pharmacies do not follow the
guidelines to safely dispense opioids and abusers take advantage of this
situation to obtain opioids from multiple locations. Any healthcare facilities should
be closely monitored to ensure safe dispensing practices (CSBP, 2016).
Data shows that the age group from 24 to 35 is more susceptible to opioid
overdose. There could be a possible explanation for this condition because
individuals within the age group of 25 to 34 are often those trying to build their
career professionally and personally. They are likely to be more stressed during
this time and hence more vulnerable to get opioids to relieve stress or even to
enhance their performance. Lack of education and awareness at this age may
also be the cause of overdoses. These people should be closely monitored and
followed up after each opioid prescription. Below age 24, the opioid death rate is
low in most states. This is due to the time it takes most individuals to develop an
addiction and therefore by the time that an individual is addicted they have
passed the age of 25. Also, it is rare to get an opioid prescription below the age
of 18. No more than one month supply of opioids should be given at a time to
avoid large quantities and risk of overdose.
41
The data also shows that there are a huge number of people who reported
to get opioid overdose but did not receive treatment. This may be because they
are unable to reach the correctional facilities for such reasons: lack of transport,
financial outage, lack of knowledge, low inspiration or motivation, or lack of family
support, etc. (Kelley, 2020).
More rehabilitation centers should be created with endless support to the
ones who need it. There are several different programs available to the addicts
who help and support them to fight back with addiction problems, but to some
extent they are not efficient enough to control the problems. The programs
should be expanded to reach more and more people who are in need to fight
back with addiction (Kelley, 2020).
Family practice and Internal medicine has prescribed more opioid claims
compared to other specialties. Looking at these facts, the Drug Enforcement
Agency (DEA) has recently notified these practitioners to provide a maximum of
7 days' supply of narcotics or opioids as a part of initial pain management
therapy. If patients need more than that they need to be referred to pain
management specialists for further treatment.
In Vermont and the District of Columbus were reported highest for adults
18+ who did not receive treatment after being addicted. This can be a serious
problem. If a person is reported to have an addiction problem, they should be
given immediate attention and treatment. If treatment is not pursued, addiction
42
can lead to misuse and overdose (NIDA, 2019). Sometimes because of social
pressure and stigma, a person is hesitant to go to the rehabilitation center. They
may think if they go to a rehabilitation center, they may forever be labeled as an
addict and lose their pride and respect. Some reasons for not getting treatment
also include lack of knowledge, financial burden or unreachable treatment
facilities (Kelley, 2020).
Based on the analyzed data, certain types of opioids such as Fentanyl and
Methadone are more accountable for overdose deaths. Synthetic opioids are
proven to be more effective for the pain management treatment. Therefore, most
people prefer to have synthetic opioids over natural or semi-synthetic. These
classes of drugs cause a high level of dependence and by the end of treatment a
person is very likely to become addicted to them. After prolonged usage, it
becomes really hard for them to avoid using synthetic opioids or to navigate to
other mild opioids like hydrocodone and oxycodone (Bellum, 2014). Doctors
should minimize use of these opioids and focus on safer options like oxycodone
and hydrocodone. Patients should be encouraged to use alternate ways of
treatment instead of using opioids by physicians and pharmacists. Most of the
patients develop dependence after repetitive use of opioids. To avoid this
situation, patients should be gradually weaned off the use of opioids to ensure
the end of opioid treatment. This way, a person will not crave for the opioid
medication unnecessarily. It would be helpful to refer the patients to skilled
nursing facilities if they are using high risk opioids. The healthcare professionals
43
will monitor the dosing of the opioids for disabled or aged patients (Dineen &
DuBois, 2016).
Limitation
Data used for the analysis in this project are derived from one source. It is
possible that other sources may have slightly different information and facts.
Suggestions made in this project are based upon the market situation of the 2017
opioid crisis. There is scope of changes in death rate and addiction pattern in the
past two years. Factors considered during this research are limited to age, sex,
ethnicity, prescriber type and types of opioids. There are a number of other
factors such as social and mental state of patient, type of disease they are
treating, duration of opioid use, etc. which can possibly make difference in the
conclusion of this project.
44
CHAPTER SIX:
FUTURE WORK
Pain is a subjective matter. The problem with the pain is that it cannot be
measured. When a person visits a doctor and complains about having pain, there
is not a way that doctor can analyze if the patient is actually in pain. In that case,
the treatment starts with simple pain medication. However, a constant complaint
of having pain by a patient leads to a treatment with opioids. As per CDC, opioid
users can get prescription for themselves, from their family and buy them on the
streets illegally. Therefore, it is almost impossible for a physician to know that the
patient is a legitimate opioid user or has an addict (Media, 2014). In that case, if
we can find some ways for a doctor to know the patient more efficiently that
patient is not abusing the pain medication. It would help to limit the misuse of
opioid prescription.
After doing some research, one method to prevent the misuse of opioid
medicine is by creating an application (Opioid Intake Measurement System)
which can constantly observe a patient's blood concentration for a certain high
risk opioids. The science behind this process is to create a sensor which can be
applied on the skin which measures the level of different opioids in a person's
blood stream and send the signals to the application. Veracious kinds of opioids
have their threshold which determines the minimum amount of drug
concentration needed in blood for them to produce therapeutic effects. The dose
45
of the medication is determined by this threshold. Also, there is a maximum limit
to this concentration which can be safely tolerated by the body with minimum or
no side effects. If the blood concentration goes beyond this limit, it could cause a
very serious reaction or side effects (“Keep Track of Taking your Medicine,”
2019).
Sensor
It can be a biologically made sensor which can be worn on the skin. It can
stick to a body with adhesive material. This sensor should check the blood
stream below the skin without any pricking or pain. The time interval between
each measurement can be adjusted as per the need. The sensor should have an
inbuilt battery and necessary components to perform its job. The sensor should
be good for one week to one month depending on the size and capacity. The
measurement data can be transmitted to the application downloaded in patients'
as well as physicians' cell phone devices.
Application
Application should collect the data provided by the sensor. This data can
be classified in the application in various categories such as Date, Time, Type of
opioids, Minimum and Maximum concentration of particular opioid in blood, etc.
Physicians should analyze this data to determine the patient's legitimacy of
opioid use. This application should also send notification to physician or patient’s
relative in case blood levels go beyond accepted limits. This application should

46
also be helpful to monitor patient compliance of oral opioids. The access to the
application should be provided to patients, physician, hospital and acute care
agencies as well as police.
47
Modules and their Descriptions
Doctor and Healthcare Facilities.
● Create an account: Doctors and healthcare facilities will create an
account with their name and title and register with their National
Provider Identifier (NPI) number.
● Login: Doctors and healthcare facilities will login to the system using
their ID and Password.
● Search patient’s information: Doctors and healthcare facilities will
search the patient’s information: last name, first name, and date of
birth
● Analyze the Data: Doctors and healthcare facilities will analyze the
patient’s data regarding the intake of opioids.
Patients.
● Create an account: Patient will create an account with their first and
last name, date of birth and social security number.
● Login: Patient will login to the system using their ID and Password.
● Pair mode: Patient will pair their sensor with the application.
● Measurement and Analyze Data: Patients will be able to see their
intake of opioids via the application.
48
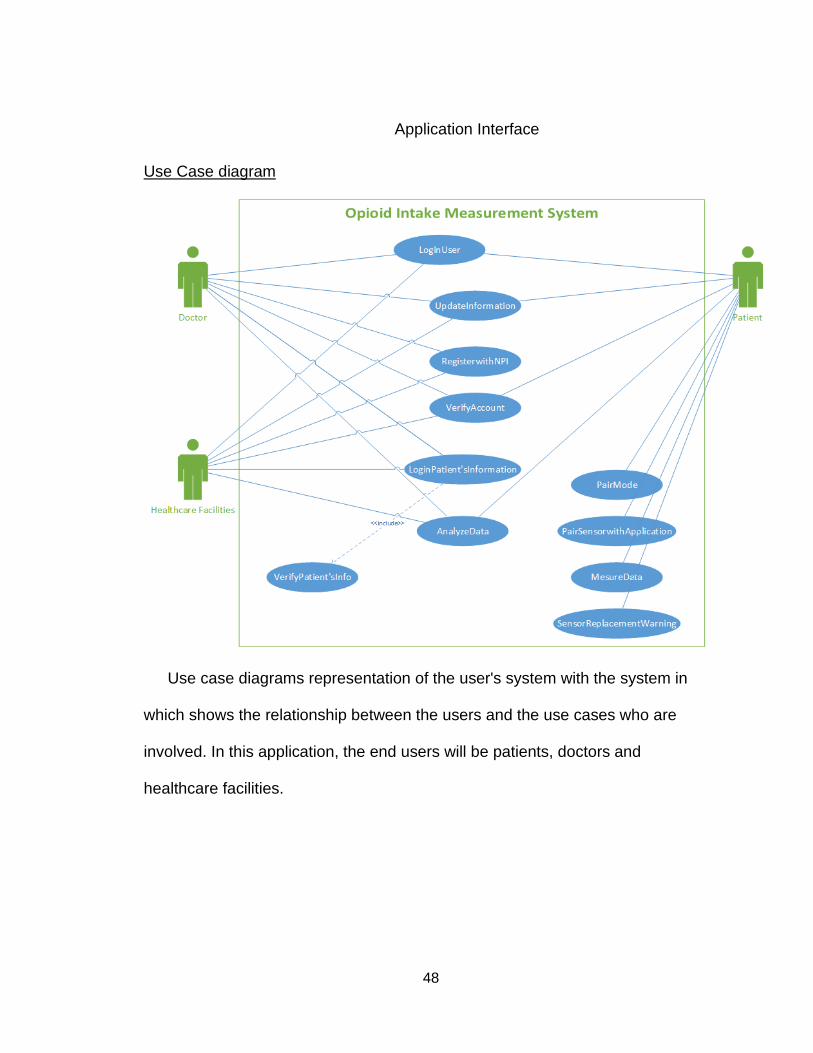
Application Interface
Use Case diagram
Use case diagrams representation of the user's system with the system in
which shows the relationship between the users and the use cases who are
involved. In this application, the end users will be patients, doctors and
healthcare facilities.
49
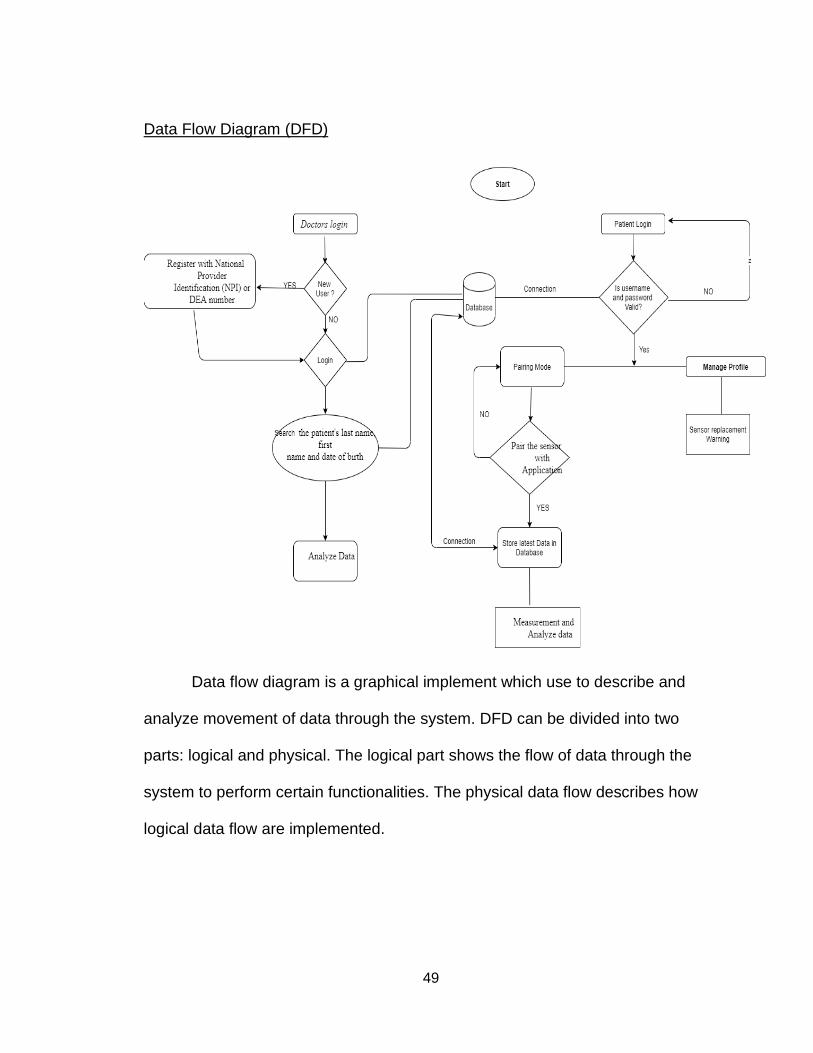
Data Flow Diagram (DFD)
Data flow diagram is a graphical implement which use to describe and
analyze movement of data through the system. DFD can be divided into two
parts: logical and physical. The logical part shows the flow of data through the
system to perform certain functionalities. The physical data flow describes how
logical data flow are implemented.
50
CHAPTER SEVEN:
CONCLUSION
On the whole, the current policy and programs to regulate the use of
opioids are not efficient enough to reduce the overdose crisis. Despite spending
millions of dollars, drug abuse and overdose death are increasing.
This project shows the statistics of opioid overdose deaths in the United
States which concludes that the most opioid overdose death rate is in West
Virginia State, within the age of 25 to 34 in mostly all states, in the white
community. Synthetic opioids among all other opioids are shown to be worse.
The research also gathered that family practice and internal medicine doctors
produce most of the opioid prescriptions which is the group that should be
focused on in the future in order to decrease the number of opioid prescriptions
given out.
To minimize the opioid overdose, alternative pain management therapy
should be used. Also, limit the use of synthetic opioids and try to divert patients
towards safer opioids. Pain management treatment should be ended with the use
of withdrawal management drugs such as Narcan and Suboxone to help the
withdrawal symptoms. The number of rehab facilities should be increased to
reach out to every affected area and should increase awareness of their centers.
Also, addicted people should be encouraged to use them. In the future, digital

51
approaches should be established to monitor controlled substance usage in
patients such as auto-read sensor and application technology.

52
APPENDIX A
53
Appendix A1: Opioid Death in Texas by Age and Ethnicity
Appendix A2: Opioid Death in California by Age and Ethnicity
54
Appendix A3: Opioid Death in Florida by Age and Ethnicity
Appendix A4: Opioid Death in Ohio by Age and Ethnicity
55
Appendix A5: Opioid Death in New York by Age and Ethnicity
56
REFERENCES
ASA. (2019). Opioid Abuse: Statistics, Signs & Symptoms - When Seconds Count. Retrieved from https://www.asahq.org/whensecondscount/pain- management/opioid-treatment/opioid-abuse/ Baylor, C. (2019, November 6). National Helpline. SAMHSA. Retrieved from https://www.samhsa.gov/find-help/national-helpline Bradbury, A. (2020, February 4). Find Help: ATOD. Retrieved from https://www.samhsa.gov/find-help/atod Bellum, S. (2014, July 16). Real Teens Ask: What Are the Different Types of Opioids? Retrieved from https://teens.drugabuse.gov/blog/post/real-teens- ask-what-are-different-types -opioids-0 California State Board of Pharmacy. (2016). Controlled Substance Utilization, Review and Evaluation System (CURES) and Controlled Substance Prescriptions. Retrieved from https://www.pharmacy.ca.gov/licensees/ cures.shtml Chahl, L. A. (1996, July 1). Opioids - mechanisms of action. Retrieved from
https://www.nps.org.au/australian-prescriber/articles/opioids-mechanisms-of-action
DEA. (1973). Retrieved from https://www.deadiversion.usdoj.gov/drugreg/index.html Dineen, K. K., & DuBois, J. M. (2016). BETWEEN A ROCK AND A HARD PLACE: CAN PHYSICIANS PRESCRIBE OPIOIDS TO TREAT PAIN ADEQUATELY WHILE AVOIDING LEGAL SANCTION? Retrieved from https://www.ncbi.nlm.nih.gov/pmc/articles/PMC5494184/ DOJ. (2019, October 4). “Controlled Substance Utilization Review and Evaluation
System.” State of California Department of Justice - Office of the Attorney General. Retrieved from https://oag.ca.gov/cures
Duffy's Napa Valley Rehab. (2019). Schedule I, II, III, IV, & V Drugs: Drug
Classifications. Retrieved from https://www.duffysrehab.com/resources/articles/schedule-of-drugs/
Harvard Health Publications. (2019, December 3). Opioid Addiction. Retrieved from https://www.helpguide.org/harvard/opioid-addiction.htm
57
Højsted, J., & Sjøgren, P. (2012, January 9). Addiction to opioids in chronic pain patients: A literature review. Retrieved from https://onlinelibrary.wiley.com/doi/abs/10.1016/j.ejpain.2006.08.004 Horvath, T., Misra, K., Epner, A., & Cooper, G. (2018, July 13). Drug Seeking and Cravings: Addictions' Effect on the Brain's Reward System. Retrieved from https://www.centersite.net/poc/view_doc.php?type=doc&id=48375 &cn=1408
Keep Track of Taking Your Medicine - ABILIFY MYCITE® System. (2019, September). Retrieved from https://www.abilifymycite.com/patient?utm_source=google&utm_ medium=cpc&utm_term=abilify&utm_content=gs- abilify_mycite_alone_ph&utm_campaign=gs-branded_alone
Kelley, R. (2020, February 4). What Are the Barriers to Accessing Addiction Treatment? Retrieved from https://americanaddictioncenters.org/rehab- guide/treatment-barriers
Lopez, G. (2017, January 17). The 3 deadliest drugs in America are legal. Retrieved from https://www.vox.com/2014/5/19/5727712/drug-alcohol- deaths Media, R. (2014, April 10). Physicians are a leading source of prescription opioids for the highest-risk users. Retrieved from https://www.cdc.gov/media/releases/2014/p0303-prescription-opioids.html NIDA. (2019, June 27). Prescription Opioids. Retrieved from
www.drugabuse.gov/publications/drugfacts/prescription-opioids.
National Institute on Drug Abuse. (2019, January 22). Opioid Overdose Crisis. Retrieved from https://www.drugabuse.gov/drugs-abuse/opioids/opioid-overdose-crisis
Online (2017, August 2). Statement on the Opioid Abuse Epidemic.” American College of Surgeons. Retrieved from https://www.facs.org/about- acs/statements/ 100-opioid-abuse “Prescription Drug Monitoring Frequently Asked Questions (FAQ): The PDMP Training and Technical Assistance Center.” Prescription Drug Monitoring Frequently Asked Questions (FAQ) | The PDMP Training and Technical Assistance Center, www.pdmpassist.org/content/prescription-drug- monitoring-frequently-asked-questions-faq.
58
Registration Support: Controlled Substance Schedules. (2020, January). Retrieved from http://www.deadiversion.usdoj.gov/schedules/ Short- & Long-Term Side Effects of Opioids - Morphine Addiction & Abuse - Drug-Free World (2006). Foundation for a Drug-Free World, Retrieved from www.drugfreeworld.org/drugfacts/prescription/opioids-and-morphine- derivatives- Effects.html. Signs of Addiction: Drugs, Alcohol, & Prescription Drugs. (2020). Advanced Recovery Systems, Retrieved from https://www.advancedrecoverysystems.com/process-addiction/signs-of- addiction/ T., S. (2019, December 23). Deadliest Drugs: World's 5 Most Dangerous Drugs: Risks and Effects. Retrieved from https://oceanbreezerecovery.org/blog/deadliest-drugs/
Tyler, M. (2016, June 23). Recognizing an Addiction Problem. Retrieved from
https://www.healthline.com/health/addiction/recognizing-addiction Wein, H. (Ed.). (2017, September 8). Biology of Addiction. Retrieved from https://newsinhealth.nih.gov/2015/10/biology-addiction “What Is Addiction?” What Is Addiction? | Understanding the Disease | Hazelden Betty Ford, 2019 www.hazeldenbettyford.org/addiction/what-is-addiction “What States Need to Know about PDMPs.” Centers for Disease Control and Prevention, Centers for Disease Control and Prevention, 3 Oct. 2017, www.cdc.gov/drugoverdose/pdmp/states.html