Analysis of Wind Power Costs in Japan...2018/01/25 · civil engineering due to the reconstruction...
56
January 2018 Analysis of Wind Power Costs in Japan
Transcript of Analysis of Wind Power Costs in Japan...2018/01/25 · civil engineering due to the reconstruction...
January 2018
Analysis of
Wind Power Costs in Japan

Renewable Energy Institute Renewable Energy Institute is a non-profit think tank which aims to build a sustainable, rich society
based on renewable energy. It was established in August 2011, in the aftermath of the Fukushima
Daiichi Nuclear Power Plant accident, by its founder Mr. Son Masayoshi, Chairman & CEO of
SoftBank Corp., with his own resources.
www.renewable-ei.org/en/
Author Keiji Kimura, Senior Researcher at Renewable Energy Institute
Acknowledgments Renewable Energy Institute thanks all the wind power developers, equipment makers, consulting
firms, companies, wind power researchers and experts who provided critical information and shared
insightful comments this report greatly benefited from.
Among them, Renewable Energy Institute greatly thanks Japan Wind Power Association (JWPA), for
offering valuable recommendations about the development of the research and assessment of the
findings, as well as continuous and deep support for the entire project, especially with regard to
collection of cost data.
This research was partially funded by JSPS KAKENHI Grant Number JP16H01800.
Citation Renewable Energy Institute, Analysis of Wind Power Costs in Japan (Tokyo: REI, 2018), 50 pp. –
Translated from Japanese
© 2018 Renewable Energy Institute. All rights reserved.
Cover Photo Pattern Energy
Table of Contents
Summary ............................................................................................................... 1
Introduction ........................................................................................................... 2
Structure of wind power costs ............................................................................................... 2
Classification of factors impacting the wind power costs ..................................................... 3
1. Wind power costs across the world ................................................................... 6
2. Relevance of data collected ............................................................................. 10
Data collected ...................................................................................................................... 10
Relevance of cost data ......................................................................................................... 10
Trends in the locational distribution .................................................................................... 11
Trends in the size of wind power plants .............................................................................. 13
Geographic trends of locations ............................................................................................ 13
3. Analysis of investment costs ........................................................................... 15
Changes in investment costs over time................................................................................ 15
Relationship between the size of power plants and investment costs ................................. 16
Influence of different contract types on costs ...................................................................... 17
Investment costs in Japan: International comparison .......................................................... 19
4. Analysis of wind turbine costs ........................................................................ 21
Changes in turbine costs over time ...................................................................................... 21
Characteristics of turbines adopted in Japan ....................................................................... 21
Factors that cause changes in turbine costs in Japan ........................................................... 22
5. Analysis of civil engineering and electrical work costs .................................. 26
Changes of costs over time .................................................................................................. 26
Analysis of cost factor increases ......................................................................................... 27
6. Analysis of operation and maintenance costs ................................................. 35
O&M costs and their breakdown ......................................................................................... 35
International comparison of O&M costs ............................................................................. 35
Factors that impact O&M costs ........................................................................................... 36
7. Analysis of the actual amount of electricity generated ................................... 40
Availability factor ................................................................................................................ 40
Maintenance service providers and the actual availability factor ........................................ 41
Capacity factor ..................................................................................................................... 41
Conclusions and themes for further research ...................................................... 43
Review of the current state of wind power costs in Japan................................................... 43
Study on possible cost reductions for wind power .............................................................. 44
Themes for further research ................................................................................................. 47
References ........................................................................................................... 48
Lists of Figures
Figure 1 LCOE by power technology in Western Europe (2nd half of 2016) ...................................... 6
Figure 2 LCOE by power technology in the United States (2nd half of 2016) .................................... 6
Figure 3 The United States: Average output per turbine, rotor diameter, and hub height ....................... 7
Figure 4 Europe: Average output per turbine, rotor diameter, and hub height ........................................ 7
Figure 5 United States: Weighted-average capacity factor by commercial operation year (2015) ......... 8
Figure 6 Market price of wind turbines (US and global) ........................................................................ 9
Figure 7 Locational distribution among wind power plants in Japan .................................................... 12
Figure 8 Locational distribution among power plants in the sample data ............................................. 12
Figure 9 Breakdown of wind power plants by size ............................................................................... 13
Figure 10 Breakdown of wind power plant locations by geography ..................................................... 14
Figure 11 Changes of investment costs (median) by item ..................................................................... 16
Figure 12 Investment costs of power plants and their size .................................................................... 17
Figure 13 Distribution of contract types (power plant basis) ................................................................ 18
Figure 14 Costs for related items between different contract types ...................................................... 19
Figure 15 Investment costs for wind power: ......................................................................................... 20
Figure 16 Changes of turbine costs (median & average) ...................................................................... 21
Figure 17 Average hub height and rotor diameter in the sample data ................................................... 22
Figure 18 International comparisons of turbine costs and prices .......................................................... 23
Figure 19 Changes of turbine costs, steel prices, and exchange rates ................................................... 23
Figure 20 Relation between the size of power plants and turbine prices .............................................. 25
Figure 21 Changes of civil engineering costs (median & average) ....................................................... 26
Figure 22 Changes of electrical work and connection costs (median & average)................................. 26
Figure 23 Civil engineering costs by type of geographic feature .......................................................... 27
Figure 24 Changes in locational conditions by period .......................................................................... 28
Figure 25 Correlation between electrical work and connection costs and the distance from a grid
connection point ............................................................................................................................ 28
Figure 26 Average distance to a grid connection point ......................................................................... 29
Figure 27 Relationship between civil engineering costs and the size of plants (left)............................ 29
Figure 28 Relationship between electrical work costs and the size of plants (right) ............................ 29
Figure 29 Construction costs deflator ................................................................................................... 30
Figure 30 Changes of hourly wages among constructors (with 5 employees or more) (2010 = 100) 31
Figure 31 Price indexes of construction materials (plain steel & liquid concrete) for cities ................. 31
Figure 32 Changes of copper prices in Japan (annual average) ............................................................ 32
Figure 33 Relationship between construction periods and civil engineering costs: .............................. 33
Figure 34 Construction period for wind power plants equipped with a single turbine ......................... 34

Figure 35 O&M costs (median) ............................................................................................................. 35
Figure 36 Comparison between Germany and Japan in O&M costs .................................................... 36
Figure 37 Capacities installed on an annual basis (2005–2016) and ..................................................... 37
Figure 38 Size of power plants and regular maintenance & administration costs................................. 37
Figure 39 Share of O&M service providers .......................................................................................... 38
Figure 40 Regular maintenance & administration and repair costs ....................................................... 39
Figure 41 System availability factor ..................................................................................................... 40
Figure 42 Actual availability factors by type of O&M service providers ............................................. 41
Figure 43 Average capacity factor by region ......................................................................................... 42
Figure 44 Capacity factor (average & median) ..................................................................................... 42
List of Tables
Table 1 Breakdown of investment costs (before tax) .............................................................................. 3
Table 2 Breakdown of O&M costs (before tax) ...................................................................................... 3
Table 3 Changes in regulatory and institutional frameworks .................................................................. 4
Table 4 Overview of the data collected ................................................................................................. 10
Table 5 Comparison of cost data ........................................................................................................... 11
Table 6 Changes in investment costs (3-year interval) ....................................................................... 15
Table 7 possible factors for cost rise ..................................................................................................... 27
Table 8 Timetable for construction of a single turbine with a capacity of 1.5 MW (Ex.) ..................... 33
Table 9 Influences on wind power costs in recent years ....................................................................... 43

1
Summary
Wind power is to be one of the cornerstones to build upon a sustainable energy system in Japan. A
critical issue to achieve this goal is, however, the high cost of wind power in the country. Cost
reduction of wind power in Japan therefore needs to be urgently addressed. To this end, Renewable
Energy Institute has led a detailed analysis of the cost structure of wind power in Japan, based on
actual cost data provided by power producers, which key findings are summarized below:
(1) Investment costs
Turbine costs have decreased in recent years. After the revision of the Building Standards Act in 2007,
which notably introduced tighter earthquake-resistance regulations, developers in Japan had to pay
prices significantly higher than global prices when concluding a procurement contract for wind
turbines (around 2008). However, they recently began to benefit from falling global turbine costs. That
seems to reflect greater attractiveness of the Japanese market after introduction of a feed-in tariff (FiT)
scheme in July 2012.
Meanwhile, the construction work-related costs (e.g. civil engineering and electrical work costs), are
showing rapid increase due to factors that are not always possible to identify. In some parts of the
Tohoku region (Northeast Japan), local factors, such as the soaring labor costs and material prices for
civil engineering due to the reconstruction demand after the Great East Japan Earthquake, might be a
factor for the rising costs. However, that hardly explains why wind power projects alone are
experiencing rapid increases in construction work-related costs, while the nationwide construction cost
deflator rose by only a few percentage points. In this regard, some experts and business operators
stated that the lack of developers' expertise and financing capability might be among the factors for the
cost increase. In addition, construction lead time is observed to be getting longer, although the clear
causes for that have not been identified.
(2) Operation and maintenance costs
Regular maintenance & administration costs account for the largest part of the operation and
maintenance (O&M) costs. Facilities that came into operation after the introduction of the FiT saw
their regular maintenance & administration costs double from their prior level. In this respect, some
experts and maintenance service providers stated that with the support of the FiT, developers can now
spend more for operation management. Regular maintenance & administration costs have also turned
out to be negatively correlated with the annual installed capacity. Some experts stated that
maintenance is more difficult for turbine models installed in small numbers, which may have
something to do with the inverse relationship.
(3) Actual amount of electricity generated
Among the facilities that came into operation after the introduction of the FiT, capacity factors have
increased in average. Behind this improvement lie two possible factors. One is the locational factor;
since the introduction of the FiT, more facilities have been constructed in Northern Japan, a region
with better wind resources. Before the introduction of the FiT, wind power installed capacity was often
restricted by quotas set by conventional electricity utilities. With the FiT, developers are allowed to
file an application for grid connection anywhere without any quota allotted by electricity utilities. That
seems to have helped construct power plants in locations with better wind conditions. The second
factor is the industrial. Since the introduction of the FiT, capacity factors have also been rising at
facilities located in other areas than Northern Japan. That might be attributable to some sampling bias,
or it may reflect a higher efficiency achieved by the combination of better availability factors, as well
as higher hub height, and larger swept area.

2
Introduction
Wind power should be a cornerstone of a sustainable energy system in Japan. Taking into account
technical, economical and legal constraints, onshore wind power potential is estimated to be
significant; 280 gigawatts (GW).1 And across the world, the levelized cost of electricity (LCOE) of
onshore wind power is falling to the lowest among all power technologies demonstrating its strong
economic competitiveness.
In Japan, however, the cost of wind power generation is higher than observed globally (Chapter 1).
Furthermore, data from the Agency for Natural Resources and Energy (ANRE) of Japan show that
investment and operation & maintenance (O&M) costs have been rising since the introduction of a
feed-in tariff (FiT) scheme in July 2012. Improving the economic efficiency of wind power generation
is a significant challenge to be addressed now. Hence to support the massive and economically
sustainable deployment of wind power in Japan, studies on its future economic viability need to be
conducted.
To this end, this report analyzes actual cost data offered by wind power developers to clarify the
current cost structure of wind power in Japan and identify key factors affecting such cost structure. It
also aims to advance suggestions on how to reduce wind power costs in Japan.
To reach this goal, data provided by the member companies of Japan Wind Power Association (JWPA),
with the cooperation of JWPA itself, have been analyzed. The data collected cover wind power plants
with a total capacity of 1 MW or more that came into operation from 2005 onwards. The quantitative
analyses were supplemented by interviews with wind power equipment producers, technical
consulting firms, maintenance service providers, relevant experts and researchers, and financial
institutions to better interpret the data.
For comparison, this research has also examined wind power costs across the world. Information was
gathered through a range of relevant publications and extensive interviews of researchers, business
people, and companies related to wind power in Europe.
Structure of wind power costs
The LCOE for wind power is defined as normalized costs for 1 kWh of electricity produced by power
plants throughout their life cycle. The LCOE is determined generally by four elements:
(1) Investment costs. They include costs for constructing wind power plants, connecting them to the
grid, and disposing of them when decommissioned. This research examines costs for construction and
grid connection. Table 1 shows the breakdown of investment costs.
1 See the Ministry of the Environment (2016). It refers to potential capacities of areas where the wind blows at
an annual average velocity of 5.5 m/s at the height of 80 m which satisfy certain national and social conditions.
The social conditions include, among others, the area being located at an appropriate distance from residential
districts, and being out of regulated areas where no development is permitted.

3
Table 1 Breakdown of investment costs (before tax) Item Description
Turbine costs Costs for procuring wind turbines
Transportation & installation costs
Costs for transporting turbines and other components (by sea & land), storing them, and erecting and installing wind turbines
Civil engineering costs
Costs for preparing sites and laying foundations, modifying facilities at landing ports, and constructing and widening roads for transportation
Electrical work costs Work for wiring and piping on the premises, etc.
Grid connection cost Costs for installing power wires, breakers, and meters, construction work contributions paid to transmission and distribution system operators, etc.
Planning & development costs
Costs for work to be done before construction work starts, including wind resource quality survey and acquisition of land, but excluding costs for environmental impact assessment
Environmental impact assessment costs
Costs for environmental impact assessment
Others Costs not mentioned above Source: Renewable Energy Institute
(2) Operation and maintenance (O&M) costs. They include costs for operating power plants, which
include land rent, insurance premium, and repair costs, among others. O&M costs represent an annual
total of these costs. This report classifies the costs into the items listed below.
Table 2 Breakdown of O&M costs (before tax) Item Description
Regular maintenance & administration costs
Day-to-day costs for personnel working for O&M, measurement of data, and regular inspections, etc. This figure excludes insurance premium, tax, and land rent.
Insurance premium Annual average premiums for fire, lightning, and other property insurance, liability insurance, and profit insurance
Land rent Any money paid to rent land used for power plants, etc.
Repair costs Costs for repairing damaged facilities, equipment, etc.
Others Costs not mentioned above Source: Renewable Energy Institute
(3) The annual amount of electricity generated. Between two power facilities operating with the same
total cost, the LCOE is lower for one with more annual amount of generation. The annual amount of
generation at a power facility is determined by its installed capacity and capacity factor.
(4) The internal rate of return (IRR). Any capital, owned or borrowed, can be raised for a project only
when investors can expect a certain level of profit. Profitability of a project is represented by its IRR.
A project with higher risk would fail to raise capital when it is unlikely to achieve a higher IRR. In
other words, the IRR represents the cost for raising capital. An IRR required for ordinary wind power
projects depends on a variety of factors, such as current conditions of the financial market, and risks
the projects are exposed to. Generally, it is determined by the interest rate of borrowings from
financial institutions, and their shares in the total capital. This research refrains from dealing with the
IRR, as information obtained from business operators on interest rates of borrowings and their shares
was insufficient.
Classification of factors impacting the wind power costs
Various factors impact the LCOE of wind power, and can be roughly classified into international and
domestic factors. International factors include global trends of wind turbine technologies, the supply
and demand balance in the market, volatility of prices of materials for turbines, and currency exchange
rates, all of which affect prices of wind turbines produced overseas. Japanese turbine manufacturers
are also affected by material prices in the global market and exchange rates, as they cannot procure
and produce everything in the country.
4
Domestic factors are classified roughly into three categories—locational, institutional, and industrial.
Among the locational factors, the most significant are natural conditions, such as geography, geology,
and wind resource quality. The wind resource quality affects the strength design of turbines, as well as
the amount of electricity generated. The geography and geology may affect costs of civil engineering
work required.
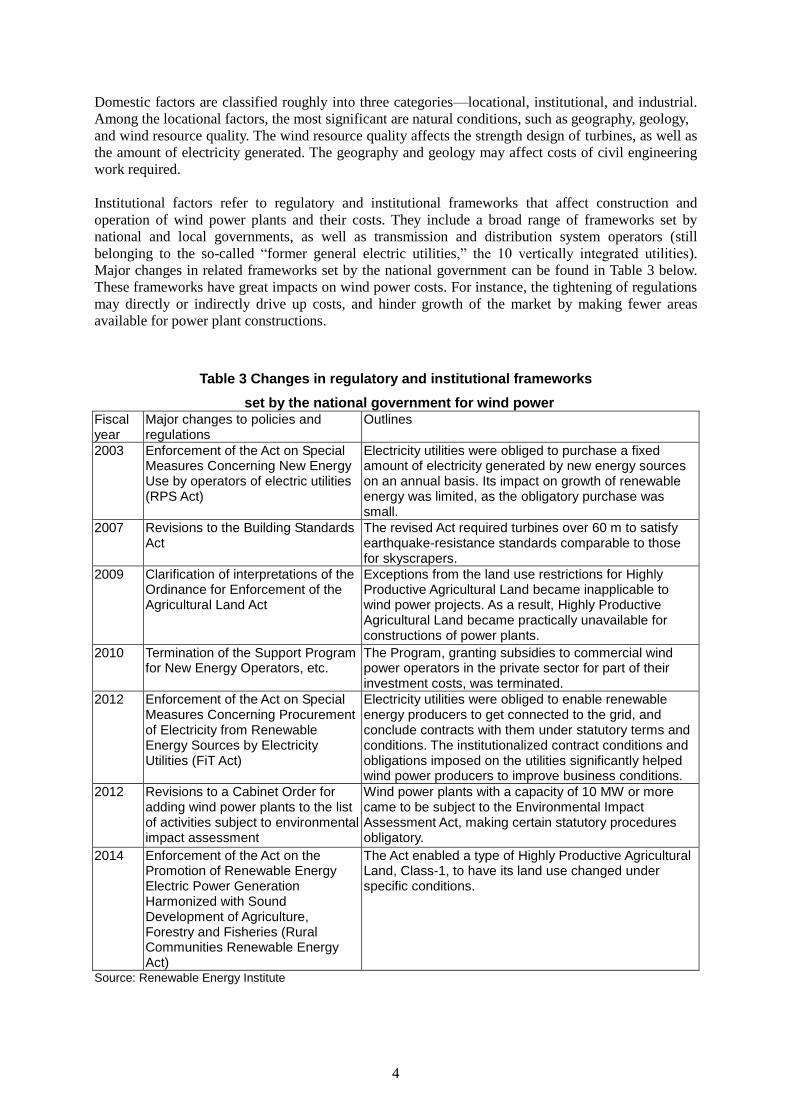
Institutional factors refer to regulatory and institutional frameworks that affect construction and
operation of wind power plants and their costs. They include a broad range of frameworks set by
national and local governments, as well as transmission and distribution system operators (still
belonging to the so-called “former general electric utilities,” the 10 vertically integrated utilities).
Major changes in related frameworks set by the national government can be found in Table 3 below.
These frameworks have great impacts on wind power costs. For instance, the tightening of regulations
may directly or indirectly drive up costs, and hinder growth of the market by making fewer areas
available for power plant constructions.
Table 3 Changes in regulatory and institutional frameworks
set by the national government for wind power Fiscal year
Major changes to policies and regulations
Outlines
2003 Enforcement of the Act on Special Measures Concerning New Energy Use by operators of electric utilities (RPS Act)
Electricity utilities were obliged to purchase a fixed amount of electricity generated by new energy sources on an annual basis. Its impact on growth of renewable energy was limited, as the obligatory purchase was small.
2007 Revisions to the Building Standards Act
The revised Act required turbines over 60 m to satisfy earthquake-resistance standards comparable to those for skyscrapers.
2009 Clarification of interpretations of the Ordinance for Enforcement of the Agricultural Land Act
Exceptions from the land use restrictions for Highly Productive Agricultural Land became inapplicable to wind power projects. As a result, Highly Productive Agricultural Land became practically unavailable for constructions of power plants.
2010 Termination of the Support Program for New Energy Operators, etc.
The Program, granting subsidies to commercial wind power operators in the private sector for part of their investment costs, was terminated.
2012 Enforcement of the Act on Special Measures Concerning Procurement of Electricity from Renewable Energy Sources by Electricity Utilities (FiT Act)
Electricity utilities were obliged to enable renewable energy producers to get connected to the grid, and conclude contracts with them under statutory terms and conditions. The institutionalized contract conditions and obligations imposed on the utilities significantly helped wind power producers to improve business conditions.
2012 Revisions to a Cabinet Order for adding wind power plants to the list of activities subject to environmental impact assessment
Wind power plants with a capacity of 10 MW or more came to be subject to the Environmental Impact Assessment Act, making certain statutory procedures obligatory.
2014 Enforcement of the Act on the Promotion of Renewable Energy Electric Power Generation Harmonized with Sound Development of Agriculture, Forestry and Fisheries (Rural Communities Renewable Energy Act)
The Act enabled a type of Highly Productive Agricultural Land, Class-1, to have its land use changed under specific conditions.
Source: Renewable Energy Institute

5
Finally, industrial factors are those derived from conditions of wind power business and technologies
and related sectors. For example, larger-scale power plants can produce electricity at a lower cost per
kW. Costs may also depend on the size of developers, rather than the size of individual power plants.
Larger developers have richer business experience and greater procurement capabilities that may allow
them to reduce costs for development. In addition, labor costs and prices of related materials procured
in Japan would also affect the wind power costs. As the market grows larger, the economies of scale,
for instance, may be more significant, with related materials and services supplied at lower prices.
Some of these factors can be regarded as independent while others may be correlated. For instance, the
international factors and the domestic locational factors can be considered independent. On the other
hand, the size of markets, which is one of the domestic industrial factors, is largely affected by
domestic locational and institutional factors. Representing and analyzing all these factors in a
consistent and uniform manner is quite a difficult challenge.
6
1. Wind power costs across the world
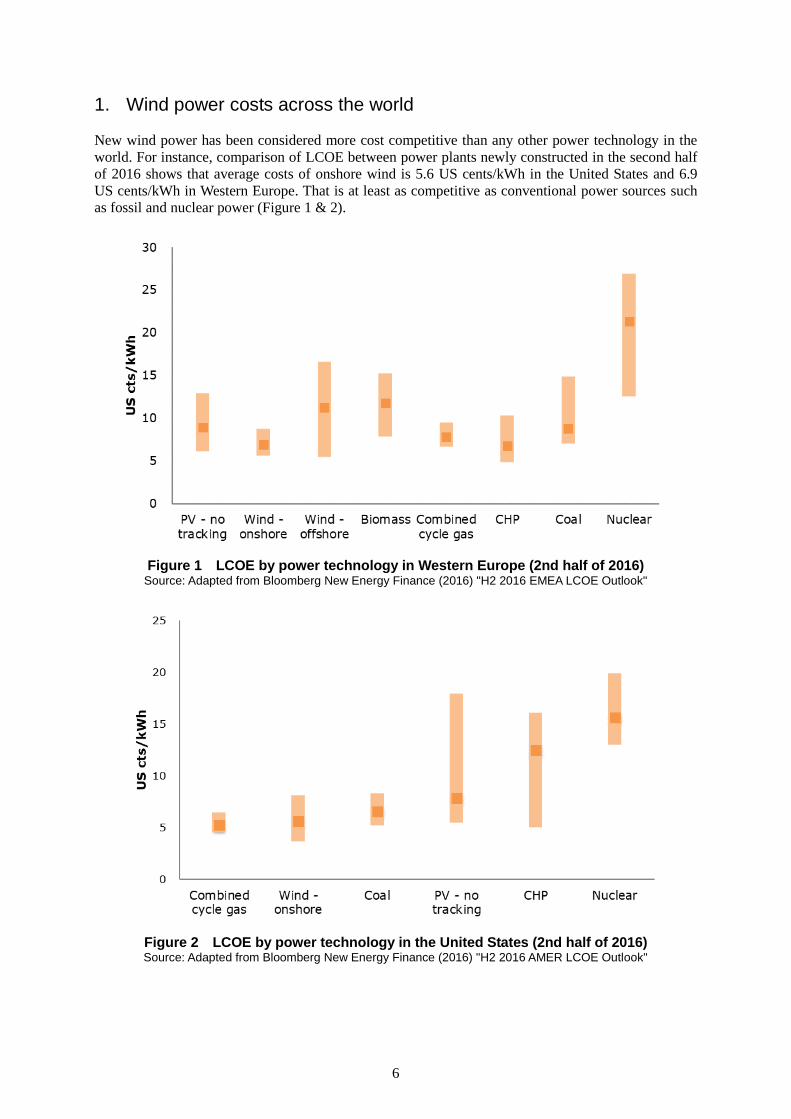
New wind power has been considered more cost competitive than any other power technology in the
world. For instance, comparison of LCOE between power plants newly constructed in the second half
of 2016 shows that average costs of onshore wind is 5.6 US cents/kWh in the United States and 6.9
US cents/kWh in Western Europe. That is at least as competitive as conventional power sources such
as fossil and nuclear power (Figure 1 & 2).
Figure 1 LCOE by power technology in Western Europe (2nd half of 2016)
Source: Adapted from Bloomberg New Energy Finance (2016) "H2 2016 EMEA LCOE Outlook"
Figure 2 LCOE by power technology in the United States (2nd half of 2016) Source: Adapted from Bloomberg New Energy Finance (2016) "H2 2016 AMER LCOE Outlook"

7
Cost competitiveness of wind power has improved globally thanks to several factors:
The adoption of advanced wind power technologies have helped achieve a greater performance ratio
(IEA Wind Task 26, 2015; IRENA, 2015; Wiser and Bolinger, 2016). The recent trend in the United
States is that individual turbines are equipped with longer blades and larger rotor diameter, with little
change in the hub height, and more output (Figure 3). A larger rotor diameter offers a turbine a larger
swept area. That enables a single turbine to catch more wind, even at a lower speed and generate more
electricity. Advanced technologies have allowed rotors to have a larger diameter while controlling
increases in their weight.
In Europe, in addition to enlarging rotor diameters, towers have been improved to hold hubs higher
(Figure 4). Wind turbines with a higher hub height can catch stronger winds. These technological
improvements enable wind farms at lower wind speed sites to generate comparable amount of
electricity as sites of stronger wind.
(a) Rotor diameter (b) Output per turbine (c) Hub height
Figure 3 The United States: Average output per turbine, rotor diameter, and hub height
by commercial operation year Source: Gonzalez and Arantegui (2016)
(a) Rotor diameter (b) Output per turbine (c) Hub height
Figure 4 Europe: Average output per turbine, rotor diameter, and hub height Source: Gonzalez and Arantegui (2016)
These advanced technologies also allow wind power plants with poorer wind resource quality to
operate at higher capacity factors. Figure 5 shows the capacity factor in the United States and impacts
of several directly related factors—wind resource quality, hub height, and specific power (rated output
per swept area).2 The capacity factors have greatly improved among wind farms built in 2012 and
after. The wind resource quality (green line) hit the bottom in 2011 and 2012, then picked up
moderately, but without significant improvement. The resource quality at locations for farms built in
2013 and 2014 is almost the same as that for those built in 2010, and 2007 and 2008, respectively. The
hub height (purple line) has virtually been leveling off. It is the specific power (red line) that has
achieved a great improvement since 2012. The growth of the specific power index implies that the size
2 The specific power of a wind turbine represents its rated power divided by its swept area. The swept area is
calculated using its rotor diameter.

8
of the swept area grew faster than the output, consequently contributing to the improvement in
capacity factor since 2012.
Figure 5 United States: Weighted-average capacity factor by commercial operation year (2015)
Source: Wiser and Bolinger (2016) Note: The light-blue line indicates weighted-average capacity factors in 2015. The green line shows indices of the wind resource quality at 80 meters for turbines built in each year. The purple and red lines represent indices of the hub height and the inverse of specific power, respectively. A turbine with the same rated output and a larger swept area achieves a lower specific power. As the value gets lower, the capacity factor goes higher.
Another notable factor is that wind turbine prices have significantly declined. Since 2008, the market
price per kW has been constantly falling (Figure 6). Until that year, between 2002 and 2008, the
turbine price had been rapidly increasing. Bolinger and Wiser (2011) attributed the increases to seven
factors, and analyzed them in detail to identify the influences of each.
Their analysis revealed that the greatest contribution had come from the enlargement of turbines in
size, such as higher hub height and larger rotor diameter. However, the consequent price increases do
not necessarily serve disadvantageously because, as mentioned before, a larger turbine is capable of
producing more electricity.
The second largest contributor is the currency exchange rate. During the period, despite its growing
share of domestically manufactured products, the United States imported some 60% of wind turbines
and components. Their prices are influenced by exchange rates with currencies of major exporters.
The analysis of Bolinger and Wiser showed import prices had been influenced mainly by the euro,
Danish krone, and Japanese yen. During this period, the US dollar fell significantly against these
foreign currencies, which resulted in increases in wind turbine prices on a US dollar basis.
The third contributor lied in the increased labor cost. In general, a greater deployment of wind power
leads to higher efficiency and/or a larger economies of scale, driving down the labor cost per kW.
However, an important rapid increase of demand may push up labor cost. Also, the turbine
manufacturers required higher profit margins in the sellers’ market since 2005.
Their analysis also presented price rises of materials, such as steel, as another factor leading to cost
increases.
Turbine prices have been driven up by these factors until 2008. They have been decreasing since then,
notably because of growing competition between manufacturers resulting in cost reduction (Wiser and
Bolinger, 2016, p. 52). Bloomberg New Energy Finance (BNEF) (2017) reports that in the second half
of 2016, turbines were sold at around 1,120 USD per kW, 40% cheaper than in the first half of 2009.
9
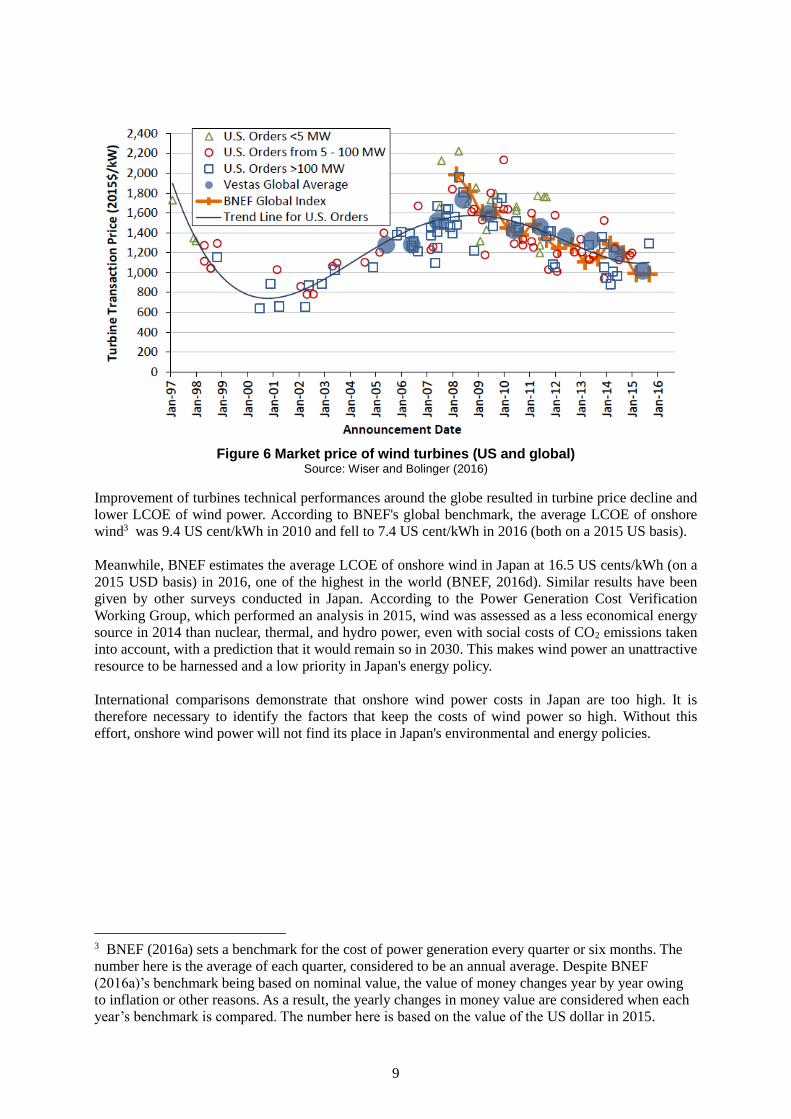
Figure 6 Market price of wind turbines (US and global) Source: Wiser and Bolinger (2016)
Improvement of turbines technical performances around the globe resulted in turbine price decline and
lower LCOE of wind power. According to BNEF's global benchmark, the average LCOE of onshore
wind3 was 9.4 US cent/kWh in 2010 and fell to 7.4 US cent/kWh in 2016 (both on a 2015 US basis).
Meanwhile, BNEF estimates the average LCOE of onshore wind in Japan at 16.5 US cents/kWh (on a
2015 USD basis) in 2016, one of the highest in the world (BNEF, 2016d). Similar results have been
given by other surveys conducted in Japan. According to the Power Generation Cost Verification
Working Group, which performed an analysis in 2015, wind was assessed as a less economical energy
source in 2014 than nuclear, thermal, and hydro power, even with social costs of CO2 emissions taken
into account, with a prediction that it would remain so in 2030. This makes wind power an unattractive
resource to be harnessed and a low priority in Japan's energy policy.
International comparisons demonstrate that onshore wind power costs in Japan are too high. It is
therefore necessary to identify the factors that keep the costs of wind power so high. Without this
effort, onshore wind power will not find its place in Japan's environmental and energy policies.
3 BNEF (2016a) sets a benchmark for the cost of power generation every quarter or six months. The
number here is the average of each quarter, considered to be an annual average. Despite BNEF
(2016a)’s benchmark being based on nominal value, the value of money changes year by year owing
to inflation or other reasons. As a result, the yearly changes in money value are considered when each
year’s benchmark is compared. The number here is based on the value of the US dollar in 2015.

10
2. Relevance of data collected
Data collected
For this research, with the support of JWPA, the author distributed questionnaires among wind power
developers during the autumn of 2016 to collect cost data. In March 2017, we had obtained
information on 38 wind power plants that started commercial operation after 2005 (Table 4). These
included 215 wind turbines, for a total installed capacity of 370 MW. According to the New Energy
and Industrial Technology Development Organization (NEDO) of Japan’s data (2016), 211 wind
power plants (1 MW or more) have started operation in Japan since 2005 (1,290 turbines, with a total
combined installed capacity of 2,290 MW). In the population of the country’s wind farms that started
operation after 2005, the response rate would be 18%.
Among the data of the sample, the average output per turbine stands at 1.8 MW, approximately the
same as that in the population. In terms of size, the average output per turbine in the population was 11
MW, slightly larger than the average among the data of the sample; 10 MW among the data of the
sample. Especially, the turbines that started commercial operation in 2008‐2010 or 2014‐2016 are
smaller in size than the average in the population. For the analyses performed below, it must be noted
that the data collected for 2008‐2010 and 2014‐2016 come from power plants that are smaller than
the average power plants of the population.
Table 4 Overview of the data collected
Commercial operation year (Calendar year)
2005–07 2008–10 2011–13 2014–16 Total
No. of power plants 15
(87) 9
(49) 8
(36) 6
(39) 38
(211)
Total installed capacity (MW)
151 (741)
117 (755)
73 (354)
30 (441)
370 (2,290)
No. of turbines 108
(470) 57
(402) 35
(171) 15
(208) 215
(1,290)
Average turbine output (MW)
1.4 (1.5)
2.0 (1.9)
2.1 (2.0)
2.0 (2.1)
1.7 (1.8)
Average plant size (MW)
10 (9)
13 (16)
9 (10)
5 (11)
10 (11)
Source: Adapted from Renewable Energy Institute and NEDO (2016) Note: Figures between brackets represent totals in Japan. The table excludes data of power plants that have not come into operation.
Relevance of cost data
Any large deviation between cost data collected for this research and those released by the ANRE
(regarded virtually as data of the population) suggests that the former might be biased. To verify the
relevance of the cost data of the sample, they were compared with the cost data released by the ANRE
on power plants that fall under similar categories. For investment costs, the comparison gave no
significant deviation in the average and median. For O&M costs, however, the data released by ANRE
includes those on the facilities that came into operation before 2005, while data collected for this
research only cover the plants coming into operation in 2005 or later. This coverage difference leaves
it difficult to check the relevance of cost data collected.
11
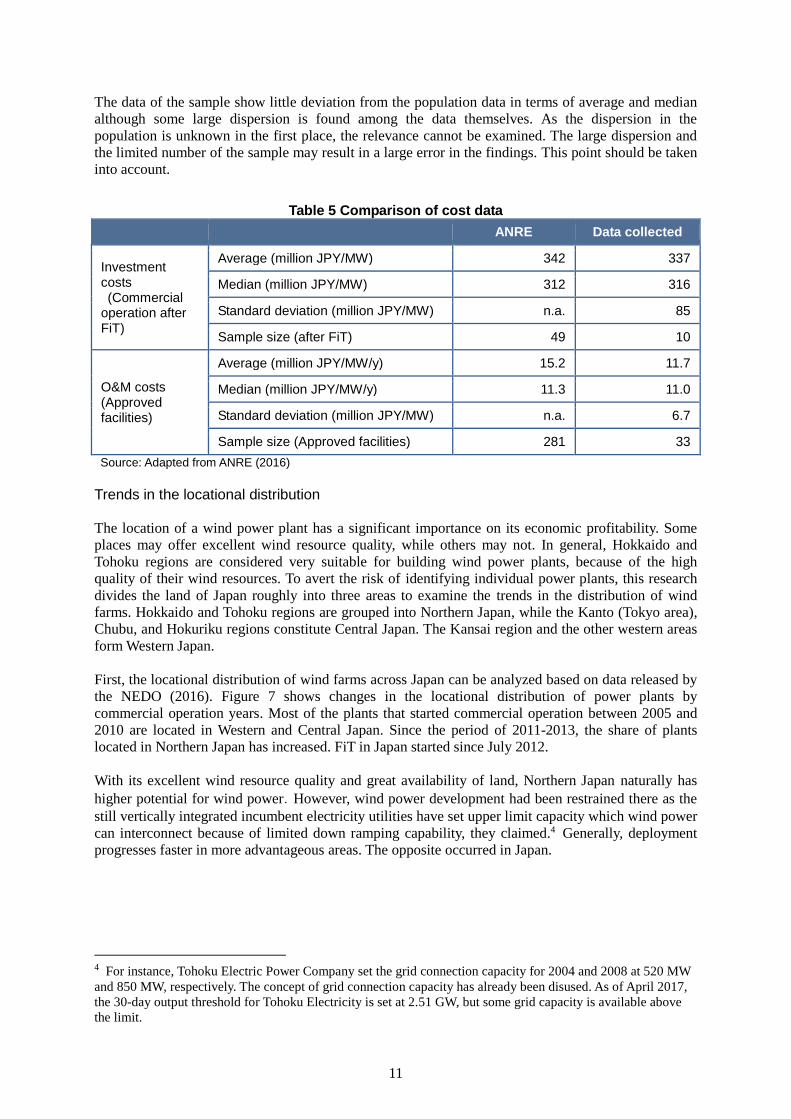
The data of the sample show little deviation from the population data in terms of average and median
although some large dispersion is found among the data themselves. As the dispersion in the
population is unknown in the first place, the relevance cannot be examined. The large dispersion and
the limited number of the sample may result in a large error in the findings. This point should be taken
into account.
Table 5 Comparison of cost data
ANRE Data collected
Investment costs (Commercial operation after FiT)
Average (million JPY/MW) 342 337
Median (million JPY/MW) 312 316
Standard deviation (million JPY/MW) n.a. 85
Sample size (after FiT) 49 10
O&M costs (Approved facilities)
Average (million JPY/MW/y) 15.2 11.7
Median (million JPY/MW/y) 11.3 11.0
Standard deviation (million JPY/MW) n.a. 6.7
Sample size (Approved facilities) 281 33
Source: Adapted from ANRE (2016)
Trends in the locational distribution
The location of a wind power plant has a significant importance on its economic profitability. Some
places may offer excellent wind resource quality, while others may not. In general, Hokkaido and
Tohoku regions are considered very suitable for building wind power plants, because of the high
quality of their wind resources. To avert the risk of identifying individual power plants, this research
divides the land of Japan roughly into three areas to examine the trends in the distribution of wind
farms. Hokkaido and Tohoku regions are grouped into Northern Japan, while the Kanto (Tokyo area),
Chubu, and Hokuriku regions constitute Central Japan. The Kansai region and the other western areas
form Western Japan.
First, the locational distribution of wind farms across Japan can be analyzed based on data released by
the NEDO (2016). Figure 7 shows changes in the locational distribution of power plants by
commercial operation years. Most of the plants that started commercial operation between 2005 and
2010 are located in Western and Central Japan. Since the period of 2011-2013, the share of plants
located in Northern Japan has increased. FiT in Japan started since July 2012.
With its excellent wind resource quality and great availability of land, Northern Japan naturally has
higher potential for wind power.However, wind power development had been restrained there as the
still vertically integrated incumbent electricity utilities have set upper limit capacity which wind power
can interconnect because of limited down ramping capability, they claimed.4 Generally, deployment
progresses faster in more advantageous areas. The opposite occurred in Japan.
4 For instance, Tohoku Electric Power Company set the grid connection capacity for 2004 and 2008 at 520 MW
and 850 MW, respectively. The concept of grid connection capacity has already been disused. As of April 2017,
the 30-day output threshold for Tohoku Electricity is set at 2.51 GW, but some grid capacity is available above
the limit.

12
Figure 7 Locational distribution among wind power plants in Japan Source: Adapted from NEDO (2016)
Note: For each period, the percentage of a region is calculated by setting its denominator as the number of power plants coming into operation all around Japan at the time with a capacity of 1 MW to produce electricity for sale, and it numerator as the number of those which started operating in the relevant region.
Then, the trends of the locational distribution in the collected sample data is shown below (Figure 8).
Any large deviation between the trends observed here and the trend of the entire population would
indicate that the sample is biased. Upon comparing Figures 7 and 8, large deviations are not observed
in the locational distributions in any period, although the data on power plants located in Central Japan
are unavailable for the period between 2011 and 2013.
Figure 8 Locational distribution among power plants in the sample data
Note: For each period, the percentage of a region is calculated by setting its denominator as the number of power plants coming into operation all around Japan at the time with a capacity of 1 MW to produce electricity for sale, and its numerator as the number of those which started operating in the relevant region.
Commercial operation year

13
Trends in the size of wind power plants
Different sizes of wind power plants may result in different profitability. Figure 9 shows the
distribution of power plants coming into operation from 2005 onwards in Japan with a capacity of 1
MW by size. Slightly more than half (52%) of the plants are equipped with four turbines or fewer. The
second largest group, those with five to eight turbines, accounts for 22%. The rest is a group of larger
plants, with nine turbines or more. The collected sample data indicate similar tendencies, and no
significant difference is observed.
(a) Breakdowns of the population (n = 211)
Source: Adapted from NEDO (2016) (b) Breakdowns of the sample data (n = 39)
Source: Renewable Energy Institute
Figure 9 Breakdown of wind power plants by size
Geographic trends of locations
Upon constructing a wind power plant, its geography is one of the critical determinants. Japan has
60% of its land covered by mountains.5 As stated in a study, a wind power plant constructed in a
mountainous area may have to bear higher costs for transporting and installing wind turbines and
building roads (Mizuno, 2013, p. 17). That means that geographical conditions of wind power plant
locations may constitute an important factor for cost analysis. However, there are no available
statistical data on the geography of wind power plant locations in Japan at the country level.6 This
analysis therefore used data offered by the power producers in the sample (Figure 10).
Analysis of the data reveals that 36% of the power plants are located in lowlands while 31% are found
in mountains. Those constructed in hills account for 23%. That is, 54% of the plants have been
constructed across the mountains and hills combined, or complicated terrains.
Comparison between the regions reveals significant differences. In Northern Japan, 90% of the wind
power plants are located in lowlands. Central Japan sees 60% of the plants located in lowlands or
tablelands. In contrast, more than 90% of the power plants are located in mountains and hills in
Western Japan. These differences between the regions may reflect differences in their land use and
wind resource quality.
5 Calculated based on the Statistics Bureau of the Ministry of Internal Affairs and Communications, "Area by
Configuration, Gradient and Prefecture." 6 Strictly speaking, the "Location Information on Wind Power Generators," published by the East Japan Civil
Aviation Bureau of the Ministry of Land, Infrastructure, Transport and Tourism, contains heights of wind
turbines at their top, which include blades, from the ground and sea level. The difference between them at a
location indicates its elevation. However, the geographical categories of lowland and mountain are not defined
solely by elevation. Any correlation between the geography of locations and their elevation would be hard to
find.

14
(a) National (n = 39) (b) Regional
Figure 10 Breakdown of wind power plant locations by geography Source: Renewable Energy Institute

15
3. Analysis of investment costs
Changes in investment costs over time
Investment costs, aggregated from the sample data, are shown in Table 6. Between 2005 and 2007,
investment costs amounted to 210 million JPY/MW (median), roughly the same as, or a little lower
than, the same level among the wind power plants around the world.7 In Japan, however, investment
costs, both the median and average, have since then increased. It is believed that, as typically seen in
solar PV, greater deployment enables advancement of technologies and expertise, which in turn pushes
down costs. Japan has seen the opposite phenomenon in wind power.
Table 6 Changes in investment costs (3-year interval)
Commercial operation year 2005-07 2008-10 2011-13 2014-16
Median (million JPY/MW) 210 295 305 355
Average (million JPY/MW) 213 295 299 371
Standard deviation (million JPY/MW) 26 68 37 94
Sample size 14 8 6 6 Source: Renewable Energy Institute Note: To compensate for the limited sample size, the period of 12 years is divided into 4 groups of 3 years for analysis.
The first significant change occurred between 2008 and 2010, when investment costs increased
sharply by 50% from approximately 200 million JPY/MW to almost 300 million JPY/MW. Little
change had been seen until 2013. The second change in investment costs occurred between 2014 and
2016; the median increased by 50 million JPY/MW to 355 million JPY/MW. The data between 2014
and 2016 show a large divergence between the average and median, with a large standard deviation,
indicating that they widely varied.
As shown before in Table 1, investment costs are composed of several items. Changes in investment
costs by item can explain how much impact was caused by which item at what time (Figure 11).
Between 2008 and 2010, investment costs increased by 50%, and the greatest contributor was an
increase of wind turbine costs8 (up 60 million JPY/MW in the median). Civil engineering and
planning & development costs also rose (up 6 million JPY/MW and 4 million JPY/MW, respectively).
Between 2014 and 2016, investment costs rose with sharp increases in various items, including civil
engineering, electrical work, planning & development, and other costs. Other costs include those paid
to engineering, procurement and construction (EPC) contractors,9 and those paid by plant operators
for, among others, construction-site management and related business, work-related accident
compensation, erection insurance, and financing.
7 According to IEA Wind (2006) and IEA Wind (2008), investment costs for wind power generation in Europe
between 2006 and 2007 amounted to 1,000 to 2,000 EUR/kW, or 150,000 to 300,000 JPY (1 euro = 150 JPY). 8 Here, "turbine costs" refers to costs for wind turbines that developers procure from manufacturers. Note that
they are different from manufacturing costs for turbines. 9 Business entities working under contract through the entire process of designing of, procurement for, and
construction of plants.

16
Figure 11 Changes of investment costs (median) by item
Source: Renewable Energy Institute
Relationship between the size of power plants and investment costs
The size of power plants is one of the industrial factors that may influence investment costs.
Investment costs increased from the 2008-2010 period to the 2014-2016 period. However, any direct
comparison must be done with caution, since, the average size of power plants changed between the
two periods, as mentioned before. In this context, this section examines the relationship between
investment costs and the size of power plants. Here, an analysis is performed for power plants that
came into operation between 2008 and 2016 (Figure 12). Plants that started operating before 2008 are
excluded because investment costs were extremely low in those years, a cause of bias that should be
avoided.
It is found that for the relationship between investment costs and the size of plants, the logarithmic
approximation model fits better than the linear approximation method, giving a coefficient of
correlation (R) of 0.495, a medium level of correlation (N = 20, p-value = 0.026). This means, for
instance, when the capacity of a plant increases from 5 MW to 10 MW, investment costs decrease fast
while, from 10 MW to 15 MW, costs fall less sharply.
In practice, physical costs, such as material and labor costs, can only be reduced to a certain limit.
Therefore, investment costs are unlikely to decline in a linear manner as the size of power plants
grows. It would be rather natural to think that, among plants larger than a certain level, costs would
decrease more slowly than the pace of their growth in size.
The analysis above would indicate that the average size of power plants coming into operation in the
2014-2016 period was about 5 MW, much smaller than the average size of 13 MW for those coming
into operation in the 2008-2010 period, and therefore the investment costs were higher in the former
period.

17
Figure 12 Investment costs of power plants and their size
(Commercial operation years between 2008 and 2016) Source: Renewable Energy Institute
Influence of different contract types on costs
Level of expertise of the developers is one of the industrial factors that impacts costs of plants. One
indicator of the level of expertise could be the number of wind power projects they have engaged in,
suggesting experience level. However, any reasonable comparison is impossible for this research,
because among those who offered data, there was no major developer who had been involved in 10
power plant projects or more. As an alternative, this section examines possible influences of different
contract types adopted for projects on their costs.
Construction of a wind power plant includes a great variety of processes, including designing,
procurement of turbines and other equipment, construction of roads, building of substations,
transportation, site preparation, erection, and grid connection. Each of these processes can be
contracted out to service providers. The abilities of the developers are reflected on their decisions
about which processes to be outsourced and which to be done in-house.
Contracts for the processes related to the development of a wind farm can be classified into three
major types:
(1) EPC blanket contract (EPC): A contract with a single EPC contractor covering from
designing and procurement all through construction.
(2) Balance of plant (BOP): Developers procure wind turbines only, and outsource construction
and other processes to a general contractor.
(3) Separate engagement: Developers perform designing and procurement, and outsource each
of the other processes, including construction, to different contractors, or perform some of
them in-house.
According to some developers based in Europe "An advantage of the EPC type is that it allows us to
concentrate on risk management. But with this approach, we have difficulty reviewing individual
processes to see whether costs are reasonable. On the other hand, the separate engagement type helps
us scrutinize a project in detail, leading possible contractors to compete between them at negotiations
on pricing, and reduce costs." However, the separate engagement type can be adopted only by
developers who themselves know enough about the processes to manage and supervise each of them
appropriately, which requires considerable experience, knowledge, and expertise. For this reason,

18
others stated, "For less experienced developers, the EPC type would be more favorable."
These comments suggest that developers adopting the separate engagement approach are likely to
have acquired a certain level of experience and/or expertise.
Below in this section, investment costs are compared between different contract types, with the focus
placed specifically on some items that seem more sensitive to differences in contracting. First, Figure
13 shows the distribution of power plants between the three different contract types. EPC type
contracts were concluded for 72% of them. Especially, 86% of the plants coming into operation
between 2005 and 2010 adopted this approach. Meanwhile, with increases of the other two types of
contracts between 2011 and 2016, the share of EPC fell to 50%, indicating a growing diversification
between the contract types since 2011.
0%
10%
20%
30%
40%
50%
60%
70%
80%
90%
100%
Total 2005~10 2011~16
Separate engagement
BOP
EPC
Figure 13 Distribution of contract types (power plant basis) Source: Renewable Energy Institute
Next, for projects that came into operation in and after 2011, the year when a greater dispersion
between the contract types became noticeable, the EPC and separate engagement types of contracts are
compared in costs for planning & development, turbine procurement, and construction work. (The
BOP type of contracts is omitted as the sample size is too small.) It is observable that turbine costs are
lower in the separate engagement type than in the EPC approach, by an average of 31 million
JPY/MW and a median of 46 million JPY/MW. Little difference is found in costs for construction,
such as civil engineering and electrical work, between the two types. In contrast, planning &
development costs are higher in the separate engagement type, by an average of 15 million JPY/MW
and a median of 16 million JPY/kW.
19
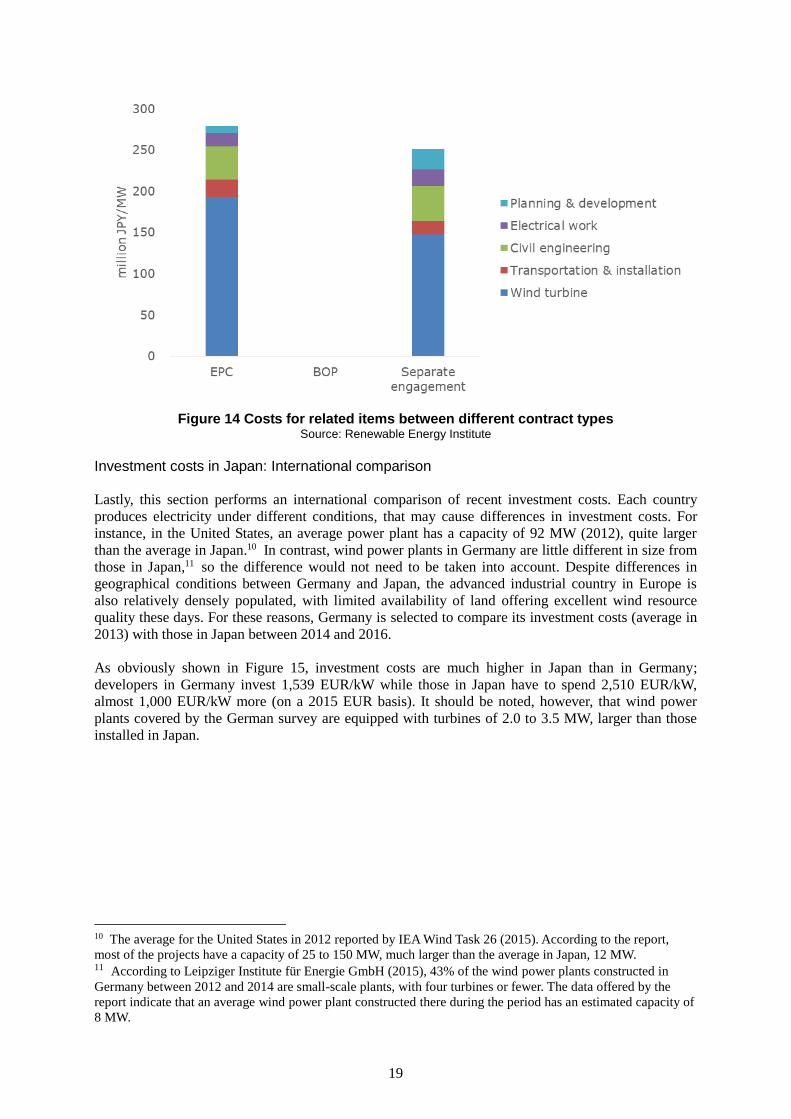
Figure 14 Costs for related items between different contract types Source: Renewable Energy Institute
Investment costs in Japan: International comparison
Lastly, this section performs an international comparison of recent investment costs. Each country
produces electricity under different conditions, that may cause differences in investment costs. For
instance, in the United States, an average power plant has a capacity of 92 MW (2012), quite larger
than the average in Japan.10 In contrast, wind power plants in Germany are little different in size from
those in Japan,11 so the difference would not need to be taken into account. Despite differences in
geographical conditions between Germany and Japan, the advanced industrial country in Europe is
also relatively densely populated, with limited availability of land offering excellent wind resource
quality these days. For these reasons, Germany is selected to compare its investment costs (average in
2013) with those in Japan between 2014 and 2016.
As obviously shown in Figure 15, investment costs are much higher in Japan than in Germany;
developers in Germany invest 1,539 EUR/kW while those in Japan have to spend 2,510 EUR/kW,
almost 1,000 EUR/kW more (on a 2015 EUR basis). It should be noted, however, that wind power
plants covered by the German survey are equipped with turbines of 2.0 to 3.5 MW, larger than those
installed in Japan.
10 The average for the United States in 2012 reported by IEA Wind Task 26 (2015). According to the report,
most of the projects have a capacity of 25 to 150 MW, much larger than the average in Japan, 12 MW. 11 According to Leipziger Institute für Energie GmbH (2015), 43% of the wind power plants constructed in
Germany between 2012 and 2014 are small-scale plants, with four turbines or fewer. The data offered by the
report indicate that an average wind power plant constructed there during the period has an estimated capacity of
8 MW.

20
Figure 15 Investment costs for wind power:
Comparison between Japan and Germany (in EUR, 2015-basis) Source: For Germany, Leipziger Institute für Energie GmbH (2014). Wind power plants covered by the German survey are equipped with turbines of 2.0 to 3.5 MW, larger than those installed in power plants in Japan.
Figure 15 shows the breakdown of investment costs. In Japan, costs for wind turbine/transportation &
installation are higher, but only marginally. In contrast, in three items, civil engineering, electrical
work, and other costs, there are significant differences between the two countries. These cost items are
expenses in the domestic market.
That suggests the possibility that the differences in investment costs between Japan and other countries
might be strongly influenced by domestic factors (locational, institutional, and industrial factors).
Among the domestic factors, the size of power plants is not so much different between Japan and
Germany, as the average for the latter stands at around 8 MW (2012 to 2014). The focus of the
analysis should therefore be placed on other domestic factors.
The following two chapters study recent changes in turbine, civil engineering, and electrical work
costs, items that account for larger shares in investment costs, and analyze relationships with some
factors that seem to impact costs.

21
4. Analysis of wind turbine costs
As seen in Figure 11, wind turbines costs constitute a major part of investments for wind power plants.
In analyzing wind power costs, analysis of turbine costs is crucially important. Turbine costs are likely
to be impacted by several institutional and industrial elements among the international and domestic
factors. This chapter first presents changes of turbine costs over time and characteristics of turbines
adopted in Japan, before examining the factors that influence turbine costs.
Changes in turbine costs over time
Turbine costs account for the largest part of the investment costs for wind power. Except for the period
between 2014 and 2016, turbine costs are responsible for around 60% of investment costs.
Consequently, changes of turbine costs have significant impact on investments for wind power.
Figure 16 Changes of turbine costs (median & average)
by commercial operation year Source: Renewable Energy Institute
Figure 16 shows the wind turbine costs for wind power plants at the time they came into operation.
Over the past ten years, two major changes can been observed. First, between 2008 and 2010, turbine
costs exhibited a rapid increase. Turbines kept increasing between 2011 and 2013. The second change
is a decline of turbine costs between 2014 and 2016, which amounted to some 40 million JPY/MW in
the median. Taking into consideration that wind power plants in the sample of data collected for the
period are smaller in size, larger power plants and major power producers might wield their bargaining
power and procure turbines at lower prices. A wind power expert the authors interviewed commented,
"In recent years, major power companies can procure turbines at 120 million JPY/MW or less."
Characteristics of turbines adopted in Japan
As stated before, higher hub heights and larger rotor diameters are being introduced around the world
to enable individual turbines to produce more electricity. However, the sample of data collected
reveals that in recent years Japanese power plants do not always select the latest models of turbines
adopted overseas.
The hub height, 66 meters on average between 2005 and 2007, has risen to 78 meters between 2014
and 2016 (Figure 17). However, it is still lower than the average hub height in Germany; 120 meters
(Figure 4 ).
22
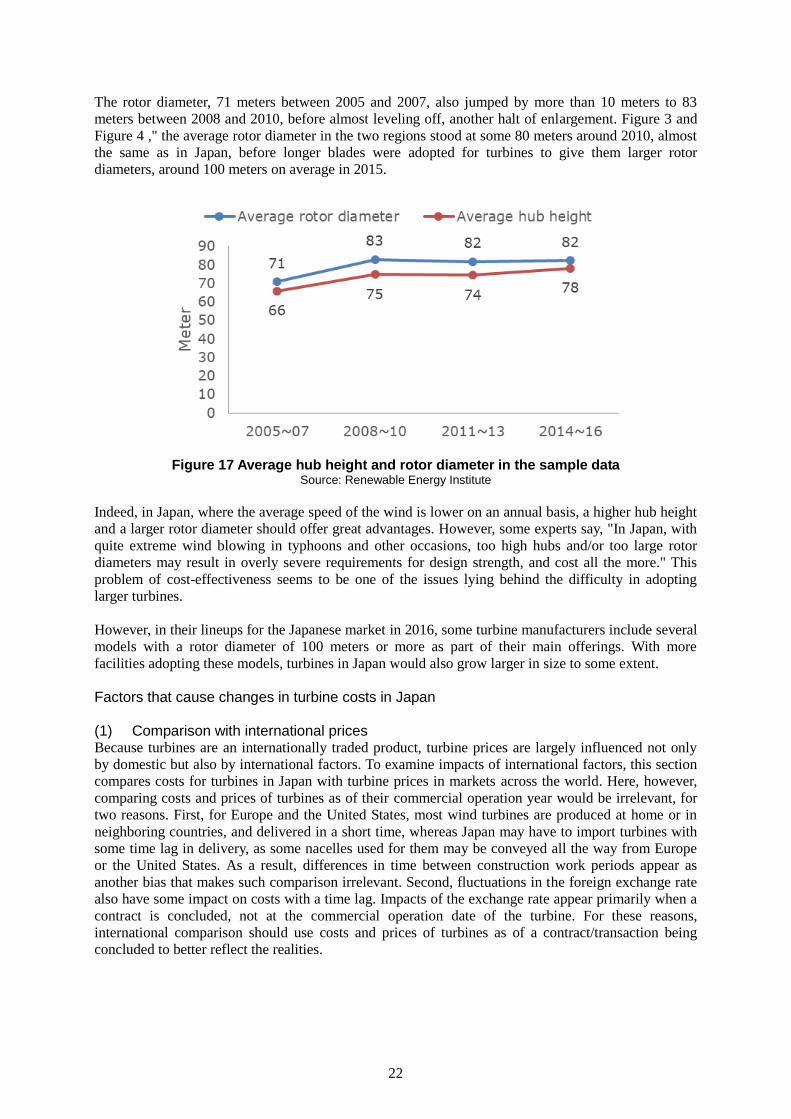
The rotor diameter, 71 meters between 2005 and 2007, also jumped by more than 10 meters to 83
meters between 2008 and 2010, before almost leveling off, another halt of enlargement. Figure 3 and
Figure 4 ," the average rotor diameter in the two regions stood at some 80 meters around 2010, almost
the same as in Japan, before longer blades were adopted for turbines to give them larger rotor
diameters, around 100 meters on average in 2015.
Figure 17 Average hub height and rotor diameter in the sample data
Source: Renewable Energy Institute
Indeed, in Japan, where the average speed of the wind is lower on an annual basis, a higher hub height
and a larger rotor diameter should offer great advantages. However, some experts say, "In Japan, with
quite extreme wind blowing in typhoons and other occasions, too high hubs and/or too large rotor
diameters may result in overly severe requirements for design strength, and cost all the more." This
problem of cost-effectiveness seems to be one of the issues lying behind the difficulty in adopting
larger turbines.
However, in their lineups for the Japanese market in 2016, some turbine manufacturers include several
models with a rotor diameter of 100 meters or more as part of their main offerings. With more
facilities adopting these models, turbines in Japan would also grow larger in size to some extent.
Factors that cause changes in turbine costs in Japan
(1) Comparison with international prices Because turbines are an internationally traded product, turbine prices are largely influenced not only
by domestic but also by international factors. To examine impacts of international factors, this section
compares costs for turbines in Japan with turbine prices in markets across the world. Here, however,
comparing costs and prices of turbines as of their commercial operation year would be irrelevant, for
two reasons. First, for Europe and the United States, most wind turbines are produced at home or in
neighboring countries, and delivered in a short time, whereas Japan may have to import turbines with
some time lag in delivery, as some nacelles used for them may be conveyed all the way from Europe
or the United States. As a result, differences in time between construction work periods appear as
another bias that makes such comparison irrelevant. Second, fluctuations in the foreign exchange rate
also have some impact on costs with a time lag. Impacts of the exchange rate appear primarily when a
contract is concluded, not at the commercial operation date of the turbine. For these reasons,
international comparison should use costs and prices of turbines as of a contract/transaction being
concluded to better reflect the realities.
23
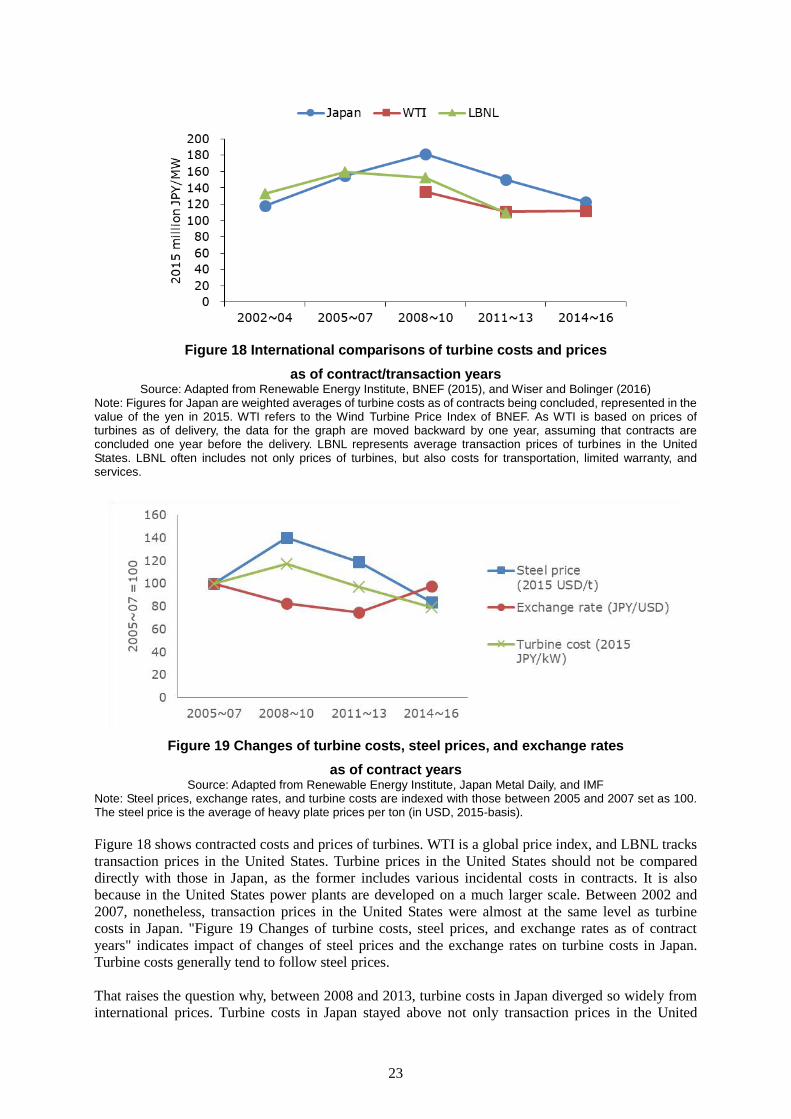
Figure 18 International comparisons of turbine costs and prices
as of contract/transaction years Source: Adapted from Renewable Energy Institute, BNEF (2015), and Wiser and Bolinger (2016)
Note: Figures for Japan are weighted averages of turbine costs as of contracts being concluded, represented in the value of the yen in 2015. WTI refers to the Wind Turbine Price Index of BNEF. As WTI is based on prices of turbines as of delivery, the data for the graph are moved backward by one year, assuming that contracts are concluded one year before the delivery. LBNL represents average transaction prices of turbines in the United States. LBNL often includes not only prices of turbines, but also costs for transportation, limited warranty, and services.
Figure 19 Changes of turbine costs, steel prices, and exchange rates
as of contract years Source: Adapted from Renewable Energy Institute, Japan Metal Daily, and IMF
Note: Steel prices, exchange rates, and turbine costs are indexed with those between 2005 and 2007 set as 100. The steel price is the average of heavy plate prices per ton (in USD, 2015-basis).
Figure 18 shows contracted costs and prices of turbines. WTI is a global price index, and LBNL tracks
transaction prices in the United States. Turbine prices in the United States should not be compared
directly with those in Japan, as the former includes various incidental costs in contracts. It is also
because in the United States power plants are developed on a much larger scale. Between 2002 and
2007, nonetheless, transaction prices in the United States were almost at the same level as turbine
costs in Japan. "Figure 19 Changes of turbine costs, steel prices, and exchange rates as of contract
years" indicates impact of changes of steel prices and the exchange rates on turbine costs in Japan.
Turbine costs generally tend to follow steel prices.
That raises the question why, between 2008 and 2013, turbine costs in Japan diverged so widely from
international prices. Turbine costs in Japan stayed above not only transaction prices in the United

24
States but also WTI all through the period. The most significant contributor that helped turbine costs in
Japan diverge from global turbine prices from 2008 seems to be found in institutional factors at home.
The Building Standards Act of Japan, revised in 2007, requires that wind power plants satisfy stringent
earthquake-proof criteria, unique to the country.12 Turbines built for power generation in Japan are
required to be strong enough to endure such severe conditions. In terms of strength for bearing
burdens of extreme wind in typhoons and other occasions, the same conditions as in Europe apply.
However, additional strength is required to resist earthquakes, which requires some modification to
design of turbines, with the risk of cost increases.
The Building Standards Act also requires that steels and other materials used for major structures of
turbines satisfy quality specified in sections of the Japanese Industrial Standards designated by the
Minister of Land, Infrastructure, Transport and Tourism. Some manufacturers that the authors
interviewed said materials that meet the conditions can be produced only by limited factories as
tailor-made products for the Japanese market.13
Nonetheless, prices of turbines in contracts concluded between 2014 and 2016 are falling down near
the global WTI index. Declines of cost during the period may be attributable to institutional factors at
home. With the FiT being enforced in July 2012, growth of installed capacity of wind power, after
temporary slowdowns, have been picking up, only moderately, a sign of reinvigoration in the Japanese
market. New wind power capacities installed on an annual basis increased again in 2014 and 2015 to
130 MW and 240 MW, respectively (JWPA, 2017). Enhanced attractiveness of Japan as a wind power
market after the introduction of the FiT encourages turbine producers overseas to enter the country
again. During interviews, several turbine producers said, "Amid increasingly fierce competition
among turbine manufacturers, higher prices are hard to ask for, even with increased procurement
prices for electricity under the FiT. The FiT itself offers us no opportunity to achieve higher
profitability."
(2) Relation with the size of power plants Next, this section examines the relation between the size of plants and turbine costs. As shown in
Figure 16, large differences appeared in turbine costs around 2008. Here, turbines coming into
operation in 2008 and later are selected to study the relation between their size and costs. It is found
that, as in the case of investment costs, the logarithmic model fits better than the linear one, with a
moderate level of negative correlation at a coefficient (R) of 0.406, although statistically insignificant
at a significance level of 5% (n = 19, p-value = 0.085).
If any logarithmic relation exists between the size and cost, then, in comparison with a single turbine
of 2 MW, a wind power plant equipped with another four turbines to have a capacity of 10 MW, or
five 2-MW units, could achieve significant reductions of turbine costs. However, four additional
turbines, nine units of 18 MW in total, would only deliver a smaller cost reduction effect than as many
turbines installed to increase the number of units from one to five.
12 Specifically, the revised Act requires wind turbines higher than 60 m to satisfy earthquake-resistance
standards comparable to those for skyscrapers. They are required to undergo a review by a designated
performance evaluation organization, before being approved by the Minister of Land, Infrastructure, Transport
and Tourism. Influences made by the revision are summarized by Hayashi (2008). 13 Building Standards Act: Article 37 (Quality of construction materials)-1 "Wood, steel, concrete, and other
construction materials designated by the Minister of Land, Infrastructure, Transport and Tourism as used for
foundations, main structures, and other parts of buildings specified by a Cabinet Order as critical for safety, fire
prevention, and hygiene reasons (hereinafter referred to as 'designated construction materials' in this Article)
shall fall under any of the following items:
1. The quality satisfies sections of the Japanese Industrial Standards or the Japanese Agricultural Standards
designated by the Minister of Land, Infrastructure, Transport and Tourism for each of the designated construction
materials."

25
y = -13.41ln(x) + 200.54
0
50
100
150
200
250
300
1 10 100
millon JP
Y/M
W
Plant size(MW) Figure 20 Relation between the size of power plants and turbine prices
(plants coming into commercial operation in 2008 and later) Source: Renewable Energy Institute
26
5. Analysis of civil engineering and electrical work costs
Changes of costs over time
Civil engineering costs include costs for constructing wind power plants and building roads for
transportation to construction sites. Electrical work costs are composed of costs for laying wires over
the premises, and installing and connecting transformers and other necessary equipment. Costs for
laying power lines should be classified as grid connection costs. However, some power plants include
the costs in their electrical work costs. In this analysis, electrical work and grid connection costs are
collectively referred to as "electrical work and connection costs." Civil engineering and electrical work
costs are the two largest items after turbine costs (Figure 11). Unlike turbine costs, the two items are
impacted by several domestic factors that are intertwined.
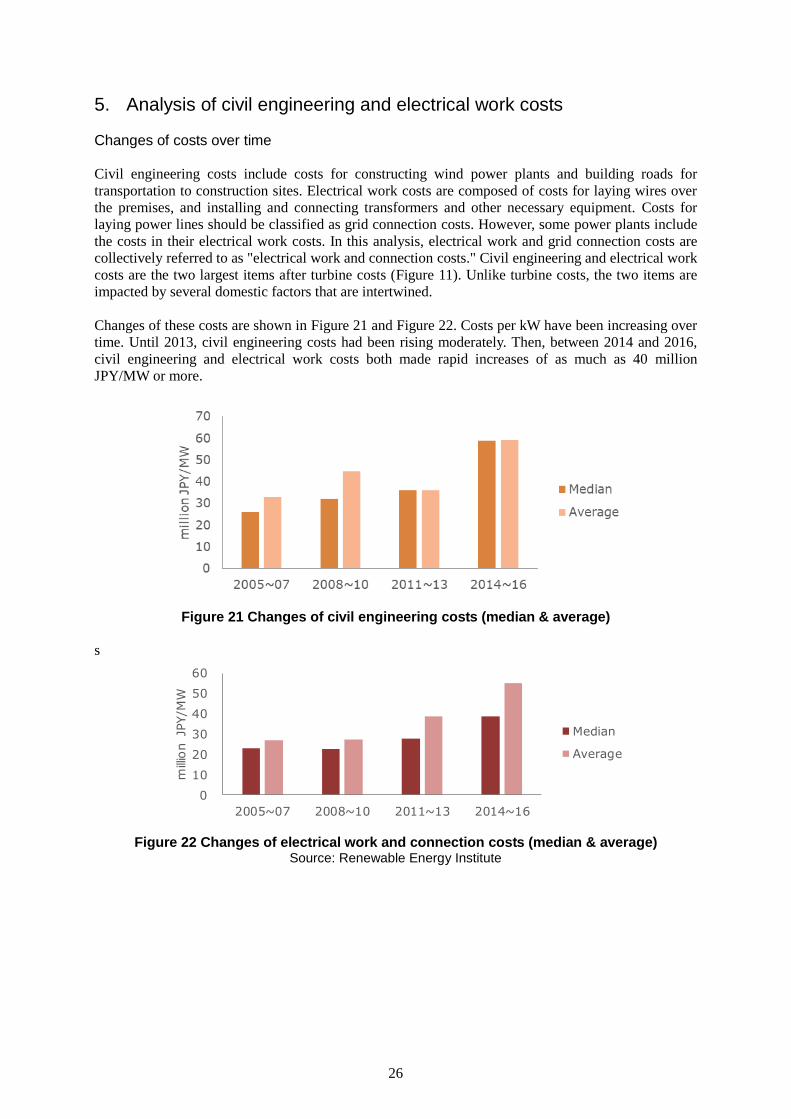
Changes of these costs are shown in Figure 21 and Figure 22. Costs per kW have been increasing over
time. Until 2013, civil engineering costs had been rising moderately. Then, between 2014 and 2016,
civil engineering and electrical work costs both made rapid increases of as much as 40 million
JPY/MW or more.
Figure 21 Changes of civil engineering costs (median & average)
s
0
10
20
30
40
50
60
2005~07 2008~10 2011~13 2014~16
millio
n JP
Y/M
W
Median
Average
Figure 22 Changes of electrical work and connection costs (median & average)
Source: Renewable Energy Institute

27
Analysis of cost factor increases
The focus is placed on factors that contributed to these sharp increases in civil engineering and
electrical work cost between 2014 and 2016. This section examines possible domestic factors related
to these two categories of costs (Table 7).
Table 7 possible factors for cost rise Factor Issues to be examined
Locational factor
Civil engineering: Whether any geographical features may contribute to increased costs for preparing sites. Electrical work: Whether power plants are located somewhere too far from a grid connection point.
Industrial factor Whether too small a size of power plants, 5 MW on average between 2014 and 2016, may have any influence.
Whether so-called reconstruction work demand and Olympics effect may push up labor costs, material prices, and/or unit construction costs.
Whether prolonged construction periods may have any influence.
(1) Locational factors The first issue is whether any specific geographical features may impact construction costs. Civil
engineering costs may increase when power plants are constructed in mountainous areas, as costs add
up for, among others, building roads to deliver turbines, and clearing forests to prepare sites.
Aggregating civil engineering by geographic feature, as shown below in Figure 23, demonstrates that
indeed costs tend to be larger among power plants built in mountains.
Figure 23 Civil engineering costs by type of geographic feature
Source: Renewable Energy Institute
Then, examining in which geographical features wind power plants were built between 2014 and 2016,
it can be observed, as shown Figure 24, that most of them were built in lowlands. That nullifies the
assumption that locational factors are mainly responsible for increased civil engineering costs between
2014 and 2016.
28
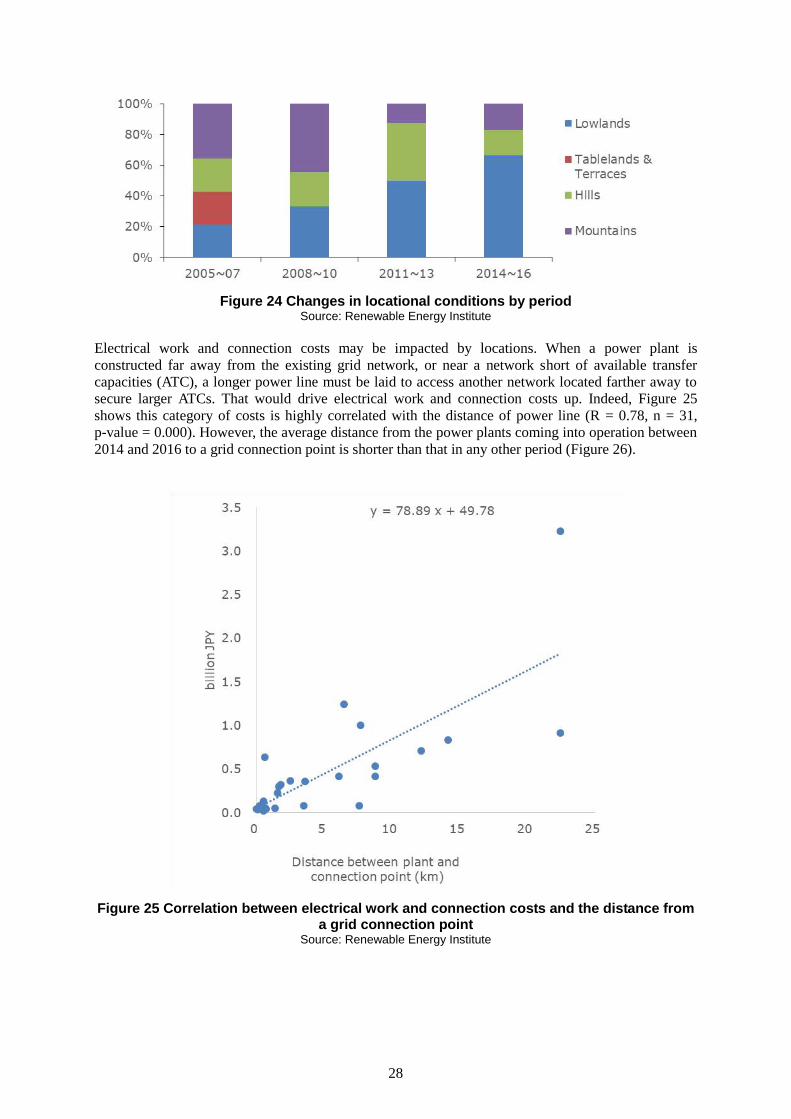
Figure 24 Changes in locational conditions by period
Source: Renewable Energy Institute
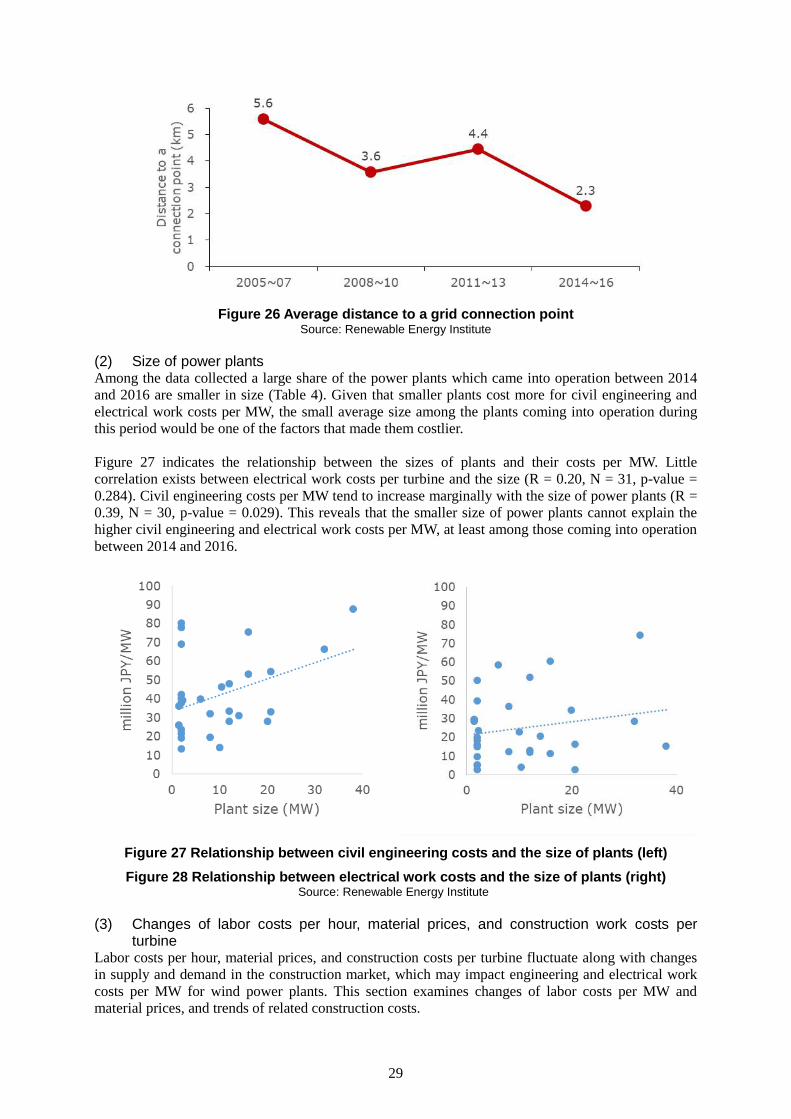
Electrical work and connection costs may be impacted by locations. When a power plant is
constructed far away from the existing grid network, or near a network short of available transfer
capacities (ATC), a longer power line must be laid to access another network located farther away to
secure larger ATCs. That would drive electrical work and connection costs up. Indeed, Figure 25
shows this category of costs is highly correlated with the distance of power line (R = 0.78, n = 31,
p-value = 0.000). However, the average distance from the power plants coming into operation between
2014 and 2016 to a grid connection point is shorter than that in any other period (Figure 26).
Figure 25 Correlation between electrical work and connection costs and the distance from a grid connection point
Source: Renewable Energy Institute
29
Figure 26 Average distance to a grid connection point
Source: Renewable Energy Institute
(2) Size of power plants Among the data collected a large share of the power plants which came into operation between 2014
and 2016 are smaller in size (Table 4). Given that smaller plants cost more for civil engineering and
electrical work costs per MW, the small average size among the plants coming into operation during
this period would be one of the factors that made them costlier.
Figure 27 indicates the relationship between the sizes of plants and their costs per MW. Little
correlation exists between electrical work costs per turbine and the size (R = 0.20, N = 31, p-value =
0.284). Civil engineering costs per MW tend to increase marginally with the size of power plants (R =
0.39, N = 30, p-value = 0.029). This reveals that the smaller size of power plants cannot explain the
higher civil engineering and electrical work costs per MW, at least among those coming into operation
between 2014 and 2016.
Figure 27 Relationship between civil engineering costs and the size of plants (left)
Figure 28 Relationship between electrical work costs and the size of plants (right) Source: Renewable Energy Institute
(3) Changes of labor costs per hour, material prices, and construction work costs per turbine
Labor costs per hour, material prices, and construction costs per turbine fluctuate along with changes
in supply and demand in the construction market, which may impact engineering and electrical work
costs per MW for wind power plants. This section examines changes of labor costs per MW and
material prices, and trends of related construction costs.
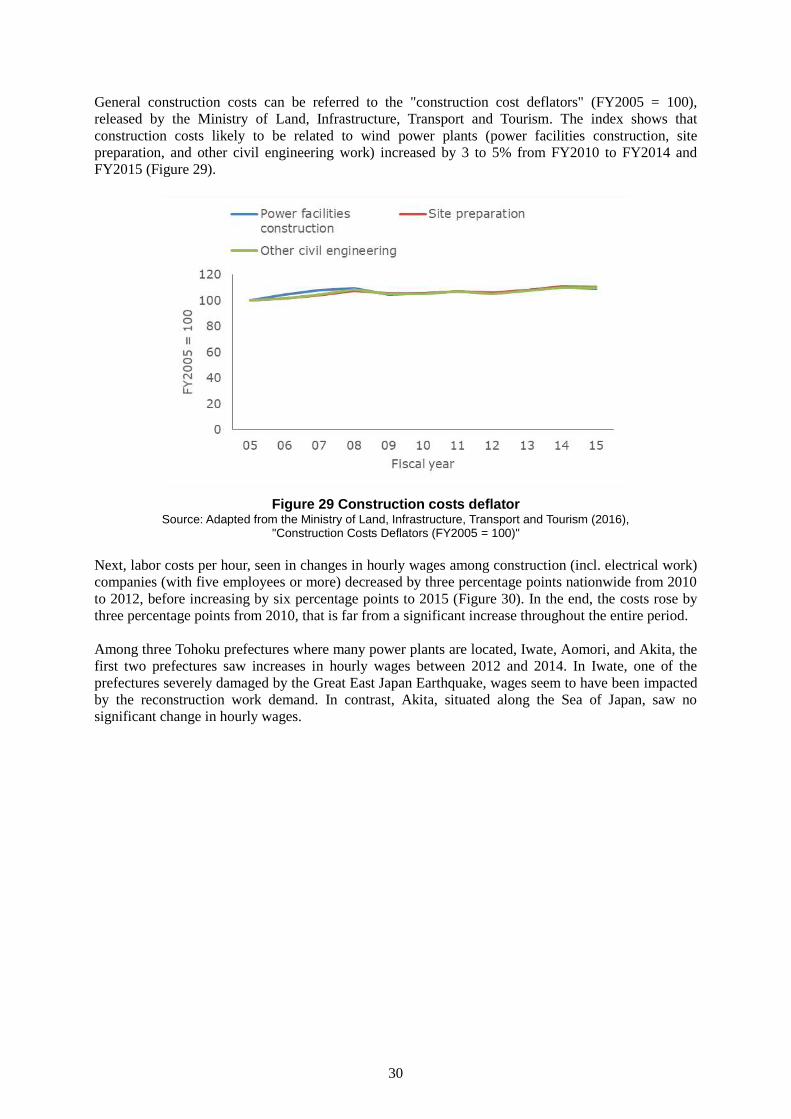
30
General construction costs can be referred to the "construction cost deflators" (FY2005 = 100),
released by the Ministry of Land, Infrastructure, Transport and Tourism. The index shows that
construction costs likely to be related to wind power plants (power facilities construction, site
preparation, and other civil engineering work) increased by 3 to 5% from FY2010 to FY2014 and
FY2015 (Figure 29).
Figure 29 Construction costs deflator
Source: Adapted from the Ministry of Land, Infrastructure, Transport and Tourism (2016), "Construction Costs Deflators (FY2005 = 100)"
Next, labor costs per hour, seen in changes in hourly wages among construction (incl. electrical work)
companies (with five employees or more) decreased by three percentage points nationwide from 2010
to 2012, before increasing by six percentage points to 2015 (Figure 30). In the end, the costs rose by
three percentage points from 2010, that is far from a significant increase throughout the entire period.
Among three Tohoku prefectures where many power plants are located, Iwate, Aomori, and Akita, the
first two prefectures saw increases in hourly wages between 2012 and 2014. In Iwate, one of the
prefectures severely damaged by the Great East Japan Earthquake, wages seem to have been impacted
by the reconstruction work demand. In contrast, Akita, situated along the Sea of Japan, saw no
significant change in hourly wages.

31
Figure 30 Changes of hourly wages among constructors (with 5 employees or more)
(2010 = 100) Source: Adapted from the Ministry of Health, Labour and Welfare, and Aomori, Iwate, and Akita Prefectures, "Monthly Labour Survey" Note: Hourly wages are the total amount of cash earnings divided by the total of actual working hours.
Finally, material prices must be examined. Among materials used for civil engineering work for wind
power plants, steel and concrete are major. Indexes of prices of these construction materials in
individual cities are released by the Economic Research Association. Here, to compare impacts among
Tohoku, the region along the Sea of Japan, and the rest of Japan, three cities, Sendai, Niigata, and
Tokyo are selected and prices of plain steel and liquid concrete are examined there. It is found that
prices of plain steel fell from 2010 in all three cities. In contrast, they all saw price increases in liquid
concrete from 2010. Prices rose by some 10% in Tokyo and Niigata, and by as much as some 70% in
Sendai from the year. The sharp increase of liquid concrete prices in Sendai seems to be related to the
reconstruction work demand after the Great East Japan Earthquake.
Figure 31 Price indexes of construction materials (plain steel & liquid concrete) for cities
Source: Adapted from the Economic Research Association by the Renewable Energy Institute
Next, for electrical work, one of the main materials used is power cable, which main constituent
material is copper. Figure 32 plots changes of copper prices in Japan between 2005 and 2016. It is
clear that copper prices were at their highest between 2006 and 2008, before leveling off from 2010.
That is, increases of electrical work costs per MW between 2014 and 2016 cannot be explained by
prices of materials for power cable.
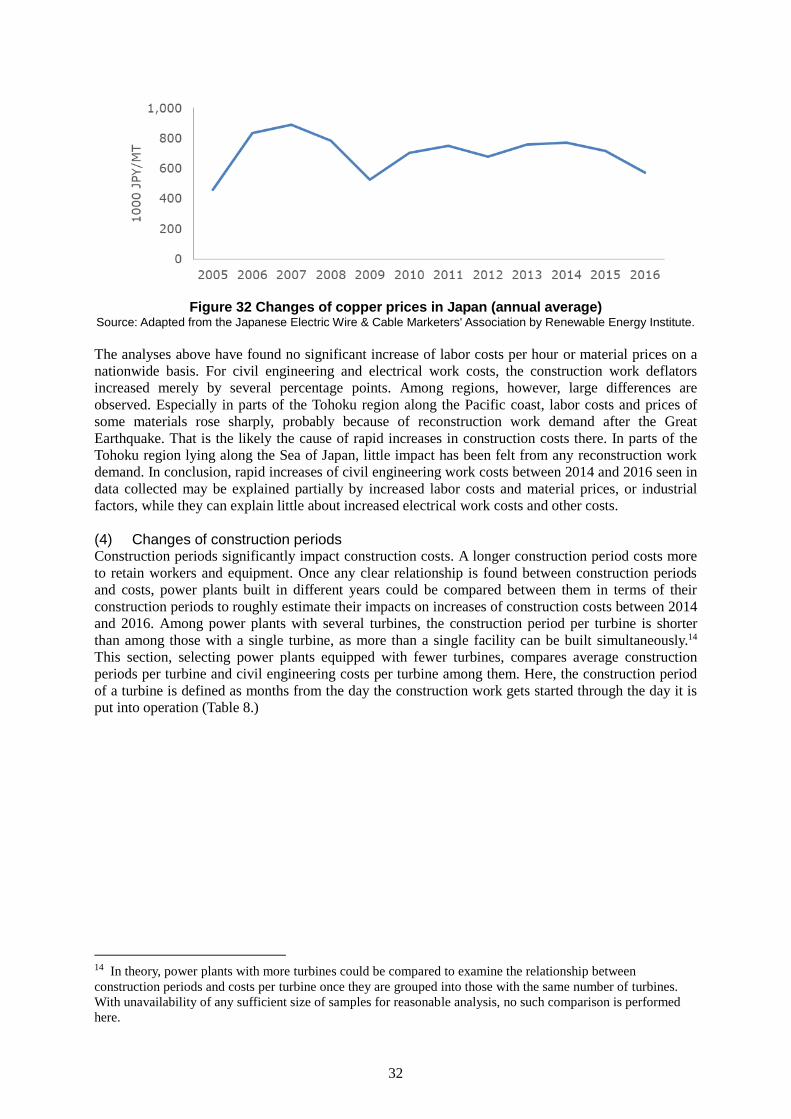
32
Figure 32 Changes of copper prices in Japan (annual average)
Source: Adapted from the Japanese Electric Wire & Cable Marketers' Association by Renewable Energy Institute.
The analyses above have found no significant increase of labor costs per hour or material prices on a
nationwide basis. For civil engineering and electrical work costs, the construction work deflators
increased merely by several percentage points. Among regions, however, large differences are
observed. Especially in parts of the Tohoku region along the Pacific coast, labor costs and prices of
some materials rose sharply, probably because of reconstruction work demand after the Great
Earthquake. That is the likely the cause of rapid increases in construction costs there. In parts of the
Tohoku region lying along the Sea of Japan, little impact has been felt from any reconstruction work
demand. In conclusion, rapid increases of civil engineering work costs between 2014 and 2016 seen in
data collected may be explained partially by increased labor costs and material prices, or industrial
factors, while they can explain little about increased electrical work costs and other costs.
(4) Changes of construction periods Construction periods significantly impact construction costs. A longer construction period costs more
to retain workers and equipment. Once any clear relationship is found between construction periods
and costs, power plants built in different years could be compared between them in terms of their
construction periods to roughly estimate their impacts on increases of construction costs between 2014
and 2016. Among power plants with several turbines, the construction period per turbine is shorter
than among those with a single turbine, as more than a single facility can be built simultaneously.14
This section, selecting power plants equipped with fewer turbines, compares average construction
periods per turbine and civil engineering costs per turbine among them. Here, the construction period
of a turbine is defined as months from the day the construction work gets started through the day it is
put into operation (Table 8.)
14 In theory, power plants with more turbines could be compared to examine the relationship between
construction periods and costs per turbine once they are grouped into those with the same number of turbines.
With unavailability of any sufficient size of samples for reasonable analysis, no such comparison is performed
here.

33
Table 8 Timetable for construction of a single turbine with a capacity of 1.5 MW (Ex.)
Source: NEDO (2008)
Figure 33 Relationship between construction periods and civil engineering costs:
Power plants with four turbines or fewer Source: Renewable Energy Institute
Construction periods and civil engineering costs show a moderate positive correlation between them
(R = 0.591, n = 14, p-value = 0.026). That suggests that longer construction periods contribute to
higher civil engineering costs per turbine. In contrast, little correlation is seen between electricity work
costs and construction periods.
Then, how large are the differences in the construction period between years? Here again, power
plants equipped with a single turbine are selected to examine construction periods. They are divided
into two groups, those coming into operation by 2010 and those coming into operation after that year,
and construction periods are compared between them (Figure 34). In the first group, the average
construction period was 7 months, while in the latter, it was almost double, 13 months. According to
NEDO (2008), a standard wind power plant with a single turbine is constructed in some three months.
In practice, some plants may need longer time to be finished when tests and inspections take longer
than planned (one or two more months) to be completed, and/or when certain locational conditions
require construction of additional roads for access. Some people working in the wind power industry
say that in any event, very few power plants need 12 months or more.
No. Wind Power Plant: Construction Schedule 1st Month 2nd Month 3rd Month 4th Month
Milestone Construction
started Power
received Transferred
Finished Started
Civil engineering Roads & sites
Foundation for turbines
Premises
Cables for high-voltage power Electrical work
Switchboards & cubicles
Cables & earth connection
Towers Wind turbines incl. overland transport
Nacelles & rotors
Controllers
Measuring equipment installed Measuring equipment
Inspected (adjusted) by manufacturer Test & inspection
Voluntary pre-service inspection
Test run

34
As observed above, the construction period is positively correlated with civil engineering costs, and it
has been getting longer in recent years. That leads to the assumption that such a rapid increase of the
construction period may have given not negligible impact on increases of civil engineering costs per
turbine.
Figure 34 Construction period for wind power plants equipped with a single turbine Source: Renewable Energy Institute
The analyses above indicate that the rises of civil engineering costs between 2014 and 2016 are in part
attributable to increased labor costs per hour and material prices. Especially, they suggest these factors
had greater impacts on parts of the Tohoku region lying along the Pacific coast. In contrast, no
significant impact is observed along the Sea of Japan. During interviews constructors engaged in work
for wind power plants said, "Indeed labor costs per hour and material prices increased, but they do not
have so much influence on the total construction cost." Rather, they stated, "In Tohoku, with scarcity
of labor and heavy machines, local contractors have found they have the upper hand." That may be a
factor that drives up prices. As another possible contributor to the increased civil engineering costs,
this research has also found prolonged construction periods. No specific factor lying behind that has
been identified.
For electrical work and connection costs, this research has examined their relationship with the
distance from an interconnection network and prices of copper, the main constituent material for
power cable, but found that neither can explain the rapid cost increases between 2014 and 2016,
leaving any contributors unknown.

35
6. Analysis of operation and maintenance costs
O&M costs and their breakdown
Another important cost item, along with investment, is operation and maintenance (O&M) costs. Wind
power plants generate electricity on a great number of machines, which must be operated and
maintained in an appropriate manner once built and put into operation. For that purpose, power plants
must perform day-to-day maintenance services and regular inspections, and in addition, must prepare
some contingency arrangements, including insurance, to deal with any emergency, such as machine
malfunctions.
Figure 35 O&M costs (median) Source: Renewable Energy Institute
For this research, actual O&M cost data were collected from 33 plants, which exclude those planned
but have not come into operation. Among them, total O&M costs stand at 11 million JPY/MW/year in
median and 12 million JPY/MW/year on average. In the total costs, "regular maintenance &
administration costs" account for the largest part. They are ordinary costs for day-to-day operation
management services and regular inspections. In addition, land rents and insurance premiums are also
treated as ordinary costs. In contrast, repair costs refer to irregular costs paid to deal with troubles in
equipment beyond the coverage of the manufacturer's guarantee. In consequence, a significant
dispersion is found among the costs, as some plants have paid little for repair so far.
Differences in O&M costs between younger and older power plants were examined by dividing them
into two groups, those coming into operation between 2005 and 2010 and those getting started after
that year, to aggregate the costs in each group. It is found that repair cost more in the former. It seems
quite natural that older power plants have to pay more for repair. Another item, regular maintenance &
administration costs, is much larger, almost double, among the power plants coming into operation
between 2011 and 2016. In the latter group, insurance premiums also increase, though they represent
merely a small part of total costs.
International comparison of O&M costs
Where does Japan stand in the international comparison of O&M costs? As done before for investment
costs, this section compares Japan and Germany in O&M costs (average). In Germany, O&M costs are
reported on a kilowatt-hour basis. Here, costs in Japan are also converted into the same unit.
It is observed that wind power plants in Japan spend almost double for O&M than those in Germany
(Figure 36). Categorized by item, all the costs other than land rent are much larger in Japan.
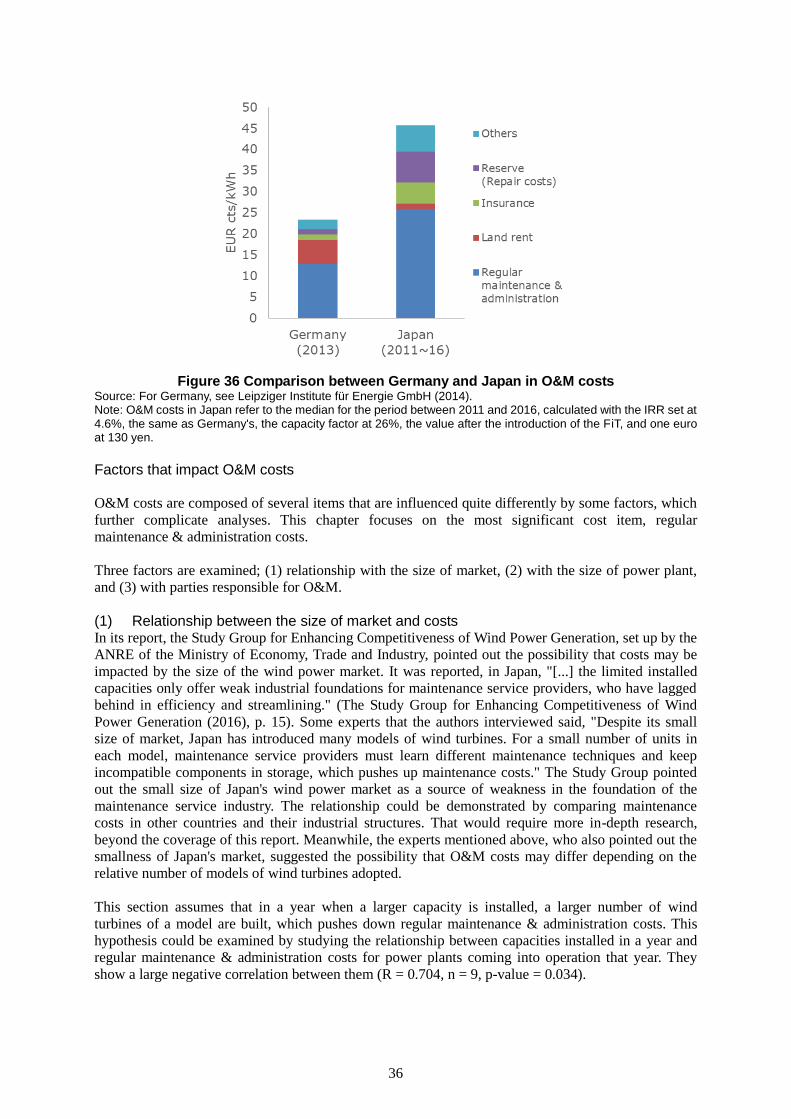
36
Figure 36 Comparison between Germany and Japan in O&M costs Source: For Germany, see Leipziger Institute für Energie GmbH (2014). Note: O&M costs in Japan refer to the median for the period between 2011 and 2016, calculated with the IRR set at 4.6%, the same as Germany's, the capacity factor at 26%, the value after the introduction of the FiT, and one euro at 130 yen.
Factors that impact O&M costs
O&M costs are composed of several items that are influenced quite differently by some factors, which
further complicate analyses. This chapter focuses on the most significant cost item, regular
maintenance & administration costs.
Three factors are examined; (1) relationship with the size of market, (2) with the size of power plant,
and (3) with parties responsible for O&M.
(1) Relationship between the size of market and costs In its report, the Study Group for Enhancing Competitiveness of Wind Power Generation, set up by the
ANRE of the Ministry of Economy, Trade and Industry, pointed out the possibility that costs may be
impacted by the size of the wind power market. It was reported, in Japan, "[...] the limited installed
capacities only offer weak industrial foundations for maintenance service providers, who have lagged
behind in efficiency and streamlining." (The Study Group for Enhancing Competitiveness of Wind
Power Generation (2016), p. 15). Some experts that the authors interviewed said, "Despite its small
size of market, Japan has introduced many models of wind turbines. For a small number of units in
each model, maintenance service providers must learn different maintenance techniques and keep
incompatible components in storage, which pushes up maintenance costs." The Study Group pointed
out the small size of Japan's wind power market as a source of weakness in the foundation of the
maintenance service industry. The relationship could be demonstrated by comparing maintenance
costs in other countries and their industrial structures. That would require more in-depth research,
beyond the coverage of this report. Meanwhile, the experts mentioned above, who also pointed out the
smallness of Japan's market, suggested the possibility that O&M costs may differ depending on the
relative number of models of wind turbines adopted.
This section assumes that in a year when a larger capacity is installed, a larger number of wind
turbines of a model are built, which pushes down regular maintenance & administration costs. This
hypothesis could be examined by studying the relationship between capacities installed in a year and
regular maintenance & administration costs for power plants coming into operation that year. They
show a large negative correlation between them (R = 0.704, n = 9, p-value = 0.034).
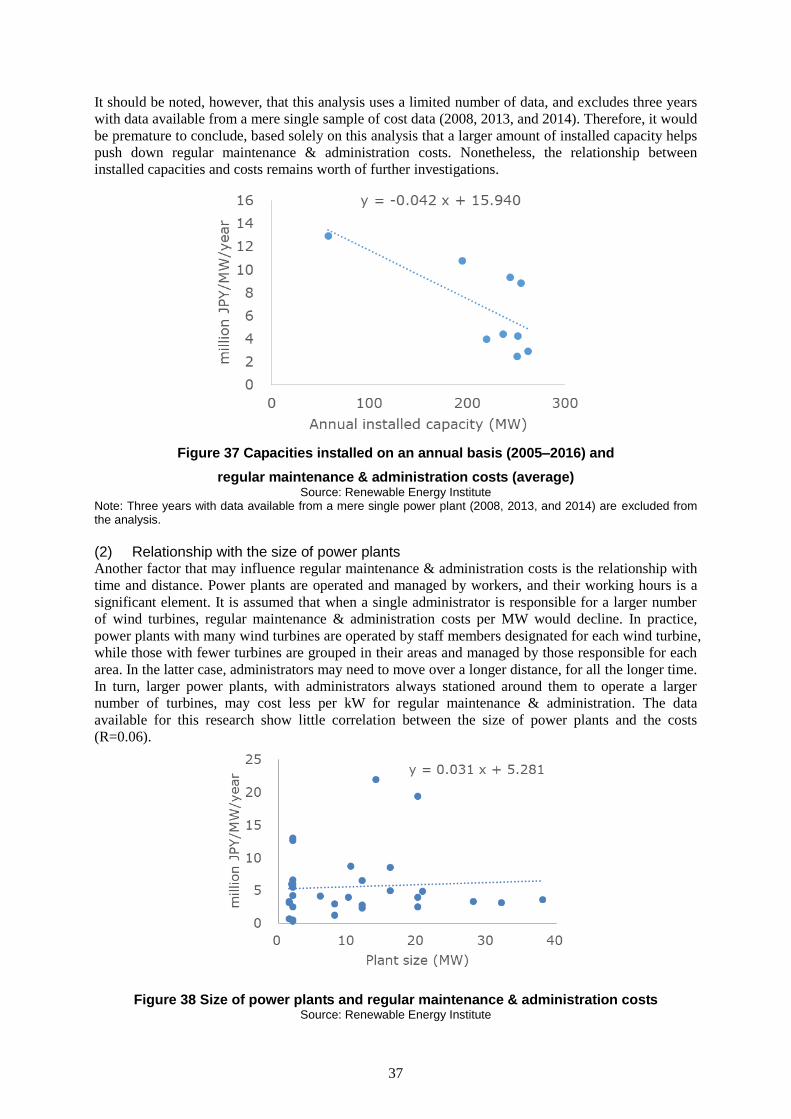
37
It should be noted, however, that this analysis uses a limited number of data, and excludes three years
with data available from a mere single sample of cost data (2008, 2013, and 2014). Therefore, it would
be premature to conclude, based solely on this analysis that a larger amount of installed capacity helps
push down regular maintenance & administration costs. Nonetheless, the relationship between
installed capacities and costs remains worth of further investigations.
Figure 37 Capacities installed on an annual basis (2005–2016) and
regular maintenance & administration costs (average) Source: Renewable Energy Institute
Note: Three years with data available from a mere single power plant (2008, 2013, and 2014) are excluded from the analysis.
(2) Relationship with the size of power plants Another factor that may influence regular maintenance & administration costs is the relationship with
time and distance. Power plants are operated and managed by workers, and their working hours is a
significant element. It is assumed that when a single administrator is responsible for a larger number
of wind turbines, regular maintenance & administration costs per MW would decline. In practice,
power plants with many wind turbines are operated by staff members designated for each wind turbine,
while those with fewer turbines are grouped in their areas and managed by those responsible for each
area. In the latter case, administrators may need to move over a longer distance, for all the longer time.
In turn, larger power plants, with administrators always stationed around them to operate a larger
number of turbines, may cost less per kW for regular maintenance & administration. The data
available for this research show little correlation between the size of power plants and the costs
(R=0.06).
Figure 38 Size of power plants and regular maintenance & administration costs
Source: Renewable Energy Institute

38
(3) O&M costs by type of O&M service providers O&M services can be supplied by different types of entities. Under most contracts, turbine
manufacturers offer a warranty against defects and/or a guarantee of a specific availability factor,
among others, for two years from the date of a turbine starting operation, and they are responsible for
its O&M. After that period, O&M services can be managed in three different players: (1) power
producers operate and maintain plants in-house; (2) turbine manufacturers continue providing O&M
services; and (3) O&M services are outsourced to O&M service providers for wind power plants.
When power producers were asked who was responsible for O&M after the expiration of a warranty,
their responses were split almost equally between the three groups (Figure 39). Among the power
plants, 35% were operated and maintained by power producers in-house, while as many were cared for
by turbine manufacturers. The remaining 30% of them had their O&M services outsourced to O&M
service providers.
Figure 39 Share of O&M service providers Source: Renewable Energy Institute
Next, who is responsible for O&M is compared among power plants to see what difference(s) may
appear in their general O&M costs. The average cost is higher when turbine manufacturers or power
producers provide O&M services in-house. However, little difference is observed in the median
between the ways O&M services are carried out (Figure 40). It should be noted that, among power
producers who operate and maintain their wind turbines in-house, those with 20 turbines or more only
spend roughly half the average for the work. That suggests the possibility that differences in regular
maintenance & administration costs may not reflect the ways O&M services are dealt with, but rather
the number of wind turbines they manage and/or the amount of experience they have.
In contrast, large differences are observed in repair costs. The data collected for this research have
indicated that power producers working themselves for O&M pay more for repair. In addition, repair
costs differ a lot even among power producers who manage a larger number of wind turbines in-house,
and they may not simply change in proportion to the number of turbines.

39
Figure 40 Regular maintenance & administration and repair costs
by type of O&M service providers Source: Renewable Energy Institute
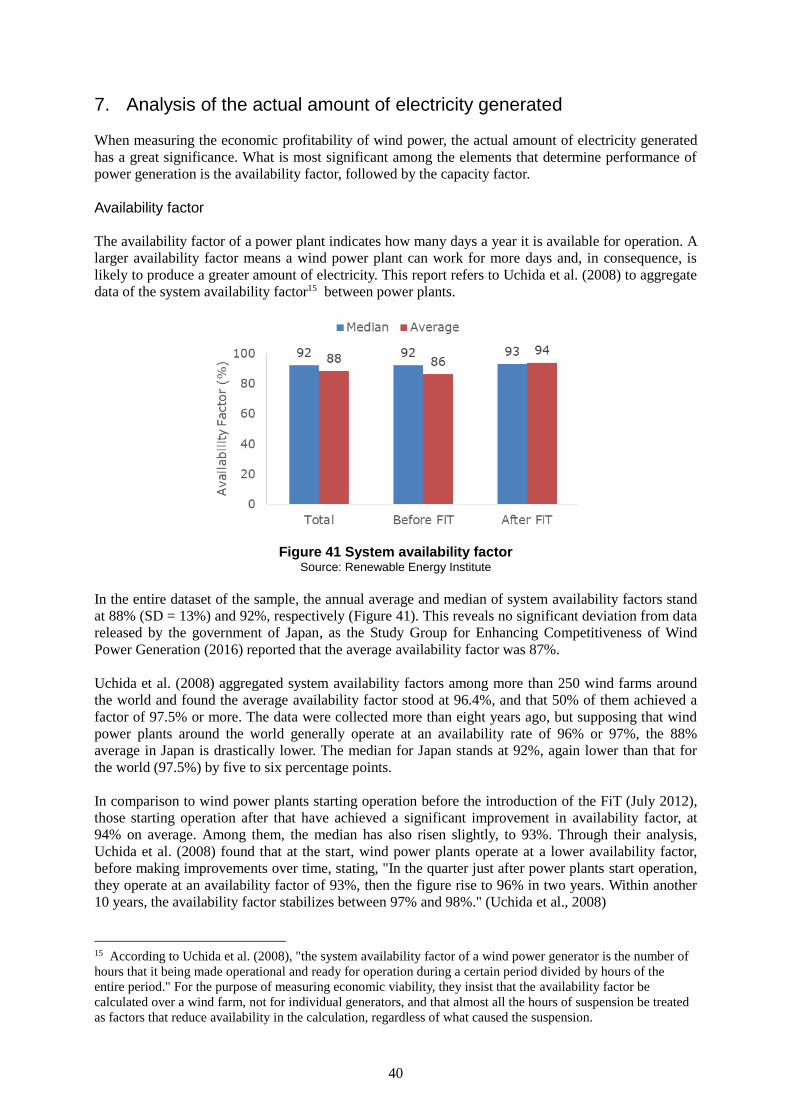
40
7. Analysis of the actual amount of electricity generated
When measuring the economic profitability of wind power, the actual amount of electricity generated
has a great significance. What is most significant among the elements that determine performance of
power generation is the availability factor, followed by the capacity factor.
Availability factor
The availability factor of a power plant indicates how many days a year it is available for operation. A
larger availability factor means a wind power plant can work for more days and, in consequence, is
likely to produce a greater amount of electricity. This report refers to Uchida et al. (2008) to aggregate
data of the system availability factor15 between power plants.
Figure 41 System availability factor Source: Renewable Energy Institute
In the entire dataset of the sample, the annual average and median of system availability factors stand
at 88% (SD = 13%) and 92%, respectively (Figure 41). This reveals no significant deviation from data
released by the government of Japan, as the Study Group for Enhancing Competitiveness of Wind
Power Generation (2016) reported that the average availability factor was 87%.
Uchida et al. (2008) aggregated system availability factors among more than 250 wind farms around
the world and found the average availability factor stood at 96.4%, and that 50% of them achieved a
factor of 97.5% or more. The data were collected more than eight years ago, but supposing that wind
power plants around the world generally operate at an availability rate of 96% or 97%, the 88%
average in Japan is drastically lower. The median for Japan stands at 92%, again lower than that for
the world (97.5%) by five to six percentage points.
In comparison to wind power plants starting operation before the introduction of the FiT (July 2012),
those starting operation after that have achieved a significant improvement in availability factor, at
94% on average. Among them, the median has also risen slightly, to 93%. Through their analysis,
Uchida et al. (2008) found that at the start, wind power plants operate at a lower availability factor,
before making improvements over time, stating, "In the quarter just after power plants start operation,
they operate at an availability factor of 93%, then the figure rise to 96% in two years. Within another
10 years, the availability factor stabilizes between 97% and 98%." (Uchida et al., 2008)
15 According to Uchida et al. (2008), "the system availability factor of a wind power generator is the number of
hours that it being made operational and ready for operation during a certain period divided by hours of the
entire period." For the purpose of measuring economic viability, they insist that the availability factor be
calculated over a wind farm, not for individual generators, and that almost all the hours of suspension be treated
as factors that reduce availability in the calculation, regardless of what caused the suspension.

41
Given the findings, older power plants that came into operation before the introduction of the FiT,
having solved early troubles to establish stability of operation, should be running at a higher
availability factor than those getting started later. In fact, however, the data collected for this survey
give the opposite result. The reason(s) behind this contradiction remains to be examined further.
Maintenance service providers and the actual availability factor
As mentioned in the previous chapter, there are three ways to cope with maintenance: by the power
producers themselves, by turbine manufacturers, and by O&M service providers. Whether the actual
availability factor differs between these three types of managing maintenance ways offers precious
information. Figure 42 suggests the possibility that the availability factor, both in the average and
median, is higher among plants operated and maintained by O&M service providers. Given that, as
shown before in Figure 40, O&M service providers successfully keep repair costs lower, a smaller
number of machine failures and other troubles would be a probable contributor to better availability
factor. The limited size of the sample, however, leaves open, for more careful examination, the
question of whether the trends observed here in terms of the actual availability factor between
different O&M service providers reflects that of all around Japan.
91 9095
85 8894
0
10
20
30
40
50
60
70
80
90
100
In-house Turbine
manufacturers
Other O&M service
providers
Availa
bility
fa
cto
r (%
)
Median Average
Figure 42 Actual availability factors by type of O&M service providers Source: Renewable Energy Institute
Capacity factor
The capacity factor of a wind power plant represents its efficiency based on the actual amount of
electricity generated, one of the critical indicators used to evaluate economic profitability of wind
power facilities. In general, wind power plants built in a place with better wind resource quality are
able to produce more electricity than others, naturally delivering a higher capacity factor. That is also
the case when comparing countries. Countries that can exploit good wind resource quality in a larger
part of their land can see a higher capacity factor among the wind farms they develop. Here, locational
factors also play a significant role. The same applies in individual countries, as areas have good wind
resource quality while others do not. Based on the data collected, Figure 43, dividing Japan into three
broad regions, shows average capacity factors of wind power plants depending on locations. It is
found that the average capacity factor is significantly higher in Northern Japan, demonstrating better
wind resource quality there.

42
Figure 43 Average capacity factor by region
Source: Renewable Energy Institute
On a nationwide basis, the data collected indicate a capacity factor of 23%, both in average and
median (Figure 44). It is much higher than the average capacity factor reported on a nationwide basis
by the ANRE (2016) in its data, around 19%. However, the two figures should not be compared
directly, as the ANRE's data include those of power plants constructed before 2005.
Figure 44 Capacity factor (average & median) Source: Renewable Energy Institute
Wind power plants are divided into two groups based on the periods in which they came into operation,
before the introduction of FiT (January 2005–June 2012) and after that (July 2012 and later). The two
groups show significant differences in capacity factor. In the latter group, the capacity factor, observed
in the average, is much larger, by five percentage points. The higher capacity factor may be
attributable to two elements. One is the locational factor. Among the sample of data collected, since
the introduction of the FiT, more facilities have been constructed in Northern Japan, a region with
better wind resource quality, which seems to have resulted in a higher capacity factor (Figure 8). The
other is the industrial factor. Since the introduction of the FiT, the capacity factor has also been rising
at facilities located in other areas than Northern Japan. That might be attributable to some sampling
bias. However, that may reflect a higher efficiency achieved by the combination of better availability
factor (Figure 41), as well as higher hub height and larger swept area (Figure 17).

43
Conclusions and themes for further research
This final chapter reviews the findings of this report and offers some suggestions for cost reduction,
before identifying research themes that remain to be studied.
Review of the current state of wind power costs in Japan
When examining wind power costs, the focus should be placed on the costs needed to produce 1 kWh
of electricity, or the LCOE. Table 9 below summarizes the findings of the analyses performed so far in
this report, showing the direction of changes in factors that have impact generation costs of wind
power (investment and O&M costs, and actual amount of electricity produced) in recent years
(2014–2016).
Table 9 Influences on wind power costs in recent years
International
factor
Domestic factor
Unknown Locational factor
Institutional factor
Industrial factor
Investment costs
Turbine costs - -
Civil engineering costs
- - ()
Electrical work and connection costs
- - - ()
O&M costs General management costs
- -
Electricity generated
Capacity factor - - -
Note: Arrows, "" and "," imply possible impacts of the factor that may push costs up or down, respectively.
The first row indicates the trend of turbine costs. After the revision of the Building Standards Act in
2007, which notably introduced tighter earthquake-resistance regulations developers in Japan had to
pay prices significantly higher than global prices when concluding a procurement contract for wind
turbines (around 2008)., an institutional factor. The FiT guarantees long-term purchase contracts with
fixed preferential prices, helping to increase the return on investment in wind power and to expand the
market. Before its introduction, under the renewable portfolio standard (RPS) system, terms and
conditions for the purchase of wind power electricity were determined by electricity utilities or on a
negotiation basis in individual contracts.
Some changes are also observed in civil engineering costs as more wind power plants are located in
Northern Japan and lowlands (Figure 24). Civil engineering costs tend to be lower in lowlands than in
mountainous areas (Figure 23). These locational conditions seem to have appeared under the influence
of certain institutional factors. Before, availability of grid connection for wind power plants was
controlled under the concept of limited connection capacity, as limits to grid connection capacities
were allotted by vertically integrated electricity utilities, except Tokyo, Kansai, and Chubu Electric
Power Companies. No access to the grid was available for wind farms unless bids were invited. Even
under such restrictions, the quota for the service area of Tohoku Electric Power was increased to a
fairly large size from around FY2008 to FY2011.16 With the introduction of the FiT, developers are
now allowed to apply for grid connection at any time, instead of waiting for any invitation from
vertically integrated electricity utilities.
16 For instance, before FY2008, Tohoku Electric Power had set an annual quota at dozens of MW or issued no
invitation at all. The company raised the limit to 160 MW in FY2008, 270 MW in FY2010, and 480 MW in
FY2011.

44
Although these changes should have pushed down costs, actual costs rapidly increased, for reasons
which are not always possible to identify. That is also the case for electrical work and connection costs.
Actually, at least in parts of the Tohoku region lying along the Pacific coast, some local factors, such
as the soaring labor cost and material prices for civil engineering due to the reconstruction work
demand after the Great East Japan Earthquake, might offer an explanation. However, on a nationwide
basis, they did not increase by more than a few percentage points.
In this regard, some experts and business operators stated that lack of the developers' expertise and
financing abilities may be some factors. Most of the developers (especially among such developers
other than the largest ones as included in the data collected) have yet to have much experience of
development, relying heavily on large EPC contractors in overall management and/or execution of
construction work. Under such conditions, power producers and EPC contractors are not on an equal
footing. Another factor that may contribute to the increased costs lies in a probable sellers' market for
the construction and electrical equipment industries with the recent demand for reconstruction work
after the Great Earthquake, and increased demand for electrical work after the introduction of the FiT
and the accident at the Fukushima Daiichi nuclear power plant in March 2011.
Some financial institutions stated that considering their business risk, they face difficulty in structuring
any financing arrangements for developers other than the largest ones unless they partner with
trustworthy, large EPC contractors. To put it the other way around, EPC contractors assume diverse
risks in development, and pass them on to the prices, which consequently push up the overall costs.
Some experts say this is rarely the case now for solar PV, as developers have already gotten much
experience in the sector. With only small capacities installed so far, the wind power sector has yet to
reach market and industrial maturity. Such lack of experience may be among the factors that hinder
cost reduction. Whether these arguments may be correct deserve further examination.
Among the O&M costs, regular maintenance & administration costs were found correlated with
annual installed capacity. Some experts have stated that maintenance is easier when more of the
installed turbines are selected from similar models, a fact that may have something to do with the
observed correlation. The relationship, if it really exists, may explain lower regular maintenance &
administration costs in Germany, where large wind power capacities, several gigawatts, are installed
annually. In terms of development of maintenance services, relationships with cumulative installed
capacity should be examined. However, that should be a theme for a separate study, as it requires
international comparisons.
At the same time, it has been found that facilities that started operation after the introduction of the
FiT have regular maintenance & administration costs which are double the ones of the facilities that
started before the FiT. In this respect, some experts and maintenance service providers stated that with
the FiT, power producers can now afford to spend more for operation management. That may produce
some positive effects as well, such as a larger availability factor, that should contribute to increases in
the amount of electricity generated.
Study on possible cost reductions for wind power
With its limited size of data and availability of information, this research has yet to fully analyze all
the cost items to explain what specifically causes increases in each of them and why wind power
remains costlier than in other countries. Keeping such shortage of information in mind, this section
examines what action could be led to reduce wind power costs.
(1) Maintaining an improved business and market environments
Since the introduction of FiT, business environments for wind power in Japan have been gradually
improving with favorable purchase prices and better access to the grid network. That has encouraged
foreign turbine manufacturers to enter the Japanese market again, with a gradual recovery of installed
capacity. Such changes in business conditions seem to have promoted competition between

45
manufacturers, with consequent reductions of turbine costs, an item that accounts for the largest
portion in investment costs. In this sense, maintaining the attractiveness of Japan for turbine
manufacturers as a wind power market is key to cost reduction.
(2) Growth of the entire market as a possible solution to cost reduction
This report, having analyzed past and current data of Japan, has yet to fully examine any impact of the
small size of its market on costs. Such examination would require international comparisons. An
analysis for this research has found a strong negative correlation between regular maintenance &
administration costs and annual installed capacity. The cost item also seems to have the number of
turbines administered by individual operators, not the size of power plants, as a significant factor. At
least, this suggests that growth of the entire market would be a critical factor, given its relationship
with efficiency of supply chains for goods and services, and the level of expertise of the sector as a
whole.
(3) Relaxation of restrictions on development in promising regions and sites
Economic feasibility of wind power also depends largely on locational conditions. For instance,
Northern Japan offers better wind resource quality, which helps achieve a higher capacity factor. In
turn, a larger capacity factor naturally pushes down LCOE of electricity produced. However,
Hokkaido and Tohoku Electric Power Companies, responsible for grid operation in this area, have
rigorously controlled and restricted access of wind power producers to the grid. With the introduction
of the FiT, which transferred the grid connection system from invitation basis into application basis,
and the "Pilot Program for Development of Grid Networks for Wind Power Generation," implemented
by the Ministry of Economy, Trade and Industry, many wind power projects have concentrated in
Northern Japan. However, existing transmission lines, including regional interconnection and
intra-regional grid, are not used or operated optimally. As a result, wind power producers may be
charged heavily for expansion of a grid network and/or they may be subject to curtailment. These
remaining restrictions on the development in regions of great economic rationality should be removed
through vigorous efforts.
Any relaxation of restrictions on farmland use may also help reduce wind power costs. As mentioned
before, civil engineering costs tend to be smaller for power plants constructed in lowlands than those
in mountains. In addition, plants located in mountains often face difficulties in transportation,
hindering adoption of larger turbines. In this respect, construction of power plants in lowlands and
tablelands, may help reduce wind power costs.
The question here is whether any potential location for wind power plants can be found in lowlands
and/or tablelands. A great promise would lie in farmland. Farmland may offer suitable sites for
reducing costs for transportation, civil engineering, and grid connection, among others, as it probably
has sufficient infrastructure, including access roads and transmission lines, developed until now. Wind
power plants need smaller foundations (in square meters) on which they are built, giving less influence
on farmland they stand on and farm work carried out there. That means wind power can coexist with
farming. Indeed, wind power plants have been constructed in farmland around Japan, and turbines are
also turning over farm fields as a common part of landscape overseas. However, Japan's
farmland-related legislation imposes tight controls, in principle prohibiting construction of wind
power plants on highly productive farmland, such as Agricultural Zone, and Class-1 farmland. Behind
that lie, among others, tougher restrictions laid down on development in 2009 by the Ministry of
Agriculture, Forestry and Fisheries, mainly to preserve Highly Productive Agricultural Land. Instead
of tightening regulations in a uniform manner with other types of development, wind power should
rather be explored extensively, helping farmers acquire a stable source of additional income to pursue
a way of coexistence with farming. Lifting and/or relaxing such regulations on wind power would
contribute to reducing wind power costs.17
17 For more details on regulations of use of farmland, see a report presented by Renewable Energy Institute,
"Study of Land Use Regulations and Environmental Assessment for Greater Deployment of Wind Power
Generation."

46
(4) Guarantee of transparency of regulation and accelerated procedures
During interviews some developers in Europe pointed out great importance of "No surprise," or
transparency of regulation. What they consider crucial is that laws and regulations must make clear
what type of turbines they are allowed to build where, and under what conditions. Otherwise, power
producers could not evaluate their risk of failing to obtain a license and/or permission before starting
development, and would eventually fail in development more frequently, and/or see increased cost for
planning & development and financing. In addition, procedures for permits and licenses must be
completed faster. The longer development takes, the costlier it will be, and the less efficient
investments will be.
In this respect, during interviews some experts and developers pointed out some challenges they
encounter during the process of the structure safety inspection. Under the Building Standards Act,
revised in 2007, developers are required to receive authorization for strength of support structures used
for wind power when they are taller than 60 meters (approval of the Minister of Land, Infrastructure,
Transport and Tourism until FY2013, or success in the inspection by Regional Industrial Safety and
Inspection Departments of the METI from FY2014). From FY2014, the Regional Industrial Safety and
Inspection Departments are required to complete an inspection of a standard turbine within 30 days.18
In fact, however, the Electric Power Safety Division of the METI says that the Regional Departments
gave up determination for almost half of the applications, referring them to an expert council
composed of academics.
Some experts and power producers said the expert council abruptly adds new inspection items in the
midst of inspection and/or leaves some of the inspection criteria poorly defined, a problem which
frustrates manufacturers and EPC contractors. Naturally, these uncertainties and risks all help push up
costs. Indeed, in Japan, a country quite susceptible to earthquakes and typhoons, keeping safety of
wind power plants at a certain level is critical. However, making safety inspection more transparent
while carrying out procedures faster to save time and labor needed for, and mitigate risks lying in,
inspections would not compromise safety, and rather help introduce more cost-efficient facilities and
equipment for wind power.
(5) Encouraging developers to develop expertise
Figure 14 has shown that turbines tend to cost more in Japan when procured through EPC contractors.
As mentioned in the previous section, construction costs, such as costs for civil engineering and
electrical work, have recently risen to so high a level that cannot be explained by labor costs and/or
material prices alone. Some state that such rapid increases may be an influence of relationships
between developers and EPC contractors including design ability and financing.
Experts stated that what is crucial to bring changes is to adopt the separate-contract system, which
should include competitive bidding for designing and construction work. That requires first, however,
that developers acquire relevant knowledge, experience, and competence. In Europe, developers have
been engaged in a great number of development projects, gone through extensive learning experience
and worked hard to maximize economic viabilities and reduce costs. They have obtained know-how
for "designing right specifications, integrating all tasks for optimization, and managing the processes
to prevent any delay. They also know how to encourage contractors to compete in each process and
maximize the profitability." Their know-how has not been acquired in a day. Rather, it is an
accumulation of lessons they have learned and improvements they have made through their rich
experience of development projects, or "improving by doing."
In Japan, growth of the wind power market has long been depressed, and developers may have been
offered only limited opportunities of improving by doing through experience. It is said that wind
power projects in Japan take ten years before commissioning. That increases costs for planning &
development and construction work, and what is worse, would deprive developers of opportunities of
18 Working Group on Strength of Facilities for Wind Power Generation of the Subcommittee on Electric Power
Safety, Industrial Safety Committee, Industrial Structure Council (2013)
47
improving by doing. The government of Japan is also expected to provide all possible support for
reducing time that individual development projects need before completion.
Themes for further research
Lastly, this section presents themes for further research. First, more data should be collected. As has
been stated so far, data collected for this research show no significant divergence from the overall
trends of the population while, for power plants starting operation between 2014 and 2016, data were
collected mainly from smaller plants, which may not fully represent trends of the population.
The limited size of the sample also served as a restriction on comparative analyses under the same
conditions, forcing samples to be roughly grouped when compared, and reducing the accuracy of the
analyses. Further effort must be exerted to collect a larger number of data.
Finally, this research focuses on explaining the current cost structure, putting aside quantitative
assessment of possible solutions for reducing costs. Specifically, given the small size of the Japanese
market itself, what effect any growth of the market may result in with regard to wind power cost
reduction remains to be examined. While collecting more data and analyzing the current state of the
markets around the world, the author will work to demonstrate in a quantitative manner how much of
the generation cost could be reduced.
48
References
Japanese literature
The Power Generation Cost Verification Working Group (2015), 'Report to the Subcommittee on
Long-term Energy Supply-demand Outlook on Long-term Forecast of Energy Supply and Demand,' The
Power Generation Cost Verification Working Group of the Advisory Committee for Natural Resources and
Energy (発電コストワーキンググループ (2015) 「長期エネルギー需給見通し小委員会に対する発電コ
スト等の検証に関する報告」総合資源エネルギー調査会発電コスト検証ワーキンググループ)
Tsutomu HAYASHI (2008), 'On Revisions of the Laws Related to Wind Power Generation Facilities, etc.,'
"Wind Energy," vol. 32 (3) pp. 77-78. (林農 (2008) 「風力発電設備にかかわる法改正など」『風力エネ
ルギー』vol. 32 (3) pp.77-78.)
The Study Group for Enhancing Competitiveness of Wind Power Generation (2016), 'Report of the Study
Group for Enhancing Competitiveness of Wind Power Generation' (風力発電競争力強化研究会(2016)
「風力発電競争力強化研究会報告書」)
The Ministry of the Environment (2016), 'FY2015 Report on Preparation of Basic Information for Zoning
Concerning Renewable Energy' (環境省 (2016) 「平成 27年度 再生可能エネルギーに関するゾーニン
グ基礎情報整備報告書」)
Japan Wind Power Association, General Incorporated Association (JWPA) (2017), 'Installed Capacities of
Wind Power Generation as of December 31, 2016, and Estimates of Installed Capacities as of March 31,
2017' (JWPA: 一般社団法人 日本風力発電協会 (2017) 「2016 年末の風力発電導入量と、2017 年 3
月末の推定導入量」)
Emi MIZUNO (2013), 'Cost of On-shore Wind Power Generation in Japan: Current State and Analysis,'
Discussion Paper of Renewable Energy Institute (水野瑛己 (2013) 「日本の陸上風力発電コストの現状
と分析」自然エネルギー財団ディスカッションペーパー)
New Energy and Industrial Technology Development Organization (NEDO) (2008), 'Guidebook for
Development of Wind Power Generation' (NEDO: 独立行政法人 新エネルギー・産業技術総合開発機
構 (2008) 「風力発電導入ガイドブック」)
New Energy and Industrial Technology Development Organization (NEDO) (2016), 'Wind Power
Generation Facilities in Japan: Data as of March 2016' (NEDO: 国立研究開発法人 新エネルギー・産業
技術総合開発機構 (2016) 「日本における風力発電・設備導入実績(2016 年 3月末現在)」)
Working Group on Strength of Facilities for Wind Power Generation of the Subcommittee on Electric
Power Safety, Industrial Safety Committee, Industrial Structure Council (2013), 'Report of the Working
Group on Strength of Facilities for Wind Power Generation of the Subcommittee on Electric Power Safety,
Industrial Safety Committee, Industrial Structure Council' (産業構造審議会保安分科会電力安全小委員
会風力発電設備構造強度ワーキンググループ (2013) 「産業構造審議会保安分科会電力安全小委員
会風力発電設備構造強度ワーキンググループ 報告書」)
The Agency for Natural Resources and Energy (2016), 'Trends of Costs by Type of Power Source (Solar
PV & Wind),' 25th meeting of the Procurement Price Calculation Committee (資源エネルギー庁 (2016)
「電源種別(太陽光・風力)のコスト動向等について」, 第 25回調達価格等算定委員会)
Yukinobu UCHIDA, Harman, K., Walker, R., and M. Wilkinson (2008), 'Trends of the Availability Factor
among Wind Farms: Findings from Surveys of Wind Farms in Service in Europe, the United States, and
Asia,' "Symposium on Deployment of Wind Energy," Vol. 30, pp. 144-147 (内田行宣, Harman, K.,
Walker, R., and M. Wilkinson, (2008) 「ウインドファーム稼働率の傾向についてー欧州・米国・アジアで
稼働中のウインドファーム調査結果—」『風力エネルギー利用シンポジウム』Vol. 30, pp. 144-147.)
English literature
BNEF: Bloomberg New Energy Finance (2015) "The future cost of onshore wind – an accelerating rate of
progress"
BNEF: Bloomberg New Energy Finance (2016a) "H2 2016 Global LCOE Outlook"

49
BNEF: Bloomberg New Energy Finance (2016b) "H2 2016 EMEA LCOE Outlook"
BNEF: Bloomberg New Energy Finance (2016c) "H2 2016 AMER LCOE Outlook"
BNEF: Bloomberg New Energy Finance (2016d) "H2 2016 APAC LCOE Outlook"
BNEF: Bloomberg New Energy Finance (2017) "H2 2016 Wind Turbine Price Index"
Bolinger M. and R. Wiser (2011) Understanding Trends in Wind Turbine Prices Over the Past Decade,
Lawrence Berkeley National Laboratory, Berkeley, CA.
Gonzalez, J. S., and R. L. Arantegui, (2016) "Technological evolution of onshore wind turbines – a
market-based analysis," Wind Energy, Vol. 19, pp. 2171-2187.
Lüers, S., Wallasch A.-K., and I. K. Rehfeldf, (2015) Kostensituation der Windenergie an Land in
Deutschland, DEUTSCHE WINDGUARD.
IEA Wind (2006) IEA Wind Energy Annual Report 2006.
IEA Wind (2008) IEA Wind Energy Annual Report 2007.
IEA Wind Task 26 (2015) Wind Technology, Cost, and Performance Trends in Denmark, Germany, Ireland,
Norway, the European Union, and the United States: 2007-2012, National Renewable Energy Laboratory.
IRENA: International Renewable Energy Agency (2015) Renewable Power Generation Costs in 2014.
IRENA. Abu Dhabi.
Leipziger Institute fur Energie GmbH (2014) Vorbereitung und Begleitung der Erstellung des
Erfahrungsberichts 2014 gem. Åò 65 EEG im Auftrag des Bundesministeriums fur Wirtschaft und Energie
Vorhaben IIe Stromerzeugung aus Windenergie - Wissenschaftlicher Bericht.
Leipziger Institute fur Energie GmbH (2015) Marktanalyse – Windenergie an Land, Hmburg.
Wiser R. and M. Bolinger (2016) 2015 Wind Technologies Market Report, U.S. Department of Energy.

50
Disclaimer: This report has been produced in collaboration with a number of organizations and individuals.
However, the entire responsibility for any statement and opinion contained here falls solely on Renewable
Energy Institute, and on no other organization or individual. Although the information given in this report is the
best available to the author at the time, Renewable Energy Institute cannot be held liable for its accuracy and
correctness.

Analysis of Wind Power Costs in Japan
January 2018 (Japanese original was published in June 2017)
Renewable Energy Institute
8F DLX Building, 1-13-1 Nishi-Shimbashi, Minato-ku, Tokyo 105-0003
Phone: +81-3-6866-1020
https://www.renewable-ei.org/en/