Analysis of Waste Collection Service Arrangements (June 2009)
271
Report Analysis of Waste Collection Service Arrangements Project I.D.: 08M081 Minnesota Pollution Control Agency Saint Paul, Minnesota June 2009 w-sw1-06
Transcript of Analysis of Waste Collection Service Arrangements (June 2009)
Report
Analysis of Waste Collection Service Arrangements Project I.D.: 08M081
Minnesota Pollution Control Agency Saint Paul, Minnesota
June 2009
w-sw1-06

June 24, 2009 Mr. Paul Smith Local Government Assistance Minnesota Pollution Control Agency 520 Lafayette Road North St. Paul, MN 55155 Dear Mr. Smith: RE: Analysis of Waste Collection Service Arrangements Foth Infrastructure & Environment, LLC is submitting two (2) electronic copies and two (2) hard copies of the report titled Analysis of Waste Collection Service Arrangements. Instead of a brief executive summary, this report expands that section to include a summary and the supporting information. This allows readers to cover key issues more quickly and then review the issues in more detail in the body of the report. Written comments provided during the draft report review period are included in this final document in Appendix I. If you have any questions regarding this report, please feel free to contact me at (651) 288-8596. Thank you very much for this opportunity. Sincerely, Foth Infrastructure & Environment, LLC
Warren Shuros Jessica M. Graveen Senior Project Manager Environmental Engineer WAS:JMF:RAB1
X:\EA\Communications\Misc. Projects\Collection Service Study 2008-09\web\coverletter.doc Eagle Point II • 8550 Hudson Blvd. North, Suite 105 • Lake Elmo, MN 55042 • (651) 288-8550 • Fax: (651) 288-8551

X:\MS\IE\2008\08M081\10000 reports\R - Analysis of Waste Collection Service Arrangements.doc
Analysis of Waste Collection Service Arrangements
Distribution
No. of Copies Sent To 2
Mr. Paul Smith Local Government Assistance Minnesota Pollution Control Agency 520 Lafayette Road North St. Paul, MN 55155
2 (electronic - PDF) (electronic – unprotected)

Analysis of Waste Collection Service Arrangements
Project ID: 08M081
Prepared for Minnesota Pollution Control Agency
520 LaFayette Road St. Paul, MN 55155
Prepared by Foth Infrastructure & Environment, LLC
June 2009
Copyright©, Foth Infrastructure & Environment, LLC 2009 Eagle Point II • 8550 Hudson Blvd. North, Suite 105 • Lake Elmo, MN 55042 • (651) 288-8550 • Fax: (651) 288-8551
REUSE OF DOCUMENTS This document has been developed for a specific application and not for general use; therefore, it may not be used without the written approval of Foth. Unapproved use is at the sole responsibility of the unauthorized user.


X:\MS\IE\2008\08M081\10000 reports\R - Analysis of Waste Collection Service Arrangements.doc i
Analysis of Waste Collection Service Arrangements
Contents
Page List of Abbreviations, Acronyms, and Symbols........................................................................... vii 1 Introduction .............................................................................................................................1
1.1 Purpose...........................................................................................................................1 1.2 Scope of Work ...............................................................................................................1
2 Literature Review ....................................................................................................................3 2.1 Commonly Identified Advantages/Disadvantages of Types of Collection Systems .....3
2.1.1 Open Systems.....................................................................................................3 2.1.2 Organized Systems.............................................................................................5
2.2 Occurrence of Each Type of Collection System............................................................7 2.2.1 Minnesota...........................................................................................................7
2.2.1.1 Eden Prairie ........................................................................................7 2.2.1.2 Twin Cities Metropolitan Area ..........................................................7
2.2.2 Nationally...........................................................................................................8 2.2.2.1 United States and Canada...................................................................8 2.2.2.2 Fort Collins, Colorado......................................................................10 2.2.2.3 Portland, Oregon ..............................................................................10 2.2.2.4 Des Moines, Iowa.............................................................................11
2.3 Minnesota Organized Collection Statutes and Collection Authority...........................12 2.3.1 Highlights of Current Statute ...........................................................................12 2.3.2 Establishment and Evolution of the Statute .....................................................13
2.4 Experiences of Minnesota Cities and Counties with Organized Collection Statutes and Process .........................................................................................................................18 2.4.1 Typical Goals ...................................................................................................18 2.4.2 Process .............................................................................................................19
2.4.2.1 Staff/Committee Considerations ......................................................19 2.4.2.2 Hauler Participation..........................................................................22
2.4.3 Select Municipal Examples..............................................................................23 2.4.3.1 City of Vadnais Heights ...................................................................24 2.4.3.2 City of Falcon Heights .....................................................................26 2.4.3.3 City of Minneapolis..........................................................................28 2.4.3.4 Cities of Plymouth and Edina...........................................................30
2.5 Issues Related to Collection Services ..........................................................................30 2.5.1 Cost/Pricing......................................................................................................30
2.5.1.1 City of Falcon Heights .....................................................................30 2.5.1.2 Ramsey/Washington Public Collection Study .................................31 2.5.1.3 Goodhue County Survey ..................................................................35 2.5.1.4 Rate Summary ..................................................................................36
2.5.2 Volume Based Pricing and Waste Generation.................................................36 2.5.3 Transportation (Transfer Haul Costs) ..............................................................37 2.5.4 Infrastructure Costs on Roads and Bridges......................................................39

ii X:\MS\IE\2008\08M081\10000 reports\R - Analysis of Waste Collection Service Arrangements.doc
2.5.5 Diesel and Gasoline Emissions........................................................................41 2.5.6 Accidents/Safety ..............................................................................................41
2.6 Interest Group Positions...............................................................................................42 2.6.1 National Solid Waste Management Association (NSWMA)...........................42 2.6.2 League of Minnesota Cities (LMC).................................................................45 2.6.3 Minnesota Inter-County Association (MICA) Policies ...................................46 2.6.4 Association of Minnesota Counties (AMC) ....................................................47 2.6.5 Minnesota Solid Waste Administrators Association (SWAA)........................47 2.6.6 Solid Waste Management Coordinating Board (SWMCB).............................47
3 Municipal Survey ..................................................................................................................48 3.1 Introduction..................................................................................................................48 3.2 Survey Summary Matrix..............................................................................................49
3.2.1 Residential MSW and Curbside Recyclable Material Collection Systems .....49 3.2.2 Residential Hauler Licenses.............................................................................50
3.3 Rate Information ..........................................................................................................51 3.3.1 Comparisons ....................................................................................................52 3.3.2 Variations in Selected Organized Cities Rates and Service Levels.................56 3.3.3 Potential Subsidies ...........................................................................................61 3.3.4 County Service Fees ........................................................................................62
3.4 Comments from Municipal Survey..............................................................................63 3.5 Management.................................................................................................................64
3.5.1 Analysis of Recycling Program Performance Data using Re-TRAC ..............64 3.5.2 Reporting Data .................................................................................................66 3.5.3 Collection Arrangement and End Facilities.....................................................69 3.5.4 Rebate/Revenue Sharing from the Sale of Recyclable Materials ....................69 3.5.5 Frequency of Curbside Recyclable Material Collection..................................70 3.5.6 Recyclable Material Curbside Collection Program .........................................71
4 In-depth Analysis...................................................................................................................72 4.1 City Solid Waste System History and Descriptions ....................................................72
4.1.1 Open System Cities..........................................................................................72 4.1.2 Organized System Cities..................................................................................73
4.2 Collection Systems.......................................................................................................74 4.2.1 Open System Cities..........................................................................................75 4.2.2 Organized System Cities..................................................................................76
4.3 Accounts and Scope of Service....................................................................................76 4.3.1 Open System Cities..........................................................................................76 4.3.2 Organized System Cites...................................................................................81
4.4 Structure of Institutional Arrangements.......................................................................84 4.4.1 Open System Cities..........................................................................................84 4.4.2 Organized System Cities..................................................................................86
4.5 Rate Information ..........................................................................................................88 4.5.1 Open System Cities..........................................................................................91 4.5.2 Organized System Cities..................................................................................94
4.6 End Facilities/Delivery Locations................................................................................98 4.6.1 Open System Cities........................................................................................100 4.6.2 Organized System Cities................................................................................100
4.7 Waste Assurance........................................................................................................101 4.8 Attempts to Organize .................................................................................................102

X:\MS\IE\2008\08M081\10000 reports\R - Analysis of Waste Collection Service Arrangements.doc iii
4.9 Green House Gas .......................................................................................................105 4.9.1 Background....................................................................................................106 4.9.2 Establishing the Field Trial Data ...................................................................107 4.9.3 Field Observations .........................................................................................110 4.9.4 MSW Collection Fuel Use .............................................................................112 4.9.5 Recycling Collection Fuel Use ......................................................................129 4.9.6 Total Greenhouse Gas Emission for Five Open Cities ..................................143 4.9.7 Tool for Estimating Potential GHG Savings .................................................147
Tables
Table 2-1 Advantages/Disadvantages of Open Collection Systems ..................................4 Table 2-2 Advantages/Disadvantages of Organized Collection Systems ..........................6 Table 2-3 Collection Arrangements from 2008 SERA Survey..........................................9 Table 2-4A Transfer Haul Cost Model ...............................................................................38 Table 2-4B Transfer Haul Cost Model ...............................................................................38 Table 3-1 City Collection Systems...................................................................................49 Table 3-2 MSW and Recyclable Material Hauler Licenses .............................................50 Table 3-3 Residential Monthly Garbage Rates from Various Haulers in St. Paul (does
not include recycling cost which is paid separately) .......................................53 Table 3-4 Range of Residential Monthly Rates from Same Hauler in Same Open City .54 Table 3-5 Range of Monthly Rates Paid to a Hauler by Residents (open) & Cities
(organized) .......................................................................................................55 Table 3-6 Average Monthly Service Rates Charged to Residents ...................................55 Table 3-7 Average Monthly Service Rates Credited to Haulers ......................................56 Table 3-8 Direct Subsidies ...............................................................................................61 Table 3-9 County Solid Waste Service Fee......................................................................63 Table 3-10 Tonnage Reporting Frequency.........................................................................67 Table 3-11 Annual MSW Tonnages...................................................................................68 Table 3-12 Annual Recycling Tonnages ............................................................................68 Table 3-13 End Facilities ...................................................................................................69 Table 3-14 Recycling Rebates and Revenue Sharing ........................................................70 Table 3-15 Frequency of Curbside Collection ...................................................................70 Table 3-16 Curbside Collection Program...........................................................................71 Table 4-1 Type of System and Hauler(s) Providing Service............................................74 Table 4-2A Open Cities – Households Served and Service Levels ....................................77 Table 4-2B Organized Cities – Households Served and Service Levels ............................82 Table 4-3 Average Monthly Service Rates Charged to Residents ...................................89 Table 4-4 Average Monthly Service Rates Paid to Haulers.............................................90 Table 4-5 Residential Monthly Garbage Rates from Various Haulers in St. Paul (does
not include recycling cost which is paid separately) .......................................94 Table 4-6 Delivery Locations and Tonnages ...................................................................99 Table 4-7 Field Trial Fuel Consumption Data ...............................................................108 Table 4-8 Field Observations - Average Observed Distances between Serviced
Households versus Average Actual Distance between Households ..............111 Table 4-9 Field Observation Data – City of Eagan ........................................................113

iv X:\MS\IE\2008\08M081\10000 reports\R - Analysis of Waste Collection Service Arrangements.doc
Table 4-10 Eagan Fuel Use Based on Estimated Market Shares .....................................115 Table 4-11 Field Observation Data – City of Duluth.......................................................117 Table 4-12 Duluth Fuel Use Based on Estimated Market Shares ....................................118 Table 4-13 Field Observation – City of Rochester...........................................................120 Table 4-14 Rochester Fuel Use Based on Estimated Market Shares ...............................122 Table 4-15 Field Observation – City of Woodbury .........................................................124 Table 4-16 Woodbury Fuel Use Based on Estimated Market Shares ..............................125 Table 4-17 Field Observation – City of St. Paul ..............................................................126 Table 4-18 St. Paul Fuel Use Based on Estimated Market Shares...................................128 Table 4-19 Eagan Fuel Use for Recycling Based on Every Other Week Collection – 15
Second Stop ...................................................................................................130 Table 4-20 Eagan Fuel Use for Recycling Based on Every Other Week Collection – 30
Second Stop ...................................................................................................130 Table 4-21 Duluth Fuel Use for Recycling Based on Understanding of Existing Systems132 Table 4-22 Duluth Fuel Use for Recycling Based on Understanding of Existing System133 Table 4-23 Rochester Fuel Use for Recycling Based on Weekly Collection – 15 Second
Stop ................................................................................................................135 Table 4-24 Rochester Fuel Use for Recycling Based on Every Week Collection – 15
Second Stop Automated and 30 for Bins.......................................................136 Table 4-25 Woodbury Fuel Use for Recycling Based on 15 Second Stops.....................138 Table 4-26 Woodbury Fuel Use for Recycling Based on Every Other Week Collection –
Vary Time of Stops........................................................................................140 Table 4-27 St. Paul Fuel Use for Recycling Based on Weekly Collection – 30 Second
Time of Stop ..................................................................................................142 Table 4-29 Fuel Usage and Greenhouse Gas Projections for Recycling in Five In-depth
Open Cities.....................................................................................................145 Table 4-30 Fuel Usage and Greenhouse Gas Projections for Both MSW and Recycling in
Five In-depth Open Cities..............................................................................146
Exhibits & Figures Exhibit 2-1 Falcon Heights Residents Do Pay More!.........................................................31 Exhibit 2-2 Financial Issues Related to Public Collection..................................................32 Exhibit 2-3 2007/2008 Survey of Monthly Rates for Residential Waste Collection
Services in Goodhue County ...........................................................................36 Exhibit 2-4 Comparison of Trash and Other Vehicle Impacts............................................39 Figure 3-1 Re-TRAC Data by Collection System Type (2007) ........................................65 Figure 4-1 Field Trial Fuel Consumption........................................................................109 Figure 4-2 Fuel Economy Versus Distance .....................................................................110 Figure 4-3 Field Observations - Average Observed Distances between Serviced
Households versus Average Actual Distance between Households ..............112 Figure 4-4 Fuel Consumption – City of Eagan................................................................113 Figure 4-5 Fuel Consumption – City of Duluth...............................................................116 Figure 4-6 Fuel Consumption – City of Rochester..........................................................120 Figure 4-7 Fuel Consumption – City of Woodbury.........................................................123

X:\MS\IE\2008\08M081\10000 reports\R - Analysis of Waste Collection Service Arrangements.doc v
Appendices
Appendix A Surveys – Municipal, In-depth and Billing Appendix B Survey Matrix Summaries – Municipal and In-depth Appendix C Lists of Haulers Appendix D Survey Matrix Summary – Billing Appendix E Participant Comments – Municipal, In-depth and Billing Appendix F 2007 Re-TRAC Recycling Data Appendix G St. Paul Documents – History of Organized Collection Discussions Appendix H GHG Estimation Tool Appendix I Public Comments

X:\MS\IE\2008\08M081\10000 reports\R - Analysis of Waste Collection Service Arrangements.doc vii
List of Abbreviations, Acronyms, and Symbols
AASHTO AMC ASL CIP CO CO CO2 CPI EEC EPA ESAL Foth GHG HERC HFIP HHW IDNR IPCC ISWM LCWM LGU LMC MICA MnDOT MPCA MRF MRI MSW MWPC NSWMA RDF RFP RRT SCORE SERA SSO SWAA SWMCB VHG WLSSD WRRB WTE
American Association of State Highway and Transportation Officials Association of Minnesota Counties Automated Side Loader Capital Improvement Plan Colorado Carbon Monoxide Carbon Dioxide Consumer Price Index Environmental Education Commission Environmental Protection Agency Equivalent Single Axle Load Foth Infrastructure & Environment, LLC Greenhouse Gas Hennepin Energy Recovery Center Hauler Financial Incentive Program Household Hazardous Waste Iowa Department of Natural Resources Intergovernmental Panel on Climate Change Integrated Solid Waste Management Legislative Commission on Waste Management Local Government Unit League of Minnesota Cities Minnesota Inter-County Association Minnesota Department of Transportation Minnesota Pollution Control Agency Material Recycling Facility Minneapolis Refuse, Inc. Municipal Solid Waste Minnesota Waste Processing Corporation National Solid Waste Management Association Refuse Derived Fuel Request for Proposals Resource Recovery technologies, Inc. Select Committee on Recycling and the Environment Skumatz Economic Research Associates, Inc. Source Separated Organics Solid Waste Administrators Association Solid Waste Management Coordination Board Vadnais Heights Group Western Lake Superior Sanitary District Waste Reduction and Recycling Board Waste to Energy

R - Analysis of Waste Collection Service Arrangements.doc Foth Infrastructure & Environment, LLC • 1 June 2009
1 Introduction 1.1 Purpose The goal of this project is to develop “quantifiable” information comparing open and organized residential Municipal Solid Waste (MSW) and recyclable material collection systems that are currently in-place in cities across Minnesota to see how they may each affect:
♦ Costs; ♦ Impacts on the environment; ♦ Efficiency and effectiveness of solid waste management systems; and the ♦ Outcome of the Minnesota Pollution Control Agency (MPCA) Strategic Plan Objectives
such as renewable energy and reduced Greenhouse Gas (GHG) emissions.
1.2 Scope of Work The work plan for this project included:
♦ Conducting a literature review and analysis of past and current efforts to establish organized residential collection systems within Minnesota municipalities and counties.
Comparing the advantages and disadvantages of both open and organized residential
collection systems;
Providing a snapshot of the current percentage of cities with open residential collection systems verses organized residential collection systems; and
Providing a discussion of the current Minnesota Organized Collection statue and
collection authority and the experiences of Minnesota cities conforming to this statue.
♦ Conducting a survey of 50 Minnesota cities, which have a population of 10,000 or greater, which represents both open and organized residential collection systems and provides a sample of the variations of these systems.
Gathering information on services provided, management techniques and comments
for improving existing services; and
Conducting a separate survey that focused on gathering copies of hauler bills from Minnesota residents to compare residential rates charged by different haulers in different cities for varying levels of services.
♦ Preparing a comparison and in-depth analysis of the cost and performance of residential
waste and recyclable material collection systems of ten selected cities in Minnesota.
Gathering information on existing haulers operating in open collection system cities and reviewing contracts from organized system cities;

2 •Foth Infrastructure & Environment, LLC R - Analysis of Waste Collection Service Arrangements.doc June 2009
Gathering information on rates, management techniques and improvements to existing services; and
Preparing a comparison of GHG emission variations in organized collections systems
versus open collection systems.
♦ Preparing a set of overall conclusions regarding data and the analysis outlined above regarding:
Costs and prices of open and organized residential waste and recyclable material
collection systems;
Opportunities for reducing environmental impacts of collection and transportation of waste and recyclables;
Opportunities to reduce the impacts to and costs related to public infrastructure; and
Potential for achieving higher levels of energy efficiency and GHG reduction.
The report provides data for informational purposes and does not make recommendations or address potential policy options.
R - Analysis of Waste Collection Service Arrangements.doc Foth Infrastructure & Environment, LLC • 3 June 2009
2 Literature Review This section provides a summary of pertinent literature regarding residential waste and recyclable materials collection arrangements, and past and current efforts to establish organized collection arrangements within Minnesota municipalities and counties. The section includes:
♦ A summary of the primary issues related to municipal waste and recyclable material collection services in open collection and organized collection systems for residential generators including the commonly identified advantages and disadvantages of each system.
♦ Information from areas outside of Minnesota related to open collection and organized
collection systems such as the occurrence of each and efforts to organize in other communities.
♦ Experience of Minnesota cities with the Organized Collection statutes.
♦ Literature research information available on issues such as cost and pricing of services,
volume based pricing and waste generation, associated performance and results of open collection and organized collection arrangements, transportation costs, research or information regarding infrastructure costs to roads and bridges, externalities such as air pollution, accidents and safety.
♦ A summary of position of various interest groups such as National Solid Wastes
Management Association (NSWMA), representatives from Minnesota Counties, the League of Minnesota Cities, and other professional organizations
2.1 Commonly Identified Advantages/Disadvantages of Types of
Collection Systems There are several characteristics of open and organized collection systems that have been routinely identified in different communities as potential advantages or disadvantages for each. The advantages are sometimes referred to as potential benefits and the disadvantages as potential issues/concerns. These are highlighted in the next subsection with some covered in more detail in the following subsections. Generally, the proponents of organized collection include cities, counties, and state solid waste management officials. Proponents of open collection systems are primarily private waste management companies including both the larger, national companies as well as local, independent haulers. Proponents of open systems also include residents desiring to retain the ability to choose their waste hauler.
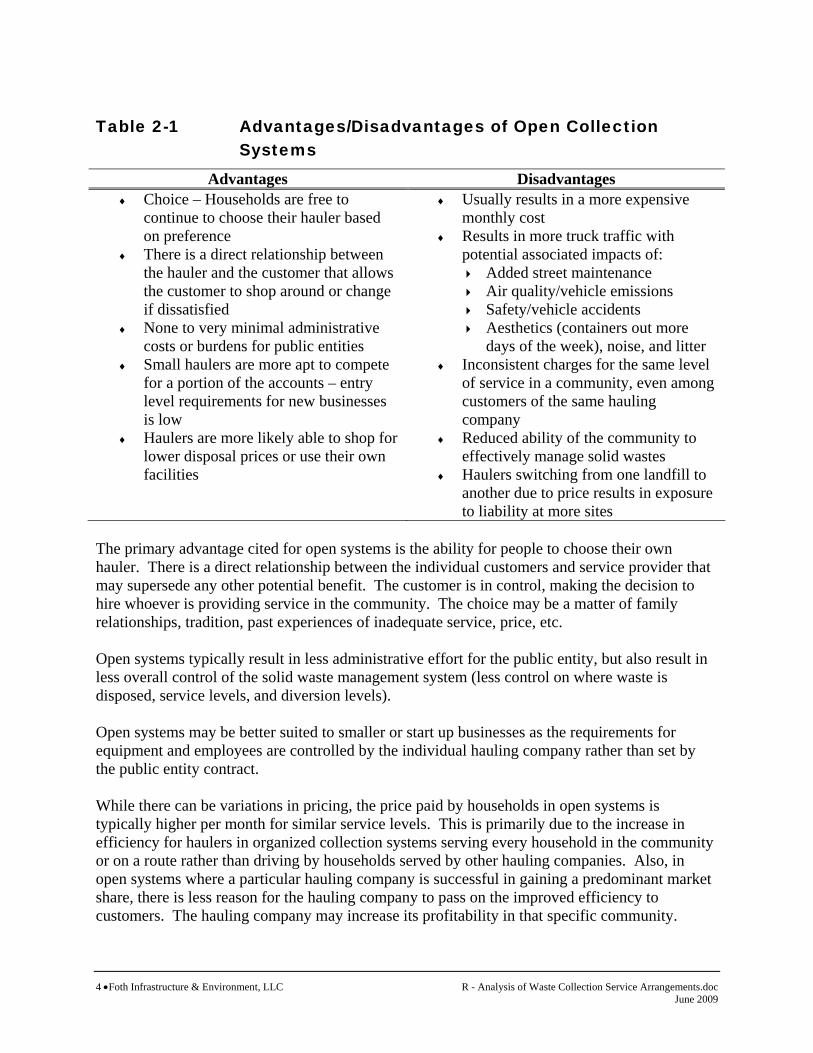
2.1.1 Open Systems A comparison of the advantages (potential benefits) and disadvantages of open collection systems is shown in Table 2-1.
4 •Foth Infrastructure & Environment, LLC R - Analysis of Waste Collection Service Arrangements.doc June 2009
Table 2-1 Advantages/Disadvantages of Open Collection Systems
Advantages Disadvantages ♦ Choice – Households are free to
continue to choose their hauler based on preference
♦ There is a direct relationship between the hauler and the customer that allows the customer to shop around or change if dissatisfied
♦ None to very minimal administrative costs or burdens for public entities
♦ Small haulers are more apt to compete for a portion of the accounts – entry level requirements for new businesses is low
♦ Haulers are more likely able to shop for lower disposal prices or use their own facilities
♦ Usually results in a more expensive monthly cost
♦ Results in more truck traffic with potential associated impacts of:
Added street maintenance Air quality/vehicle emissions Safety/vehicle accidents Aesthetics (containers out more
days of the week), noise, and litter ♦ Inconsistent charges for the same level
of service in a community, even among customers of the same hauling company
♦ Reduced ability of the community to effectively manage solid wastes
♦ Haulers switching from one landfill to another due to price results in exposure to liability at more sites
The primary advantage cited for open systems is the ability for people to choose their own hauler. There is a direct relationship between the individual customers and service provider that may supersede any other potential benefit. The customer is in control, making the decision to hire whoever is providing service in the community. The choice may be a matter of family relationships, tradition, past experiences of inadequate service, price, etc. Open systems typically result in less administrative effort for the public entity, but also result in less overall control of the solid waste management system (less control on where waste is disposed, service levels, and diversion levels). Open systems may be better suited to smaller or start up businesses as the requirements for equipment and employees are controlled by the individual hauling company rather than set by the public entity contract. While there can be variations in pricing, the price paid by households in open systems is typically higher per month for similar service levels. This is primarily due to the increase in efficiency for haulers in organized collection systems serving every household in the community or on a route rather than driving by households served by other hauling companies. Also, in open systems where a particular hauling company is successful in gaining a predominant market share, there is less reason for the hauling company to pass on the improved efficiency to customers. The hauling company may increase its profitability in that specific community.

R - Analysis of Waste Collection Service Arrangements.doc Foth Infrastructure & Environment, LLC • 5 June 2009
Open systems result in more truck traffic on the residential streets as each company uses their collection vehicles to service customers. The increased truck traffic leads to increased concerns regarding the impact on streets and the potential for increased truck emissions, traffic accidents, and aesthetic issues. Open systems are more likely to allow haulers to find the lowest cost disposal option (including transportation costs), but this also results in exposure to liability at more than one location. Open systems also are more likely to allow certain waste hauling companies to internalize wastes to their own transfer stations and/or landfills. This improves their competitive advantage for hauling customers versus haulers who do not have their own transfer or disposal facilities.
2.1.2 Organized Systems A comparison of the advantages (potential benefits) and disadvantages of organized collection systems is shown in Table 2-2.

6 •Foth Infrastructure & Environment, LLC R - Analysis of Waste Collection Service Arrangements.doc June 2009
Table 2-2 Advantages/Disadvantages of Organized Collection Systems
Advantages Disadvantages ♦ Increased efficiency enabling a lower
cost per household ♦ Households do not have a choice of
their hauler ♦ Decreased impacts from truck traffic ♦ Decreased fuel consumption
♦ Greater administrative involvement by the public entity
♦ Greater control to establish service requirements including:
Ability to standardize service makes public education simpler
Ability to provide access to special service needs at known, controlled costs
Volume-based pricing to achieve waste abatement goals
Delivery destinations for processing and overall solid waste management
Factors affecting recycling and diversion such as variable rate pricing
Improved control over residents actually using garbage service
Ability to set specifications on the size and quality of trucks used
♦ Small haulers have higher “entry” requirements to get in the business along with competitive opportunities limited to contract openings
♦ Current organized collection statutory process to convert from open to organized is cumbersome and difficult politically
♦ Ability to competitively bid service on a regular basis helping promote lower costs
♦ Can be used to generate revenues to support other services
The primary potential advantages of organized collection are three-fold – lower prices, reduced truck traffic, and community control over decisions related to waste management. There are several factors involved in each of these three primary advantages. Greater efficiency, competitive bidding, rate increases structured into contracts, and variable rate pricing options can all result in more cost effective service provision. Fewer trucks stopping at every house results in less truck traffic at slower speeds. Public entities have responsibility and potential liability for proper solid waste management and organized collection provides better tools and control of decisions that affect solid waste management. The primary disadvantage is the loss of individual household control over the selection of a hauler and the associated direct relationship. Along with increased control for the public entity comes the requirement to provide the resources necessary to properly manage the decisions.

R - Analysis of Waste Collection Service Arrangements.doc Foth Infrastructure & Environment, LLC • 7 June 2009
Also, it may be more difficult for smaller haulers and entry level companies to break into and grow their business in organized collection systems. 2.2 Occurrence of Each Type of Collection System Studies have been conducted to try and determine the prevalence of open collection systems and organized collection systems both locally and nationally. The following subsections present the findings from studies completed locally (in Minnesota), in Iowa, Colorado and one study completed across the United States and Canada. The findings show that there are variations in the prevalence of types of collection systems.
2.2.1 Minnesota
2.2.1.1 Eden Prairie In 2005, the city of Eden Prairie compiled a report titled “Report on Residential Municipal Solid Waste Collection.”1 The report surveyed 108 cities in the Twin Cities metropolitan area and provided a breakdown of their garbage and recycling collection systems according to open and organized collection. The report noted that the most common system in these 108 communities is an open system (77 of the 108 cities had open collection systems, 71.3% of the communities). There were 29 cities with a contract for garbage collection and two (2) cities that collect municipally. Of the 77 cities that had open garbage collection in this 2005 study, 22 cities have contracts for recycling collection. This leads to a percentage organized for recycling of 49.1%. 2.2.1.2 Twin Cities Metropolitan Area A separate report titled “Comparative Economic Analysis of MSW and Recycling Collection in the Twin Cities Metropolitan Area” completed in September, 19942 shows in Table II-3 that based on survey responses, there were 155 municipalities with open systems for MSW collection and 42 municipalities with organized collection of which three (3) were municipal collection. The percentages in this report indicated 78.7% open; 19.8% organized by contract; and 1.5% municipal collection arrangements at that time. In the surveys completed as part of the Twin Cities Metropolitan Area study, there were a total of 58 cities with a breakdown of their systems reported. All the cities were over 10,000 in population in this study. Of the 58 cities that completed the survey, 37 were open for garbage collection. This represents 64% as open systems for garbage collection. Of these 37 cities with open garbage collection, 12 cities are organized for recycling collection or 21% of the total 58 cities. There were 21 cities with both garbage and recycling handled in organized systems. The total percentage of cities organized for recycling was 57%. Based on these studies, it appears that the breakdown of percentage of cities in Minnesota organized versus open may range as follows: 1 Barone, Michael. Dec. 2005. “Report on Residential Municipal Solid Waste Collection.” City of Eden Prairie, MN. 2 “Comparative Economic Analysis of MSW and Recycling Collection in the Twin Cities Metropolitan Area.” Sept. 1994. GBB Solid Waste Mgmnt. Consultants. Falls Church, VA.

8 •Foth Infrastructure & Environment, LLC R - Analysis of Waste Collection Service Arrangements.doc June 2009
♦ Garbage collection
Open systems range from approximately 65% to 80% Organized systems range from approximately 20% to 35%
♦ Recycling collection
Open systems range from approximately 40% to 50% Organized systems range from approximately 50% to 60%
2.2.2 Nationally
2.2.2.1 United States and Canada In March, 2008, Skumatz Economic Research Associates, Inc. (SERA) published a report titled “Summary of Key Results from SERA’s 2008 Solid Waste and Recycling Survey.”3 The summary report is based upon the results received from over 700 cities and counties across the U.S. and Canada. One of the aspects included in the summary report pertains to “Collection Arrangements.” SERA asked about collection arrangements (who collects?) for garbage, recycling, and yard wastes. Pertinent data for the garbage and recycling aspects from the report are summarized in Table 2-3.
3 “Summary of Key Results from SERA’s 2008 Solid Waste and Recycling Survey. Mar. 2008. Skumatz Economic Research Assoc., Inc. Superior, CO.

R - Analysis of Waste Collection Service Arrangements.doc Foth Infrastructure & Environment, LLC • 9 June 2009
Table 2-3 Collection Arrangements from 2008 SERA Survey
Who Collects?
No program
Drop off
only Municipal
One hauler
contract
Multiple hauler
contracts
One hauler
franchise
Multiple hauler
franchise
One licensed hauler
Multiple licensed hauler
One private hauler
Multiple haulers
w/private competition
Garbage
2.1% 1.9% 28.6% 19.8% 6.1% 9.6% 4.6% 1.5% 8.2% 1.9% 15.0%
Recycling 13.6% 7.6% 21.5% 25.0% 4.9% 8.5% 3.8% 1.7% 4.7% 1.4% 6.9%

10 •Foth Infrastructure & Environment, LLC R - Analysis of Waste Collection Service Arrangements.doc June 2009
For garbage, the first two (2) categories for “No program” and “Drop off only” are not applicable for this report. The categories across the table from “Municipal” through “One private hauler” would be categorized as organized in Minnesota terminology except for “Multiple licensed hauler” which would be open. This equates to a total of 72.1% of the over 700 cities and counties classified as organized. The “Multiple licensed hauler” and “Multiple haulers w/private competition” would be classified as open and these total 23.2% of the over 700 cities and counties responding. For recycling, the same approach to a breakdown leads to a total of 66.8% organized cities and counties and a total of 11.6% open (there were a total of 21.2% of the respondents with no recycling or a drop off system only). 2.2.2.2 Fort Collins, Colorado In July, 2008, the R3 Consulting Group, Inc. presented a study titled “Trash Services Study Final Report to the City of Fort Collins, CO.”4 Section 4 of the report included a review of collection system structures. The report provided data on a survey conducted on 271 municipal jurisdictions in Colorado. Of the 222 respondents, 47 (21%) provide municipal collection, 44 (20%) contract for service, and 131 (59%) use private haulers in an open system. This study also reported that a 1997 survey of residential collection in the 100 largest cities in the U.S. found that exclusive municipal service was provided in 62% of the cities. An exclusive private contractor was used in 18% for a total of 80% organized via either municipal or contract collection. Only 6% of the cities had open systems with 15% having some combination of the systems. 2.2.2.3 Portland, Oregon The city of Portland, Oregon changed from an open solid waste and open recycling system to an organized “franchise” system in 1990/1991. The City’s curbside recycling program was initiated in June 1987 but was not attaining City, Metro and State goals for participation and recovery rates. After thorough research and planning, the City determined that other curbside recycling programs in the U.S. have achieved substantially higher public participation rates and materials recovery levels by providing weekly recycling collection, household recycling containers, economic incentives to recycle in the garbage rate structure, and organized collection within neighborhoods. The City determined that the most efficient and cost effective method of making systematic improvements was to “franchise” residential garbage, recycling and yard debris collection; and establish standards for commercial garbage and recycling collection. The City Council then adopted on September 19, 1990 a new ordinance (No. 163497) that locked in each hauler’s number of residential accounts (i.e., collection market size) as of September 30, 1990 as certified by City examination and subsequent audits.
4 “Trash Services Study Final Report.” July 2008. R3 Consulting Group, Inc. Fort Collins, CO.

R - Analysis of Waste Collection Service Arrangements.doc Foth Infrastructure & Environment, LLC • 11 June 2009
The City then subdivided the City into a series of “corrals” to contain the routes of several haulers. The corral was sized to accommodate the total value of each hauler assigned to it. The City’s goals directing the development of the route assignment process included:
♦ “Where possible, provide each permitted hauler an opportunity to serve a franchised territory without seriously jeopardizing the viability of that business.
♦ “Organize the service area of each hauler into contiguous collection routes to make
service delivery more cost effective and more understandable for the public, conserve energy, and reduce road wear.
♦ “Preserve as many existing hauler – customer relationships as possible. (City staff) will
make every effort to place haulers who have condensed routes, or who operate in one region now, to that area.
♦ “Allow haulers maximum involvement in the route assignment process. Though (City
staff) will oversee route assignment, haulers will have an opportunity to recommend consolidation boundaries within their established areas.” 5
The City began full implementation of the franchised residential garbage and recycling program in February, 1992. The goal of this program was to increase residential recycling by providing increased and convenient opportunities for recycling.” New program elements included: organized collection of garbage and recycling via the new franchise system; weekly collection of recyclable material on the same day as garbage collection; provision of two recycling containers; addition of milk jugs, scrap paper and magazines to the list of recyclable materials; and bi-weekly yard debris collection. 6 2.2.2.4 Des Moines, Iowa In a neighboring state to Minnesota, the Iowa Department of Natural Resources (IDNR) queried their Comprehensive Planning database and reported that of 861 cities in Iowa, 726 (84%) have organized (municipal or contract) collection and 135 (16%) have an open collection system.7 In the Des Moines metropolitan area, Metro Waste Authority handles the comprehensive planning for solid waste. They report that for garbage collection of the 22 municipalities in their area, 19 or 86% are organized – two with municipal crews and the rest with a single contracted hauler. For curbside recycling collection, all the municipalities are organized with all but one served under a single contract managed by Metro Waste Authority. The city of Des Moines does its own recycling collection with municipal crews.
5 City of Portland, Oregon (December 19, 1990); “Assignment of Route Values and Service Territories for the Franchising of Residential Solid Waste Collectors and Recyclers”. 6 City of Portland, Oregon (January 1994) “Management Report for Solid Waste & Recycling” 7 Personal e-mail from Becky Jolly, Iowa DNR. Dec. 2008.
12 •Foth Infrastructure & Environment, LLC R - Analysis of Waste Collection Service Arrangements.doc June 2009
Based on the above data and general industry experience, it appears that nationally, some form of organized collection is generally more common than open systems. However, there are locations such as Minnesota where open systems are more common. 2.3 Minnesota Organized Collection Statutes and Collection
Authority
2.3.1 Highlights of Current Statute Minnesota Statute Section 115A.94, Organized Collection, sets forth the process by which a county, city or town may organize collection. The following is a summary prepared for the Ramsey/Washington Counties Study of Public Collection.8 County Organized Collection
♦ A county may adopt an ordinance requiring a city or town within the county to organize collection.
♦ A county may itself organize collection in any city or town that does not comply with the
county’s organized collection ordinance. The process used by a county in these cases is the same process that cities must use, outlined below.
City/Town Organized Collection
♦ Notice of Hearing. A city/town (municipality) must give notice to the public and must mail notice to all solid waste collectors operating in the municipality of the intent to organize collection. The notice must be given two weeks before the scheduled public hearing and must invite interested persons to participate in planning and establishing the organized collection system.
♦ Public Hearing. The municipality must hold a public hearing to consider organized
collection. If the municipality chooses to proceed, the governing body must adopt a resolution of intent. It must be passed 180 days before an organized collection system is implemented.
♦ 90-Day Planning Period. After adoption of the resolution of intent, the municipality must
develop, or supervise the development of, plans for organized collection. The planning process must invite the assistance of solid waste collectors in the municipality.
♦ 90-Day Negotiation Period. After the planning period, the municipality must discuss the
organized collection arrangements with all licensed solid waste collectors who have expressed interest in participating in organized collection. If the municipality is not able to agree on a system with a majority of collectors who have expressed interest, or upon expiration of the 90-day period, the municipality can propose an alternate method of organizing.
8 “Final Report: Study on Public Collection.” Apr. 2002. Ramsey & Washington Counties. St. Paul, MN.

R - Analysis of Waste Collection Service Arrangements.doc Foth Infrastructure & Environment, LLC • 13 June 2009
♦ Findings. To document its decision, the municipality must make findings that describe and detail the procedures to plan and attempt implementation of organized collection, and evaluate the proposed organized collection method in light of the following standards:
Achieving the stated organized collection goals of the municipality, Minimizing displacement of collectors, Ensuring participation of all interested parties in the decision making process, and Maximizing efficiency in solid waste collection.
No one factor is determinative and other local considerations may be relevant.
♦ Implementation. After all these steps are taken, and after at least 180 days from the adoption of the resolution of intent, the municipality can proceed to implement its organized collection plan.
The Ramsey/Washington Counties Public Collection Study prepared an estimated cumulative timeline to go through the process and estimated that an optimistic total time required would be 26 months, using the minimum time periods specified in law and their county administrative procedures.
2.3.2 Establishment and Evolution of the Statute The Organized Collection statute was initially adopted by the Minnesota Legislature in 1987. Prior to that, municipalities had organized collection under other authority provided by statutes providing municipal authority or home rule charter. In research conducted by Norm Schiferl, Ramsey County Program Analyst9 in 2001 during Ramsey/Washington Counties Public Collection Study, in 1985 there were 30 municipalities with organized or municipally-provided collection in the Metropolitan Area. In 1993, the number was reported to have increased to 44. Between 1993 and 2000, the number remained stable at 44 and has not increased substantially since. The Organized Collection statute was changed in 1990 and the next few years to add the requirements for the 90 day planning period, the 90 day negotiation period, and the consideration of the findings requirements. As a result, the Organized Collection statute became a more difficult process to navigate for municipal officials. Following is a summary of changes to the original statute, particularly addressing the potential impact on waste haulers. The 1989 Minnesota Legislature directed the Legislative Commission on Waste Management (LCWM) to study the issue of whether and to what extent solid waste haulers should be compensated when displaced by organized collection. LCWM was comprised of Legislators from both the House and the Senate and established by the Waste Management Act of 1980 (Laws 1980, C 564) to oversee waste-related funds and activities of state agencies, and to conduct research and make recommendations to the Legislature. The 1989 Legislative initiative (1989 Laws, Ch 325, Sec. 73.) authorizing this study, stated:
“The legislative commission on waste management with the participation of representatives of local government and the solid waste collection industry shall prepare
9 “Cities/Townships in Twin Cities Metro Area With Organized or Municipally-Provided Residential MSW Collection, 1985-2000.” Oct. 2001. Provided by Norm Schiferl, Ramsey County.
14 •Foth Infrastructure & Environment, LLC R - Analysis of Waste Collection Service Arrangements.doc June 2009
a report which examines whether and what circumstances a local unit of government shall ensure just and reasonable compensation to solid waste collectors who are displaced when a local unit of government organizes solid waste collection under Minnesota Statutes, section 115A.94. The commission shall complete its report and recommend for legislative action any compensation mechanism found necessary by January 31, 1990.”
After the 1989 legislative session, LCWM contracted with a consultant team to conduct the legal and policy research and complete the report entitled A Study of Compensation for Solid Waste Haulers Displaced by Organized Collection (December 21, 1989).10 The project became known as the “Just Compensation Study”. The Executive Summary states:
“Organized collection is a tool for cities to achieve specific public purposes. Currently, approximately five hundred independent haulers operate in the state of Minnesota. In most areas, the haulers solicit business and service customers without restriction from local government, except for licensing requirements. As a result, many haulers may serve the same neighborhood. The public interests in organizing collection include: increased safety (fewer trucks result in fewer accidents), reduced noise and air pollution, less wear and tear on streets, increased efficiency and lower costs, and finally, improved potential for recycling.” “While achieving these goals through organized collection, the city may cause haulers to lose part or all of their business in the city, depending on the organized collection mechanism chosen by the city. The issue underlying this study is whether the city should be required to compensate the haulers for the loss of business.”
The Study work plan was divided into three parts. Part One:
♦ Examined the existing case law and statutes governing the issue of compensation; [Note: The Study stated “The legal analysis concluded that compensation is not
constitutionally required for displaced haulers nor does this type of regulation constitute an unconstitutional impairment of contract.”
♦ Summarized statutory methods of compensation adopted in other states; ♦ Discussed possible methods of compensation; and ♦ Discussed procedural safeguards as alternatives to compensation.
Part Two of the Study:11
♦ Examined policy issues around whether the legislature should create statutory right to compensation for displaced haulers, even absent a constitutional right;
♦ Conducted a roundtable discussion of the issues held on October 16, 1989; ♦ Conducted a telephone survey of local government and hauler representatives;
10 Richardson, M. I., P. T. Ostrow, R. Reid. (1989) “A Study of Compensation for Solid Waste Haulers Displaced by Organized Collection.” Richardson, Richter and Assoc., Inc. Minneapolis, MN. 11 Ibid.

R - Analysis of Waste Collection Service Arrangements.doc Foth Infrastructure & Environment, LLC • 15 June 2009
♦ Summarized the advantages and disadvantages of providing for compensation; ♦ Discussed possible circumstances under which compensation should be granted; ♦ Examined possible eligibility criteria; ♦ Analyzed four alternative methods for determining the amount of compensation; ♦ Discussed three potential sources of revenue to collect the necessary funds to pay the
compensation; and ♦ Examined alternatives to compensation, including the advantages and disadvantages of
strengthening the existing organized collection planning process. One of the more notable excerpts from the lengthy study analysis in Part Two was an example hypothetical scenario used to estimate the amount of compensation (Section IV – “Who Pays, Sources of Revenue”; Subsection A – “Collection Surcharges”; page 2 – 34):
“To illustrate, assume a city has 30,000 residences that require garbage collection. Prior to organized collection, one hauler collects from 10,000 residences. Four other haulers split the remainder. The city organizes collection pursuant to a bidded contract and awards the bid to the hauler with 10,000 accounts. If the total amount of compensation for the four displaced haulers collecting 20,000 residences is determined by multiplying 20,000 times the average gross monthly charge per household (est. $16.00 household) times 12 months, the total compensation amount would equal $3,840,000…..”
Part Three of the Study contained the report recommendations. The report recommended:12
1. “It is recommended that a statutory right to compensation for displaced haulers not be adopted.”
2. “It is recommended that the current organized collection process be modified to
require contract negotiations with existing haulers.”
The recommendation to not provide a statutory right to compensation was based upon several reasons including:
♦ Dangerous precedent – This would be the first statutory right to compensation for a taking in Minnesota.
♦ Compensation as undesired and inappropriate remedy – Many haulers stated their
primary interest is continuing in business and their concerns were that fair negotiations take place with cities and that they be given an equal opportunity to compete. Other, less onerous remedies were determined to be available.
♦ Problems with implementation – Placing a value on a right to operate in a given city was
extremely difficult. Any compensation mechanism will unjustly enrich some while inadequately compensating others.
12 Ibid.

16 •Foth Infrastructure & Environment, LLC R - Analysis of Waste Collection Service Arrangements.doc June 2009
♦ Impediment to attainment of waste management goals – It was believed that the cost of compensation could cause cities to reduce financial support for recycling and other issues related to proper waste management.
The recommendation to modify the organized collection process to require contract negotiations with existing haulers was directed toward providing a fair opportunity for existing haulers to remain in business by providing the following safeguards in the Organized Collection statute:
♦ Require that the city invite and employ the assistance of haulers in developing an organized collection proposal.
♦ Require the city to analyze all the organized collection options, including the effect on
haulers and whether the city could achieve its goals by the less restrictive mechanisms (i.e., negotiating with haulers rather than using municipal collection).
♦ Require good faith contract negotiations with existing haulers, specifying a period of time
in which to negotiate and prohibit selection of another organized collection option unless the parties fail to reach agreement.
♦ If parties fail to reach agreement, the statute should require the city to make certain
findings of fact regarding minimizing displacement, ensuring the input of all parties, maximizing efficiency, guaranteeing fair selection process and achieving city goals such as recycling and public safety.
In the 1990 legislative session, the package of amendments to the Waste Management Act of 1990 (Laws of Minnesota 1990, Chapter 600)13 included the following sections:
Section 1. Minnesota Statutes 1988, section 115A.94, subdivision 3, is amended to read: Subd. 3. [GENERAL PROVISIONS.]
………… (c) The local government unit may shall invite and employ the assistance of
interested persons, including persons operating licensed to operate solid waste collection services in the local government unit, in developing plans and proposals for organized collection and in establishing the organized collection system.
Sec. 2. Minnesota Statutes 1988, section 115A.94, subdivision 4, is amended to read: Subd. 4. [CITIES AND TOWNS; NOTICE; PLANNING.]
(a) At least 90 180 days before proposing implementing an ordinance, franchise, license, contract or other means of organizing collection, a city or town, by resolution of the governing body, shall announce its intent to organize collection and invite the participation of interested persons, including persons licensed to operate solid waste collection services, in planning and establishing the organized collection system. …….
(c) During the a 90-day period following the resolution of intent, and before proposing a method of organizing collection, the city or town may shall develop or
13 Minnesota Statutes 115A.94 Organized Collection, Office of Revised Statutes. State of Minnesota.

R - Analysis of Waste Collection Service Arrangements.doc Foth Infrastructure & Environment, LLC • 17 June 2009
supervise the development of plans or proposals for organized collection. During this 90-day planning period, the city or town shall invite and employ the assistance of persons licensed as of the date of the resolution of intent to operate solid waste collection services in the city or town. Failure of a licensed collector to participate in the 90-day planning period, when the city or town has made a bona fide effort to provide the person the opportunity to participate, does not invalidate the planning process.
(d) For 90 days after the date ending the planning period required under paragraph (c), the city or town shall discuss possible organized collection arrangements with all licensed collectors operating in the city or town who have expressed interest. If the city or town is unable to agree on an organized collection arrangement with a majority of the licensed collectors who have expressed interest, or upon expiration of the 90 days, the city or town may propose implementation of an alternate method of organizing collection as authorized in subdivision 3.
(e) The city or town shall make specific findings that: (1) describe in detail the procedures it used to plan and to attempt implementation of organized collection through an arrangement with collectors who expressed interest; and (2) evaluate the proposed organized collection method in light of at least the following standards: achieving the stated organized collection goals of the city or town; minimizing displacement of collectors; ensuring participation of all interested parties in the decision-making process; and maximizing efficiency in solid waste collection.
(d) (f) Upon request, the city or town shall provide mailed notice of subsequent all proceedings on the organization of collection in the city or town.
In the next 1991 legislative session, the package of amendments to the Waste Management Act of 1990 (Minnesota Laws 1991, Chapter 337) included the following sections to further modify the organized collection statute and to require solid waste collection in certain cities:
Sec. 46. Minnesota Statutes 1990, section 115A.94, subdivision 4, is amended to read:
(g) If the city or town and all the persons licensed to operate mixed municipal solid waste collection services and doing business in the city or town agree on the plan, the city or town may implement the plan without regard to the 180-day period specified in paragraph (a).
Sec. 47. [115A.941] [SOLID WASTE; REQUIRED COLLECTION.]
(a) Except as provided in paragraph (b), each city and town with a population of 5,000 or more shall ensure that every residential household and business in the city or town has solid waste collection service. To comply with this section, a city or town may organize collection, provide collection, or require by ordinance that every household and business has a contract for collection services. An ordinance adopted under this section must provide for enforcement.
(b) A city or town with a population of 5,000 or more may exempt a residential household or business in the city or town from the requirement to have solid waste collection service if the household or business ensures that an environmentally sound alternative is used.

18 •Foth Infrastructure & Environment, LLC R - Analysis of Waste Collection Service Arrangements.doc June 2009
(c) To the extent practicable, the costs incurred by a city or town under this section must be incorporated into the collection system or the enforcement mechanisms adopted under this section by the city or town.
The requirements for cities of 5,000 population were subsequently lowered to cities of 1,000 population. 2.4 Experiences of Minnesota Cities and Counties with Organized
Collection Statutes and Process There are several Minnesota cities that have considered organizing collection since the adoption of the Organized Collection statute. There are some similarities among cities (goals/reasons to organize and the process) and haulers (reactions/process) and results when a municipality attempts to organize residential collection services that are pertinent to document in this report. The following subsections discuss city and hauler processes when working through the Organized Collection statute and some local city experiences.
2.4.1 Typical Goals The municipal officials that have sought to organize collection in their communities have typically identified the following potential benefits:
♦ Reducing the amount of truck traffic with anticipated reductions in street repair and maintenance, reducing risk of accidents, reducing truck emissions, and noise.
♦ Reducing the cost per household per month due to improved efficiencies and competitive
bidding for the contract.
♦ Improving and standardizing service levels.
♦ Improving management of MSW according to county solid waste plans and the solid waste management hierarchy. Better overall control of the decisions regarding solid waste and recycling.
Some counties in Minnesota have attempted to organize collection. Ramsey and Washington Counties did an extensive evaluation in 2001 and 2002. The two Counties were not achieving the goals in their Master Plans for solid waste management. The Final Report: Study on Public Collection14 noted the reasons for the study were that the existing system was not moving the Counties toward long-term goals. The report found:
♦ Waste generation is increasing;
14 “Final Report: Study on Public Collection.” Apr. 2002. Ramsey & Washington Counties. St. Paul, MN.

R - Analysis of Waste Collection Service Arrangements.doc Foth Infrastructure & Environment, LLC • 19 June 2009
♦ Recycling is stagnant or decreasing as economic incentives to recycle have diminished;
♦ Resources that could be put to a higher use through recycling are disposed in processing facilities or landfills;
♦ Key decisions are made with a focus on short-term cost or profits;
♦ Illegal dumping of wastes and associated environmental concerns continues in several
areas;
♦ Municipal concerns on truck traffic continue;
♦ Resource recovery costs are subsidized to compete with landfilling costs; and
♦ Resource recovery capacity is not consistently utilized. Other counties such as Olmsted and Stearns have evaluated different organized collection approaches as a means to meet the goals of their Solid Waste Master Plans. Wabasha County completed the organized collection process and has an organized collection ordinance in place. However, Wabasha County has not enforced the provisions of the ordinance due to voluntary agreements signed by the local waste haulers.
2.4.2 Process There are some common characteristics in the processes used from municipality to municipality as the process is fairly prescriptive in the Organized Collection statute. 2.4.2.1 Staff/Committee Considerations Typically, city staff work with a city established committee to review and research the various issues. Often times, surveys of rates (monthly cost per household) are compiled. Potential advantages and disadvantages of open versus organized collection are identified and discussed for relevance to the community. The city of Falcon Heights Final Report on Organized Collection15 had a particularly comprehensive listing of advantages and disadvantages for both open and organized collection as follows: “Potential Advantages of Open Collection
♦ Residents can select the hauler that provides the level of service most compatible with their individual needs and can shop among the price options that are available.
♦ Since Falcon Heights already has an open system, residents would not be inconvenienced
by change.
♦ Administrative cost is minimized for the City. 15 “Organized Collection Study – Final Report.” Oct. 2004. City of Falcon Heights, Minnesota.

20 •Foth Infrastructure & Environment, LLC R - Analysis of Waste Collection Service Arrangements.doc June 2009
♦ Small haulers will face no additional competitive challenges beyond what they face now within the industry.
Potential Disadvantages of Open Collection
♦ Although choice is available, “inertia may be a compelling force” for a resident to stay with the hauler he/she has citing the GBB report.16 Residents must take the time and trouble to shop around for a better rate – which can be temporary and come with strings, long term contracts, and cancellation penalties – or just give in and go along with higher prices or unsatisfactory service.
♦ Under an open system, costs must be spread over smaller and more uncertain customer
base, so fees must be sufficiently high to cover fixed costs. In other words, we pay more. Operational cost savings of adding to the customer base are more likely to go to higher profits than to lowered prices for customers.
♦ It is impossible to determine whether Falcon Heights is in compliance with the Waste
Management Act, which requires all residents in communities over 5,000 people to use solid waste collection services.
♦ Individual residents and the community as a whole will have no leverage to support local
businesses and keep them viable as the industry consolidates.
♦ MSW trucks are heavy and have a demonstrated impact on street longevity. City streets and alleys will continue to be subject to the impact of additional truck traffic.
♦ Another consequence of overlapping routes and more trucks is more air pollution and
more noise.
♦ Residents do not have a choice about where their refuse goes. If they choose a hauler on the basis of where the hauler says the trash goes, there is no assurance that (a) the information is correct and (b) the hauler will not change practices in the future.
♦ Major decisions that affect quality of life in Falcon Heights and the future of our
environment will be driven by corporate priorities, not local interests. Potential Advantages of Organized Collection
♦ Lower consumer prices: Cities which have adopted organized collection have been able to negotiate lower rates for their residents. With a city contract, operational cost efficiencies can come back to residents in lower prices.
♦ Garbage truck wear and tear does make a difference to our streets and roads. We can
make our infrastructure last longer if we can reduce the number of trucks. 16 “Comparative Economic Analysis of MSW and Recycling Collection in the Twin Cities Metropolitan Area.” Sept. 1994. GBB Solid Waste Mgmnt. Consultants. Falls Church, VA.

R - Analysis of Waste Collection Service Arrangements.doc Foth Infrastructure & Environment, LLC • 21 June 2009
♦ Rate increases will be structured and predictable for the duration of the contract.
♦ Residents would have a clear, one-stop menu of services and costs and will not have to
try to compare apples to oranges. Busy residents will save time and energy not having to shop around.
♦ A contract can specify where our refuse goes, whether to a landfill or for fuel processing.
We can ensure this decision serves local interests and local environmental goals, not corporate priorities.
♦ Fewer trucks mean less noise and air pollution in our neighborhoods.
♦ Rates can be better structured to encourage reduction of waste, including the ability to
offer pay-as-you-throw options for residents who produce a very low volume of trash.
♦ With a contract, the City could control the size and quality of trucks used, specifying lower pollution, better loading and weight bearing technology. Dependable City business can assure smaller haulers that a new truck for use in Falcon Heights is a good investment, helping to level the playing field.
♦ A city contract can enforce good service by building a schedule of fines and escrow
account into the contract. A contract can insist on a local phone number for service calls, answered by a local person.
♦ City would have a way of enforcing the Waste Management Act that requires residents of
communities with over 5,000 people to have garbage picked up. There is no way under the present system.
♦ Although it would require a change in the City Code, an organized system could be
structured so that different zones of the City could have their collection on different days, including Monday (which residents have asked for). The schedule could rotate every year or two, to give everyone a chance at that popular Monday collection day.
Potential Disadvantages of Organized Collection
♦ Although customers would have a choice of service levels, they would lose the choice of service provider.
♦ A major public education effort would be required to make everyone aware of the
changes, and the transition would be more difficult for people who are uncomfortable with change.
♦ Some residents may experience an increase in price over the artificially low rates offered
by haulers campaigning against organized collection.

22 •Foth Infrastructure & Environment, LLC R - Analysis of Waste Collection Service Arrangements.doc June 2009
♦ Residents will have to choose their services from the standard set offered. This may not include some services they receive now.
♦ There would be an increased administrative burden associated with getting a new system
set up and running, including developing the RFP, evaluating proposals, developing a contract agreement. The City would also have to monitor and enforce the terms of the contract.
♦ Residents opposed to organized collection have been far more vocal than residents who
support organized collection. Staff and elected officials are likely to experience negative feedback from those individuals. In other cities, this has been temporary.
♦ Decreased business opportunities for haulers.”
2.4.2.2 Hauler Participation The Organized Collection statute includes significant requirements to work with the existing haulers serving the city considering organizing. The haulers are obviously motivated to protect their interests as they participate in the process. They work to dissuade city officials from proceeding often times offering some alternatives that address some of the potential advantages of organized collection or disadvantages of open collection. Hauling companies were extensively engaged in the Ramsey/Washington Counties Public Collection Study. Following are highlights from their input to that evaluation that are pertinent for a statewide study.17
♦ Maintain competition – Small haulers believe they can compete in a number of ways in open systems that allow them to differentiate their service. Competitive measures include:
Providing quality customer service; Niche marketing (providing specific, limited services and not trying to be “all things
to all people”); Maintaining long-term customer relationships; and Appealing to customer preferences for supporting locally-owned independent
businesses.
♦ Growth opportunities – Open systems allow haulers to pursue new customers and grow their business easier than bidding for contracts in organized systems.
♦ Company value – The value of a company is based upon annual revenues. If haulers lose
customers due to a public entity organizing collection, their annual revenues will decline, decreasing the price received when selling. Some haulers use the proceeds from the sale of their company as their retirement fund.
17 “Final Report: Study on Public Collection.” Apr. 2002. Ramsey & Washington Counties. St. Paul, MN.

R - Analysis of Waste Collection Service Arrangements.doc Foth Infrastructure & Environment, LLC • 23 June 2009
♦ Establishment of service zones – If service zones become too large in organized collection, only large companies will be able to compete. Also, if a zone is required to be serviced only on one day, some small haulers will have more customers than they can serve on that day while other days, their trucks could be underutilized.
♦ Procurement process – There was extensive concern from independent haulers not being
able to compete effectively in a competitive bidding process. These haulers acknowledged they can do all stops in a neighborhood cheaper than in open systems, but so can large companies who have the potential to have lower overhead costs from larger customer bases. Also, there was concern regarding the need to post significant bonds and insurance coverage.
Haulers have become very experienced in their opposition efforts to organized collection, making statements to public officials that it is “… time to rally the troops.” Typically an organized mailing is sent out by multiple companies to their customers with a slanted description of what the city or county is doing. Past mailings have stated the city or county will “radically change waste hauling, will hurt consumers, will take away freedom of choice, etc.” The mailing urges customers to contact the respective elected officials to voice disapproval to organized collection. These organized campaigns have been very effective in causing elected officials to reject recommendations from staff and local advisory committees that research the issues. The mailings and “rallying of the troops” have been conducted just prior to any formal approvals in the organized collection statutory process so that opposition to organized collection affects elected officials ability to vote to proceed. Potential alternatives to organized collection raised by haulers when cities have tried to go from open to organized systems have included:
♦ Establishing collection zones to limit set out days to one day per week. ♦ Bringing trucks into the city empty. ♦ Driving only on streets they have customers. ♦ Providing educational inserts in billings. ♦ Providing tonnage estimates.
These alternatives start to address some of the potential issues but are difficult to monitor and enforce while not addressing the total number of trucks used.
2.4.3 Select Municipal Examples Several reports were identified from cities in Minnesota that have attempted to go from an open system into an organized system. The cities of Vadnais Heights and Elk River successfully completed the process in 1991. To the best of current knowledge, Vadnais Heights and Elk River are the last cities to become organized following the statutory process. The city of Falcon Heights went through the process from sometime in 2003 through early 2005.18 Their report is fairly comprehensive and their process and experience representative of other Minnesota
18 “Organized Collection Study – Final Report.” Oct. 2004. City of Falcon Heights, MN.
24 •Foth Infrastructure & Environment, LLC R - Analysis of Waste Collection Service Arrangements.doc June 2009
communities. Also, the recent experience of the city of Minneapolis provides an important perspective of potential problems with the Organized Collection statute itself. In addition, both Plymouth and Edina recently initiated recycling RFPs to modify their existing contracts and considered including source separated organics (SSO) for organized curbside recycling services. The Cities’ legal counsel advised that these municipalities would have to follow the Organized Collection statute, so the Cities chose not to include SSO in the new scope of collection services. 2.4.3.1 City of Vadnais Heights The city of Vadnais Heights successfully implemented a conversion to organized collection in 1991 after almost two years of planning, negotiations and public participation. The City originally had at least eight (8) haulers providing residential solid waste collection services. When separate curbside recycling was initiated in 1987 (circa), the amount of additional truck traffic became significant. The City followed the Organized Collection statute process explicitly (as it existed at the time, M.S. 115A.94 – 1987, Chapter 348, section 27) including:
1. Adoption of a resolution of intent to organize solid waste collection; 2. At least two public hearings (August 21, and September 18 1990); and 3. Final decision to organize solid waste collection via new contract with a consortium of
hauling companies that later formed under the name Vadnais Heights Group (VHG). The objectives for organizing were stated very early in the process and remained consistent, minimum goals throughout the entire planning process. In minutes of the City’s Solid Waste Commission (September 18, 1989), the following reasons were originally established for considering an organized collection system in Vadnais Heights:
1. “To more effectively comply with State laws mandating the establishment of a recycling program and the elimination of yard waste from the normal refuse collection.”
2. “To minimize the expected future increased cost to residents for refuse collection,
recycling and yard waste disposal.” 3. “To establish a collection system whereby payment by residents was based on volume.” 4. “To reduce the number of collection trucks within the City to improve the aesthetics,
reduce damage to city streets and improve safety.” Additional Commission goals were stated at the August 21, 1990 City Council meeting:
5. “Facilitate the monitoring and reporting of the pickup and disposal of trash.” 6. “Implement a system that would prevent or reduce abuses of the system. The
Commission wants to implement a system that will reduce the incentive for people to throw trash along the roadside.”

R - Analysis of Waste Collection Service Arrangements.doc Foth Infrastructure & Environment, LLC • 25 June 2009
In addition to these required steps, the City utilized a number of additional means to gather public and hauler input into the City’s decision-making process, including (but not limited to):
♦ Research on the organized collection statute and relevant case studies by City staff and legal counsel (Willard Converse, of Jensen, Bell, Converse, & Erickson, P.A.).
♦ Surveys by City staff as to the residents’ satisfaction with the current system and
willingness to change to an organized collection system alternative.
♦ Multiple meetings of the City’s Solid Waste Commission over a period of almost two years 1989 – 1990 (held approximately every month), including participation by the local haulers.
♦ Meetings and contract negotiations between City staff and individual haulers.
♦ Meetings and contract negotiation between City staff and the consortium of haulers.
Through the organized collection planning process, the City and the affected haulers that were currently serving Vadnais Heights residents at that time continued to discuss the option of a City contract with a consortium. This option continued to gain favor by both the City and the haulers as a preferred alternative to the original scenario for one contract with one hauling company. In the end, the City decided to organize under a “zoned” system under one contract to the VHG consortium of haulers. The proposed contract (as of August 1990) displayed the total number of residential accounts (i.e., stops) for each hauler as of January 1, 1990 (before the organized collection process officially began) and then proposed under the new City – VHG contract in each zone:
Hauler Total No. of Accounts as of 1/1/90
Total No. of Accounts in Each Zone (Proposed)
Bellaire Sanitation 1,579 1,525 Wood Lake Sanitation 886 845 Twin City Sanitation 250 350 Wynne’s Rubbish Removal 300 258 Wildwood Sanitation 66 70 Red Arrow Sanitation 22 50 Haul-a-Way 22 43 Lake Sanitation 192 200 In the end, VHG as the hauler consortium became its own corporate entity and served as a single point of contact and contracting for the City. VHG was in control of its membership such that acquisitions and other transfers of interest were handled internally by the consortium. It was stated in one of the public hearings that the consortium would be able to accept requests by other haulers to join (such that the above list was not necessarily the final split of accounts within VHG). The new organized collection system went into effect January 1, 1991. The City and

26 •Foth Infrastructure & Environment, LLC R - Analysis of Waste Collection Service Arrangements.doc June 2009
VHG worked hard to implement the new system over the first few months and initial years of the new system. Today, due to mergers and acquisitions, VHG is comprised of three hauling firms: Allied Waste Services, Waste Management and Red Arrow Sanitation. The curbside recycling system, one of the primary original reasons for the change to organized collection, recently was changed to a single stream system in 2008 as per an amended contract with VHG. 2.4.3.2 City of Falcon Heights The city of Falcon Heights has a fairly detailed report on their process of analyzing the conversion to organized collection along with a dedicated special issue of the city of Falcon Heights Newsletter plus a seven page “Update on Trash Collection Study” that lists the chronology of the process.19 Following is their chronology of activities and actions:
♦ January 28, 2004 – The City’s Solid Waste Commission had been looking at the issue of organized collection since early 2003. On January 28, 2004, the City council took action to look into organized collection.
♦ March 24, 2004 – The City council passed the resolution of intent to conduct further fact
finding noting that this was by no means a decision to proceed. Over 100 people attended the public hearing with 35 residents and haulers speaking. The 90-day planning period started.
♦ May 6, 2004 – The Solid Waste Commission met with haulers to discuss ways the City
can achieve solid waste goals adopted by the Council. A considerable amount of time was spent discussing road issues without complete answers. A follow-up meeting was scheduled for May 13, 2004 prior to another public meeting scheduled for May 20, 2004.
♦ June 23, 2004 – The Solid Waste Commission requested an extension of the 90-day
planning period. An interim report was provided of the activity to-date.
♦ July 15, 2004 – The final report date was delayed until late August or early September.
♦ August 13, 2004 – The Solid Waste Commission continued discussions.
♦ October 13, 2004 – The study report was presented at the City Council meeting. The 90-day negotiation period started. A council decision date was set for January, 26, 2005. Following is “The Commission Recommendation.”
“At every stage of this process the Commission has kept in mind the question, ‘What is in the best interests of the residents of Falcon Heights?’ After an extended period of study, the Falcon Heights Solid Waste Commission has found that”
♦ Residents in cities with organized collection pay significantly lower fees than the Falcon Heights average.
19 “2004 Organized Collection Study: Update.” Jan. 2005. City of Falcon Heights, MN. Online at www.falcon-heights.mn.us/gov/sw/swnews.html
R - Analysis of Waste Collection Service Arrangements.doc Foth Infrastructure & Environment, LLC • 27 June 2009
♦ Only with a contract can we make the decision about where our garbage goes, based on our environmental interests, and make sure we have a voice in other important decisions about our municipal solid waste.
♦ If we can reduce the number of garbage trucks serving the City, we can make our streets and alleys last longer and reduce exhaust and noise pollution.
♦ Continued consolidation of the industry will leave individual residents with decreasing choice and decreasing power in the marketplace, if the City keeps an open system.
It is the consensus of the Commission that the interests of the residents of Falcon Heights can best be served by implementing organized collection in the City. Accordingly, the Commission recommends the following plan and timetable: ♦ On October 13, end the statutory planning period and commence the 90-day
discussion period. ♦ Put the Commission’s report and recommendation and the hauler’s recommendation
in the hands of residents as soon as possible after October 13. ♦ Take comments from the public under guidelines to be determined by the City Council
for a limited period to be designated by the Council. ♦ Make available an opportunity for haulers to participate in further discussion during
the 90 days. ♦ Make findings of fact, as required by Minn. Stat. 115A.94, in January, 2005, at the
end of the 90 day discussion period or soon thereafter. ♦ Pending the will of the Council, after the expiration of the 90 days, issue a Request
for Proposal that: Serves the best interests of the residents of Falcon Heights, financially and
environmentally Moves toward all the goals articulated in January, 2004 Covers all types of residential solid waste discussed in the original goals, except
recycling, which shall remain separate for now Makes every effort, including innovative strategies developed by other cities, to
ensure that all haulers, large and small, now licensed in the city, have a fair chance to compete for a city contract.”
♦ November 9, 2004 – Report summary was to be mailed to residents.
♦ January 13, 2005 – The public comment period was closed on December 30, 2004. The
council is reading all the comments.
♦ January 27, 2005 – Council chooses alternate garbage plan, not a city-wide contract. The council voted unanimously to seek a “Memorandum of Understanding” with the licensed waste haulers to mitigate some of the effects of truck traffic and enhance public education.

28 •Foth Infrastructure & Environment, LLC R - Analysis of Waste Collection Service Arrangements.doc June 2009
Despite extensive study by the city of Falcon Heights Solid Waste Commission with conclusions that interests of the residents of Falcon Heights would be best served by organizing collection, the City Council was not able to proceed. 2.4.3.3 City of Minneapolis The city of Minneapolis has continuously been involved in some form of city-wide organized collection since at least 1902.20 In the early 1970’s, the City decided to develop a split system in which approximately half of the City would be serviced by municipal crews and the other half would be serviced by a contracted hauler. At that time, Minneapolis Refuse Inc. (MRI) was formed as a consortium of a large number of pre-existing haulers and was awarded a contract to service half the City without a competitive procurement process. Municipal crews provide the same basic level of service in the other half, thus maintaining a balance of public/private service provision. These actions were taken long before the Organized Collection Act was adopted by the Minnesota Legislature in 1987. The authority for the City to organize collection is provided in the City’s home rule charter that provides authority to enter into contracts to collect solid waste. Over the years, the City and MRI continued to negotiate five-year extensions to the collection contract up until and including a five-year extension in 2002. Thus, from 1971 through 2007, the City never competitively bid the waste collection contract. In 2005, the City developed a Business Plan for Solid Waste and Recycling Services that included competitive sourcing of this contract as a prudent public policy.21 A Request for Proposals (RFP) was issued by the City in March, 2006. MRI filed a lawsuit seeking to enjoin the RFP process on the grounds that the City had not followed the Organized Collection Statute process that requires the 180 day planning and discussion process. The injunction was granted to MRI and the City was required to follow the Organized Collection process. The City claimed that the City was not required to follow that process since they had become organized well before 1987 when the Organized Collection Act was originally adopted. The City noted that the Organized Collection statute merely provides statutory authority for those cities that do not otherwise have authority to organize collection. Further, the City noted that Subd. 6. (c) of the Organized Collection statute provides that a city may exercise any authority granted by another law to govern collection of solid waste, including a home rule charter.22 The lawsuit between MRI and the city of Minneapolis went before a Hennepin County District Court judge, who issued his ruling on September 15, 2006. The ruling was in favor of MRI causing the City to be required to follow the Organized Collection process even though the City 20 “Procedures for Solid Waste and Recycling Collection Contract.” Dec. 1996. Office of the City Attorney, City of Minneapolis, MN. 21 Letter to the Honorable Sandra Colvin Roy, Chair, Transportation and Public Works Committee. Oct. 10, 2006. Dept. of Public Works, City of Minneapolis, Minnesota. 22 “Procedures for Solid Waste and Recycling Collection Contract.” Dec. 1996. Office of the City Attorney, City of Minneapolis, Minnesota. .
R - Analysis of Waste Collection Service Arrangements.doc Foth Infrastructure & Environment, LLC • 29 June 2009
believed they had been organized in the same manner since 1971. Part of the judge’s memorandum reads as follows:23
‘The City argues that Subd. 6 (“Organized Collection Not Required or Prevented”) of the
statute makes the otherwise mandatory requirements of Subd. 3(c) optional for cities whose home rule charter provides for governance of the collection of solid waste. But once the City chose to organize parts of its collection, it exercised its authority under the home rule charter as allowed by the option granted in Subdivision 6(a), which states that “the authority granted in this section to organize solid waste collection is optional and is in addition to authority to govern solid waste collection granted by other “law.” (emphasis added). That is not to say that the choice made by the City in 1971 governs in perpetuity; but again, the arguments presented in this case show that the City intends at this time to continue organized collection in parts of the City. In other words, the optional part of Minn. Stat. 115A.94 is whether or not to organize; once the decision to organize has been made, the “shall” language of Subd. 3(c) makes clear, as demonstrated by the 1990 amendments, that cities are mandated to abide by Subd. 3(c) and the procedures of Subd. 4. Indeed, when the City admitted in court that it was operating under the statute for initial organization of commercial areas of downtown Minneapolis, the City made an “affirmative election” to organize collection for those areas and to abide by the statutory procedures in doing so. The City’s RFP process chosen by the council on February 10 does not comply by the statutory requirements, and the City’s argument that it is not required because this is not an initial organization but a re-organization is erroneous because a re-organization significantly changes the structure of collection, which is exactly what the Organized Collection Act aimed to control.’
A subsequent section of the ruling continues: ‘As stated earlier, the (City’s) charter contains two enumerated powers – the power to provide removal throughout the City, and the power to enter into contracts for that removal. Neither of those powers concern the process by which organization of waste collection is done. That process is the specific subject matter of Minn. Stat. 115A.94….it is clear from the mandatory language of the statute that the Legislature intended to craft a specific law concerning the procedures to be followed when a local government sets up its chosen form of organized collection. The statute was intended to cover all cities, including charter cities, and is intended to occupy the field of the procedures for waste collection organization.’ This court case and ruling seems to indicate that for any city to make a change in their existing organized collection structure, they are required to go through the specific and what has proven to be a difficult, lengthy, and potentially expensive process. For example, arguably a city that has a contract for service with an existing hauling company, but desires to seek competitive proposals at the end of the contract term rather than negotiate a contract extension would be required to go through the Organized Collection process. Faced with going through the Organized Collection process, the city may choose to simply negotiate a contract extension without ever having another competitive process. 23 State of Minnesota, County of Hennepin District Court. Sept. 2006. Minneapolis Refuse, Inc. vs. City of Minneapolis, Minnesota. .

30 •Foth Infrastructure & Environment, LLC R - Analysis of Waste Collection Service Arrangements.doc June 2009
2.4.3.4 Cities of Plymouth and Edina The cities of Plymouth and Edina both currently have organized residential recycling collection services. They also both have recently initiated recycling purchasing processes to procure additional and new services for residential curbside recycling collection. In each case, a curbside recycling RFP was developed by City staff, with review and approval by a contract legal counsel. This legal opinion stated that the Cities must still follow the Organized Collection statute in M.S. 115A.94 if they wanted to include source separated organics (SSO) as a new service to the recycling contracts. The cities were hoping to add SSO as a new recyclable commodity as part of curbside recycling contract services. This legal opinion stated that following the Organized Collection statute is required despite the amendment to the definition of mixed MSW in the 2008 Regular Session of the Minnesota Legislature (Chapter 357 - S.F. No. 3056, Sections 32 and 33) and the addition of the new term “source-separated compostable materials”. This municipal legal opinion held that the definitions of “solid waste” or “recyclable materials” was not changed with the Organized Collection statute (115A.94) and therefore such expansion of the scope of curbside recycling services should trigger the Organized Collection process (as per 115A.94). In both cases, the cities of Plymouth and Edina elected not to include SSO collection and composting in the scope of services. 2.5 Issues Related to Collection Services There are several potential issues associated with collection services that have been identified in the work plan for this study. These issues are:
♦ Costs of collection services to residents; ♦ Waste generation/management; ♦ Waste disposal/management; ♦ Infrastructure costs; and ♦ Accidents and safety.
This study researched these issues as part of the literature review task. The results of the literature review research are presented in the following subsections. Some of these issues are addressed again in later sections of this report.
2.5.1 Cost/Pricing Rate surveys are a common practice in the evaluations conducted by cities when considering whether to implement organized collection. As noted previously, it is common for these studies to report that rates paid by households in organized systems are less than those paid in open systems. This subsection provides highlights from a few of the data sources. 2.5.1.1 City of Falcon Heights
Exhibit 2-1 is a rate comparison provided in the city of Falcon Heights Organized Collection Study: Final Report.24
24 “Organized Collection Study: Final Report.” Oct. 2004. City of Falcon Heights, Minnesota.
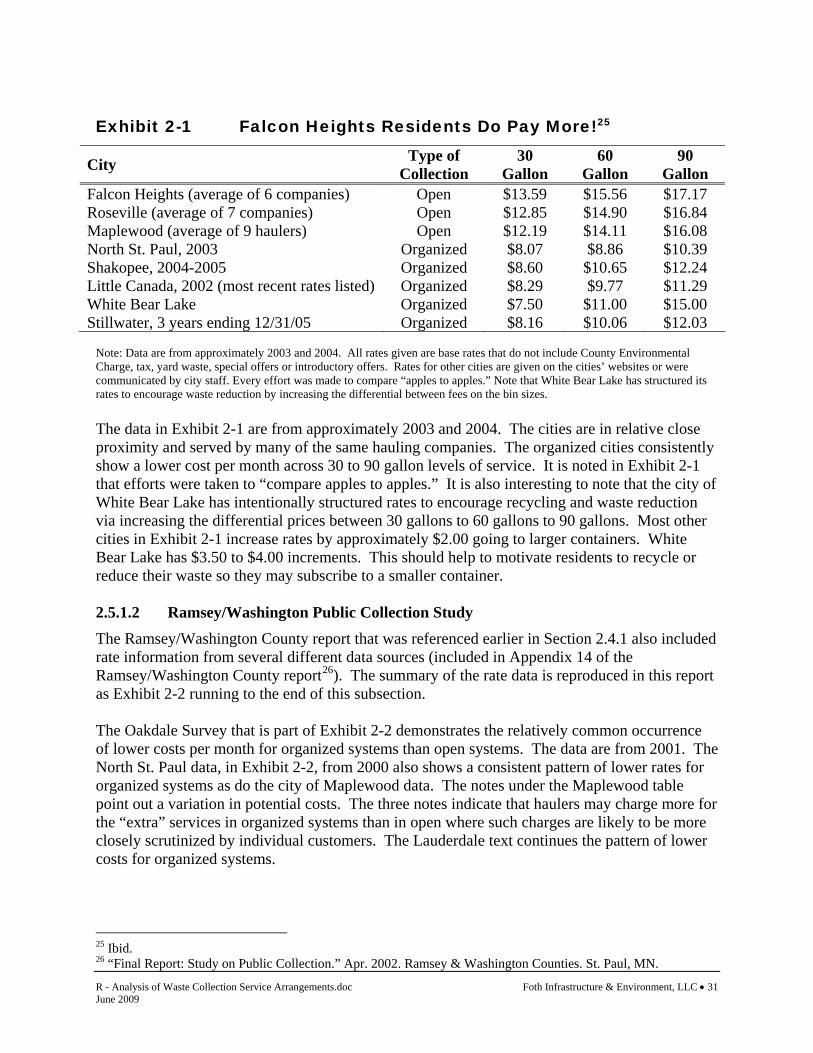
R - Analysis of Waste Collection Service Arrangements.doc Foth Infrastructure & Environment, LLC • 31 June 2009
Exhibit 2-1 Falcon Heights Residents Do Pay More!25
City Type of Collection
30 Gallon
60 Gallon
90 Gallon
Falcon Heights (average of 6 companies) Open $13.59 $15.56 $17.17 Roseville (average of 7 companies) Open $12.85 $14.90 $16.84 Maplewood (average of 9 haulers) Open $12.19 $14.11 $16.08 North St. Paul, 2003 Organized $8.07 $8.86 $10.39 Shakopee, 2004-2005 Organized $8.60 $10.65 $12.24 Little Canada, 2002 (most recent rates listed) Organized $8.29 $9.77 $11.29 White Bear Lake Organized $7.50 $11.00 $15.00 Stillwater, 3 years ending 12/31/05 Organized $8.16 $10.06 $12.03
Note: Data are from approximately 2003 and 2004. All rates given are base rates that do not include County Environmental Charge, tax, yard waste, special offers or introductory offers. Rates for other cities are given on the cities’ websites or were communicated by city staff. Every effort was made to compare “apples to apples.” Note that White Bear Lake has structured its rates to encourage waste reduction by increasing the differential between fees on the bin sizes. The data in Exhibit 2-1 are from approximately 2003 and 2004. The cities are in relative close proximity and served by many of the same hauling companies. The organized cities consistently show a lower cost per month across 30 to 90 gallon levels of service. It is noted in Exhibit 2-1 that efforts were taken to “compare apples to apples.” It is also interesting to note that the city of White Bear Lake has intentionally structured rates to encourage recycling and waste reduction via increasing the differential prices between 30 gallons to 60 gallons to 90 gallons. Most other cities in Exhibit 2-1 increase rates by approximately $2.00 going to larger containers. White Bear Lake has $3.50 to $4.00 increments. This should help to motivate residents to recycle or reduce their waste so they may subscribe to a smaller container. 2.5.1.2 Ramsey/Washington Public Collection Study The Ramsey/Washington County report that was referenced earlier in Section 2.4.1 also included rate information from several different data sources (included in Appendix 14 of the Ramsey/Washington County report26). The summary of the rate data is reproduced in this report as Exhibit 2-2 running to the end of this subsection. The Oakdale Survey that is part of Exhibit 2-2 demonstrates the relatively common occurrence of lower costs per month for organized systems than open systems. The data are from 2001. The North St. Paul data, in Exhibit 2-2, from 2000 also shows a consistent pattern of lower rates for organized systems as do the city of Maplewood data. The notes under the Maplewood table point out a variation in potential costs. The three notes indicate that haulers may charge more for the “extra” services in organized systems than in open where such charges are likely to be more closely scrutinized by individual customers. The Lauderdale text continues the pattern of lower costs for organized systems.
25 Ibid. 26 “Final Report: Study on Public Collection.” Apr. 2002. Ramsey & Washington Counties. St. Paul, MN.

32 •Foth Infrastructure & Environment, LLC R - Analysis of Waste Collection Service Arrangements.doc June 2009
The text associated with the Minnesota Attorney General’s Report points out another interesting variation. The Attorney General Report was compiled by the Antitrust Division who studied 13 Ramsey and Washington County municipalities with organized collection. The report concluded that maintaining cost-effective rates are not only a function of organizing collection, but also very dependent on the method of contractor procurement. Communities that maintained continued relationships with existing haulers were paying between 17.6% and 48.5% more than communities that competitively select haulers. Thus, to help fully take advantage of the efficiencies of organized collection, municipalities should not simply continually negotiate a contract extension with the existing hauling company. A competitive procurement process keeps the contract costs in line with other market pricing. Exhibit 2-2 Financial Issues Related to Public Collection27 Appendix 14 Financial Issues Related to Public Collection – (excepted from Ramsey/Washington counties report).
This study did not include a detailed look at waste collection pricing in Ramsey and Washington Counties. It did gather information on what a few communities had recently prepared on the issue of waste collection, and some information from two studies conducted in 1993. Oakdale Survey The city of Oakdale staff in 2001 surveyed 14 cities with a variety of collection systems for residential trash and recycling. Rates were tabulated for small (30-gallon) medium (60-gallon), and large (90-gallon) size trash cans, including recycling service. Can sizes, other than 30, 60 and 90 gallon, were grouped in the closest size category. Other services, such a yard waste pickup, and special rates, such as for seniors, were excluded to the degree possible so that the data are comparable.
27 Ibid.
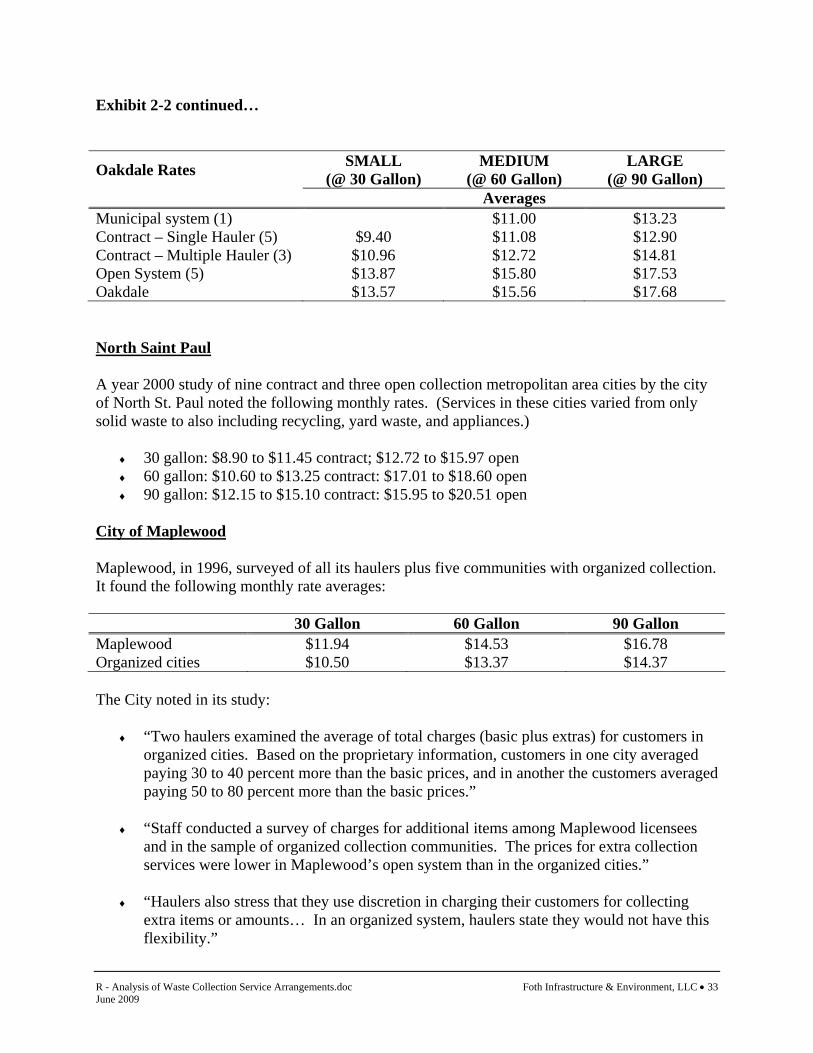
Exhibit 2-2 continued…
R - Analysis of Waste Collection Service Arrangements.doc Foth Infrastructure & Environment, LLC • 33 June 2009
Oakdale Rates SMALL (@ 30 Gallon)
MEDIUM (@ 60 Gallon)
LARGE (@ 90 Gallon)
Averages Municipal system (1) $11.00 $13.23 Contract – Single Hauler (5) $9.40 $11.08 $12.90 Contract – Multiple Hauler (3) $10.96 $12.72 $14.81 Open System (5) $13.87 $15.80 $17.53 Oakdale $13.57 $15.56 $17.68 North Saint Paul A year 2000 study of nine contract and three open collection metropolitan area cities by the city of North St. Paul noted the following monthly rates. (Services in these cities varied from only solid waste to also including recycling, yard waste, and appliances.)
♦ 30 gallon: $8.90 to $11.45 contract; $12.72 to $15.97 open ♦ 60 gallon: $10.60 to $13.25 contract: $17.01 to $18.60 open ♦ 90 gallon: $12.15 to $15.10 contract: $15.95 to $20.51 open
City of Maplewood Maplewood, in 1996, surveyed of all its haulers plus five communities with organized collection. It found the following monthly rate averages: 30 Gallon 60 Gallon 90 Gallon Maplewood $11.94 $14.53 $16.78 Organized cities $10.50 $13.37 $14.37 The City noted in its study:
♦ “Two haulers examined the average of total charges (basic plus extras) for customers in organized cities. Based on the proprietary information, customers in one city averaged paying 30 to 40 percent more than the basic prices, and in another the customers averaged paying 50 to 80 percent more than the basic prices.”
♦ “Staff conducted a survey of charges for additional items among Maplewood licensees
and in the sample of organized collection communities. The prices for extra collection services were lower in Maplewood’s open system than in the organized cities.”
♦ “Haulers also stress that they use discretion in charging their customers for collecting
extra items or amounts… In an organized system, haulers state they would not have this flexibility.”
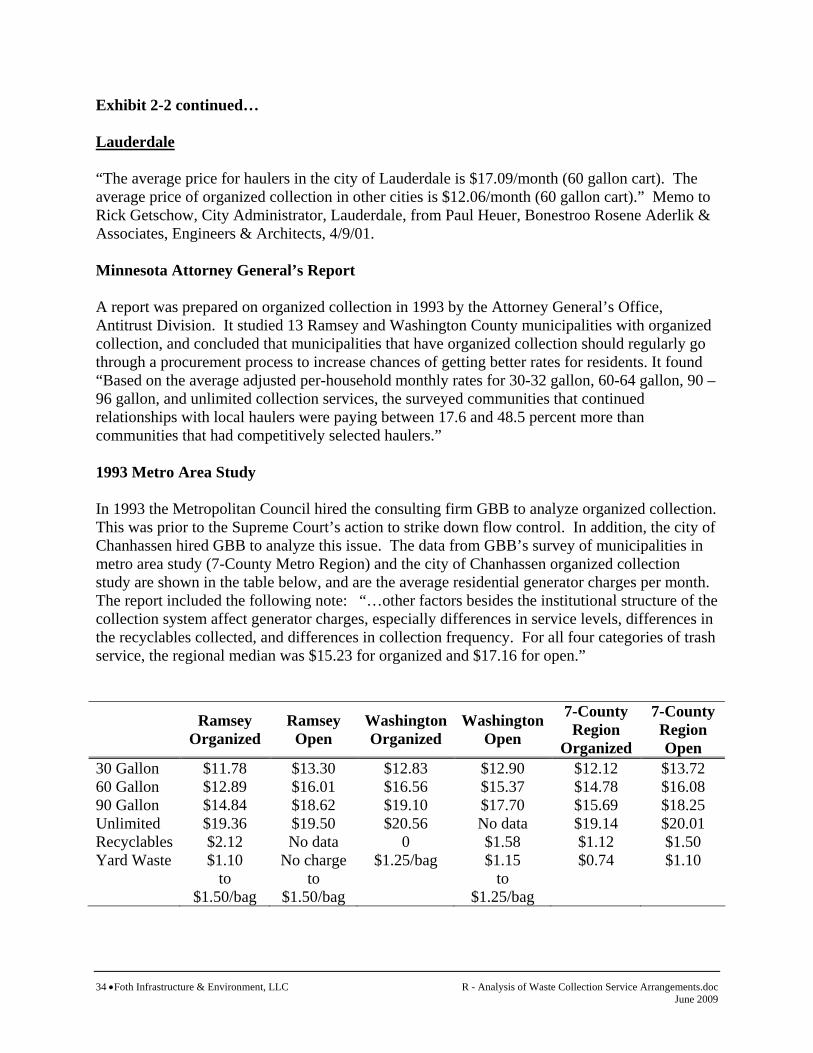
Exhibit 2-2 continued…
34 •Foth Infrastructure & Environment, LLC R - Analysis of Waste Collection Service Arrangements.doc June 2009
Lauderdale “The average price for haulers in the city of Lauderdale is $17.09/month (60 gallon cart). The average price of organized collection in other cities is $12.06/month (60 gallon cart).” Memo to Rick Getschow, City Administrator, Lauderdale, from Paul Heuer, Bonestroo Rosene Aderlik & Associates, Engineers & Architects, 4/9/01. Minnesota Attorney General’s Report A report was prepared on organized collection in 1993 by the Attorney General’s Office, Antitrust Division. It studied 13 Ramsey and Washington County municipalities with organized collection, and concluded that municipalities that have organized collection should regularly go through a procurement process to increase chances of getting better rates for residents. It found “Based on the average adjusted per-household monthly rates for 30-32 gallon, 60-64 gallon, 90 – 96 gallon, and unlimited collection services, the surveyed communities that continued relationships with local haulers were paying between 17.6 and 48.5 percent more than communities that had competitively selected haulers.” 1993 Metro Area Study In 1993 the Metropolitan Council hired the consulting firm GBB to analyze organized collection. This was prior to the Supreme Court’s action to strike down flow control. In addition, the city of Chanhassen hired GBB to analyze this issue. The data from GBB’s survey of municipalities in metro area study (7-County Metro Region) and the city of Chanhassen organized collection study are shown in the table below, and are the average residential generator charges per month. The report included the following note: “…other factors besides the institutional structure of the collection system affect generator charges, especially differences in service levels, differences in the recyclables collected, and differences in collection frequency. For all four categories of trash service, the regional median was $15.23 for organized and $17.16 for open.” Ramsey
Organized Ramsey
Open Washington Organized
Washington Open
7-County Region
Organized
7-County Region Open
30 Gallon $11.78 $13.30 $12.83 $12.90 $12.12 $13.72 60 Gallon $12.89 $16.01 $16.56 $15.37 $14.78 $16.08 90 Gallon $14.84 $18.62 $19.10 $17.70 $15.69 $18.25 Unlimited $19.36 $19.50 $20.56 No data $19.14 $20.01 Recyclables $2.12 No data 0 $1.58 $1.12 $1.50 Yard Waste $1.10
to $1.50/bag
No charge to
$1.50/bag
$1.25/bag $1.15 to
$1.25/bag
$0.74 $1.10
Exhibit 2-2 continued…
R - Analysis of Waste Collection Service Arrangements.doc Foth Infrastructure & Environment, LLC • 35 June 2009
Finally the 1993 Metro Area Study also showed lower costs for organized systems over the open systems at that time. (End of Exhibit 2-2) 2.5.1.3 Goodhue County Survey Exhibit 2-3 is a summary of rate comparisons completed for Goodhue County by MPCA staff.28 The Exhibit shows 2007/2008 rate information for several communities in Goodhue County. The top six entries are open systems and the bottom four are organized with three via contracts and one municipal. There are some variations in approach in that Wacouta and Goodhue have only one size container. It is tricky making comparisons because the service levels are not always comparable. For example, Waste Management collects garbage in Cannon Falls, but not the recyclables. The monthly rates range from $15.00 to $20.00 going from 30 to 90 gallon service. In Zumbrota, Waste Management has the contract in an organized system collecting not only garbage, but also recyclables. The rates range from $12.84 to $15.73 going from 30 to 90 gallon service. The open system rates in Cannon Falls without recycling are higher than the organized system rates in Zumbrota where both garbage and recycling service is required. The lowest rates in Exhibit 2-3 are in Lake City with a contract with Lake City Disposal that requires delivery to the Red Wing Waste-to-Energy (WTE) facility. Rural rates are generally higher than city rates, likely due to lower customer densities. The city of Red Wing rates are very competitive for the 30 gallon service, but due to the City Service Charge, the rate for 90 gallon service is relatively high. The service charge covers bonding to fund an up-front fuel cleaning system to be completed by Fall 2009.
28 Schneider, Jeff. 2007/2008 Update. “Goodhue & Red Wing Rated Study.” Minnesota Pollution Control Agency. Rochester, MN.

36 •Foth Infrastructure & Environment, LLC R - Analysis of Waste Collection Service Arrangements.doc June 2009
Exhibit 2-3 2007/2008 Survey of Monthly Rates for Residential
Waste Collection Services in Goodhue County
Hauler City/Hauler Small Medium Large Recycling Total Cost RangeContract Vol. Vol. Vol. Rate (SW tax + Recycling)
Wacouta* P.I.G. No? N/A $12.15 N/A N/A $13.24City of Goodhue (Rural) WMI No $12.50 $14.25 $17.25 Service Not Provided $18.71~$23.93City of Red Wing (Rural) WMI No $12.50 $14.25 $17.25 Service Not Provided $18.71~$23.93Cannon Falls** WMI No $15.00 $17.00 $20.00 Paid by City Contract $16.46*~$21.95Residential City Rates Veolia No $19.00 $20.00 $22.00 Service Not Provided $20.85~$24.15Rural County Rates Veolia No $24.00 $25.00 $27.00 Service Not Provided $26.34~$29.63
Lake City Lake City Disposal Yes $7.85 $9.75 $11.65 $2.15 $10.77~$14.94City of Goodhue*** Gibson Yes $13.50 $13.50 $13.50 $3.00 $16.50Zumbrota WMI Yes $12.84 $14.19 $15.73 No Charge for Service $14.09~$17.26Kenyon Grose Yes N/A $14.50 $20.30 $4.00 $19.91~$26.28
City of Red Wing**** City of Red Wing City Service $8.27 $16.53 $24.80 $4.00 $13.07~$31.22
*Billing Statement Does Not Indicate Whether Recycling is Included or Available and Does Not Apply the T9.75% MN SW tax required by state law.
**Cost of Recycling is Not included in Cost Range, City of Cannon Falls Pays for Residential Recycling Services Through a Separate Contract.
***SW Mgt Tax is Paid by the City of Goodhue and Included in the Price, Residents Provide Their Own Waste Container, Rate is Independent of Volume.
****City Does Not Offer 32 Gallon or 64 Gallon Option, Rate is Extrapolated from Cost of 48 Gallon and 96 Gallon Containers Rates i.e.Cost/Gallon, Rates Include City Service Charge 2.5.1.4 Rate Summary When comparing rates from one community and system type to another, it is important to identify variables and try to account for them. Potential variables include differences in service levels, distances to disposal locations and the corresponding tipping fees, surcharges, etc. The comparisons cited made efforts to control the variables or identify them and make adjustments. Also, variables such as identified in the Attorney General Report where organized cities that only negotiate contract extensions have higher rates can also cause discrepancies. Nevertheless, the rates charged in open systems are typically higher than in organized systems. This is a natural occurrence due to the difference in efficiencies and the potential for rate increases periodically without much scrutiny by individual customers. Additional rate information is provided as part of the municipal survey in later report sections.
2.5.2 Volume Based Pricing and Waste Generation There is a great deal of information related to the affect of volume-based rates (also called pay-as-you-throw, unit-based pricing, and variable rate pricing). Changing from one flat rate for all service levels to volume-based rates (e.g., significantly increasing rates going from 30 to 60 and 90 gallon carts or bag systems) has been credited with a significant increase in recycling and landfill reductions in many communities. Organized systems can provide public entities with greater control over rate structures and therefore provide increased influence in managing wastes via reduction and recycling. Even so, municipal regulation of private contracted hauler rates via licensing can also provide more aggressive rates for volume-based rates. For example, the

R - Analysis of Waste Collection Service Arrangements.doc Foth Infrastructure & Environment, LLC • 37 June 2009
Western Lake Superior Sanitary District (WLSSD) has a volume-based rate structure in its solid waste ordinance (covered in more detail in Section 4 of this report).
2.5.3 Transportation (Transfer Haul Costs) Foth has developed a spreadsheet model for estimating transfer hauling costs which allows for incorporating different assumptions for key variables such as fuel costs, average travel speeds, tons hauled per load, one way miles, etc. The model then calculates the costs and converts them to some commonly used rates such as cost per ton, cost per ton-mile, cost per hour, and cost per mile. The model is depicted using common assumptions for two different hauling distances in Table 2-4 (example A is 90 miles and B is 120 miles). The model was recently calibrated with actual hauling quotes. The electronic copy of the model has been provided to the MPCA as part of the project. Part of the usefulness of the model is that it helps to gauge the potential impact when different variables are changed. For example, in Table 2-4A, if the fuel cost per gallon increases by $1.00 from $3.00 to $4.00 per gallon, the cost per ton is projected to increase from $16.20 to $17.84, an increase of $1.64 per ton or an approximate 10% increase in the cost per ton for a 33% increase in fuel cost per gallon. Numerous other sensitivities can be developed with the model.

38 •Foth Infrastructure & Environment, LLC R - Analysis of Waste Collection Service Arrangements.doc June 2009
Table 2-4A Transfer Haul Cost Model
From St. Paul Generally to Disposal Location A at 90 Miles
Assumptions & Cost Calculations
Cost Category and Assumption Values Cost Calculations
1 Tons/Year 130,000 Ave/loads/day 18.94 2 Cubic yards/load 110 Round trip time (minutes) 229 3 lbs./cy 400 No. trucks 7.24 4 Tons/load 22 Ave. trips/truck 2.6 5 Days/Year 312 Annual Mileage 1,063,636 6 Hook up time 13 Annual Truck Amort. $ $294,036 7 Unload time 20 Annual Main. $ $212,727 8 One way miles 90 Annual license, ins, etc $ $57,920 9 Ave. Speed (mph) 55 Annual Fuel $ $638,182
10 Hrs./Day 10 Annual Labor $ $903,554 11 Tractor/Tlr. Cost $235,000 Total Annual $ $2,106,419 12 Maintenance $/mi $0.20 Cost per ton $16.20 13 License ins, etc/veh. $8,000 Cost/ton-mile $0.090 14 Fuel $/gal $3.00 Annual Hours 22,589 15 Mileage (mpg) 5 Cost per Hour $93 16 Labor $/hr. $40.00 Cost per Mile $1.98
Table 2-4B Transfer Haul Cost Model
From St. Paul Generally to Disposal Location B at 120 Miles
Assumptions & Cost Calculations
Cost Category and Assumption Values Cost Calculations
1 Tons/Year 130,000 Ave/loads/day 18.94 2 Cubic yards/load 110 Round trip time (minutes) 353 3 lbs./cy 400 No. trucks 11.14 4 Tons/load 22 Ave. trips/truck 1.7 5 Days/Year 312 Annual Mileage 1,418,182 6 Hook up time 13 Annual Truck Amort. $ $452,534 7 Unload time 20 Annual Main. $ $283,636 8 One way miles 120 Annual license, ins, etc $ $89,141 9 Ave. Speed (mph) 45 Annual Fuel $ $850,909
10 Hrs./Day 10 Annual Labor $ $1,390,606 11 Tractor/Tlr. Cost $235,00 Total Annual $ $3,066,827 12 Maintenance $/mi $0.20 Cost per ton $23.59 13 License ins, etc/veh. $8,000 Cost/ton-mile $0.098 14 Fuel $/gal $3.00 Annual Hours 34,765 15 Mileage (mpg) 5 Cost per Hour $88 16 Labor $/hr. $40.00 Cost per Mile $2.16
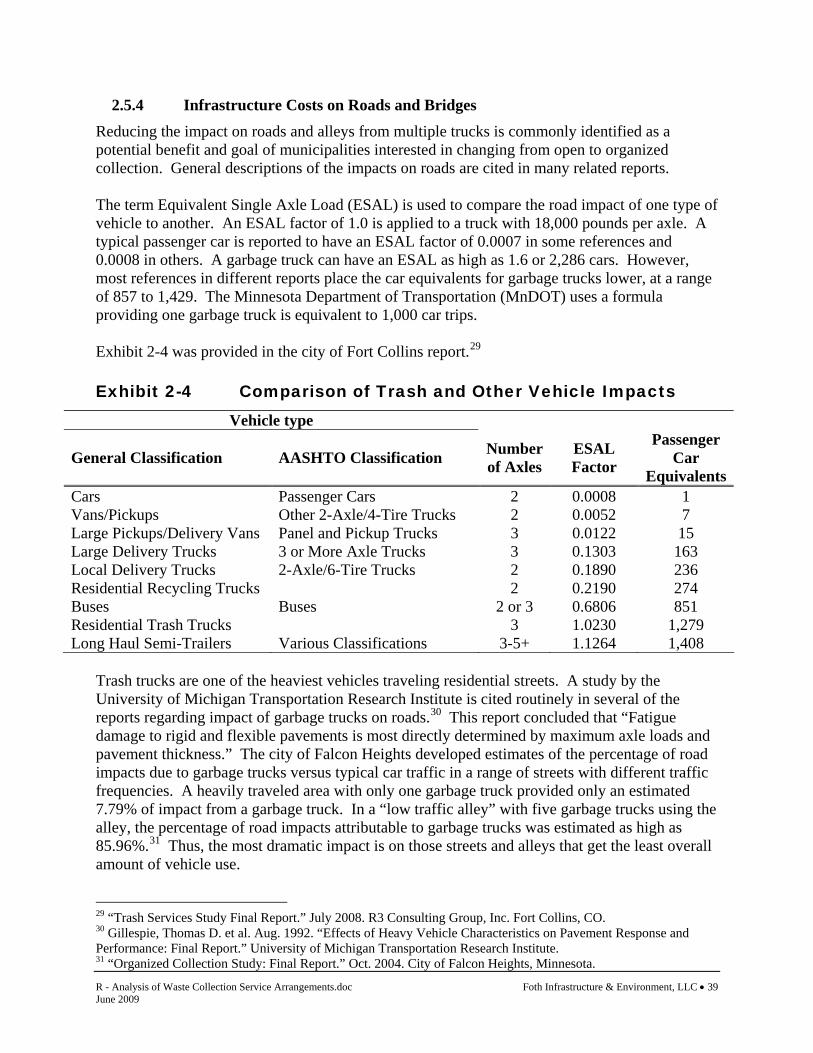
R - Analysis of Waste Collection Service Arrangements.doc Foth Infrastructure & Environment, LLC • 39 June 2009
2.5.4 Infrastructure Costs on Roads and Bridges Reducing the impact on roads and alleys from multiple trucks is commonly identified as a potential benefit and goal of municipalities interested in changing from open to organized collection. General descriptions of the impacts on roads are cited in many related reports. The term Equivalent Single Axle Load (ESAL) is used to compare the road impact of one type of vehicle to another. An ESAL factor of 1.0 is applied to a truck with 18,000 pounds per axle. A typical passenger car is reported to have an ESAL factor of 0.0007 in some references and 0.0008 in others. A garbage truck can have an ESAL as high as 1.6 or 2,286 cars. However, most references in different reports place the car equivalents for garbage trucks lower, at a range of 857 to 1,429. The Minnesota Department of Transportation (MnDOT) uses a formula providing one garbage truck is equivalent to 1,000 car trips. Exhibit 2-4 was provided in the city of Fort Collins report.29 Exhibit 2-4 Comparison of Trash and Other Vehicle Impacts
Vehicle type
General Classification AASHTO Classification Number of Axles
ESAL Factor
Passenger Car
EquivalentsCars Passenger Cars 2 0.0008 1 Vans/Pickups Other 2-Axle/4-Tire Trucks 2 0.0052 7 Large Pickups/Delivery Vans Panel and Pickup Trucks 3 0.0122 15 Large Delivery Trucks 3 or More Axle Trucks 3 0.1303 163 Local Delivery Trucks 2-Axle/6-Tire Trucks 2 0.1890 236 Residential Recycling Trucks 2 0.2190 274 Buses Buses 2 or 3 0.6806 851 Residential Trash Trucks 3 1.0230 1,279 Long Haul Semi-Trailers Various Classifications 3-5+ 1.1264 1,408
Trash trucks are one of the heaviest vehicles traveling residential streets. A study by the University of Michigan Transportation Research Institute is cited routinely in several of the reports regarding impact of garbage trucks on roads.30 This report concluded that “Fatigue damage to rigid and flexible pavements is most directly determined by maximum axle loads and pavement thickness.” The city of Falcon Heights developed estimates of the percentage of road impacts due to garbage trucks versus typical car traffic in a range of streets with different traffic frequencies. A heavily traveled area with only one garbage truck provided only an estimated 7.79% of impact from a garbage truck. In a “low traffic alley” with five garbage trucks using the alley, the percentage of road impacts attributable to garbage trucks was estimated as high as 85.96%.31 Thus, the most dramatic impact is on those streets and alleys that get the least overall amount of vehicle use. 29 “Trash Services Study Final Report.” July 2008. R3 Consulting Group, Inc. Fort Collins, CO. 30 Gillespie, Thomas D. et al. Aug. 1992. “Effects of Heavy Vehicle Characteristics on Pavement Response and Performance: Final Report.” University of Michigan Transportation Research Institute. 31 “Organized Collection Study: Final Report.” Oct. 2004. City of Falcon Heights, Minnesota.

40 •Foth Infrastructure & Environment, LLC R - Analysis of Waste Collection Service Arrangements.doc June 2009
There may be some variations that increase or decrease the potential impacts. The report from the University of Michigan also shows that repeated starting and stopping (especially stopping) will increase the damage to streets by 50% to 100% depending on the speed of the truck and the weight of the load being carried. Garbage trucks with few stops on a block tend to be traveling faster when they begin stopping. Improvements in the design of garbage trucks mitigate some of the impacts. Automated trucks loading from the side should distribute weight more evenly than rear-loaded trucks thereby reducing the impact of the rear axles. In addition, trucks with additional axles help distribute weight. An engineering firm (URS) prepared a memorandum for the city of Arden Hills in their review of potential organized collection. The memorandum noted that in Arden Hills, a 9-ton pavement design is used for residential streets to account for heavier vehicles such as delivery trucks, buses, and garbage trucks.32 The memorandum noted that the main causes for deterioration of bituminous pavement over its life span are the strength and stability of the pavement base, traffic volumes, type of traffic and environmental factors such as water, temperature, sun, and pollutants. The memorandum concluded that:
“Although vehicle types and loading contribute to the wear of the pavement section, environmental factors also contribute to the deterioration of the pavement section. A properly designed bituminous surface should be able to handle the traffic loading over its design life including heavy truck loadings experienced in Arden Hills. Reducing the number of heavy truck loadings should have positive effects on the lifespan and quality of local streets however, environmental factors are generally responsible for the majority of pavement wear and deterioration for Arden Hills streets and therefore significant extensions of pavement life are unlikely.”
The potential economic impact of the road maintenance costs has been estimated by some city officials. The city of Roseville estimated the cost to reconstruct one mile of 7-ton street at approximately $500,000. The engineer believes Roseville streets would last an estimated five (5) to ten (10) years longer if garbage truck traffic was limited. The reduced road maintenance was estimated to potentially save the typical homeowner $20 to $40 per year.33 With 9,400 single family households, this represents a savings of $188,000 to $376,000 per year for the city of Roseville. The city of Oakdale has estimated that going from five (5) haulers to one hauler would conservatively represent a little over 4% annual street maintenance cost savings. With the City averaging $3 million for annual road maintenance, the City estimates the savings at a minimum of $120,000 to over $300,000 per year in long term maintenance costs.
32 Landwer, Nick, P.E. 2005. “Memorandum to Murtuza Dissiqui, City of Arden Hills.” URS. Minneapolis MN. 33 “City of Roseville, Solid Waste and Recycling Report” 2002. Residential Solid Waste and Recycling Advisory Committee. City of Roseville, Minnesota.
R - Analysis of Waste Collection Service Arrangements.doc Foth Infrastructure & Environment, LLC • 41 June 2009
Thus, the potential annual costs for road maintenance potentially associated with garbage collection vehicles is conservatively estimated in the low hundreds of thousands for some cities.
2.5.5 Diesel and Gasoline Emissions Emissions of air pollutants from heavy-duty vehicles, particularly heavy-duty and high weight vehicles such as waste/recycling vehicles, have come under scrutiny in recent years. This attention is due to three main factors:
♦ The Environmental Protection Agency’s (EPA’s) past emphasis on controlling emissions from passenger cars and light duty trucks has reduced the proportional contribution of these sources and illuminated the contribution of air pollution from heavy-duty vehicles.
♦ The public is increasingly concerned about the human health and environmental impacts
of particulate matter, nitrogen oxides, and GHG which are emitted. ♦ Emission controls technologies have become reliable and cost effective in controlling
emissions. However, heavy duty diesel fleets do not always have the most current emissions controls.
Increased health risks, including asthma and heart disease in people have been correlated with exposure to diesel and gasoline engine emissions. The emissions can form ground level ozone (smog) and can contain hydro-carbons, Carbon Monoxide (CO), and Carbon Dioxide (CO2). Waste collection arrangements are directly related to fuel consumption and to emissions. Creating efficiencies in waste collection activities can reduce emissions. Opportunities for the reduction of emissions are occurring and include:
♦ Route changes to reduce inefficiency and idling; ♦ Replace obsolete engines and vehicles; and ♦ Retrofit existing fleet equipment to control emissions.
Investigation into the potential reduction of emissions has not been completed for Minnesota’s waste/recycling fleet due to the wide variety of collection arrangements, fleet type, engine age, variations fueling and fleet/engine emissions controls. The MPCA is now working with a large waste collection fleet owner to reduce emissions. There appears to be the potential for significant reductions in air emissions including GHGs for waste collection activities. Together with fleet modernization, efficient collection systems could contribute to reducing air pollution arising from waste/recycling fleet emissions.
2.5.6 Accidents/Safety Most accident and safety studies completed on waste and recycling collection have been based on the ergonomic aspects for collection employees. These studies have indicated that waste and recycling collection is an occupation with an above average injury rate. This is being addressed as the industry shifts to more automated collection to avoid much of the lifting and exposure to wastes. Studies regarding vehicle accidents involving waste and/or recycling collection vehicles

42 •Foth Infrastructure & Environment, LLC R - Analysis of Waste Collection Service Arrangements.doc June 2009
were not identified in this study. It is intuitive that increased efficiency resulting in less truck miles traveled would in turn reduce the potential for accidents involving waste collection vehicles. 2.6 Interest Group Positions There are several groups that have active interests in how MSW and recyclables are collected, especially regarding changes to existing systems. This section documents the positions of the following groups:
♦ National Solid Waste Management Association (NSWMA) ♦ League of Minnesota Cities (LMC) ♦ Minnesota Inter-county Association (MICA) ♦ Association of Minnesota Counties (AMC) ♦ Minnesota Solid Waste Administrators Association (SWAA) ♦ Solid Waste Management Coordinating Board (SWMCB)
2.6.1 National Solid Waste Management Association (NSWMA)
The NSWMA represents many of the private hauling companies in Minnesota. This group has an active state chapter in Minnesota. Private companies provide the majority of the MSW and recyclables collection service in Minnesota and therefore are key to the success of any system. Generally private haulers oppose changing from open to organized MSW and recycling collection systems. They have built their business based on the regulations and market conditions that are in existence. Changing from open to organized systems represents a potentially serious threat to the future of their businesses. Hauler participation in the Ramsey/Washington Counties Public Collection Study was noted in Section 2.4.2.2. As part of this study, a list of questions was developed and provided to representatives of NSWMA. Foth met with several representatives to discuss the questions and gain direct input from NSWMA regarding many of the potential issues. The questions as posed for the study are in bold below and the written answers provided directly by NSWMA are provided in italics below. The members of the Minnesota Chapter of the National Solid Wastes Management Association provide the following responses to questions concerning Government Managed Waste Collection.
♦ Question: What does NSWMA see as the advantages of open collection and the disadvantages of organized collection (worded as government collection by NSWMA)?
“Over the past 12 years as we have worked with communities on this issue, we have discovered the root of the issue is NOT the garbage and recycling collection system. Time and time again, in packed city council chambers, residents have demanded the right to maintain their FREEDOM of CHOICE and overwhelmingly told government officials not to destroy the free market system. Our experience shows that citizens, at the local level, expect government to
R - Analysis of Waste Collection Service Arrangements.doc Foth Infrastructure & Environment, LLC • 43 June 2009
reasonably regulate our industry while maintaining a system that allows for competition”. Consumers know healthy competition provides the best price, service and value over the long term.”
♦ Question: What are NSWMA’s responses to commonly stated advantages of organized
collection (worded as government managed collection by NSWMA)? Increased efficiency leads to a lower cost per household Less impacts of truck traffic on residential streets Reduced risk of accidents, truck emissions, and noise Greater control and management capabilities leads to
Control where waste and recyclables are delivered Better assurance that residents actually have garbage service Factors promoting recycling and diversion such as variable rate pricing Uniform service makes public education simpler Ability to provide access to special service at known, controlled costs
Ability to competitively bid service on a regular basis Can be used to generate revenues to support other services
“An open market, with competition, is the only way to drive innovation, hence efficiency and value. Value is not just price, but the combination of price, service and environmental protection. It is interesting to note, when government speaks of the advantages of government “managed” collection, there appears to be an underlying presumption they can manage the system better than the private sector. Structurally, government is ill-equipped to manage the myriad of challenges and demands of the consumer and, adds another burden to an already overworked city staff.
Again, when you talk to residents, they believe government has more important problems to tackle, especially given the long history of consistent, innovative and valuable service provided by the private sector in the Twin Cities. A recent example in the Twin Cities market is single sort recycling. Despite the naysayers, the amount of net material recycled has increased and participation has skyrocketed. All of this was done WITHOUT government regulation. To be clear, we do not advocate a new regulation mandating single-sort, but an open market that allows technologies to compete against each other Even today, despite all of the change in our industry, we have a healthy mix of competitors including 50 year old private companies, large national companies and even new startups. Although some of the “advantages” touted by government staff may appear to be desirable, they do not offset the proven history and long term benefits of competition. The system we have today, although not perfect, provides the best value to individual consumers and the community at large.”
♦ Question: Do haulers make more money per customer in open systems than organized
systems (worded as government managed systems by NSWMA)?
44 •Foth Infrastructure & Environment, LLC R - Analysis of Waste Collection Service Arrangements.doc June 2009
“The open market system gives haulers, large and small, the opportunity to provide customized waste solutions for its customers. Again, competition demands the best service at the best price. Government managed collection reduces these opportunities and dramatically slows innovation, hence value. In most cases, government management adds a layer of cost that is unnecessary.”
♦ Question: What cities have followed the Organized Collection Statute in Minnesota and actually implemented an organized system with a single hauler or consortium?
“During the past 12 years, several Minnesota communities have pursued government managed collection using the Organized Collection Statute. Not one municipality has moved away from an open market system in favor of Government Managed Waste Collection. The municipalities that considered Government Managed Waste Collection and rejected a change, remaining a competitive market area: Arden Hills, Carver, Lauderdale, Prior Lake, Coon Rapids, Pine Island, Greenwood, St. Michael, Hanover, Albertville, St. Anthony, Falcon Heights, Ramsey County and Olmstead County Sartell, Lino Lakes, Crystal and New Hope.”
♦ Question: Does NSWMA oppose the concept of hauler consortiums (e.g., MRI) to
address the needs of both local government and the haulers?
“The members of NSWMA oppose hauler consortiums, want to compete, and believe the open market system delivers the best value to the customer.”
♦ Question: What is the history of the Organized Collection Statute? Why was it
originally developed? Why was it amended to include the 180 day hauler involved planning/negotiating period?
“The organized collection statue was passed many years ago to protect haulers from government unilaterally taking, without compensation, the businesses they have built over many years. Thankfully it gives citizens and haulers ample opportunities to reinforce the importance of open competition.”
♦ Question: Do you have data on the prevalence of open and government managed
collection in other states?
“Each market area, across the country, is unique with many components figuring into how waste and recycling is managed.”
♦ Question: Are you familiar with the recent court case between MRI and the city of
Minneapolis? Specifically the judge’s ruling that required the City to follow the procedures of the Organized Collection Statute?
How does NSWMA believe that ruling affects open versus organized collection? How does NSWMA believe that ruling affects future collection procurement
processes for cities that already have a single hauler under contract, but the contract term is nearing completion?
R - Analysis of Waste Collection Service Arrangements.doc Foth Infrastructure & Environment, LLC • 45 June 2009
“NSWMA believes in an open competitive market. However, should a community decide to consider government managed collection; the statute must be followed as the judge has ruled in this case.”
♦ Question: How would you change the Organized Collection Statute?
“If cities are allowed to eliminate competition through this statute, the municipality should be required to justly compensate the haulers that would be displaced. NSWMA remains supportive of privatization and an open market.”
♦ Question: What else do you want to cover?
“The hauler community, now more ever, is prepared to meet the challenges of an environmentally sound, cost effective garbage and recycling collection system. Government must stop attempting to control the market yet continue to develop reasonable environmental regulations that truly meet the goals of its citizens.”
2.6.2 League of Minnesota Cities (LMC) The LMC is the statewide organization representing city interests in collective programs, services and advocacy at the State Capitol. LMC has been involved with the issue of “organized collection vs. open hauling” of solid waste for many years. The common findings of cities discussed elsewhere in this report are repeated in LMC’s own policy document on the issue of organized collection. The LMC 2009 City Policies (November 2008) state:
“The reasons for implementing organized collection can vary, but include:
♦ Public safety concerns caused by the number and frequency of large trucks moving quickly through residential neighborhoods.
♦ Reducing wear on public infrastructure from heavy truck traffic.
♦ Improving the efficiency, cost and quality of garbage and recycling service provided to
local residents.
♦ Cooperating with other local governments to best meet solid waste management and recycling objectives.
♦ Taking local steps to reduce energy impacts of public services.
♦ Meeting the requirements of county ordinances and solid waste management plans as
required under Minn. Stat. § 115.94.”
LMC has provided technical assistance and legal advice to member cities that have attempted to move towards organized collection. LMC has observed the same predominant pattern as to the outcome of these local initiatives as discussed in earlier sections of this report. Furthermore, LMC has historically opposed the weakening by the Minnesota Legislature of city authority to organize solid waste and recycling collection systems.

46 •Foth Infrastructure & Environment, LLC R - Analysis of Waste Collection Service Arrangements.doc June 2009
The LMC 2009 Policies further state that:
“Despite all of these important and valid reasons for using organized collection, legislation has been discussed in several recent sessions (as introduced on behalf of the waste hauling industry) that would allow special takings claims by the solid waste industry if local governments make decisions that limit the number of companies that can collect garbage in a community in a manner that prevents a company currently operating in the community from continuing to do so through the implementation of organized collection.”
This issue of compensating a solid waste hauler for lost business has become known as “inverse condemnation”. While such inverse condemnation legislative initiatives have been introduced in past sessions, they have not been successfully passed or enacted. In response to these debates at the State Capitol, LMC’s 2009 Policy further states:
“The League of Minnesota Cities opposes efforts to apply inverse condemnation claims to city solid waste contracting decisions. Further, the League of Minnesota Cities supports the current state policy that organized collection is a valuable tool as part of a comprehensive solid waste and recycling management program and recognizes the need to protect and preserve the authority of cities to adopt solid waste service contracts that protect public safety, the environment and public infrastructure.”
2.6.3 Minnesota Inter-County Association (MICA) Policies
MICA has a similar policy that supports existing county authority to help manage solid waste. In its packet, MICA 2008 Legislative Recommendations on “Tax & Revenue” issues, MICA stated that:
“The MICA Board of Directors urges the legislature to oppose efforts to authorize the inverse condemnation of private property whose owners contend they are adversely affected by government regulation.”
“Recently, the solid waste industry has pushed legislation that would require local governments to condemn their businesses if they were adversely affected by “organized hauling,” where the local government designates or negotiates with a specific hauler to provide solid waste disposal services to its residents. The reason a local government may wish to set up organized hauling is two-fold. First, it can save money for its residents. Second, it allows counties to meet their state-mandated obligations to manage solid waste in an environmentally sound manner. No county is presently using organized hauling but they need that option, if only to get the solid waste industry to negotiate acceptable disposal practices and to maintain the economic viability of the incinerators and RDF facilities that the counties built in response to state mandates.” [Source: http://www.mica.org/rec88.html and then more specifically: http://www.mica.org/TAX.html]

R - Analysis of Waste Collection Service Arrangements.doc Foth Infrastructure & Environment, LLC • 47 June 2009
2.6.4 Association of Minnesota Counties (AMC) AMC has a similar policy that supports existing local government authority to help manage solid waste. In its 2009 – 2010 Legislative Policy Positions, AMC stated that:
“AMC opposes “inverse condemnation” legislation that would restrict the ability of local governments to implement organized waste collection.”
[Source: http://www.amc.org http://www.mncounties.org/intergovernmental_services.htm and then more specifically: http://www.mncounties.org/Intergovernmental_Services/2009-2010platform_Dec08.pdf]
2.6.5 Minnesota Solid Waste Administrators Association (SWAA)
SWAA has a similar policy that supports existing local government authority to help manage solid waste. In its 2009 Policy Platform, under the issue titled “Inverse Condemnation”, SWAA stated that:
“SWAA opposes any legislation which would further restrict, hinder, or impair a local unit of government’s ability to organize waste collection services, or require a Local Unit of Government (LGU) to compensate a private waste hauler for claimed lost business due to LGU’s decision to organize waste collection. LGU’s were given the authority to organize waste collection services and the responsibility to provide for waste management programs within their regions under MS115A and MS145A, in order to provide for the health, safety, and welfare of its citizens and to protect the environment.”
[Source: http://www.mncounties2.org/swaa/ and then more specifically: http://www.mncounties2.org/swaa/SWAA%202009%20Policy%20Platform.pdf]
2.6.6 Solid Waste Management Coordinating Board (SWMCB)
SWMCB has a similar policy that supports existing local government authority to help manage solid waste. In its SWMCB 2009 Legislative Package (approved December 17, 2008), under the issue titled “8. Streamlining the Designation and Organized Collection Process”, SWCB stated that:
“The SWMCB supports streamlining existing legislative processes to implement designation by counties and organized collection by counties or cities.” [Source: http://www.swmcb.org/ and then more specifically: http://www.swmcb.org/legislative_action]
These LMC, MICA, AMC, SWAA and SWMCB positions represent local government opposition to the concept of inverse condemnation in general and support of local authority to organize solid waste collection in particular.

48 •Foth Infrastructure & Environment, LLC R - Analysis of Waste Collection Service Arrangements.doc June 2009
3 Municipal Survey The project work plan for this study included surveying Minnesota cities with a population over 10,000 with a target of 50 cities to complete the survey. The surveys included open and organized residential solid waste and recyclable material collection arrangements. In an open collection system residents are allowed to choose their own hauler, usually from a list of haulers that are licensed to work within the city. In an organized system the city either uses municipal crews or has a contract with a private company to perform residential collection for the entire city. In some instances the city may contract with more than one private hauler for residential collection and break the city into zones for each contracted hauler. Another similar option is to contract with a consortium of haulers so that the city has only one contract to administer. To obtain the information requested in the work plan the following information was required to be part of the survey:
♦ Point of contact; ♦ Type of Municipal Solid Waste (MSW) and recyclable material collection system;
♦ The number and names of haulers in each city conducting residential waste and
recyclable material collection;
♦ Whether or not the city licenses haulers;
♦ Rate and volume information; and
♦ Experiences of cities establishing their collection system, describing difficulties or barriers in the system’s implementation.
A copy of the municipal survey is provided in Appendix A. The following summarizes the survey information relative to the project work plan. 3.1 Introduction A municipal survey was developed and sent to 83 cities in Minnesota that have a population of 10,000 or more. The survey consisted of mostly yes/no questions inquiring about the residential MSW and recyclable material collection systems of the cities. The LMC provided points of contact and addresses for the cities. Once the completed survey was received, the responses for each city were reviewed and entered into a summary matrix. Based on the responses, the city may have been contacted to clarify and/or obtain additional information to attempt to achieve 50 fully completed responses. The level of follow up was determined by comparing the cities’ responses with a list of follow-up questions that were developed by Foth and the MPCA. The majority of the cities that were contacted to provide follow-up information were contacted by email.
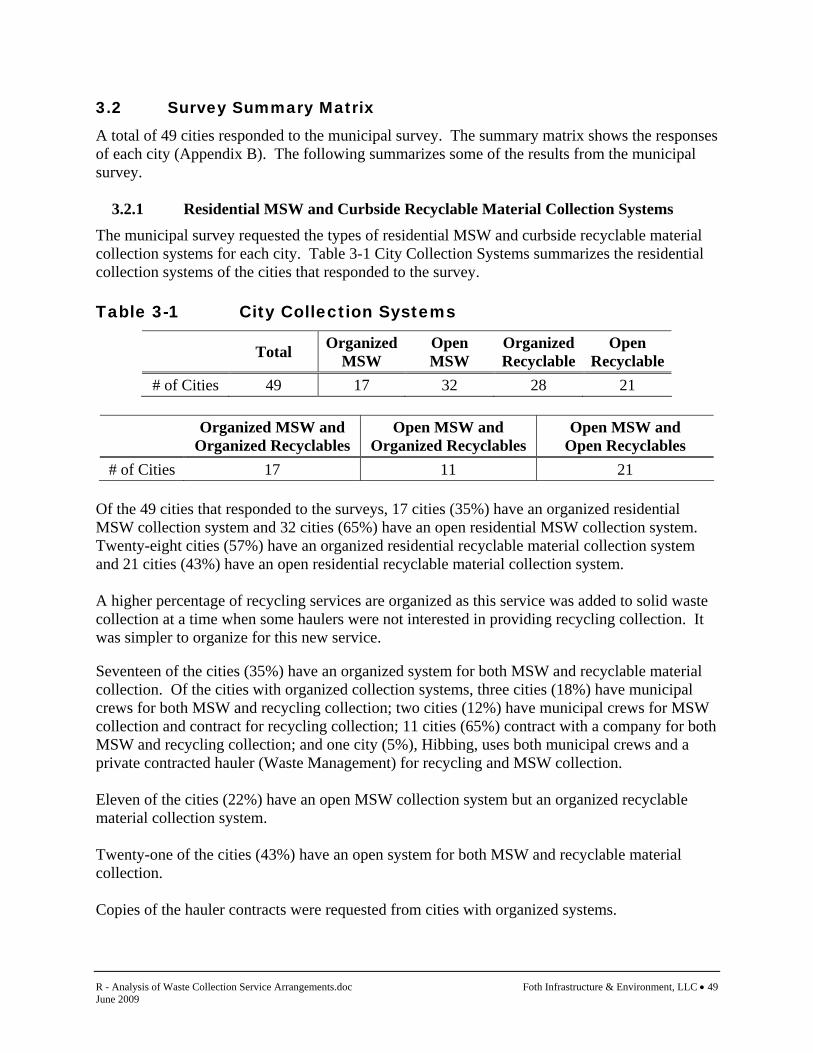
R - Analysis of Waste Collection Service Arrangements.doc Foth Infrastructure & Environment, LLC • 49 June 2009
3.2 Survey Summary Matrix A total of 49 cities responded to the municipal survey. The summary matrix shows the responses of each city (Appendix B). The following summarizes some of the results from the municipal survey.
3.2.1 Residential MSW and Curbside Recyclable Material Collection Systems The municipal survey requested the types of residential MSW and curbside recyclable material collection systems for each city. Table 3-1 City Collection Systems summarizes the residential collection systems of the cities that responded to the survey. Table 3-1 City Collection Systems
Total Organized MSW
Open MSW
Organized Recyclable
Open Recyclable
# of Cities 49 17 32 28 21
Organized MSW and Organized Recyclables
Open MSW and Organized Recyclables
Open MSW and Open Recyclables
# of Cities 17 11 21 Of the 49 cities that responded to the surveys, 17 cities (35%) have an organized residential MSW collection system and 32 cities (65%) have an open residential MSW collection system. Twenty-eight cities (57%) have an organized residential recyclable material collection system and 21 cities (43%) have an open residential recyclable material collection system. A higher percentage of recycling services are organized as this service was added to solid waste collection at a time when some haulers were not interested in providing recycling collection. It was simpler to organize for this new service. Seventeen of the cities (35%) have an organized system for both MSW and recyclable material collection. Of the cities with organized collection systems, three cities (18%) have municipal crews for both MSW and recycling collection; two cities (12%) have municipal crews for MSW collection and contract for recycling collection; 11 cities (65%) contract with a company for both MSW and recycling collection; and one city (5%), Hibbing, uses both municipal crews and a private contracted hauler (Waste Management) for recycling and MSW collection. Eleven of the cities (22%) have an open MSW collection system but an organized recyclable material collection system. Twenty-one of the cities (43%) have an open system for both MSW and recyclable material collection. Copies of the hauler contracts were requested from cities with organized systems.

50 •Foth Infrastructure & Environment, LLC R - Analysis of Waste Collection Service Arrangements.doc June 2009
3.2.2 Residential Hauler Licenses Licensing haulers provides a tool for cities and counties to require haulers to report data that can be used to monitor programs and better manage solid wastes within their municipality. The municipal survey included a yes/no question asking if the cities licensed residential MSW or recyclable material haulers. Table 3-2 MSW and Recyclable Material Hauler Licenses provides summary totals. The majority of the cities surveyed license waste haulers to provide residential MSW collection services in the city. Most cities that license residential MSW haulers also license residential recyclable material haulers. Also, most cities that do not license residential MSW haulers also do not license residential recyclable material haulers. Table 3-2 MSW and Recyclable Material Hauler Licenses
Collection System
License MSW
Haulers
Do Not License MSW
Haulers
Collection System
License Recyclable Material Haulers*
Do Not License
Recyclable Haulers*
Organized MSW 13 4 Organized
Recyclable 16 11
Open MSW 30 2 Open
Recyclable 11 9
*Two cities did not respond to the recycling portion of this question. Of the 17 cities that have an organized MSW collection system, 13 cities (76%) license MSW haulers and four cities (24%) do not require haulers to be licensed. Some cities that have an organized residential MSW collection system license MSW haulers for commercial collection. Of the 32 cities that have an open MSW collection system, 30 cities (94%) license residential MSW haulers and two cities (6%) do not require haulers to be licensed. Of the 28 cities that have an organized recyclable material collection system, 16 cities (57%) license residential recyclable material haulers and 11 cities (39%) do not. Of the 21 cities that have an open recyclable material collection system, 11 cities (52%) license recyclable material haulers and nine cities (43%) do not. Note the percentages for licensing recyclable material haulers does not add up to 100% because two cities did not respond to the recycling portion of this question. Some of the cities that responded that they license MSW haulers but not recyclable material haulers mentioned that that they do not separately license recyclable material haulers from MSW haulers (thus the single license covers both). The licensed MSW haulers are expected to also provide recycling for residents. Participants with that comment were tallied as a “yes” response to licensing recyclable material haulers in the survey matrix. Other participants who answered no to this question but did not elaborate on their response could have misinterpreted the question in a similar manner.

R - Analysis of Waste Collection Service Arrangements.doc Foth Infrastructure & Environment, LLC • 51 June 2009
A list of haulers licensed for residential MSW and recyclable material collection in each city are identified in Appendix C. 3.3 Rate Information Rate information was sought to provide data for comparisons between different collection system arrangements. The municipal survey included a yes/no question asking if cities wanted to participate in a billing statement survey to compare residential MSW and recycling service costs between cities. If the city responded yes to this question a separate survey was sent to the city contact for distribution among city staff. The billing survey requested the breakdown of costs (garbage service, taxes, surcharges, recycling, yard wastes, bulky wastes, and other) associated with MSW and recycling services at the participant’s home. Some cities noted they were interested in participating in this survey but did not provide any responses to the survey. The cities that did participate provided a range of a single response to several responses to the survey. A copy of the billing survey is provided in Appendix A. As part of their participation in the “In-depth” analysis, the city of St. Paul actively participated in the billing survey with the public works department distributing the survey requesting participation by employees. The rate information is included in this section to provide a broader data base. Rate data from other “In-depth” cities is also provided to broaden the data base. Additional rate data was gathered by reviewing contracts that were provided by cities with organized systems. To gather more rate information Foth distributed the survey among local Foth employees. As part of the billing survey, participants were asked to submit their latest refuse/recycling bill to provide the most accurate billing data possible. Some participants provided copies of their actual bill and other participants only provided the rate data without a copy of their bill. A total of 157 billing survey responses were received from both the municipal survey participants and the in-depth cities. Some of the billing information was collected from city and hauler websites to verify information or obtain information for cities that did not have any billing survey responses. Ninety-seven of the survey responses are from cities with an open MSW collection system. Sixty survey responses are from cities with an organized MSW collection system. It should be noted that this survey methodology was not a scientific process and that there are many variables that affect pricing. This limits application to other areas around the state. Even so, the survey provides interesting data. A summary matrix of the rate data is provided in Appendix D. Haulers are coded by number rather than specific haulers listed by name. This matrix is separated into two categories, cities with open MSW collection systems and cities with organized MSW collection systems. Some of the cities with open collection systems have organized recyclable material collection and others have an open recyclable material collection system. In a system that has open MSW and open recyclable material collection systems, the resident’s chosen MSW hauler also provides their recycling service. Each line in the table represents rate data for a particular city and a particular hauler. The costs for the different levels of service (generally 30, 60 and 90 gallon containers and commonly each size container has variations such as the 30 gallon container sizes range from 30 to 35 gallons)
52 •Foth Infrastructure & Environment, LLC R - Analysis of Waste Collection Service Arrangements.doc June 2009
are shown for each city and hauler. The breakdowns of the costs are shown for each service using the best data provided. In some instances, for the cities with an open MSW collection system, more surveys were returned for one level of service than another for a particular hauler. For example, in Woodbury, surveys were returned with rate data for three different haulers. The rate information provided for one hauler is for the 90 gallon container service. The rate information provided for the second hauler is for the 30 gallon container service. Two surveys were returned with rate information for the 60 gallon container and two for the 90 gallon container service for the third hauler. Also, in some instances, only data for one service level was provided for a particular city and a particular hauler. For example, only data for the 60 gallon service was received for Eagan, but from three households and two different haulers.
3.3.1 Comparisons The cost for the different service levels vary by city and by hauler. Generally speaking, the 30 gallon container service is the lowest rate and the 90 gallon container service is the highest rate. A city with an open MSW collection system usually has multiple haulers that charge residents a range in rates for the same basic service. For example, 45 surveys were received from residents in the city of St. Paul (open MSW collection system and an organized recyclable material collection system). St. Paul contracts with Eureka Recycling for residential recyclable material collection service. The average monthly cost per household paid by St. Paul to Eureka for recycling services was reported by the City to be $2.25. (Eureka is paid by the ton recycled rather than by household). Of the 45 surveys completed for the city of St. Paul, there are 13 of the 17 different MSW haulers represented and each hauler charges a different rate for the different levels of garbage service. Table 3-3 shows a range of a sample of monthly rates charged to residents for garbage collection services from each hauler reported in St. Paul. These rates include taxes, solid waste fees, and surcharges paid to the haulers as provided by the participants. The rates do not include yard wastes or bulky wastes. The monthly rates in Table 3-3 also do not include the $2.25 that is charged each month for recycling collection. One resident who uses Hauler H for garbage collection pays $16.00 per month for the 30 gallon container service. Another resident who uses Hauler K pays $41.00 per month for the 30 gallon container service.

R - Analysis of Waste Collection Service Arrangements.doc Foth Infrastructure & Environment, LLC • 53 June 2009
Table 3-3 Residential Monthly Garbage Rates from Various Haulers in St. Paul (does not include recycling cost which is paid
separately)
MSW Hauler 30 Gallon 60 Gallon 90 Gallon Hauler A -- $22.76 -- Hauler B $16.34 -- -- Hauler C -- $17.84 -- Hauler D -- $22.49 -- Hauler E $21.75 $27.60 -- Hauler F $22.38 $20.60 -- Hauler G -- -- $26.99 Hauler H $16.00 -- -- Hauler I $26.73 -- $34.91 Hauler J -- $15.15 -- Hauler K $41.00 $45.51 $36.83 Hauler L $22.83 $30.72 $26.18
In addition to the inconsistencies in rates between haulers for the same level of service, there are inconsistencies between rates charged to residents by the same hauler for the same level of service. Table 3-4 summarizes four haulers that provide residential MSW collection services in Eagan, St. Paul and Woodbury. The rates provided in the table were provided by different residents of the cities. These rates include taxes, solid waste fees, and surcharges as provided by the participants ($2.25 added to St. Paul for organized recycling).

54 •Foth Infrastructure & Environment, LLC R - Analysis of Waste Collection Service Arrangements.doc June 2009
Table 3-4 Range of Residential Monthly Rates from Same Hauler in Same Open City
MSW Hauler 30 Gallon 60 Gallon 90 Gallon Eagan Hauler A -- $16.98 -- Hauler A -- $30.06 -- St. Paul1 Hauler B $24.63 -- -- Hauler B $29.80 -- -- St. Paul1 Hauler C $39.24 $47.76 $39.08 Hauler C $22.87 -- $29.75 Hauler C $21.50 -- -- Hauler C -- $48.32 -- Hauler C $43.25 -- -- Hauler C -- $18.29 -- St. Paul1 Hauler D $25.08 $32.97 -- Hauler D -- $9.60 -- Woodbury Hauler E -- $18.12 $25.22 Hauler E -- $13.92 $21.18
1 St. Paul rates include the recycling cost to contract hauler. There is one particular “outlier” of note –included in the table above. A resident reported paying $7.35 per month ($2.25 per month for recycling, brings the total to $9.60 per month). In follow-up, this resident noted he had a “teaser rate” which will increase next year. Often MSW haulers work in several cities around Minnesota. The hauler likely charges different rates to residents of different cities for the same basic services. Table 3-5 summarizes the differences in rates charged to residential customers by one hauler, who operates in different cities. Differences can be attributed to many variables such as economies of scale (more stops reduce cost per household), differences in tipping fees, and even whether the hauler pays the tipping fee or the city pays it directly, different hauling distances, different related services built into monthly rates/versus separate rates for services such as bulky waste pick-up.

R - Analysis of Waste Collection Service Arrangements.doc Foth Infrastructure & Environment, LLC • 55 June 2009
Table 3-5 Range of Monthly Rates Paid to a Hauler by Residents (open) & Cities (organized)
City 30 Gallon 60 Gallon 90 Gallon Open MSW Collection Systems (without taxes)
Chanhassen -- $14.50 -- Eagan -- $16.01 -- Eagan -- $28.06 -- Plymouth $20.91 -- -- St. Paul -- $30.80 -- St. Paul -- $9.08 --
Organized MSW Collection Systems (contract prices – no taxes) Community A $10.56 $11.40 $12.75 Community B $8.89 $9.04 $9.18 Community C $5.56 $5.56 -- Community D $9.66 $11.09 $12.51 Community E $12.87 $15.07 $17.49
Table 3-6 shows the average monthly costs associated with open versus organized collection systems. These averages include garbage service, taxes, surcharges, and recycling service fees as provided by the survey participants, city websites, contracts and discussions with city contacts. Table 3-6 Average Monthly Service Rates Charged to
Residents
Average Monthly Rate Collection System 30 Gallon 60 Gallon 90 Gallon Organized MSW $14.83 $16.98 $22.23 Open MSW $22.64 $25.46 $26.50 Difference $7.81 $8.48 $4.27 % Change +53% +50% +19%
The average cost per household per month for organized MSW collection service is less than open MSW collection service for all levels of service (30, 60 and 90 gallon containers). The average difference between the organized system charges to residents for each service level (30, 60 and 90 gallons) and the open system charges is 19% to 53% higher in open systems for each service level. Rates charged to residents on hauler or city utility bills do not equate to the rates actually paid to haulers. There are taxes paid to haulers that must be remitted by haulers to the state and counties. When cities handle billing, they oftentimes recover administrative costs and funds for other related municipal services (e.g., drop-off sites and road maintenance). Table 3-7 shows the

56 •Foth Infrastructure & Environment, LLC R - Analysis of Waste Collection Service Arrangements.doc June 2009
average monthly amounts credited to the haulers in open versus organized systems. Generally in an open city, the rate credited to the hauler is the rate charged to residents less any taxes. Payments to haulers are higher in open versus organized systems with the percent change ranging from 32% to 64%. Table 3-7 Average Monthly Service Rates Credited to Haulers
Average Monthly Rate Collection System 30 gallon 60 gallon 90 gallon
Organized MSW (contract prices) $11.72 $13.22 $16.70 Open MSW (without taxes) $19.25 $20.94 $21.99 % Change +64% +58% +32%
3.3.2 Variations in Selected Organized Cities Rates and Service Levels The contract between a hauler and a city associated with organized systems often include additional information describing the additional services provided for the city and the city’s residents by the hauler. The information below briefly summarizes the contract terms and additional services for some of the 18 organized cities. Robbinsdale Robbinsdale has a contract for MSW and recyclable material collection with Waste Management. The rate structure for collection services in their new contract beginning January 1, 2008 and the utility billing structure for the City provide a good example of the potential efficiencies provided by having an organized system. The city of Robbinsdale’s contract provides for weekly collection of refuse; every other week collection of recyclables in a single-stream; unlimited collection of yard wastes from April 15th through November 15th; disposal of one Christmas tree per year; and collection of large items such as furniture and appliances. The contract also provides for collection at six (6) City-owned facilities at no cost to the City (City Hall, Police & Fire Station, etc.). The hauler is required to maintain three different size City-owned containers and provide them to residents as requested. The carts are 32 gallon, 64 gallon and 96 gallons in size. The hauler pays all disposal and processing costs. There is no revenue sharing formula for recyclables. The contract requires reporting of the tonnages for refuse, recyclables, and yard wastes and delivery of the refuse to the Hennepin County directed facility. The monthly rates paid by the City to Waste Management in 2008 are as follows: Refuse Yard Waste Single-sort Recycling ♦ 32 gallon service = $7.09 ♦ 64 gallon service = $8.52 ♦ 96 gallon service = $9.94
♦ 2008 = $2.53 ♦ 2009 = $2.60 ♦ 2010 = $2.67 ♦ 2011 = $2.75 ♦ 2012 = $2.83
♦ 2008 = $2.57 ♦ 2009 = $2.64 ♦ 2010 = $2.71 ♦ 2011 = $2.79 ♦ 2012 = $2.87

R - Analysis of Waste Collection Service Arrangements.doc Foth Infrastructure & Environment, LLC • 57 June 2009
Thus, in 2008, the monthly cost to Robbinsdale from Waste Management to service a household with a 64 gallon refuse cart is $13.62 ($8.52 plus $2.53, plus $2.57). This cost covers garbage collection, recycling (including provision of the cart), unlimited yard waste, one Christmas tree and bulky items. The contract has a built in adjustment for diesel fuel prices as follows:
Diesel Fuel Price per Gallon Fuel Surcharge
♦ <$3.00 0 percent ♦ $3.00 to $3.24 2 percent ♦ $3.25 to $3.49 4 percent ♦ $3.50 and up 6 percent
Thus, if the fuel price was above $3.50 for a month, the total paid per household to Waste Management for 64 gallon refuse service with recycling and yard waste is $14.44 per month. The only additional cost provided in the contract is a fee of $35.00 to Waste Management to collect a white goods item. The City bills households for the solid waste collection service on the City utility bills. The monthly rates for 2008 are as follows:
♦ 32 gallon (incl. taxes) = $19.19 ♦ 64 gallon (incl. taxes) = $21.81 ♦ 96 gallon (incl. taxes) = $24.61
The City also sells stickers to residents to allow residents to dispose of large items that do not fit in their cart. The stickers are $1.00 each with the following schedule applicable to sticker use:
♦ 1 sticker – Bag or box bundle or item under 30 pounds beyond what the cart holds ♦ 5 stickers – Non-appliance items (small furniture, full size mattress, door, sink, etc.) ♦ 10 stickers – Non-appliance items (large furniture, sofa, queen mattress, water softener,
bathtub, etc.) ♦ 35 stickers – Appliances (stove, washer, microwave, air conditioner, refrigerator, etc.)
The only bulky item noted in the contract that Waste Management is paid extra for are the appliances. Using the 64 gallon service again for comparison purposes, the total cost to the City with the fuel surcharge was estimated at $14.44 per month versus the monthly payment collected on the City utility bill of $21.81 per month (a difference of $7.37 per month – approximately 50%). The additional funds cover:
♦ State taxes, county taxes and billing costs; ♦ Operation of a drop-off facility available to residents;

58 •Foth Infrastructure & Environment, LLC R - Analysis of Waste Collection Service Arrangements.doc June 2009
♦ Code enforcement related to solid wastes; and ♦ Payment to the annual CIP (capital improvement plan) for road improvements and re-
development. The City noted that garbage trucks contribute to road damage in alleys and some streets, especially problems with some alley corners. They make a transfer from the solid waste enterprise fund to the general fund to cover the additional costs for road maintenance associated with the collection of the solid wastes. A transfer of $150,000 is planned for 2009. Highlights of the city of Robbinsdale organized collection system include:
♦ Cost effective rates for: Weekly refuse collection in a three-tier volume-based rate schedule; Unlimited yard waste collection during spring, summer, and fall; Every other week recyclables collection; and Bulky item collection.
♦ City utility based fee collection system added to other utility services billing that allows
the City to generate revenues to cover road maintenance costs attributed by the City to solid waste collection trucks.
♦ Management of the solid wastes by receiving monthly reports and directing refuse to the
Hennepin County facility.
♦ No additional cost of services to the City buildings.
♦ Contracted rate increases for yard waste and recycling to control cost increases over the five-year term of the contract. Annual cost increase set at less than 3% per year.
♦ Built in, step-based, fuel adjustment clause to control cost increases associated with rising
diesel fuel prices. Percentage increase capped at 6%. Buffalo Currently Buffalo contracts with Waste Management for residential MSW and recyclable material collection services. Residents may choose from three levels of service including a 35 gallon, 65 gallon or 95 gallon service. Residents are billed for their garbage collection service by the City on their utility bill. All residents must contact Waste Management to arrange pickup of additional waste. In this case, the hauler sends the resident a bill for these additional items. Residents may take advantage of clean-up days offered by the City to dispose of appliances for a fee at a specified location. Single sort recycling for residents is included in all three service options. In addition to Waste Management providing collection services, the City staff provides some collection services. In Buffalo, City staff provides holiday tree pickup one day each year in January at no additional cost to the resident. City staff also designates one day each year to collect bagged leaves at no additional cost to the resident.
R - Analysis of Waste Collection Service Arrangements.doc Foth Infrastructure & Environment, LLC • 59 June 2009
Some additional services are included in the contract for no additional charge to the City. The cost to the hauler for these services are actually likely covered in the base rate charged to residents for their collection service. In Buffalo’s contract, all the City buildings are serviced for no additional cost to the City. In addition, all the City parks are serviced as part of the contract. The hauler also provides containers and transportation for two annual clean-up days each year. The City charges residents to dispose of items at the clean-up events and pays for disposal costs of materials collected during these days. The rates for the varying levels of service charged by the City to residents differ from that paid to the hauler. The rates charged to the residents are typically more than what the City is required to pay the hauler for the service. These differences in the costs cover administration fees and other overhead costs incurred by the City. Farmington Farmington currently uses municipal crews for residential MSW collection and contracts with Dick’s Sanitation for residential recyclable material collection. Residents may choose from several levels of service, but the common levels of service are 30 gallon, 60 gallon and 90 gallon service. Residents are billed quarterly on their utility bill by the City and are allowed to change their service level once each year at no additional charge. All residents are charged for additional waste that does not fit into their waste container. If customers overfill their containers more than 50% of the time during a quarter and do not request a level of service change, they will automatically be raised to the next level of service. During 2008 dual sort recycling was included in all four service options. Starting in 2009 the recycling will switch to single sort. Residents are also provided with holiday tree pickup, an annual curbside clean-up day, tire drop-off and cardboard drop-off at no additional cost. Residents have the choice to subscribe to yard waste pickup for which they are billed. Residents may also request curbside pick-up of bulky items for a fee. Ham Lake Ham Lake currently contracts with Ham Lake Haulers (a combination of Ace Solid Waste and Waste Management) for residential MSW and recyclable material disposal. The City is divided into two distinct service areas, each serviced by one of the shareholders. The residents are billed for collection services through Connexus, a public utility under contract with the City, on a quarterly basis on their utility bill. Residents may choose from five levels of service including a low base customer service (a single bag of refuse that fits in a container that is not furnished by the hauler), 30-38 gallon, 60-76gallon, 77-90 gallon or two container service. All residents are charged for additional refuse, electronics, bulky waste, yard waste and appliances. Residents that use these services are charged additional fees on their utility bills. Single sort recycling is also provided to residents. The City pays the haulers $8,127.50 per quarter [Select Committee on Recycling and the Environment (SCORE) funding] to cover the costs for residential curbside recycling. This averages out to approximately $0.64 per household. If for any reason these SCORE funds are eliminated, the curbside recycling program will

60 •Foth Infrastructure & Environment, LLC R - Analysis of Waste Collection Service Arrangements.doc June 2009
continue and residents will be charged an additional $0.64 on their utility bill to cover the cost for recycling services. Similar to other organized cities, the City buildings are serviced for no additional cost. In addition, City parks are serviced and the haulers are required to provide containers at each City building and park location. The haulers are also required to pick up recyclable materials that are dropped off by residents at a municipal recycling center on an as-needed basis at no additional cost to the City. This recycling center is maintained by the City. The haulers are required to report the following information to the City when requested in writing by the City.
♦ Fuel costs; ♦ Tipping fees at disposal sites for refuse; ♦ Disposal costs at disposal sites for recyclable materials; ♦ Revenue derived from recyclable materials; ♦ Labor costs; ♦ Volume of refuse and/or recyclable materials collected within the City; ♦ Copies of disposal records; ♦ The current pickup schedule for each stop; and ♦ Complaints from customers.
The rates for the varying levels of service charged to residents match the rates that are paid to the haulers. Hopkins Currently Hopkins uses municipal crews for residential MSW collection and contracts with Waste Management for recyclable material collection. Residents may choose from three levels of service including 30 gallon, 60 gallon or 90 gallon service. Residents are billed by the City for collection services on their utility bill on a monthly basis. The City also provides brush collection to residents. To use this service, residents must call to schedule a pickup as this type of collection is only provided on Tuesdays. Residents are charged an additional fee for this service based on the volume of brush collected. The City also provides residents yard waste collection the same days as garbage collection. To participate in this service, residents must purchase $2.00 stickers from the City and affix them to bags of yard waste. There is an exception to this service in the spring and fall when the City collects yard waste for free. A drop-off site is also available for residents to use to dispose of brush and yard waste free of charge. This site is not open during the winter. An additional service available to residents is bulky item pickup. Residents must call the City to schedule a pickup of bulky items as these items are only picked up on Thursdays. Residents are charged $25.00 plus tax per item. In addition, twice a year the City offers a bulky item drop-off service. Residents are charged a $20.00 fee for each appliance dropped off during these events; bulky items are free. Residents are not charged for appliances at the time of drop-off but rather charged on their next utility bill. Appliances may be collected from residents by scheduling a pickup with a separate hauler, J.R.’s Appliances Disposal, Inc. The resident will be invoiced separately for this service by the contractor. Residents may drop off appliances at the contractor’s site for $10.00 or they may
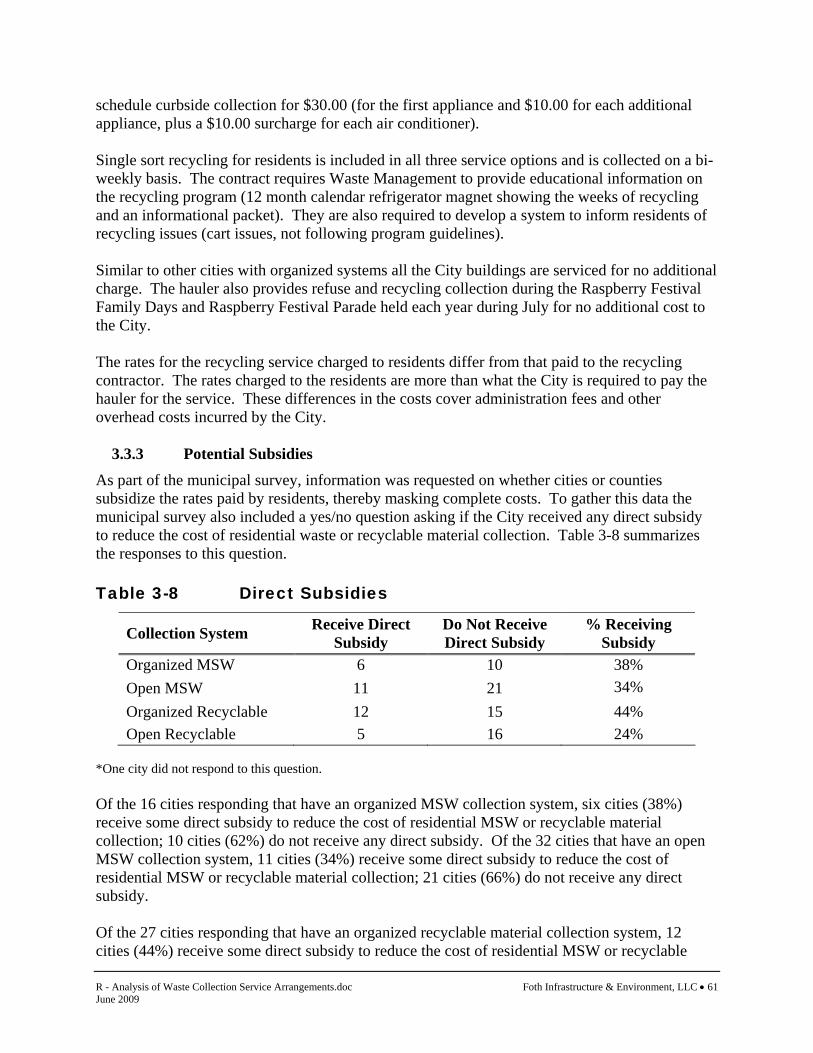
R - Analysis of Waste Collection Service Arrangements.doc Foth Infrastructure & Environment, LLC • 61 June 2009
schedule curbside collection for $30.00 (for the first appliance and $10.00 for each additional appliance, plus a $10.00 surcharge for each air conditioner). Single sort recycling for residents is included in all three service options and is collected on a bi-weekly basis. The contract requires Waste Management to provide educational information on the recycling program (12 month calendar refrigerator magnet showing the weeks of recycling and an informational packet). They are also required to develop a system to inform residents of recycling issues (cart issues, not following program guidelines). Similar to other cities with organized systems all the City buildings are serviced for no additional charge. The hauler also provides refuse and recycling collection during the Raspberry Festival Family Days and Raspberry Festival Parade held each year during July for no additional cost to the City. The rates for the recycling service charged to residents differ from that paid to the recycling contractor. The rates charged to the residents are more than what the City is required to pay the hauler for the service. These differences in the costs cover administration fees and other overhead costs incurred by the City.
3.3.3 Potential Subsidies As part of the municipal survey, information was requested on whether cities or counties subsidize the rates paid by residents, thereby masking complete costs. To gather this data the municipal survey also included a yes/no question asking if the City received any direct subsidy to reduce the cost of residential waste or recyclable material collection. Table 3-8 summarizes the responses to this question. Table 3-8 Direct Subsidies
Collection System Receive Direct Subsidy
Do Not Receive Direct Subsidy
% Receiving Subsidy
Organized MSW 6 10 38% Open MSW 11 21 34% Organized Recyclable 12 15 44% Open Recyclable 5 16 24%
*One city did not respond to this question. Of the 16 cities responding that have an organized MSW collection system, six cities (38%) receive some direct subsidy to reduce the cost of residential MSW or recyclable material collection; 10 cities (62%) do not receive any direct subsidy. Of the 32 cities that have an open MSW collection system, 11 cities (34%) receive some direct subsidy to reduce the cost of residential MSW or recyclable material collection; 21 cities (66%) do not receive any direct subsidy. Of the 27 cities responding that have an organized recyclable material collection system, 12 cities (44%) receive some direct subsidy to reduce the cost of residential MSW or recyclable

62 •Foth Infrastructure & Environment, LLC R - Analysis of Waste Collection Service Arrangements.doc June 2009
material collection; 15 cities (56%) do not receive any direct subsidy. Of the 21 cities that have an open recyclable material collection system, five cities (24%) receive some direct subsidy to reduce the cost of residential MSW or recyclable material collection; 16 cities (76%) do not receive any direct subsidy. Some participants added comments after answering this question. Below is a summary of the comments from participants that receive a direct subsidy to reduce the cost of residential MSW or recyclable material collection. The lists are separated into sections based on the type of collection systems. Open MSW/Open Recycling
♦ Bloomington – A Hennepin County rebate is passed directly back to residents on their utility bill
Open MSW/Organized Recycling
♦ Minnetonka – Hennepin County recycling grant ♦ Roseville – SCORE grant
Organized MSW/Organized Recycling ♦ Elk River – Subsidized tipping fee ♦ Ham Lake – SCORE grant ♦ Hopkins – SCORE grant
Below is a summary of the comments from participants that do not receive any direct subsidies to reduce the cost of residential MSW or recyclable material collection. The lists are separated into sections based on the type of collection systems. Open MSW/Open Recycling
♦ Savage – Receive grant money from the County for an annual recycling day
Open MSW/Organized Recycling ♦ Ramsey – SCORE grant is used for education purposes not to offset residential costs
Organized MSW/Organized Recycling ♦ Columbia Heights – Indirectly from Anoka County
3.3.4 County Service Fees
The municipal survey also included a yes/no question asking if the county had a solid waste service fee in place (property tax or hauler collected). Table 3-9 summarizes the responses to this question.

R - Analysis of Waste Collection Service Arrangements.doc Foth Infrastructure & Environment, LLC • 63 June 2009
Table 3-9 County Solid Waste Service Fee
Collection System County Solid Waste Service Fee
No County Solid Waste Service Fee
Organized MSW 16 0 Open MSW 18 13 Organized Recyclable 25 2 Open Recyclable 9 11
*Two cities did not respond to this question. All of the cities that have an organized MSW collection system that responded to this question have a County solid waste service fee. Of the 31 responding cities that have an open MSW collection system, 18 cities (58%) reported to have a County solid waste service fee; 13 cities (42%) reported no fee. There is a possibility that reporting cities may not be aware of all MSW subsidies. Of the 27 responding cities that have an organized recyclable material collection system, 25 cities (93%) have a county solid waste service fee; two cities (7%) do not have a fee. Of the 20 responding cities that have an open recyclable material collection system, nine cities (45%) have a county solid waste service fee; 11 cities (55%) do not have a fee. Organized cities are far more likely to have county solid waste service fees than open cities. 3.4 Comments from Municipal Survey Parts of this study attempted to gain information regarding municipal experiences with different collection approaches to determine their effectiveness. Selected case studies were covered in Section 2.4.3. The municipal survey included a yes/no question asking cities if they had experience establishing an open or organized residential collection system. If participants responded yes to this question, Foth followed-up with the city contact and requested them to elaborate on their response. A list of responses is included in Appendix E. The municipal survey also sought any insight on ways to improve management of collection systems. The billing survey also included an open ended question asking if any changes could be made to help improve the cities’ existing MSW and recycling collection services (legislation, incentives, etc.). Some city staff that participated in the billing survey provided opinions on how their existing services could be improved. A list of these responses is also included in Appendix E. One of the commonly cited concerns for open systems is related to the impacts of truck traffic. The municipal survey included a yes/no question asking cities if their public works department had expressed opinions with respect to collection vehicle traffic impacts. If participants responded yes to this question, Foth followed-up with the city contact and requested them to elaborate on their response. A list of these responses is also included in appendix E.

64 •Foth Infrastructure & Environment, LLC R - Analysis of Waste Collection Service Arrangements.doc June 2009
3.5 Management Several of the municipal survey questions pertained to data collection and overall management, of solid waste and recyclables by municipalities. 3.5.1 Analysis of Recycling Program Performance Data using Re-TRAC The SWMCB has contracted with Emerge Knowledge Design for on-line recycling data management services known as Re-TRACTM. The objective of Re-TRAC is to provide a convenient, standardized data base so that counties and cities can store and retrieve their recycling program performance data for later comparative analysis. Foth analyzed the recycling performance data from the Re-TRAC system to determine if there is any significant difference between communities within three different collection system categories:
♦ Open MSW/Open Recycling ♦ Open MSW/Organized Recycling ♦ Organized MSW/Organized Recycling
It is notable that there are no cities with an “Organized MSW/Open Recycling” collection system. Appendix F displays the data analysis details within each of the three collection system categories. The four page table is sorted by collection system category, then by County (within the SWMCB Region) and then by community. The table is generated from 2007 recycling data as reported by municipalities and SWMCB Counties using the on-line Re-TRAC system. Only the six metro SWMCB Counties are using the Re-TRAC recycling system at this time. Thus, similar and directly comparable data from other communities is not yet available. Comparable Re-TRAC data was available from 110 communities (including two multi-city groups of cities cooperating on curbside recycling collection programs).

R - Analysis of Waste Collection Service Arrangements.doc Foth Infrastructure & Environment, LLC • 65 June 2009
Figure 3-1 Re-TRAC Data by Collection System Type (2007)
460
480
500
520
540
560
580
600
Open MSW, Open Recycling Open MSW, OrganizedRecycling
Organized MSW, OrganizedRecycling
Ann
ual A
mou
nt R
ecyc
led
per
Hou
seho
ld (l
bs)
Figure 3-1 and Appendix F indicates there is a significant increase in recycling pounds per household (“recovery rate”) in SWMCB cities with organized recycling collection programs. This data indicates that the three categories of collection systems have average recovery rates as follows:
♦ Open MSW/Open Recycling 510 pounds per household per year (N = 40 cities)
♦ Open MSW/Organized Recycling 583 pounds per household per year (N = 41 cities)
♦ Organized MSW/Organized Recycling 573 pounds per household per year (N = 29 cities)
If the last two categories of communities are combined the resulting average recovery rate is:
♦ Organized Recycling 579 pounds per household per year (Both Open/Organized MSW) (N = 70 cities)
Other studies have indicated that recycling rates are generally higher in organized recycling collection systems compared to open systems because of the following factors:

66 •Foth Infrastructure & Environment, LLC R - Analysis of Waste Collection Service Arrangements.doc June 2009
♦ Cities with organized recycling have more control over the details of the recycling system (e.g., list of materials collected; sorting instructions for residents; collection days; collection frequency; etc.).
♦ Cities with organized recycling have more control over public education tools, including
message content. Also, organized recycling contracts generally leverage more specific public education assignments both for the hauler and for the City. Recycling public education campaigns will be more cost-effective if the outreach tools are consistent in message, continuous in look/format, and concurrent with multiple public education vehicles (brochures and web pages, etc.). Thus, there will be more public education resources spent more cost-effectively.
♦ Innovative financial incentive programs such as “Get Caught Recycling” are more
feasible with organized recycling programs. Open recycling systems with different collection days are nearly impossible to independently monitor total, longer-term resident participation or even weekly / bi-weekly set-out rates.
♦ Cities with organized MSW and organized recycling have the opportunity to reach the
same residential audience with multiple service messages. For example, the trash cart can be a public education tool (e.g., variable rate pricing of MSW service levels). Also, resident phone calls about MSW collection questions can also address recycling issues at the same time.
♦ Cities with organized MSW collection can more accurately and thoroughly audit
households that do not have MSW collection service. Details of MSW versus recycling participation can also be monitored.
It is interesting to note that the Re-TRAC data in Figure 3-1 and in Appendix F indicate that there are higher recovery rates in “open MSW + organized recycling” (i.e., 583 pounds per household per year) communities compared to “organized MSW + organized recycling” systems (i.e., 573 pounds per household per year). More thorough analysis on a city-by-city, county-by-county basis would be needed to draw out any conclusions as to cause – effect for this difference. It is possible, however, that municipal recycling staff in the larger cities with “open MSW + organized recycling” systems may be able to concentrate more of their time and other resources into a more focused public education effort on improving recycling services. Another important consideration is the improvement in GHG emissions if cities were to change from open recycling to organized recycling collection programs. Using the difference noted above (579 – 510 = 69 pounds per household per year), applied to the 41 open recycling communities, another 11,000 tons of recyclables could be recovered from these cities in the Twin Cities Metropolitan Area. This is the equivalent of about 32,000 metric tons of CO2e less per year of GHG emissions.
3.5.2 Reporting Data
Obtaining data such as material quantities disposed/recycled provides information that can be used to identify potential program needs. The municipal survey included a yes/no question asking if cities required licensed residential MSW haulers to report disposal tonnages. The

R - Analysis of Waste Collection Service Arrangements.doc Foth Infrastructure & Environment, LLC • 67 June 2009
survey also included a yes/no question asking if cities required licensed residential recycling haulers to report residential recycling tonnages. Most of the cities with an organized system require haulers to report tonnages. Table 3-10 Tonnage Reporting Frequency summarizes the responses to these questions. Table 3-10 Tonnage Reporting Frequency
Collection System
Require Haulers to
Report Annual MSW
Tonnages
Do Not Require
Haulers to Report Annual MSW
Tonnages
Collection System
Require Haulers to Reported Annual
Recycling Tonnages*
Do Not Require
Haulers to Reported Annual
Recycling Tonnages*
Organized MSW 13 4 Organized
Recycling 22 5
Open MSW 11 21 Open Recycling 12 9
*One city did not respond to the recycling portion of this question. Of the 17 cities that have an organized MSW collection system, 13 cities (76%) require haulers to report annual MSW tonnages; four cities (24%) do not require haulers to report this information. Of the 32 cities with an open MSW collection system, 11 cities (34%) require haulers to report annual MSW tonnages, 21 cities (66%) do not require haulers to report this information. Of the 27 responding cities with an organized recyclable material collection system, 22 cities (81%) require recyclable material haulers to report annual recyclable material tonnages to the city or the county, five cities (19%) do not require haulers to report this information. Of the 21 cities with an open recyclable material collection system, 12 cities (57%) require recyclable material haulers to report annual recyclable material tonnages to the city or the county, nine cities (43%) do not require haulers to report this information. Organized cities are more active in requiring data regarding their recycling programs. If a city required tonnages to be reported, Foth requested data for the most recent year available. Table 3-11 and Table 3-12 show some tonnage data from cities that provided this information.

68 •Foth Infrastructure & Environment, LLC R - Analysis of Waste Collection Service Arrangements.doc June 2009
Table 3-11 Annual MSW Tonnages
Collection System & City
Reported Annual MSW Tonnages
Open MSW Burnsville 19,5701 Lakeville 19,3851 Rosemount 8,0451 Organized MSW Fergus Falls 8,4362 Ham Lake 4,6583 Little Canada 1,770 Red Wing 3,1894 St. Louis Park 8,6794
1 Data provided by Dakota County. 2 Data from January 1, 2008 through October 31, 2008. 3 Data from 2007. Based on 40.19 pounds of MSW per household per week. Served 4,458 households in 2007. 4 Data from 2007. Table 3-12 Annual Recycling Tonnages
Collection System & City
Reported Annual Recycling Tonnages
Open Recycling Andover 3,0561 Chanhassen 3,1311 Lakeville 3,5281 Rosemount 1,3301 Organized Recycling Anoka 1,2831 Crystal 1,849 Maple Grove 6,0101 New Brighton 1,6741 Roseville 3,0931 Columbia Heights 1,2991 Elk River 1,3411 Fergus Falls 2622 Ham Lake 7203 Hopkins 8621 Little Canada 594 Red Wing 2,1401 St. Louis Park 3,8111
1 Data from 2007. 2 Data from October 2007 through September 2008. 3 Data from July1, 2006 through December 31, 2006.
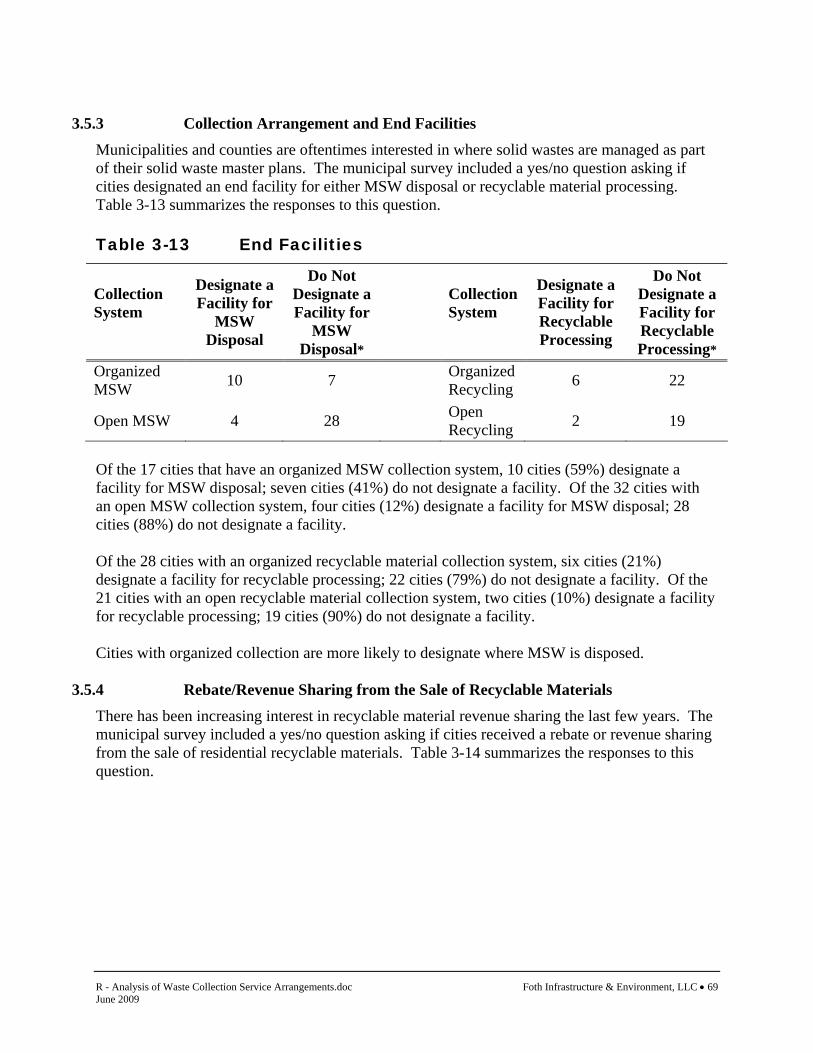
R - Analysis of Waste Collection Service Arrangements.doc Foth Infrastructure & Environment, LLC • 69 June 2009
3.5.3 Collection Arrangement and End Facilities
Municipalities and counties are oftentimes interested in where solid wastes are managed as part of their solid waste master plans. The municipal survey included a yes/no question asking if cities designated an end facility for either MSW disposal or recyclable material processing. Table 3-13 summarizes the responses to this question. Table 3-13 End Facilities
Collection System
Designate a Facility for
MSW Disposal
Do Not Designate a Facility for
MSW Disposal*
Collection System
Designate a Facility for Recyclable Processing
Do Not Designate a Facility for Recyclable Processing*
Organized MSW 10 7 Organized
Recycling 6 22
Open MSW 4 28 Open Recycling 2 19
Of the 17 cities that have an organized MSW collection system, 10 cities (59%) designate a facility for MSW disposal; seven cities (41%) do not designate a facility. Of the 32 cities with an open MSW collection system, four cities (12%) designate a facility for MSW disposal; 28 cities (88%) do not designate a facility. Of the 28 cities with an organized recyclable material collection system, six cities (21%) designate a facility for recyclable processing; 22 cities (79%) do not designate a facility. Of the 21 cities with an open recyclable material collection system, two cities (10%) designate a facility for recyclable processing; 19 cities (90%) do not designate a facility. Cities with organized collection are more likely to designate where MSW is disposed.
3.5.4 Rebate/Revenue Sharing from the Sale of Recyclable Materials
There has been increasing interest in recyclable material revenue sharing the last few years. The municipal survey included a yes/no question asking if cities received a rebate or revenue sharing from the sale of residential recyclable materials. Table 3-14 summarizes the responses to this question.
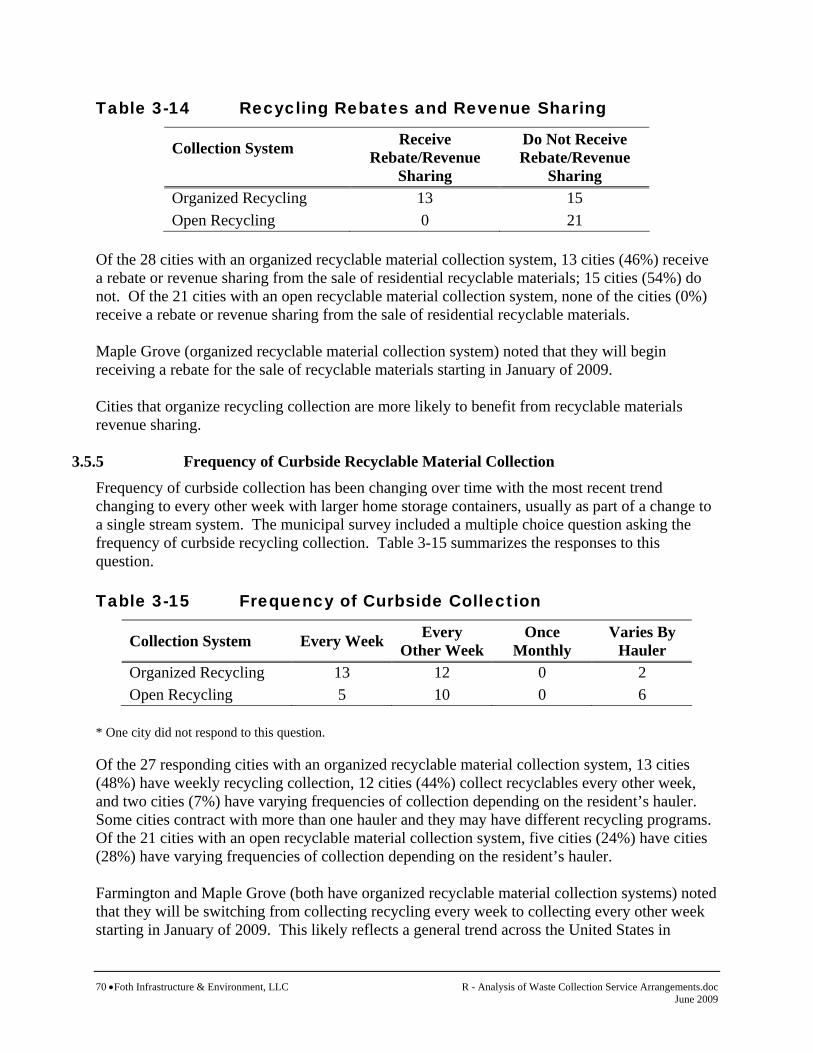
70 •Foth Infrastructure & Environment, LLC R - Analysis of Waste Collection Service Arrangements.doc June 2009
Table 3-14 Recycling Rebates and Revenue Sharing
Collection System
Receive Rebate/Revenue
Sharing
Do Not Receive Rebate/Revenue
Sharing Organized Recycling 13 15 Open Recycling 0 21
Of the 28 cities with an organized recyclable material collection system, 13 cities (46%) receive a rebate or revenue sharing from the sale of residential recyclable materials; 15 cities (54%) do not. Of the 21 cities with an open recyclable material collection system, none of the cities (0%) receive a rebate or revenue sharing from the sale of residential recyclable materials. Maple Grove (organized recyclable material collection system) noted that they will begin receiving a rebate for the sale of recyclable materials starting in January of 2009. Cities that organize recycling collection are more likely to benefit from recyclable materials revenue sharing.
3.5.5 Frequency of Curbside Recyclable Material Collection Frequency of curbside collection has been changing over time with the most recent trend changing to every other week with larger home storage containers, usually as part of a change to a single stream system. The municipal survey included a multiple choice question asking the frequency of curbside recycling collection. Table 3-15 summarizes the responses to this question. Table 3-15 Frequency of Curbside Collection
Collection System Every Week Every Other Week
Once Monthly
Varies By Hauler
Organized Recycling 13 12 0 2 Open Recycling 5 10 0 6
* One city did not respond to this question. Of the 27 responding cities with an organized recyclable material collection system, 13 cities (48%) have weekly recycling collection, 12 cities (44%) collect recyclables every other week, and two cities (7%) have varying frequencies of collection depending on the resident’s hauler. Some cities contract with more than one hauler and they may have different recycling programs. Of the 21 cities with an open recyclable material collection system, five cities (24%) have cities (28%) have varying frequencies of collection depending on the resident’s hauler. Farmington and Maple Grove (both have organized recyclable material collection systems) noted that they will be switching from collecting recycling every week to collecting every other week starting in January of 2009. This likely reflects a general trend across the United States in
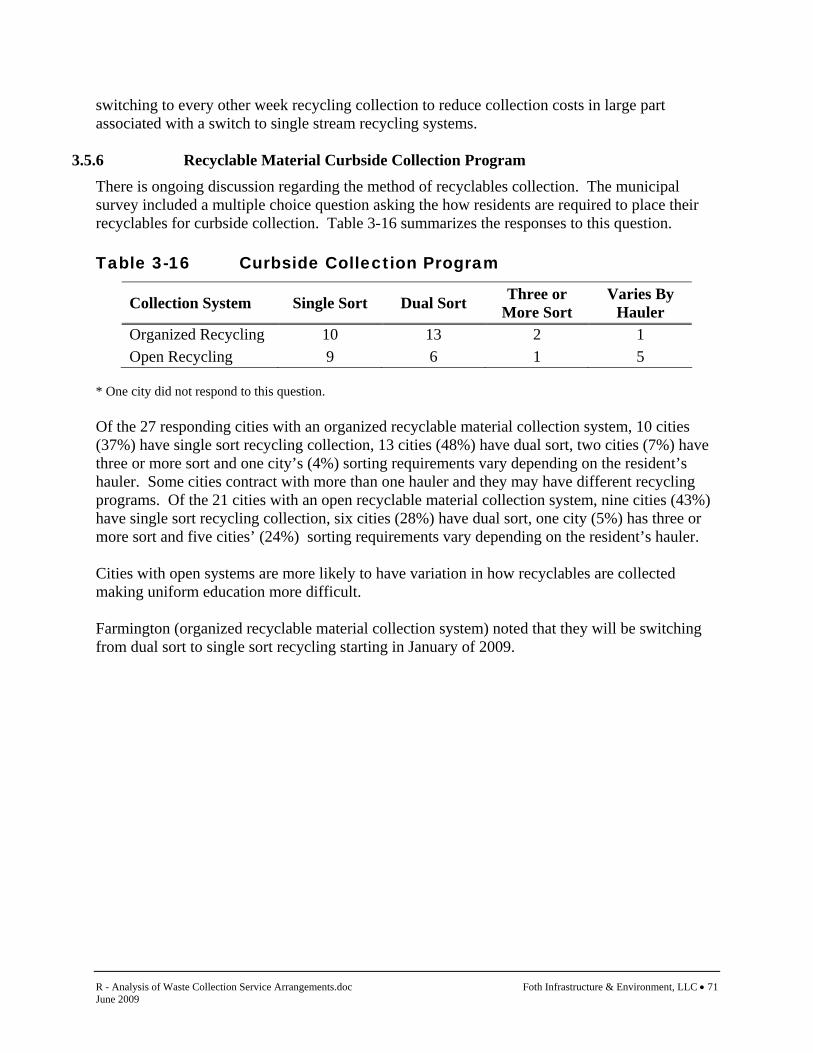
R - Analysis of Waste Collection Service Arrangements.doc Foth Infrastructure & Environment, LLC • 71 June 2009
switching to every other week recycling collection to reduce collection costs in large part associated with a switch to single stream recycling systems.
3.5.6 Recyclable Material Curbside Collection Program There is ongoing discussion regarding the method of recyclables collection. The municipal survey included a multiple choice question asking the how residents are required to place their recyclables for curbside collection. Table 3-16 summarizes the responses to this question. Table 3-16 Curbside Collection Program
Collection System Single Sort Dual Sort Three or More Sort
Varies By Hauler
Organized Recycling 10 13 2 1 Open Recycling 9 6 1 5
* One city did not respond to this question. Of the 27 responding cities with an organized recyclable material collection system, 10 cities (37%) have single sort recycling collection, 13 cities (48%) have dual sort, two cities (7%) have three or more sort and one city’s (4%) sorting requirements vary depending on the resident’s hauler. Some cities contract with more than one hauler and they may have different recycling programs. Of the 21 cities with an open recyclable material collection system, nine cities (43%) have single sort recycling collection, six cities (28%) have dual sort, one city (5%) has three or more sort and five cities’ (24%) sorting requirements vary depending on the resident’s hauler. Cities with open systems are more likely to have variation in how recyclables are collected making uniform education more difficult. Farmington (organized recyclable material collection system) noted that they will be switching from dual sort to single sort recycling starting in January of 2009.
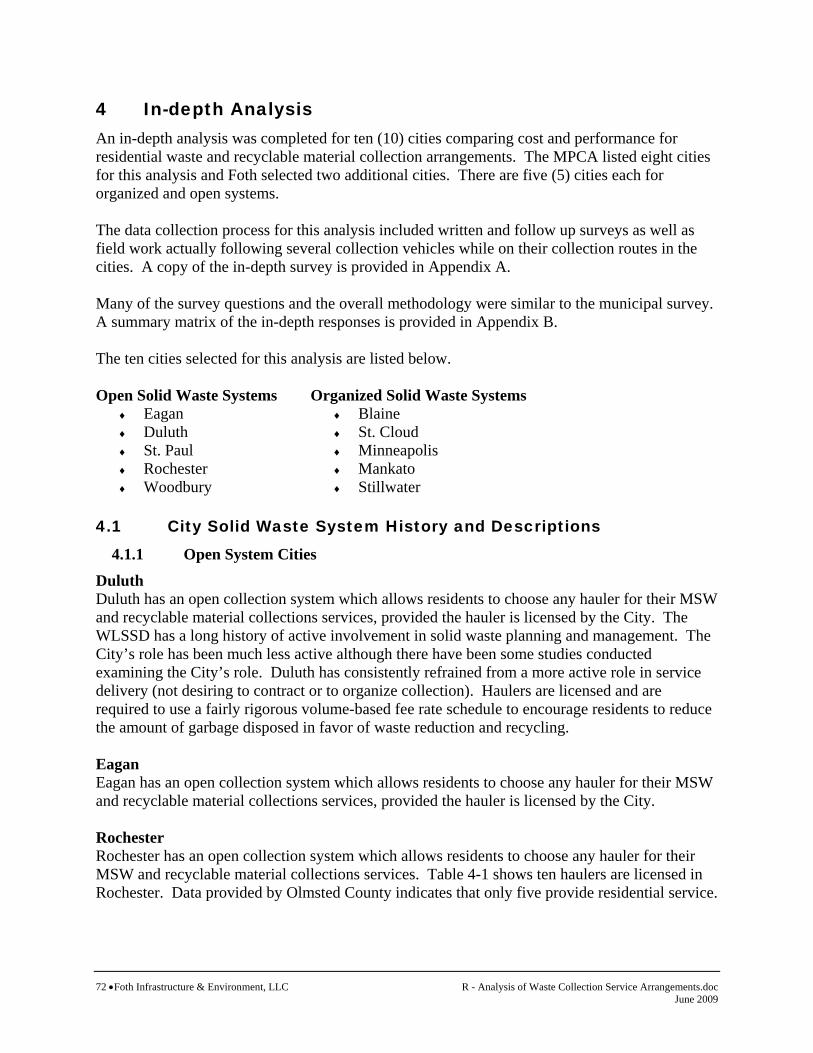
72 •Foth Infrastructure & Environment, LLC R - Analysis of Waste Collection Service Arrangements.doc June 2009
4 In-depth Analysis An in-depth analysis was completed for ten (10) cities comparing cost and performance for residential waste and recyclable material collection arrangements. The MPCA listed eight cities for this analysis and Foth selected two additional cities. There are five (5) cities each for organized and open systems. The data collection process for this analysis included written and follow up surveys as well as field work actually following several collection vehicles while on their collection routes in the cities. A copy of the in-depth survey is provided in Appendix A. Many of the survey questions and the overall methodology were similar to the municipal survey. A summary matrix of the in-depth responses is provided in Appendix B. The ten cities selected for this analysis are listed below. Open Solid Waste Systems Organized Solid Waste Systems
♦ Eagan ♦ Duluth ♦ St. Paul ♦ Rochester ♦ Woodbury
♦ Blaine ♦ St. Cloud ♦ Minneapolis ♦ Mankato ♦ Stillwater
4.1 City Solid Waste System History and Descriptions
4.1.1 Open System Cities
Duluth Duluth has an open collection system which allows residents to choose any hauler for their MSW and recyclable material collections services, provided the hauler is licensed by the City. The WLSSD has a long history of active involvement in solid waste planning and management. The City’s role has been much less active although there have been some studies conducted examining the City’s role. Duluth has consistently refrained from a more active role in service delivery (not desiring to contract or to organize collection). Haulers are licensed and are required to use a fairly rigorous volume-based fee rate schedule to encourage residents to reduce the amount of garbage disposed in favor of waste reduction and recycling. Eagan Eagan has an open collection system which allows residents to choose any hauler for their MSW and recyclable material collections services, provided the hauler is licensed by the City. Rochester Rochester has an open collection system which allows residents to choose any hauler for their MSW and recyclable material collections services. Table 4-1 shows ten haulers are licensed in Rochester. Data provided by Olmsted County indicates that only five provide residential service.
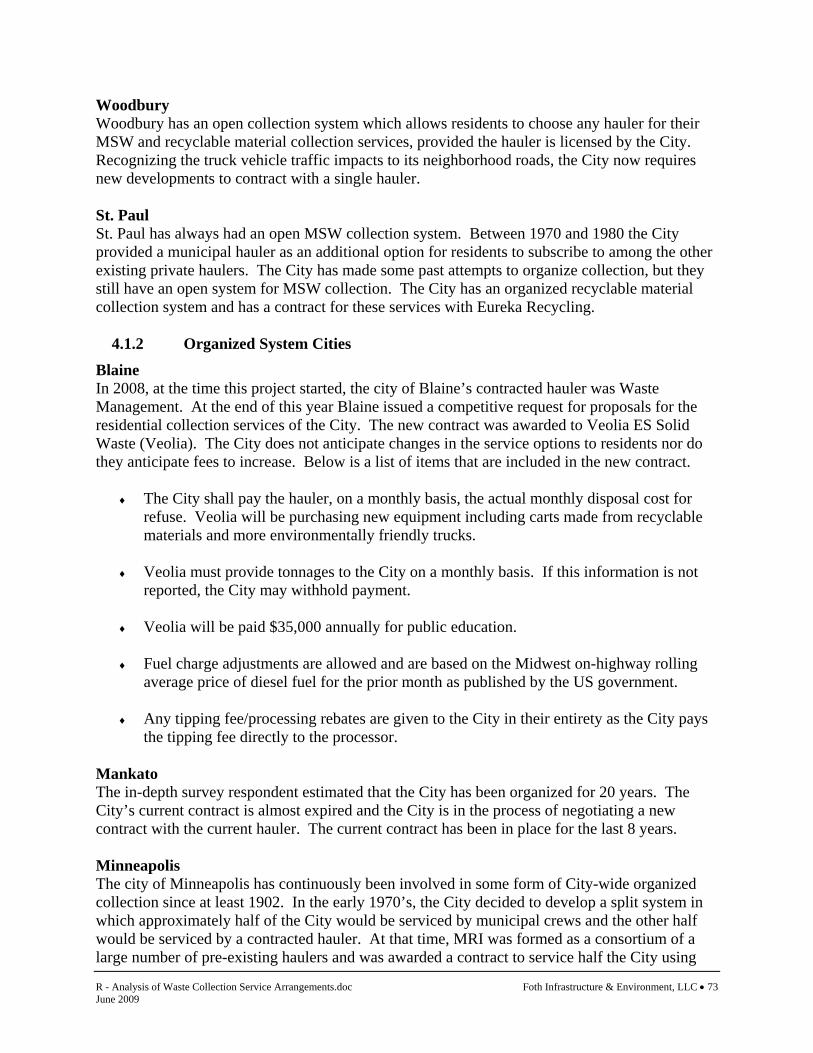
R - Analysis of Waste Collection Service Arrangements.doc Foth Infrastructure & Environment, LLC • 73 June 2009
Woodbury Woodbury has an open collection system which allows residents to choose any hauler for their MSW and recyclable material collection services, provided the hauler is licensed by the City. Recognizing the truck vehicle traffic impacts to its neighborhood roads, the City now requires new developments to contract with a single hauler. St. Paul St. Paul has always had an open MSW collection system. Between 1970 and 1980 the City provided a municipal hauler as an additional option for residents to subscribe to among the other existing private haulers. The City has made some past attempts to organize collection, but they still have an open system for MSW collection. The City has an organized recyclable material collection system and has a contract for these services with Eureka Recycling.
4.1.2 Organized System Cities
Blaine In 2008, at the time this project started, the city of Blaine’s contracted hauler was Waste Management. At the end of this year Blaine issued a competitive request for proposals for the residential collection services of the City. The new contract was awarded to Veolia ES Solid Waste (Veolia). The City does not anticipate changes in the service options to residents nor do they anticipate fees to increase. Below is a list of items that are included in the new contract.
♦ The City shall pay the hauler, on a monthly basis, the actual monthly disposal cost for refuse. Veolia will be purchasing new equipment including carts made from recyclable materials and more environmentally friendly trucks.
♦ Veolia must provide tonnages to the City on a monthly basis. If this information is not
reported, the City may withhold payment.
♦ Veolia will be paid $35,000 annually for public education.
♦ Fuel charge adjustments are allowed and are based on the Midwest on-highway rolling average price of diesel fuel for the prior month as published by the US government.
♦ Any tipping fee/processing rebates are given to the City in their entirety as the City pays
the tipping fee directly to the processor. Mankato The in-depth survey respondent estimated that the City has been organized for 20 years. The City’s current contract is almost expired and the City is in the process of negotiating a new contract with the current hauler. The current contract has been in place for the last 8 years. Minneapolis The city of Minneapolis has continuously been involved in some form of City-wide organized collection since at least 1902. In the early 1970’s, the City decided to develop a split system in which approximately half of the City would be serviced by municipal crews and the other half would be serviced by a contracted hauler. At that time, MRI was formed as a consortium of a large number of pre-existing haulers and was awarded a contract to service half the City using
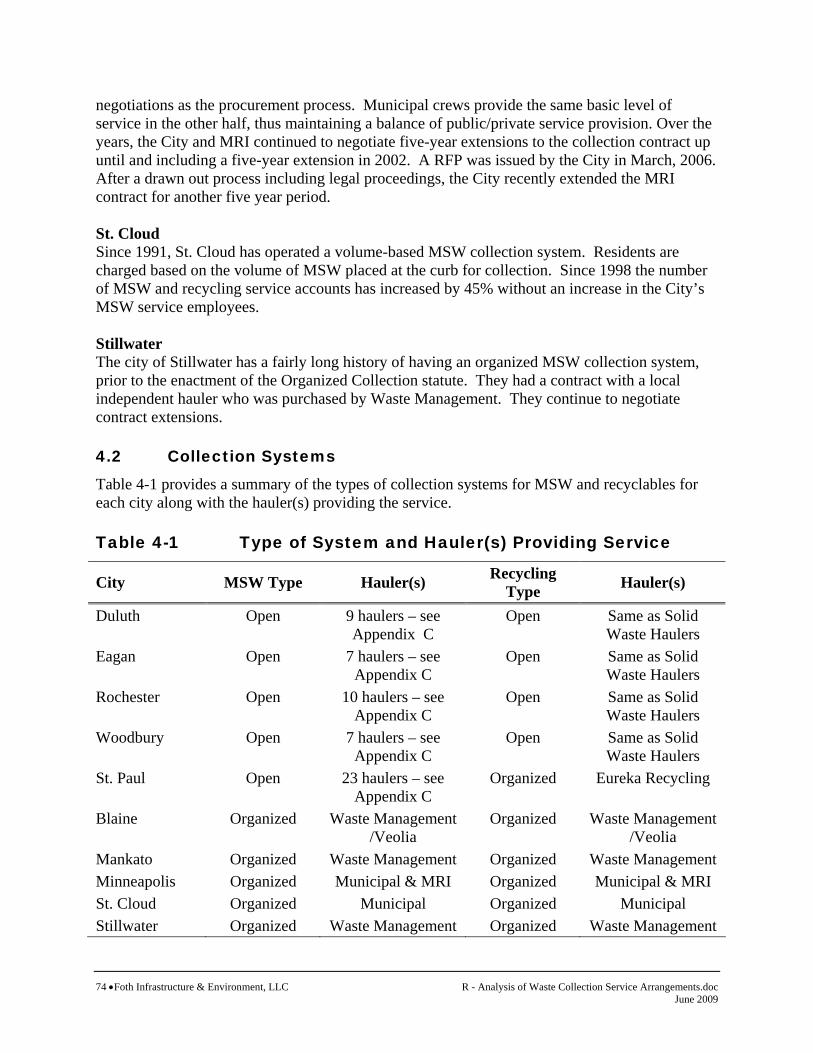
74 •Foth Infrastructure & Environment, LLC R - Analysis of Waste Collection Service Arrangements.doc June 2009
negotiations as the procurement process. Municipal crews provide the same basic level of service in the other half, thus maintaining a balance of public/private service provision. Over the years, the City and MRI continued to negotiate five-year extensions to the collection contract up until and including a five-year extension in 2002. A RFP was issued by the City in March, 2006. After a drawn out process including legal proceedings, the City recently extended the MRI contract for another five year period. St. Cloud Since 1991, St. Cloud has operated a volume-based MSW collection system. Residents are charged based on the volume of MSW placed at the curb for collection. Since 1998 the number of MSW and recycling service accounts has increased by 45% without an increase in the City’s MSW service employees. Stillwater The city of Stillwater has a fairly long history of having an organized MSW collection system, prior to the enactment of the Organized Collection statute. They had a contract with a local independent hauler who was purchased by Waste Management. They continue to negotiate contract extensions. 4.2 Collection Systems Table 4-1 provides a summary of the types of collection systems for MSW and recyclables for each city along with the hauler(s) providing the service. Table 4-1 Type of System and Hauler(s) Providing Service
City MSW Type Hauler(s) Recycling Type Hauler(s)
Duluth Open 9 haulers – see Appendix C
Open Same as Solid Waste Haulers
Eagan Open 7 haulers – see Appendix C
Open Same as Solid Waste Haulers
Rochester Open 10 haulers – see Appendix C
Open Same as Solid Waste Haulers
Woodbury Open 7 haulers – see Appendix C
Open Same as Solid Waste Haulers
St. Paul Open 23 haulers – see Appendix C
Organized Eureka Recycling
Blaine Organized Waste Management /Veolia
Organized Waste Management /Veolia
Mankato Organized Waste Management Organized Waste Management Minneapolis Organized Municipal & MRI Organized Municipal & MRI St. Cloud Organized Municipal Organized Municipal Stillwater Organized Waste Management Organized Waste Management

R - Analysis of Waste Collection Service Arrangements.doc Foth Infrastructure & Environment, LLC • 75 June 2009
4.2.1 Open System Cities
Duluth Duluth has an open collection system for both residential MSW and recyclable material collection. The City ordinance requires every household to have MSW and recyclables collection. To comply with this ordinance, residents may set up services with one of the nine licensed haulers. Residents are billed for collection services directly by their chosen haulers. Billing frequency varies by hauler. Eagan Eagan has an open collection system for both residential MSW and recyclable material collection. The City ordinance requires every household to have weekly MSW collection. To comply with this ordinance, residents may set up services with one of the seven licensed haulers or they may take their own garbage to local licensed solid waste facilities. Recycling and yard waste services are optional. Residents are billed for collection services directly by their chosen haulers. Billing frequency varies by hauler. Rochester Rochester has an open collection system for both residential MSW and recyclable material collection. The City follows Olmsted County ordinances for waste management practices. The County ordinance requires weekly disposal of MSW and requires licensed haulers to offer recycling services. Residents are billed for collection services directly by their hauler. Billing frequency varies by hauler. Woodbury Woodbury has an open collection system for both residential MSW and recyclable material collection. The city of Woodbury requires that residents recycle. City ordinance requires residents to have both MSW and recyclable material collection services. City staff and the Woodbury Environmental Education Commission (EEC) manage the solid waste program in the City. The EEC is made up of seven Woodbury residents. The EEC advises the City council on policies and procedures related to environmental education issues of the City. Residents are billed directly by their haulers for collection services. Billing frequency is dictated by the haulers. St. Paul The City reported that 23 haulers are licensed to provide residential collection service, but not all of them are reported to currently be serving customers in the City. Ramsey County reported that 17 haulers report having residential customers in St. Paul during 2008. Eureka Recycling is the contract hauler for curbside recycling collection. The City ordinance requires haulers to offer at least three levels of volume based fees for garbage collection service. Recycling is mandatory for at least three materials and residents are required by the ordinance to have solid waste collected by a licensed hauler or coordinate service with a neighbor.

76 •Foth Infrastructure & Environment, LLC R - Analysis of Waste Collection Service Arrangements.doc June 2009
4.2.2 Organized System Cities
Blaine In 2008, Blaine contracted with Waste Management for residential MSW and recyclable material collection. Residents are required by City ordinance to pay for MSW collection service in Blaine and are billed quarterly by the City. At the end of this year Blaine issued a competitive RFP for the residential collection services of the City. The new contract was awarded to Veolia ES Solid Waste (Veolia). Mankato The public works department manages the MSW and recyclable material collection contracting in Mankato. Currently, Mankato contracts with Waste Management for these collection services. Residents are required by City ordinance to pay for collection services and are billed for the service on their utility bill on a monthly basis by the City. Minneapolis The public works solid waste and recycling division manages the MSW and recyclable material collection services for all single family households up to four-plexes in Minneapolis. Those structures with greater than four units have the option of using the City collection services or contracting on their own for services. Public works personnel provide collection services for half of the households. The other half of the households are served by MRI which contracts with the City. Residents are required by City ordinance to pay for MSW and recyclable collection service and are billed monthly by the City. St. Cloud The public works department manages the MSW and recyclable material collection services for all single family households, duplexes and tri-plexes. The City uses municipal crews for both these collection services. Larger residential properties must contract privately with their own hauler for collection services. Residents pay for MSW and recyclable collection services as part of their City utility bill on a bi-monthly basis plus purchase bags to set out garbage if they have not subscribed to the 90 gallon cart service. Stillwater Waste Management manages the MSW and recyclable material collection services for residents of Stillwater. By City ordinance, every residence is required to have collection services including multi-family structures. Therefore, Waste Management serves both single family and multi-family households (including apartment complexes). Single family household residents are billed for collection services by Waste Management on a quarterly basis. 4.3 Accounts and Scope of Service Tables 4-2A and 4-2B provide a summary of the number of households and the levels of service provided to each City.
4.3.1 Open System Cities Table 4-2A provides a summary of the households served and service levels for the five open cities.

R - Analysis of Waste Collection Service Arrangements.doc Foth Infrastructure & Environment, LLC • 77 June 2009
Table 4-2A Open Cities – Households Served and Service Levels
City # Single Family # Multi-family
Typical Garbage Service Levels
(Gallons)
Typical Recycling Frequency &
Method Yard Waste Bulky Wastes
Duluth 24,505 3,220 35/65/95
Varies by hauler - Every other
week/Single sort plus weekly/Dual
sort
WLSSD drop-off-some fees apply, curbside collection by
some haulers (leaves and grass) – fees may apply
WLSSD Material Recovery Center drop-off-some fees
apply
Eagan 17,296 Incl. 32/64/96 Mostly every other week/Single sort
Drop-off sites – fees apply, curbside collection varies by
hauler
Curbside collection varies by hauler – fees apply, drop-off
at local landfill
Rochester 28,500 10,600 35/64/95
Varies by hauler - Weekly/Dual sort and some single
sort
Curbside collection varies by hauler – fees may apply,
drop-off County site
Woodbury 13,266 6,382 30/60/90
Weekly or Every other week/Dual or
single sort, respectively
Drop-off site – fees apply, curbside collection varies by
hauler
Curbside collection varies by hauler – fees apply
St. Paul MSW - 65,746 Recyc. – 84,771 33,345 30/60/90 Weekly/Dual sort
Curbside collection varies by hauler – County drop-off
sites available with no fees
Curbside collection varies by hauler – fees apply
District sponsored “Clean Up Days”
78 •Foth Infrastructure & Environment, LLC R - Analysis of Waste Collection Service Arrangements.doc June 2009
Duluth Based on data provided by WLSSD, there are 24,505 households being serviced by licensed haulers in Duluth. Collection services for both MSW and recycling are provided by a total of six different companies. The levels of services (volume of garbage containers) provided to residents varies by hauler. Based on one hauler’s company website, they offer 35, 65 and 95 gallon service options to residents. Residential recycling programs also vary among the haulers (single sort, dual sort, etc.). Recycling containers are provided by haulers. The majority of the residents are offered single sort recycling by their hauler (Tables 4-12, Haulers B & C, 59.5% of residential market share). Some haulers (Table 4-12, Haulers A and “Other”, 40.5% of residential market share) offer dual sort recycling to their residents which is collected every week. Additional curbside collection services (yard waste, bulky items, appliances, holiday tree collection) vary by hauler as well. Costs associated with the services are not readily available as they vary from hauler to hauler and are not public information. WLSSD has a drop-off site for residents to use for yard waste. Residents may drop off appliances, electronics, clean construction and demolition debris, mattresses and other materials at the WLSSD Material Recovery Center. In most cases, residents are required to pay a fee for the disposal of these items. Eagan Based on data provided by Dakota County, there are 17,296 total households being serviced by licensed haulers in Eagan (including multi-family households). Collection services for both MSW and recycling are provided by a total of seven different companies. The levels of services (volume of garbage containers) provided to residents varies by hauler. Residential recycling programs also vary among the haulers (single sort, dual sort, etc.). Recycling containers or carts are provided to residents by their hauler. The majority of residents are provided with single sort recycling that is collected on an every other week basis (Table 4-10, Hauler A and G, 80.9 % of residential market share). Remaining residents are provided with dual sort recycling by their hauler that is collected every week. Additional curbside collection services (yard waste, bulky items, appliances, holiday tree collection) vary by hauler as well. Costs associated with the services are not readily available as they vary from hauler to hauler and are not released as public information. There are various drop-off sites for residents to use for appliances, electronics, bulky waste, and yard waste. In most cases, residents are required to pay a fee for the disposal of these items. The Dakota County Eco-Site located in Eagan accepts recyclables and electronic waste for no charge. In an attempt to reduce overall truck traffic in neighborhoods, the City is separated into three sections (zones) for collection services. This minimizes the days the vehicles are on the streets in a particular neighborhood, but doesn’t necessarily minimize the number of vehicles.
R - Analysis of Waste Collection Service Arrangements.doc Foth Infrastructure & Environment, LLC • 79 June 2009
Each section has a different designated collection day. Collection services are provided to residents Monday, Wednesday and Friday, depending on which section they are located. All materials placed curbside for collection at a household (MSW, recycling, yard waste and bulky wastes) must be collected on the section’s designated collection day. The haulers observed in Eagan in this study were using tandem axle 25 cubic yard packers equipped with automated side loader (ASL) cart dumpers. Rochester Currently there were reported to be approximately 28,500 single family households and 10,600 multi-family households being serviced by licensed haulers in Rochester. Currently, four haulers provide service to residential areas in the City. The City has imposed a limit on the number of hauling licenses it issues. The levels of MSW service provided to residents vary among haulers. The most common volume responses are listed above in Table 4-2A. Information from the billing survey responses indicated that Sunshine Sanitation offers 35, 65, and 95 gallon service. Veolia offers at least 35 and 65 gallon services, they also likely offer some version of a 90 gallon service. Waste Management offers 32 and 64 gallon service and likely some version of a 90 gallon service. Haulers are required to offer recycling collection services to residents. Residential recycling programs vary among the haulers (single sort, dual sort, etc.). The majority of residents are provided with dual sort recycling by their hauler that is collected on a weekly basis (Table 4-14, Haulers A and C, 68.6% of residential market share). One hauler (Table 4-14, Hauler B, 31.4% of residential market share) provides single sort recycling that is collected on an every other week basis. Additional curbside collection services (yard waste, bulky items, appliances, holiday tree collection) vary by hauler too. Costs associated with the services are not readily available as haulers are free to charge residents what they like for these services. The County also has one public compost site where residents may drop off yard waste and holiday trees for no charge. The site is open from the spring through the fall. The haulers observed in this City were using 25 cubic yard packers with ASL cart dumpers. Woodbury Currently there are 13,266 single family households and 6,382 multi-family households being serviced by licensed haulers in Woodbury for a total of 19,648 households. Collection services for both MSW and recycling are provided by a total of seven different companies. Haulers are required to provide recycling collection services to residents. Each company is required to provide residents a choice of 30, 60 or 90 gallon garbage service. Residential recycling programs vary among the haulers. Approximately half of the residents are provided with single sort recycling by their hauler that is collected every other week. The other half of residents are offered duel sort recycling which is collected on a weekly basis. Recycling containers or carts are provided to residents by the City, through their hauler. Residents may also purchase these containers at the public works building.
80 •Foth Infrastructure & Environment, LLC R - Analysis of Waste Collection Service Arrangements.doc June 2009
Additional curbside collection services (yard waste, bulky items, appliances, holiday tree collection) vary by hauler. Costs associated with the services are not readily available as haulers are free to charge residents what they like for these services. The City also has one public compost site where residents may drop off brush and yard waste for a fee. The site is open from mid-April through mid-November. The City is separated into four different residential hauling districts. Each district has a different designated collection day. Collection services are provided to residents Monday through Thursday, depending on which hauling district they are located. All materials placed curbside for collection at a household (MSW, recycling and yard waste) must be collected on the district’s designated collection day. The haulers observed in this City used 25 cubic yard packers with ASL cart dumpers. St. Paul The city of St. Paul reported having 65,746 single family households eligible for residential collection service. City officials noted that approximately ten percent of the total households do not actually contract for MSW collection service. The multi-family residences’ MSW is handled as commercial accounts via dumpsters. Most haulers provide volume-based collection via different size containers. Recycling is handled via a contract between the City and Eureka Recycling. The curbside recycling program serves 84,771 households (single family through four-plexes) collected by Eureka Recycling’s 20 bio-diesel-powered collection vehicles. Tonnage has increased ten-fold since the program went City-wide in 1986 to 21,000 tons in 2004. The contract extension with Eureka Recycling signed September, 2001 commits the City's cost for recycling services long-term at $121.00 per ton through 2013. The ten year extension and work plan incorporates performance features using objective measurements of progress, and provides incentives for achieving objectives. The contract departs from the usual line item budgeting approach in favour of a flat per ton payment, leaving most program decisions to Eureka Recycling. The City changed to weekly dual-stream curbside collection of recyclables (all fibers in one bin and all rigid containers in another bin) beginning June 2004; resulting in a projected increase of 3,000-4,000 tons collected per year; and requiring a $2.00 per household Recycling Service Fee increase to cover the cost to collect and process the increased tonnage, and to cover decreases in state SCORE recycling grant funding in 2003-2005. Eureka Recycling plans to add clean organics collection to the curbside program in 2008-2010, with the objective of reaching a 75% residential recycling rate in St. Paul by 2012. Yard wastes collection service is provided by the haulers, but Ramsey County operates a yard waste processing collection system that includes three yard waste drop-off sites within the city of St. Paul. The County’s yard waste sites are free to County residents. Bulky wastes may be

R - Analysis of Waste Collection Service Arrangements.doc Foth Infrastructure & Environment, LLC • 81 June 2009
collected by haulers, but there are also “Clean Up Days” sponsored by the Districts within the City. Residents can deliver different types of bulky wastes to the temporary drop-off locations on the scheduled “Clean Up Days”.
4.3.2 Organized System Cites Table 4-2B provides a summary of the households served and service levels for the five organized cities.

82 •Foth Infrastructure & Environment, LLC R - Analysis of Waste Collection Service Arrangements.doc February 2009
Table 4-2B Organized Cities – Households Served and Service Levels
City # Single Family
# Multi-family
Garbage Service Levels
(Gallons)
Recycling Frequency &
Method Yard Waste Bulky Wastes
Blaine 16,143 0 30/60/90 Every other week/Single Sort
Curbside collection by hauler – some fees apply
Included in cost of unlimited 90 gallon service (except
appliances), other levels of service use curbside collection
– fees apply
Mankato 8,3001 0 35/64 Weekly/Dual sort
Seasonal curbside collection (leaves) – cost included in
base fee, curbside collection yard waste by hauler – fees apply, drop-off site – fees
apply
Curbside collection by hauler – fees apply
Minneapolis 104,0002 NR 22/94 Every other
week/Three or more sort
Seasonal curbside collection – cost included in base fee
Curbside collection – cost included in base fee, six free vouchers to bring material to
transfer station
St. Cloud 17,335 597
30 & 60 require “City” bags 90 requires City cart
Weekly/Dual sort
Seasonal curbside collection – need to purchase clear plastic 30 gallon “City” bags (leaves and grass clippings), curbside collection of brush by hauler – fees apply, drop-off site –
permit purchase
Curbside collection – fees apply
Stillwater 5,471 195 30/60/90 Every other week/Single sort
Curbside collection – cost included in base fee
Curbside collection – cost included in base fee
1 Includes single family homes and duplex homes. 2 Includes both single family and multi family homes. NR = no response.
R - Analysis of Waste Collection Service Arrangements.doc Foth Infrastructure & Environment, LLC • 83 June 2009
Blaine Currently there are 16,143 households being serviced, not including multi-family households which are considered commercial accounts and must contract on their own for services. Refuse collection is provided Monday through Friday throughout zoned areas of the City. When the Foth representative followed trucks on route in Blaine, Waste Management was the City’s contracted hauler. Waste Management assigned collection route boundaries within the zones depending upon the anticipated seasonal needs. Routes may require servicing up to or slightly over 1,000 households per day. The information on the specific number of vehicles required to service all households for MSW and recycling was only made available in a range of total vehicles. That range was six to ten vehicles per day. This range was consistent with other cities. Collection vehicles observed in this City were tandem axel, 25 cubic yard packer trucks equipped with an ASL lifter for the garbage carts. Single sort recycling for residents was included in all four service options. Recycling collection was provided on an every other week basis. Waste Management provided carts to all residences and collects them in the same manner as MSW. Mankato Currently there are 8,300 single family households and duplexes being serviced by Waste Management for MSW and recyclable material collection. Multi-family households larger than a duplex are considered commercial accounts and must contract on their own for services. Residents may choose from two levels of service including a 35 gallon service or a 64 gallon service. Additional 30 gallon bags are sold for additional service. Refuse collection is provided Monday through Friday in zoned areas throughout the City. Garbage is collected using ASL equipment for the carts, which are supplied by the hauler. Dual sort recycling for residents is included in both service level options. Resident may purchase recycling bins from the City. Recycling collection is provided on the same day as MSW collection. Minneapolis Currently there are 110,000 single family households up to four-plexes being serviced by either the city of Minneapolis public works personnel or MRI for MSW and recyclable material collection. MRI is a consortium of several hauling companies. Households with greater than four units can use City collection or contract on their own for services. Residents may choose from two levels of service including a 22 gallon service or a 94 gallon service. Refuse collection is provided Monday through Friday. The City is divided into two contiguous areas, one served by the City and one served by MRI. Garbage carts are provided by the City. Fifteen City garbage trucks service an average of 650 households each day. There are two crew members per truck. Three or more sort recycling for residents is included in the two service options. Recycling collection is provided on an every other week basis. The City provides up to two 24 gallon recycling bins per household.

84 •Foth Infrastructure & Environment, LLC R - Analysis of Waste Collection Service Arrangements.doc June 2009
Geographically the City is divided into two contiguous areas. This affords the optimum collection efficiencies by keeping the required driving distances to service the population with the least amount of driving. Eighty percent of all households have alley service and the 20% that have no alley access are serviced from the street. During the observation period where distances were monitored, this ratio of alleys and street service were maintained. The average distance between households was approximately 83 feet. St. Cloud Currently there are 17,335 single family households, 517 duplexes and 80 tri-plexes receiving municipal MSW and recyclable material collection services. Residents may choose from two service level options including bag service or 90 gallon cart service. The bag service requires residents to purchase specially marked “City” bags. Residents who subscribe to the 90 gallon service are supplied a cart by the City. Any material beyond the 90 gallon carts capacity must be placed in “City” bags. Currently 757 households subscribe to the cart service program. Refuse and recycling collection for City residents is provided Tuesday through Friday. Collection is performed by four trucks with two person crews. Collection vehicles are capable of lifting/dumping carts. Dual sort recycling services are provided weekly for both levels of service on the same day as MSW collection. Residents are required to sort their materials in a City provided bin. Recycling collection is performed by seven trucks with a one person crew in each truck. Stillwater Currently there are 5,471 single family households and 195 multi-family households being serviced by the City’s contracted hauler, Waste Management. Residents may choose from four levels of service including a senior service, 30 gallon, 60 gallon or 90 gallon service. Single sort recyclable material collection service is provided for all four service levels and is collected on an every-other week basis. Wheeled carts for recyclable materials are provided to residents by Waste Management. These collections are also done utilizing ASL vehicles. 4.4 Structure of Institutional Arrangements This section of the report addresses additional background information that can have some bearing on rates and solid waste management system performance for the ten in-depth cities.
4.4.1 Open System Cities
Duluth The city of Duluth has completed evaluations of residential collection in the past and has consistently decided to not get directly involved with service delivery or administration. The City in conjunction with the WLSSD actively promotes recycling with mandatory collection and a fairly aggressive volume based rate schedule. WLSSD has authority for solid waste management equal to that for counties and a history of waste processing and designation to their co-incineration facility for Refuse Derived Fuel (RDF) and sewage sludge which operated from 1982 to mid-1999. WLSSD implemented a hauler collected service charge which was upheld by
R - Analysis of Waste Collection Service Arrangements.doc Foth Infrastructure & Environment, LLC • 85 June 2009
the Minnesota Supreme Court as a potential model for others. They currently collect their service charge on both the hauler bills and part of the property tax statement. WLSSD has a transfer station available for MSW from their service area with the current disposal contract to the city of Superior, WI sanitary landfill. Tipping fees for MSW delivered to the transfer station are approximately $34.00 to $38.00 per ton. WLSSD also has a Materials Recovery Center, Household Hazardous Waste facility, and an Organics Composting Facility. In 2006, WLSSD adopted an ordinance requiring the recovery of organic waste by commercial establishments. Eagan The city of Eagan is not actively involved with MSW management services. They have looked at collection issues and have the City zoned. Dakota County has Hauler Financial Incentive Payment (HFIP) program which pays waste haulers $12.00 per ton to the haulers for waste processing. Rochester The city of Rochester is not actively involved with direct MSW management. Olmsted County is very active with their Integrated Solid Waste Management (ISWM) system which includes their WTE facility, sanitary landfill, as well as facilities to handle recyclables, HHW, yard waste and problem materials. Olmsted County evaluated organizing collection countywide in 2006. The plan was to divide the County into five collection districts. Each district was to be comprised of roughly 20% of the total market and haulers could bid on the exclusive right to provide waste collection service within the County collection district. However, no single waste company could have more than two districts or 40% of the total market. The County decided against organizing when the haulers and customers organized their opposition. The haulers and customers attended the County board meeting (300+ in attendance). The haulers paid for and appeared in TV commercials, which ran before the board meeting complaining about the board's actions. The haulers were also quoted in the newspapers, ran their own newspaper advertisements, paid for radio spots and wrote letters to the editor. The County did not organize collection but limited the number of available licenses issued in the County and the haulers signed long-term (15 year) contracts for waste delivery to County facilities. The contracts kept the open competition system in place but provided waste assurance by directing waste to Olmsted's WTE facility with significant penalties for non-compliance. The contract tipping fee at the WTE facility is $83.00 per ton plus a hauler collected service charge of 5% of gross receipts. Starting May 1, 2009 the hauler collected service charge will increase to 17% of gross receipts. Woodbury The city of Woodbury has discussed organized collection to a limited extent. They are reported to require new subdivisions to organize collection when they are established as new subdivisions. Washington County contracted for waste processing along with Ramsey County in the mid-1980’s. MSW is delivered primarily to the Resource Recovery Technologies, Inc. (RRT) Resource Recovery facility in Newport. Washington County along with Ramsey County conducted a detailed evaluation of “public collection” from mid-2001 through the end of 2002.

86 •Foth Infrastructure & Environment, LLC R - Analysis of Waste Collection Service Arrangements.doc June 2009
The Counties carefully considered organizing collection for both residential and commercial solid wastes. They decided against organizing but implemented their “County Environmental Charge” to be collected by waste haulers on their customer bills. The waste haulers also signed waste delivery agreements to deliver MSW to the processing facility in Newport. Beginning in 2007, Washington County (as well as Ramsey County) changed their contractual arrangement for waste processing with RRT (formally NRG) to what is now referred to as a “merchant approach.” RRT is now responsible for waste delivery contracting. Their contract tipping fee rates escalate over time until they are contractually set at $72.00 per ton in 2012, the last year of the current processing contract. Washington and Ramsey Counties payments for processing to RRT trend downward as the hauler tipping fee rates increase. The approach is meant to establish RRT Resource Recovery’s Newport facility as a “merchant facility,” able to stand on it’s own without a county processing contract after 2012. RRT has two types of contracts for waste delivery – “All Waste” and “Contracted Waste”. Not all haulers serving Woodbury are contracted to deliver all the waste they collect to the processing facility. Those with “All Waste” contracts serving Woodbury include: Highland Sanitation, Maroney’s Sanitation, Tennis Sanitation, Troje’s Trash Service and Waste Management. Haulers with “Contracted Waste” contracts include Allied Waste Services and Veolia. The Washington County Environmental Charge on the hauler bills is currently set at 28%. The funds are used for solid waste related purposes with the majority used to make the processing payments to RRT. St. Paul The city of St. Paul has a long history of considering organized collection as noted in Section 4.8. St. Paul is an urban, core City. There are residents who are strong advocates for maintaining their choice for their waste hauler. There are also strong District Councils within the City that have been active in solid waste and recycling issues. Eureka Recycling provides both single family curbside and multi-family (above four-plexes) residence recycling collection and processing service for the City. Eureka Recycling provides a strong voice for recycling, zero waste and is working on plans for residential organic waste collection in the City. As noted in the Woodbury section above, Ramsey County is involved in the same activities as Washington County including the contract with RRT, the public collection study, the County Environmental Charge and the merchant facility approach. The County Environmental Charge for Ramsey County is 28% for residential and 53% for commercial customers.
4.4.2 Organized System Cities
Blaine As noted, the city of Blaine hauler for residential collection was Waste Management when this study began, but changed to Veolia as the result of a competitive bidding process completed in October. Waste Management was reported to be providing excellent service. Nevertheless, the City issued an RFP for competitive proposals and received proposals from four hauling companies. According to the City’s analysis of the bids, over the seven year term of the contract, the bid submitted by Veolia was projected to save the City over $1.2 million compared to Waste

R - Analysis of Waste Collection Service Arrangements.doc Foth Infrastructure & Environment, LLC • 87 June 2009
Management’s bid. Thus, the City was able to save significantly as a result of their competitive bidding process. The city of Blaine is located in Anoka County, who has a contract for waste processing with RRT at their Elk River Resource Recovery Facility. The City is regarded as a “public entity” and is required to have the MSW collected by their contract hauler delivered to the County’s designated facility. Mankato The city of Mankato has historically negotiated contract extensions rather than re-bid. Waste Management is the current hauler having acquired the previous hauler, Kato Sanitation. Blue Earth County waste processing requires public entity wastes to be processed. Minnesota Waste Processing Corporation (MWPC) has a transfer station located in Mankato to which public entity wastes are delivered for a tipping fee of approximately $83 per ton. The MSW is transfer hauled to the RRT Newport Facility. Blue Earth County contracts for recyclables processing service for the entire County and the contracted hauler for that service is also Waste Management. Minneapolis The city of Minneapolis collects half the City single family residences and contracts with MRI for the other half. This arrangement is unique, but helps keeps rates in check for both the private contracted hauler and the City. The service provided to City households is very comprehensive and includes collection (curbside or alley) of the most different types of solid wastes in Minnesota for the standard fees charged per month. Residents are not charged extra for these services. In addition, households receive a $7 credit on their monthly costs if they participate in the curbside recycling service. The recycling collection includes source separation into several categories by residents and curbside sorting of materials by haulers which results in the City receiving higher revenue for their recyclable materials than most other communities via a separate recyclables processing contract. MSW is delivered to Hennepin County’s WTE facility Hennepin Energy Recovery Center (HERC). The MSW comes under the public entity requirements. The Hennepin County Hauler Solid Waste Management Fee charged on hauler bills is set at 9% for residential customers and 14.5% for non-residential customers. St. Cloud The city of St. Cloud uses municipal crews for collection. They have two approaches to how residents set out garbage – a bag system and a rolling cart. The bags are sold in bundles of ten and represent a rigorous volume-based fee system as the residents pay the same price for each bag of garbage set out for collection. The carts are 90 gallon in size and provide flexibility and convenience to residents. St. Cloud is in Stearns County, part of the Tri-County Solid Waste Management. Tri-County has a contract to provide MSW to the RRT Elk River Resource Recovery facility. They also send some waste to the Perham Resource Recovery facility in Perham, Minnesota. Approximately half the Tri-County waste stream is sent to landfills.

88 •Foth Infrastructure & Environment, LLC R - Analysis of Waste Collection Service Arrangements.doc June 2009
Stillwater The city of Stillwater contracts with Waste Management for all collection services. The City has tended to negotiate and extend contracts (Waste Management purchased the previous contracted hauler) rather than competitively bid. Stillwater is in Washington County and all the information regarding Washington County in the Woodbury subsection applies to Stillwater. 4.5 Rate Information As mentioned in Section 3.3, rate information was sought to provide data for comparisons between different management approaches. This section summarizes the billing statement survey results for only the in-depth cities. The corresponding cost data from the ten in-depth cities was included previously in Section 3.3 to provide a broader data base for that analysis. The rate data from the in-depth cities is included separately in this section as well. A total of 82 billing survey responses were received from the in-depth cities. Some of the billing information was collected from city and hauler websites to verify information or obtain information for cities that did not have any billing survey responses. Sixty-nine of the survey responses are from cities with an open MSW collection system. Thirteen survey responses are from cities with an organized MSW collection system. A summary matrix of the rate data for the in-depth cities is provided in Appendix D. Each line in the table represents rate data for a particular city and a particular hauler. The costs for the different levels of service (generally 30, 60 and 90 gallon containers and commonly each size container has variations such as the 30 gallon container sizes range from 30 to 35 gallons) are shown for each city and hauler. The breakdown of the costs is shown for each service using the best data provided. Table 4-3 summarizes the average monthly service rates charged to residents in the in-depth cities. These costs include the base rate for the service, tax, surcharges, and recycling costs as provided by the participants.

R - Analysis of Waste Collection Service Arrangements.doc Foth Infrastructure & Environment, LLC • 89 June 2009
Table 4-3 Average Monthly Service Rates Charged to Residents
City 30 Gallon 60 Gallon 90 Gallon Open Systems Duluth1 $26.73 $33.62 $39.77 Eagan -- $22.50 -- Rochester $24.60 $29.03 -- Woodbury $20.524 $16.02 $25.69 St. Paul $24.63 $28.50 $30.46 Open Average $24.12 $25.93 $31.97 Organized Systems Blaine $8.94 $12.79 $14.98 Mankato2 $11.30 $12.65 NA Minneapolis3 $21.38 NA $23.75 St. Cloud $15.235 $24.016 $33.45 Stillwater $16.97 $19.89 $23.14 Organized Average $14.76 $17.33 $23.83 Difference between Open and Organized Averages $9.36 $8.60 $8.14
-- Did not receive any billing survey responses for this service level. NA - Haulers do not offer this service level. 1 No billing statement surveys were received from the city of Duluth. Rates shown are from a hauler’s website. The hauler has a significant market share of the residential accounts in Duluth. 2 Actual MSW service levels are 35 gallons and 64 gallons. 3 Actual MSW service levels are 22 gallons of 94. All service levels include netting out a $7.00 credit that is issued to the residents if they participate in the recycling program. If they do not recycle, the cost for each of the service levels would be $7.00 more. 4 This city only had one response for this level of service. 5The 30 Gallon service value charged to residents was determined by assuming residents dispose of one 30 gallon bag of MSW per week each month (4 weeks total). One 30 gallon bag costs $2.00. To account for the Minnesota solid waste tax (9.75%), the total amount associated with solid waste ($8.00) was multiplied by 1.0975. The pass by base fee is $6.45 per month which includes recycling. 6 The 60 Gallon service value charged to residents was determined by assuming residents dispose of two 30 gallon bag of MSW per week each month (4 weeks total). One 30 gallon bag costs $2.00. To account for the Minnesota solid waste tax (9.75%), the total amount associated with solid waste ($16.00) was multiplied by 1.0975. The pass by base fee is $6.45 per month which includes recycling. In Table 4-3 the five open system cities are listed first followed by the five organized system cities. The rates are similar in that the larger volume service level, the more the resident is charged. Where the rates differ are in the average costs for similar services. Blaine, an organized city, has the lowest rates charged to residents for MSW and recyclable material collection. Of the open system cities, the rates from Duluth are the highest rates charged to residents for collection services.

90 •Foth Infrastructure & Environment, LLC R - Analysis of Waste Collection Service Arrangements.doc June 2009
Averages are calculated for the different levels of service for both open and organized systems. At all levels of service (30, 60 and 90 gallon containers); the organized cities have lower average costs. The differences range from $8.14 less for the 90 gallon service level to $9.36 for the 30 gallon service level. It is interesting to note that all the organized cities are part of county systems that use resource recovery facilities where the cost per ton for disposal is generally higher than disposal at landfills. Table 4-4 summarizes the average monthly rate paid to haulers. In an organized system city, typically these rates are paid to the haulers by the city. In an open system city, these rates are paid to the hauler directly by the residents. Table 4-4 Average Monthly Service Rates Paid to Haulers
City 30 Gallon 60 Gallon 90 Gallon Open Systems Duluth * * * Eagan -- $21.07 -- Rochester $22.01 $25.95 -- Woodbury $13.75 $13.95 $19.52 St. Paul $20.57 $22.14 $24.17 Organized Systems Blaine $10.56 $11.40 $12.57 Mankato1 $5.56 $5.56 NA Minneapolis2 $18.00/10.49 NA $20.00/10.49 St. Cloud3 $14.45 $22.45 $31.05 Stillwater $12.87 $15.07 $17.49
* Unable to determine amount credited to hauler versus taxes. -- Did not receive any billing survey responses for this service level. NA - Haulers do not offer this service level. 1 Actual MSW service levels are 35 gallons and 64 gallons. 2 Actual MSW service levels are 22 gallons of 94. The first amounts listed are the amounts the city of Minneapolis retains from each household after remitting taxes and the County solid waste fee. MRI, the contracted hauler who provides service for half of the City’s residents, is paid $10.49 per household serviced. The City provides carts for residents, handles the billing, pays the disposal fee to HERC, provides education, snow plows the alleys, conducts pilot project and pays for graffiti removal with the remaining funds. 3 St. Cloud uses municipal crews for both MSW and recycling collection. The amount of money the City would retain is the amount charged to residents less state and county taxes and fees. These values were estimated using the rates estimated in Table 4-3. The value for the 90 gallon service was determined by subtracting the recycling base fee from the total amount charged to residents. This value was divided by 1.0975 to determine the cost associated with tax. In Table 4-4 the five open system cities are listed first followed by the five organized system cities. The rates paid to the haulers for the open system cities were determined by subtracting taxes and county charges from the total amount the hauler charges to the residents for collection
R - Analysis of Waste Collection Service Arrangements.doc Foth Infrastructure & Environment, LLC • 91 June 2009
services. In all cases, the Minnesota solid waste tax is 9.75%. In some cases there is also a county solid waste fee. The amount for this fee varies among counties. The taxes and county fee charges were provided by some billing survey participants. In some cases, if the tax amount was not supplied and it was determined that tax was not included in the base rate for the service, the tax amount was calculated. In other cases, if the taxes and county charges were not provided separately by the survey participant, and if it wasn’t clear whether or not these fees were included in the base cost, the amount paid to the hauler could not be determined. The values in Table 4-4 are averages of these calculated values based on information received from the billing survey participants. As mentioned above, in an open system the hauler is able to collect the money charged to residents less what they need to remit to the state for taxes and to the county if they have a solid waste service fee. In the organized system cities, the amount paid to the hauler by the cities is negotiated and outlined in a contract. In Mankato, the hauler is paid the same base rate for every house serviced regardless of the size container the resident uses. In Minneapolis, the amount paid to MRI is only $10.49 per month as the City funds many other solid waste functions with the remaining revenues (even alley snow plowing and graffiti removal).
4.5.1 Open System Cities
Duluth No billing survey responses were received for the city of Duluth. The rate data for collection services in Duluth was obtained from a hauler’s website. This particular hauler provides a substantial amount of the residential collections services in the City. The rates from this website are shown in Table 4-3. These rates only represent one hauler and may not reflect the average rates for the Duluth market. However, as mentioned, the hauler does have a significant market share and therefore likely has competitive rates. Licensed haulers in Duluth are required by WLSSD to establish a rate structure for collection services based on rules outlined by the City. Each hauler is required to set a “base rate” to be charged for one 32 gallon container service. The base rate shall include the costs associated with recycling. The base rate does not include taxes or the WLSSD solid waste management fee. The 64 gallon container base rate is supposed to be 135% of the 32 gallon container base rate. The 96 gallon container base rate is supposed to be 170% of the 32 gallon container base rate. This creates a volume based structure for residential collection. Haulers are free to set the base rate for the 32 gallon container service at any price. The rates for the additional volume services (e.g., 64 and 96) provided by haulers must follow this pricing structure. WLSSD has a solid waste management fee in place to covers costs associated with environmental services (hazardous waste disposal, recycling, composting and waste reduction) and educational programs. The solid waste fee for a 32 gallon size container is $0.28 per pick up. The fees for other size containers are more or less than this value depending on the size of the container (larger containers are charged more). Haulers collect these fees when they bill residents and in turn pay the total fee amount for all their customers to WLSSD. A portion of the solid waste management fee is also collected through property taxes ($18.00 per year for residents).

92 •Foth Infrastructure & Environment, LLC R - Analysis of Waste Collection Service Arrangements.doc June 2009
Eagan Three different collection bill survey responses were provided by residents of Eagan. All three responses were for the 60 gallon service. In Table 4-4 above, the monthly service rate charged to residents is an average of what was provided. The bills provided represent two of the seven licensed residential haulers in the City. The average amount paid to the hauler was determined by subtracting taxes and county fees from the total amount charged to residents. In an open system such as Eagan, haulers may charge extra for various bulky waste set out by customers. Often haulers will overlook charging for extra bags of garbage due to competitive reasons. Rochester Nine collection bill responses were provided by residents of Rochester. Seven of these responses were for the 30 gallon service and two responses were for the 60 gallon service option. The bills provided represent three of the 10 licensed residential haulers in Rochester. In Table 4-3 above, the monthly service rate charged to residents is an average of what was provided. Haulers are required to structure their service options based on a volume based service fee. Haulers are also required to collect an environmental service charge from customers to help fund Olmsted County environmental education and waste abatement activities. The total amount the hauler needs to collect for this service charge regulated to equal 5% of hauler’s gross receipts. Once again, haulers may charge extra for bulky wastes and may or may not charge for small amounts of extra garbage. Woodbury Six different collection bill survey responses were provided by City staff that live in Woodbury. One bill survey response was provided for 30 gallon service, two responses were provided for the 60 gallon service, and three responses were provided for the 90 gallon service. In Table 4-3 above, the monthly service rate charged to residents is an average of what was provided. The bills provided represent three of the seven licensed residential haulers in the City. The average amount paid to the hauler was determined by subtracting taxes and county fees from the total amount charged to residents. Woodbury provides a financial benefit opportunity for those residents who recycle. Each month one address is drawn randomly from one of the City’s four hauling districts. A City staff member will check the winning address on that resident’s designated collection day to see if they are recycling. If so, that resident wins a prize of $50.00. The money to fund this program is provided by Washington County. St. Paul Forty-five different collection bill survey responses were provided by City staff that live in St. Paul. Seventeen bill survey responses were provided for 30 gallon service, ten responses were provided for the 60 gallon service, and 18 responses were provided for the 90 gallon service. In Table 4-3 above, the monthly service rate charged to residents is an average of what was provided. The bills provided represent 13 of the 17 residential haulers in the City actually reporting to have residential accounts. Table 4-3 shows the average costs for the St. Paul households for different service levels as follows:
R - Analysis of Waste Collection Service Arrangements.doc Foth Infrastructure & Environment, LLC • 93 June 2009
♦ 30 gallon service = $24.63 ♦ 60 gallon service = $28.50 ♦ 90 gallon service = $30.46
The average organized city rates from Table 4-3 are:
♦ 30 gallon service = $14.76 ♦ 60 gallon service = $17.33 ♦ 90 gallon service = $23.83
Subtracting each of the respective averages yields the following differences:
♦ 30 gallon service = $9.87 ♦ 60 gallon service = $11.17 ♦ 90 gallon service = $6.63 ♦ Average difference = $9.22
There were 61,039 households reported to have MSW collection service in St. Paul. Applying the average difference per household per month of $9.22 yields a projected annual difference of over $6 million. This is a rough estimate due to the general nature of the billing survey. Nevertheless, the annual difference in costs for just St. Paul households appears to be well into the millions of dollars in savings. The average amount paid to the hauler as shown in Table 4-4 was determined by subtracting taxes and county fees from the total amount charged to residents. One resident who uses Hauler H for garbage collection pays $16.00 per month for the 30 gallon container service. Another resident who uses Hauler K pays $41.00 per month for the 30 gallon container service. Table 4-5 shows a range of a random sample of monthly rates charged to residents for MSW collection services from each hauler that operates St. Paul. These rates include taxes, solid waste fees and surcharges paid to the haulers as provided by the participants. The monthly rates in Table 4-5 do not include the $2.25 that is charged each month for recycling collection.

94 •Foth Infrastructure & Environment, LLC R - Analysis of Waste Collection Service Arrangements.doc June 2009
Table 4-5 Residential Monthly Garbage Rates from Various Haulers in St. Paul (does not include recycling cost which is paid separately)
MSW Hauler 30 Gallon 60 Gallon 90 Gallon Hauler A -- $22.76 -- Hauler B $16.34 -- -- Hauler C -- $17.84 -- Hauler D -- $22.50 -- Hauler E $21.75 $27.60 -- Hauler F $22.38 $20.60 -- Hauler G -- -- $26.99 Hauler H $16.00 -- -- Hauler I $26.73 -- $34.91 Hauler J -- $15.15 -- Hauler K $41.00 $45.51 $36.83 Hauler L $22.83 $30.72 $26.18
Additional services (e.g., curbside collection of yard waste, bulky waste, appliances and electronics) may be subject to additional fees. Haulers are free to charge residents what they please for curbside collection of additional items. Due to competitive reasons, haulers may or may not charge extra for bulky wastes.
4.5.2 Organized System Cities
Blaine The rates for the varying levels of service charged to residents differ from that paid to the hauler. The rates charged to the residents by the City are typically more than what the City is required to pay the hauler for the service. These differences in the costs cover administration fees and other overhead costs incurred by the City. The City also pays the disposal tipping fees directly. In Blaine, the cost for the 30 gallon service charged to residents ($8.94) is less than what the City pays the hauler ($10.96). The difference in that cost is subsidized by the higher rates the City charges the residents that use 60 or 90 gallon service. Residents pay $12.79 and $14.98 for the 60 and 90 gallon service, respectively. The City pays the hauler $11.40 and $12.57 for the 60 and 90 gallon service, respectively. This elevated cost structure is meant to influence residents to choose the smallest volume necessary for their home garbage needs. Residents may choose from four levels of service including a senior service, 30 gallon, 60 gallon or 90 gallon service. The 90 gallon service allows for unlimited collection at no additional charge. This means residents with the unlimited service may place additional bags of MSW that do not fit into the supplied 90 gallon container on the curb and the hauler will collect it for no additional fee. Residents using this service also may discard mattresses, couches, toilets, etc. for no additional charge.

R - Analysis of Waste Collection Service Arrangements.doc Foth Infrastructure & Environment, LLC • 95 June 2009
Residents using the 30 and 60 gallon service must contact the City’s contracted hauler to arrange pickup of additional waste. In this case, the hauler sends the resident a bill for these additional items. The hauler will also collect appliances for an additional fee from all residents (including the unlimited service). For this service the hauler bills the resident directly for the additional charges incurred to their account. Residents also are provided with holiday tree pickup and brush pickup at no additional cost. Residents have the choice to subscribe to compost pickup for which they are billed directly from the hauler. The number of households currently subscribing to these services was reported to be 1,500. Some additional services are included in the contract for “free”. The cost to the hauler for these services are actually likely covered in the base rate charged to residents for their collection service. In Blaine’s contract, all the City buildings are serviced for no additional charge. Mankato Mankato has negotiated a base rate for MSW and recyclable material collection with Waste Management. The base rate for MSW collection is $2.89 per household and the base rate for recyclable material collection is $2.20 per household. This rate is paid to the hauler for all households served regardless of container size. Per the contract, these rates are increased on an annual basis by 75% of the Consumer Price Index (CPI) increase for the previous 12 months. Assuming an average 3% per year CPI increase, this equals $3.16 for MSW and $2.40 for recycling updated to 2008. The City pays for disposal directly. Waste Management does not pay the disposal bill. The rate paid to the hauler is significantly less than the rate residents pay to the City. Residents are charged $11.30 for the 35 gallon service and $12.65 for the 64 gallon service. The rates include the cost for MSW and recyclable material collection. Residents pay for recycling even if they do not participate in the service. As an incentive for residents to recycle, a prize ($100.00 in Mankato Area Chamber of Commerce “Chamber Bucks”) is offered on a monthly basis. The recipient of the prize is drawn randomly from the group of residents that have recycled that month. This prize is provided by the hauler as outlined in the contract. Garbage that does not fit in the containers may be placed in 30 gallons bags next to the container. Each additional bag must be labeled with a tag that can be purchased at the local grocery stores for $2.00. These tags are supplied by the hauler. The $2.00 covers the cost for disposal of the extra MSW, $1.00 goes to the hauler and $1.00 goes to the City. The hauler receives the full amount for the purchase of these bags initially and then pays the City their portion on a monthly basis. Residents must contact Waste Management to arrange pickup of bulky waste. In this case, the hauler sends the resident a bill for these additional items. The base rate for both levels of service includes collection of leaves during the fall and holiday tree recycling. The hauler will also collect additional yard waste that is placed in 30 gallon bags sold by the hauler. Each bag costs $0.75.

96 •Foth Infrastructure & Environment, LLC R - Analysis of Waste Collection Service Arrangements.doc June 2009
The City also hosts a spring clean-up event (first four Saturdays in May) for residents to bring electronics to the public works building. The costs associated with this event are included in the base rate. Residents may also place appliances for curbside collection at no additional charge during the entire month of May. Residents must contact the public works department to participate in the appliance collection. Some additional services are included in the contract at no additional charge to the City. The cost to the hauler for these services are actually likely covered in the base rate charged to residents for their collection service. In Mankato’s contract, all the City buildings that have either 35 or 64 gallon containers are serviced for no additional charge. In addition, the hauler is required to provide information to residents about their service options and the day of collection. The hauler is also required to provide at least one recycling seminar per school year at the City schools. Minneapolis Residents may choose from two levels of service including a 22 gallon service or a 94 gallon service. Both levels of service include curbside collection of MSW, recyclable materials, bulky waste (up to two large burnable items each week and up to two metal items/appliances every other week) and seasonal collection of yard waste. Residents may also dispose of up to two additional boxed, bundled or bagged materials outside of their cart. In addition, residents are provided six vouchers per year to drop off additional materials at the Minneapolis Transfer Station and two vouchers per year to drop off tires. This City also has drop-off locations to bring yard waste during the off-season for a fee. Minneapolis charges residents a base fee of $23.00 per month for MSW, recyclable materials, bulky waste and yard waste collection. To distinguish between the two service levels, an additional fee of $4.00 per month is charged for the 94 gallon container and $2.00 per month is charged for the 22 gallon container. These fees cover the disposal costs. Residents who recycle are issued a $7.00 credit to their utility bill each month. Those who do not recycle do not benefit from this credit. In addition, there is a Hennepin County fee applied to each bill to cover costs for research, program development and other environmental services. The fee is a percentage (9%) of the amount the waste generator is billed by their hauler. The final charge included on the bill is Minnesota state tax (9.75%). As with the other organized cities, the rate paid to the hauler is less than the rate residents pay to the City. In the new contract with MRI, the city pays MRI $10.49 per household per month. For that fixed price per month, MRI collects MSW, recyclables, bulky wastes, yard waste, plus additional waste outside the cart. The City retains the total amount less the taxes ($18.00 for the 22 gallon service and $20.00 for the 94 gallon service – if residents recycle) from households that are serviced by City crews. The City funds all the carts, education, disposal tipping fees, HHW, administration, billing, pilot projects and even alley snow plowing and graffiti removal with the remaining funds. St. Cloud St. Cloud utilizes a volume based MSW system combined with recycling. Customers who subscribe to the bag service for MSW collection must purchase “City” bags. These 30 gallon

R - Analysis of Waste Collection Service Arrangements.doc Foth Infrastructure & Environment, LLC • 97 June 2009
bags are green in color and cost $2.00 each (sold in quantities of 10 at local stores). Under this option residents only pay for the MSW placed at the curb. Residents are also charged a recycling/pass by fee of $6.95 per month their utility bill (which is billed on a bi-monthly basis). The 90 gallon MSW cart option costs residents $33.45 per month which is billed on their bi-monthly utility bill. This amount includes the $6.95 recycling/pass by fee. Seasonal yard waste collection services are also available to City collection customers. Residents must place yard waste in 30 gallon clear plastic “City” bags for curbside collection. Clear yard waste bags may be purchased (10 for $10.00) at local stores. Seasonal curbside collection of yard waste is on Mondays between mid-April and mid-November. Holiday tree collection occurs in January and requires one clear yard waste bag to be attached to the tree. Customers may contact the public works department to arrange curbside collection of brush for an additional cost. Residents may also utilize the City’s self-haul compost site. To bring materials to the compost site, residents must purchase an annual self-haul permit for $20.00. This permit allows the residents to self haul unlimited amounts of yard waste to the compost site. Permit holders may take composted soil and wood chips from the site free of charge for personal use. Special pickups for disposal of bulky items such as furniture, mattresses, box springs, carpeting, lumber, etc., is available to all City MSW and recycling collection customers. These pickups will be scheduled on the customer’s MSW collection days. Customers must call at least one day in advance to schedule a pickup. There is no limit on number of collections a resident may request. There is a minimum charge of $20.00 for up to two cubic yards of material. Additional materials will be charged $10.00 per cubic yard. These additional charges will be reflected on a resident’s bi-monthly utility bill. Stillwater Waste Management is responsible for billing residents for their MSW and recyclable material collections services. It appears from the City’s contract and the City’s website that Waste Management retains all the monies charged to residents for service with the exception of the Minnesota residential solid waste tax and the County Environmental Charge. Additional waste outside of a resident’s service level will be collected for a fee of $1.50 for each additional 30 gallon bag. Waste Management provides MSW containers for all residents. All service levels also include appliance, bulky item and seasonal yard waste curbside collection for no additional cost. Residents may also place a reasonable amount of electronics for curbside collection free of charge. After the reasonable number has been met, the hauler may bill the resident directly for any additional electronic collection. The City also hosts an annual Household Hazardous Waste day when residents may bring a reasonable amount of electronics for disposal free of charge. Some additional services are included in the contract at no additional cost to the City. The cost to the hauler for these services are actually likely covered in the base rate charged to residents for

98 •Foth Infrastructure & Environment, LLC R - Analysis of Waste Collection Service Arrangements.doc June 2009
their collection service. In Stillwater’s contract, all the City buildings, parks, and street cans are serviced for no additional charge A recycling subsidy amount is negotiated on an annual basis between the City and the hauler depending on the amount of grant money the City receives from Washington County Municipal Curbside Recycling and Waste Reduction Grant program. The hauler will invoice the City on a quarterly basis for any recycling subsidy refunds, if applicable. 4.6 End Facilities/Delivery Locations Table 4-6 provides a summary of where MSW and recyclables are delivered from each City and the data available on the annual tonnages.

R - Analysis of Waste Collection Service Arrangements.doc Foth Infrastructure & Environment, LLC • 99 June 2009
Table 4-6 Delivery Locations and Tonnages
City MSW Delivery Destination(s) Tonnages
Recyclables Delivery
Destination(s) Tonnages
Duluth
Haulers decide - WLSSD Transfer Station, Landfill –
Superior, Wisconsin
Haulers report tonnages to
WLSSD – scale weights
Haulers decide Do not require
collectors to report tonnages
Eagan
Haulers decide – Burnsville
Landfill, Pine Bend Landfill
22,7301
Haulers decide – MRFs owned by
WM, Allied, Tennis
5,6581
Rochester Olmsted County
Landfill, Olmsted Waste-to-Energy
County – scale weights
Haulers decide - Olmsted County Recycling Center Plus (self haulers)
Do not require collectors to report
tonnages
Woodbury
Haulers decide – RRT – Newport,
Pine Bend Landfill, Seven
Mile Creek Landfill
Do not require haulers to report
tonnages
Haulers decide – MRFs owned by
WM, Allied, Tennis
5,9482
St. Paul
Haulers decide - RRT – Newport, Veolia Transfer Station to Seven
Mile Creek Landfill – Allied
Landfills
Not provided Eureka Recycling MRF, St. Paul 22,0492
Blaine RRT Elk River 16,9302 WM Single stream MRF in 2008 4,9062
Mankato MWPC Transfer Station to RRT –
Newport, MN 6,852
WM MRF in Mankato, Blue Earth County
Recycling Center
1,960
Minneapolis HERC, Burnsville Landfill 105,7112 Allied MRF in
Minneapolis 21,5982
St. Cloud
Waste Management
Transfer Station to Elk River Landfill
or RRT – Elk River
8,1172 Haulers report
tonnages to Tri-County Solid
Waste.
Python’s MRF of St. Cloud
3,6922 Do not require
collectors to report tonnages
Stillwater RRT – Newport Not provided WM single-stream
MRF in Minneapolis
1,2313
1 Data from Dakota County. 2 Data from 2007. 3 Data to-date for 2008.

100 •Foth Infrastructure & Environment, LLC R - Analysis of Waste Collection Service Arrangements.doc June 2009
4.6.1 Open System Cities
Duluth Disposal locations for the collected residential MSW and recyclable materials are determined by each hauler. Most haulers bring residential MSW to WLSSD Transfer Station which in turn delivers material to a landfill located in Superior, Wisconsin. Eagan Disposal locations for the collected residential MSW and recyclable materials are determined by each hauler. Tonnages for both MSW and recyclable materials are required to be reported directly to Dakota County. Rochester Residential haulers in Rochester dispose of collected MSW material at either Olmsted County Landfill or Olmsted WTE. Recyclable materials are processed by haulers. Olmsted County records tonnage information at their facilities by hauler, not by City of origin. Woodbury Most of the residential haulers in the City bring MSW to the RRT Resource Recovery facility in Newport. Several haulers have contracts with the County to bring waste to this facility. Some haulers do not have an “All Waste” contract and bring a portion of the residential waste they collect to Allied Waste Service’s Pine Bend Landfill (in Minnesota) or Veolia’s Seven Mile Creek Landfill (in Wisconsin) via transfer stations. Recyclable materials are processed at hauler owned facilities. St. Paul Most of the residential haulers in the City bring MSW to the RRT Resource Recovery facility in Newport. Several haulers have contracts with the County to bring waste to this facility. Some haulers do not have an “all-waste” contract and bring a portion of the residential waste they collect to Allied Waste Service’s Pine Bend Landfill (in Minnesota) or Veolia’s Seven Mile Creek Landfill (in Wisconsin) via transfer stations. Recyclable materials are processed at Eureka Recycling’s Material Recovery Facility (MRF).
4.6.2 Organized System Cities
Blaine All residential MSW collected in Blaine is disposed of at RRT Resource Recovery facility in Elk River. Processing of recyclable materials in 2008 was conducted at the Waste Management site in Minneapolis. Mankato Residential MSW is delivered to the Minnesota Waste Processing Corporation transfer station located in Mankato where it is hauled to the RRT Resource Recovery facility in Newport. Recycling is processed at the Blue Earth County Recycling Center. Mankato (currently has dual sort recycling) is interested in switching to single sort recycling. However, the City will need to wait until the contract to bring recyclable materials to the County Recycling Center has expired
R - Analysis of Waste Collection Service Arrangements.doc Foth Infrastructure & Environment, LLC • 101 June 2009
because the facility is not currently equipped to handle single stream. The in-depth survey respondent thought it would be easier if the entire County implemented single sort recycling program so the proper operational changes can be made at the County Recycling Center in order to accommodate single sort recycling. Minneapolis All acceptable MSW goes to the HERC in Minneapolis. Items that cannot be disposed of there (e.g. bulky items) go to the Burnsville Landfill. All recyclable material collected by MRI and City staff goes to Allied Waste Service’s MRF in Minneapolis. St. Cloud All MSW collected is transported to a Waste Managements transfer station (located at 650 Highway 10 North, in St Cloud) prior to being disposed of at the RRT Resource Recovery facility in Elk River or the Elk River Landfill. All recyclable materials are processed of at Python’s MRF of St. Cloud (through 2008). Stillwater The City’s contract with Waste Management requires the hauler to collect solid waste data and report it to the City when requested. In addition the hauler must submit copies of solid waste reports that are submitted to Washington County to the City when requested. The hauler is required to collect recyclable material data and report it to the City on a quarterly basis. Residential MSW is disposed of at the RRT Resource Recovery facility in Newport. Residential recyclable materials are processed at the Waste Management single-stream MRF in Minneapolis. 4.7 Waste Assurance The cities of Eagan, Duluth, St. Paul, and Woodbury do not have any “waste assurance” mechanisms in place. The haulers operating in those cities make the decision on where MSW is delivered. There are several haulers operating in St. Paul and Woodbury that have waste delivery agreements to deliver MSW to the RRT Newport Resource Recovery facility. Most of them have signed agreements to deliver all the MSW they collect in Ramsey and Washington Counties to the RRT Resource Recovery in Newport, thus providing a form of contractual waste assurance (at least for the contract term). These include:
♦ Gene’s Disposal ♦ Highland Sanitation ♦ Horrigan Hauling ♦ Ken Berquist & Sons ♦ KO Sanitation ♦ Krupenny & Son, Inc. ♦ Logans ♦ Pete’s Rubbish Hauling ♦ R&M Sanitation ♦ Tony Mudek Sanitation ♦ Triangle Rubbish ♦ Waste Management
102 •Foth Infrastructure & Environment, LLC R - Analysis of Waste Collection Service Arrangements.doc June 2009
Some haulers operating in these two cities deliver a portion of the wastes they collect to the RRT Resource Recovery facility in Newport and the rest to other locations. These haulers include:
♦ Allied Waste Services ♦ Aspen Waste Systems ♦ Red Arrow ♦ Veolia
The city of Rochester is located in Olmsted County who has a long history of waste assurance. Olmsted County constructed a WTE facility in the mid 1980’s and utilized a designation ordinance to control the flow of waste to their facility. They currently have contracts with all the haulers to deliver MSW to the WTE facility. The contracts were put in place between Olmsted County in lieu of the County districting the County and developing single hauler contracts for collection in each of the districts. The cities of Blaine, Mankato, Minneapolis, St. Cloud and Stillwater are located in counties that have contracts with WTE facilities. Each of the cities is required under the Public Entities Law to follow their respective county solid waste management plan. Each of the counties (Anoka, Blue Earth, Hennepin, Stearns and Washington) has solid waste management plans that call for processing MSW at resource recovery facilities. The cities of Blaine, Mankato and Stillwater have clauses in their respective collection contracts requiring delivery of MSW to the county designated facilities. The cities of Minneapolis and St. Cloud have municipal crews that deliver to the appropriate facilities (the Minneapolis contract with MRI covers the delivery location). 4.8 Attempts to Organize The five organized cities all have a long history with their organized systems. Attempts to organize were noted in some of the five open cities. St. Paul The city of St. Paul has always had an open hauling system, even during the period 1970 to 1980, when the City actually provided trash hauling service in competition with private haulers. There have been several attempts to convert to an organized system over the years. Recycling collection is organized under a contract with Eureka Recycling. Nevertheless, the City continues to have an open system for garbage. To provide some historical perspective on the topics and past activities, there are five documents from the history of organized collection discussions included in Appendix G. The documents span from approximately 1980 to 1990 and provide a cross section of the history of the discussion of open versus organized collection in St. Paul. Many of the issues of discussion and contention were the same back then as they continue today (choice, traffic, cost, etc.). There have been additional efforts to organize collection conducted at the District Council level in St. Paul. Over the past two decades, there have been isolated but notable examples of individual citizens attempting to “organize” their neighbors into using the same trash hauler on each block or group of blocks. This form of organized collection is generally still based on the authority and choice of individual home owners to contract with their own hauler, but there is a

R - Analysis of Waste Collection Service Arrangements.doc Foth Infrastructure & Environment, LLC • 103 June 2009
volunteer neighbor who leads the “grass roots” initiative to encourage all households on a block to select the same hauler. Often, these volunteer, citizen – based initiatives would receive communications and other unofficial support from the neighborhood community planning councils. A complete record of all such citizen – based initiatives is not known to be available. However, based on recent articles in the daily and neighborhood monthly newspapers, and personal communications, the following list of grass-roots, organized collection systems have been recorded (in reverse chronological order):
♦ Saint Anthony Park neighborhood (September 2008)
♦ Highland Park neighborhood (June 2008)
♦ East Side neighborhood (June 2008) (Note: “Same collection day” plan, not necessarily organized collection with one hauler.)
♦ St. Clair / Macalester / Berkeley / Davern alleys within the Macalester-Groveland neighborhood
♦ Montrose – Mount Curve in the Mac – Groveland Neighborhood (May 2007)
♦ Macalester-Groveland neighborhood (January 2007)
♦ Three blocks in between and near Princeton / Sargent Avenues & Kenneth / Prior Streets in the Macalester-Groveland neighborhood (December 2006)
♦ Summit Hill area and the Hamline – Midway Community (about 2006)
♦ Macalester-Groveland’s “Tangletown” area (early 1980’s)
♦ Southwest Area District Council (late 1970’s and early 1980’s) (Note: Now the Highland and Macalester-Groveland neighborhoods)
Although the above list includes ten groups of blocks in various neighborhoods, these represent a relatively small portion of St. Paul. One recent organizing meeting coordinated by Saint Anthony Park District 12 Community Council featured Todd Seabury-Kolod as the guest speaker. Mr. Seabury-Kolod has taken on this volunteer role as local neighborhood guest speaker and organizing advisor to other St. Paul neighborhoods and citizens interested in organizing their trash systems on their own blocks. The open discussion at the meeting, and review of news media articles, resulted in the following list of advantages for organized collection by citizen – based action:
♦ Demonstrates that citizens can make a positive change. Builds confidence in citizen – based action. The block-by-block level of organizing is a manageable geographic and political area to accomplish change to affect house-by-house decisions.
♦ Provides a project for neighbors to interact with each other on a one-on-one basis as the organizer works to rally households to switch to the selected hauler.
♦ Environmental improvements such as reduced air and noise pollution.
♦ Reduced road and alley pavement impacts.

104 •Foth Infrastructure & Environment, LLC R - Analysis of Waste Collection Service Arrangements.doc June 2009
♦ Potential “block rate” discounts.
♦ Residents learn more about the potential to negotiate hauling rates.
♦ Improved recycling rates and recovery.
♦ Encourages households to look again at the level of solid waste collection service (i.e., size of cart at 38, 65 or 95 gallons).
♦ Encourages households to look at shared solid waste and yard waste collection services.
♦ Improved safety (i.e., on the average, trucks that stop at every house drive slower that trucks that have only a few stops on each block).
♦ If it is preferred by the residents, their block can help promote business with the smaller, local hauling companies.
♦ Citizen – based organizing helps keep City and County government out of the decision making process.
♦ Organizing residential collection by citizens could lead to similar organizing of commercial collection by small businesses.
♦ Organized collection provides more accountability of which residents have service and therefore may allow the City to more readily monitor illegal dumping. With open hauling, the City can’t track which property owners are failing to sign up for private collection.
The meeting also resulted in listing the following disadvantages to organizing trash collection n this manner:
♦ Takes some of the flexibility and freedom to switch haulers away from the individual homeowner. The “block” must now make a collective decision to switch. Therefore, the inertia is in favor of the incumbent hauler and may not respond as readily to service requests.
♦ The organizing effort can be time intensive for citizen volunteers, especially the leader.
♦ An “advisory board” of neighbors may be needed to help direct decisions of the block leader.
♦ If the smaller, local haulers are preferred, they may have less fleet and staff resources. Smaller haulers will have less capital to re-invest.
♦ If the smaller, local haulers are preferred, they may not always have the cheapest rates.
♦ The sustainability of the organized trash hauling by block is dependent on citizen volunteer efforts which may ebb and flow.
♦ If the block – selected hauling firm is acquired by another company, the block may not have any recourse and the organizing effort may need to be repeated.
The news articles covering the citizen – based initiatives provide some of the commentary from neighborhood, city / county officials, and private hauler associations. The reporters stated that there are 55 licensed trash haulers in St. Paul, and 21 serve residential customers according to the Public Works Department. City and County officials that have had direct experience with attempts to organize open hauling communities stated that this kind of block activism, rather

R - Analysis of Waste Collection Service Arrangements.doc Foth Infrastructure & Environment, LLC • 105 June 2009
than regulation, may be the best way to change hauling practices. Past attempts to organize trash collection in St. Paul and Ramsey County usually became a volatile, political issue.
♦ “Any attempt to legislate garbage collection typically erupts into a war among government, the industry and homeowners who cherish their right to hire and fire their own haulers.”
♦ “…Just a few years ago, several thousand homeowners mailed postcards to Ramsey and
Washington Counties fighting a proposal to pursue public trash collection. Industry groups coordinated the campaign.”
♦ “The industry will fiercely fight it, and the communities get caught in the middle.”
The solid waste hauling industry has collectively and individually opposed city and county efforts to organize open hauling communities. But a representative of the National Solid Waste Management Association (NSWMA) has stated that they do not oppose any approach to choosing a single hauler, as long as the movement is voluntary and organized by individuals. Additional information can be accessed from the Saint Anthony Park Community Council web page: http://www.sapcc.org/:
“Interested in Organizing Your Block to Use a Single Hauler?
“If you read the Bugle article about Mary Hamel organizing her block and would like to know more, you can read the packet of information that was distributed at our Single Hauler Workshop.”
Rochester County officials have considered and rejected organized collection due to public pressure. Woodbury The County raised the issue a few years ago, prompting a vigorous hauler campaign to customers about government taking away their “choice”. Council received hundreds of calls, emails, etc. from citizens opposing change. As a result, Council has not wished to raise the issue again. The City noted they “Wish we could go back in time and change how our system was originally set up. Especially with recycling, having one program/provider for the entire City would certainly help with outreach and education.” 4.9 Green House Gas Identifying and analyzing overlapping collection service areas in open systems along with the associated miles traveled and fuel consumed that contributes to GHG emissions was an important part of this study. Fuel consumption data for collection operations was necessary to determine GHG emissions and any projected reductions. For this project, basing GHG emission solely on miles per gallon rate for collection vehicles would not accurately portray emissions. Projected efficiencies, specifically fuel consumption gained through organized collection must be calculated using two key factors – fuel consumption while driving between stops and deadheading (under power) and
106 •Foth Infrastructure & Environment, LLC R - Analysis of Waste Collection Service Arrangements.doc June 2009
fuel consumption while idling (loading materials). These two consumption values combined provide the fuel use for collection services while actually on a collection route. To develop accurate estimates of existing fuel use in the various open cities, field work was conducted to gather route data. The data collected for haulers in each in-depth open city include a sample of route miles driven, total time on route which is divided into two portions, driving time and loading time. Data was also collected on the total number of households served and total households driven past during the field sample. With fuel consumption averages and the above mentioned data, one can determine the amount of fuel used per household collected. As the percentage of the number of households collected increases, there is greater efficiency in collection and less drive by time. This translates into fuel savings and reduces GHG emissions associated with collection of waste/recyclables per household. With the data collected from field work along with market share data research, Foth determined the relative GHG emissions for existing, open collection systems versus an organized collection system.
4.9.1 Background Private hauling companies and municipal hauling organizations keep track of overall fuel consumption as part of the management of operations. Fuel costs are a significant portion of operating costs and somewhat manageable in nature. Haulers have routing software to show the shortest distances necessary to collect waste/recyclables from customers and/or the institutional memory of the organization and route workers to do the same. In order to show differences in fuel consumption rates, the function of driving to perform collections (field collection activities) must be differentiated from the driving to and from the route and driving to disposal facilities (general driving). This differentiation between driving activities must be done to account for the fuel use when collection vehicles are on route (with idling) versus general driving. Research as part of this analysis revealed that the hauling companies and municipal hauling organizations observed were not able to quantify their fuel use differentiated by consumption between field collection activities and general driving. This report concentrates on differences in fuel consumption that exist for the field collection activities of haulers who service only a portion of the households in any area versus the field collection activities of haulers servicing all households. It is important to understand that there is one constant in providing collection services; a vehicle driven at a minimum, from house to house and the vehicle will stop for a brief period of time at every household serviced to perform the loading operation. For purposes of this report, the data for driving between households is referred to as “drive data” and the data for the period stopped and emptying containers is referred to as the “loading data.” This analysis demonstrates the measurable difference in providing those services to every household versus serving something less than every household. The data is provided in a relational form. Trying to calculate or report the exact fuel consumption rates for the multitude of actual field conditions and vehicles that occur in the in-depth cities is difficult. Collection vehicles used by

R - Analysis of Waste Collection Service Arrangements.doc Foth Infrastructure & Environment, LLC • 107 June 2009
the solid waste industry in Minnesota come in a multitude of configurations including manual loading versus automated loading, single axle to tandems with tag axles, gasoline and diesel, old and new, etc. It is beyond the scope of this report to determine efficiencies (fuel consumption) in a side by side comparison considering the multitude of variables that exist in the industry. Therefore the data presented in this report is blind to the vehicle variables but concentrates on comparing efficiencies on a relative fuel consumption basis. Driving distance between households serviced (stops) varies to some degree by block, development, neighborhood and city. To account for this variability, averages were determined and are utilized throughout this report. The data collected demonstrate there are substantial differences in the various areas of the cities' makeup and thus justifies the averaging methodology. The data also shows the differences in market shares by areas within those communities and the associated relational collection efficiency factors.
4.9.2 Establishing the Field Trial Data In order to develop a standardized data set that eliminates the variability of pieces of equipment used in the industry, a standard fuel economy factor was created. The base line data for this report was established by actual field test results. A 20 cubic yard, tandem axle, packer collection vehicle was used to replicate actual field collection activities and collect fuel economy information. This vehicle was equipped with an engine management system capable of monitoring and reporting the following parameters:
♦ Fuel consumption with accuracy of 0.01 gallons; ♦ Time; and ♦ Number of occasions of brake use.
The engine management system of the vehicle was set to zero and a specific set of field conditions were tested. The vehicle was driven a set distance, brought to a complete stop and immediately driven that distance again. This process was repeated at selected intervals for distances from 1.6 to 3.7 miles. After a period of time driving a specific distance interval, the engine management system data was collected and logged. This process was repeated at all of the specified distances and the data was collected. The different distance increments measured were 100, 220, 330, 500, and 660 feet. These incrementally increasing distances are necessary to demonstrate the variability of collection logistics that exist in the in-depth cities. The distances chosen and field trials were intentionally selected and conducted before the field observations in the in-depth cities began. Merely estimating the property widths that exist in urban Minnesota cities fails to account for the necessary extraneous driving required to accomplish driving by each and every household in any given community. There are cross streets present, and occasionally a minimal amount of backtracking to pass each household on the loader side of the vehicle. It was assumed before the study that the minimum distance would likely be near 100 feet. The balance of the distances used as the basis, were derived assuming that the relativity of the actual field trials would reveal distances significantly greater and therefore the increments are not exactly lineal. In order to account for the fuel consumption for the loading operation, the fuel consumption data was obtained by measuring the vehicle fuel consumption rate of the same vehicle used for the

108 •Foth Infrastructure & Environment, LLC R - Analysis of Waste Collection Service Arrangements.doc June 2009
field trial at idle. For this report, it is assumed that all collection vehicles are outfitted with automated lifting devices that are designed to be operated with the engine at idle (most common operation). Again, the engine management system was reset to zero. The vehicle was stopped with the engine running at idle with the power-takeoff engaged for 30 minutes. After this time period, the engine data was collected. This idle fuel consumption rate was measured in 0.01 gallons per hour and ultimately converted into ounces of fuel consumed per stop. Table 4-7 shows the results of the field trials. Table 4-7 Field Trial Fuel Consumption Data
Distance increment
driven (feet)
Total distance driven during
trial (miles)
Total fuel consumed
during trial
(gallons)
Total fuel consumed
during trial
(ounces)
Number of
increments driven in
trial
Fuel consumed
per driven
increment(ounces)
Fuel consumption
at idle per stop
(ounces)1
Total fuel consumed
per increment,
driving and
loading (ounces)
100 3.7 1.76 225 195 1.16 0.53 1.69 220 1.8 1.1 141 43 3.27 0.53 3.81 330 1.9 1.0 128 30 4.27 0.53 4.80 500 3.2 1.4 179 34 5.27 0.53 5.80 660 2.5 0.9 115 20 5.76 0.53 6.29
1 Observed average time spent loading at each serviced household was measured at 15 seconds. Trial vehicle was stopped with power takeoff engaged with the engine at idle for 30 minutes. Fuel consumed during these 30 minutes was 0.5 gallons or 64 ounces. A fuel consumption rate of 64 ounces per 30 minutes = 0.53 ounces per 15 seconds. Figure 4-1 Field Trial Fuel Consumption shows the ounces of fuel consumed per stop for the different increments (distances between stops). A vehicle driving 100 feet between stops consumes fuel at a rate of 1.16 ounces per interval (per stop). To account for the fuel consumed while loading, 0.53 ounces of fuel consumed in the fifteen (15) seconds of time for loading was used. Fifteen seconds was the actual average observed time while monitoring the real time collections in the in-depth cities. Therefore the total fuel consumed for each serviced stop at 100 feet is calculated to be 1.69 ounces.

R - Analysis of Waste Collection Service Arrangements.doc Foth Infrastructure & Environment, LLC • 109 June 2009
Figure 4-1 Field Trial Fuel Consumption
0
1
2
3
4
5
6
7
0
100
200
300
400
500
600
700
Feet per Stop
Oun
ces
of F
uel C
onsu
med
Figure 4-1 shows the total fuel consumption in ounces per stop at the various distance increments. As the distances increase, the amount of fuel consumed increases, however this increase is not linear. Due to the vehicle manufacturer’s need to increase fuel economy, engine management systems have implemented “Puff Arresters.” These Puff Arresters reduce the amount of fuel injected into the engine when first starting from a dead stop. This technology reduces the amount of fuel used, promotes more efficient combustion, increases fuel economy and eliminates the old puff of black smoke (excess carbon) emitted when first accelerating. This technology increases the fuel economy dramatically when traveling very short distances. Coincidentally, these short distances (close to the necessary distances between all households) lend itself to the optimum fuel efficiency for providing collection services. As the measured distance increments increase, this fuel efficiency is reduced. Figure 4-2 Fuel Economy Versus Distance below displays this trend.
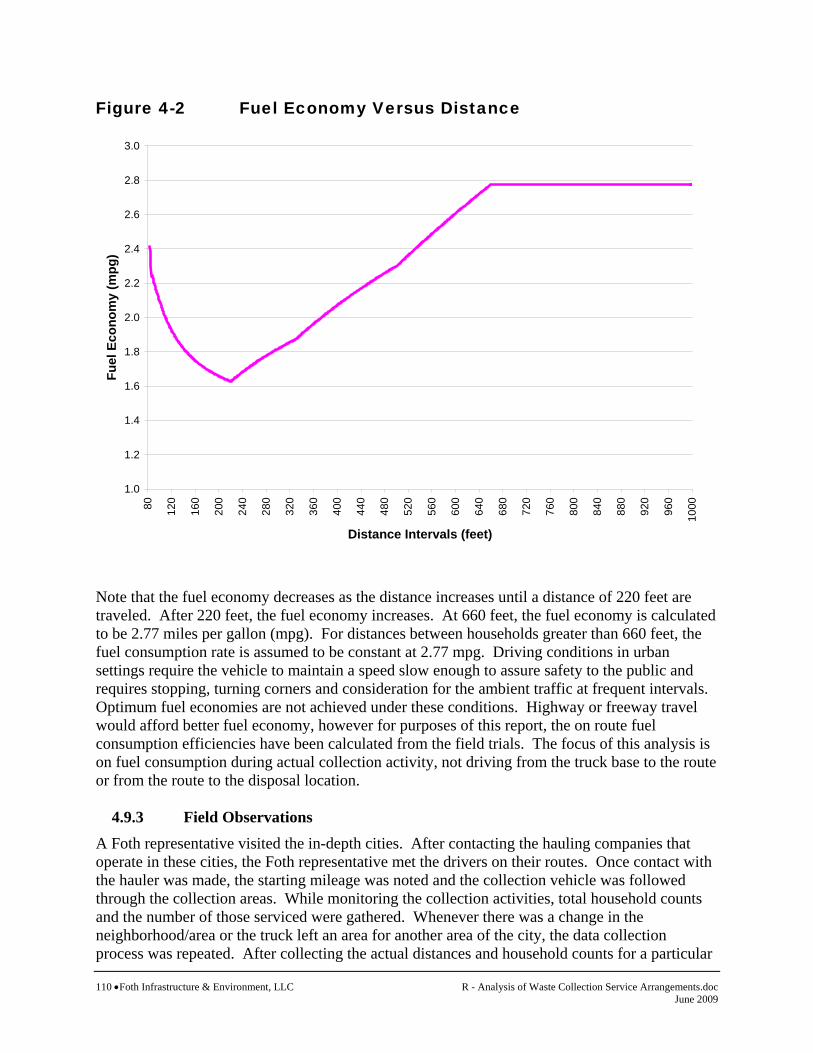
110 •Foth Infrastructure & Environment, LLC R - Analysis of Waste Collection Service Arrangements.doc June 2009
Figure 4-2 Fuel Economy Versus Distance
1.0
1.2
1.4
1.6
1.8
2.0
2.2
2.4
2.6
2.8
3.080 12
0
160
200
240
280
320
360
400
440
480
520
560
600
640
680
720
760
800
840
880
920
960
1000
Distance Intervals (feet)
Fuel
Eco
nom
y (m
pg)
Note that the fuel economy decreases as the distance increases until a distance of 220 feet are traveled. After 220 feet, the fuel economy increases. At 660 feet, the fuel economy is calculated to be 2.77 miles per gallon (mpg). For distances between households greater than 660 feet, the fuel consumption rate is assumed to be constant at 2.77 mpg. Driving conditions in urban settings require the vehicle to maintain a speed slow enough to assure safety to the public and requires stopping, turning corners and consideration for the ambient traffic at frequent intervals. Optimum fuel economies are not achieved under these conditions. Highway or freeway travel would afford better fuel economy, however for purposes of this report, the on route fuel consumption efficiencies have been calculated from the field trials. The focus of this analysis is on fuel consumption during actual collection activity, not driving from the truck base to the route or from the route to the disposal location.
4.9.3 Field Observations A Foth representative visited the in-depth cities. After contacting the hauling companies that operate in these cities, the Foth representative met the drivers on their routes. Once contact with the hauler was made, the starting mileage was noted and the collection vehicle was followed through the collection areas. While monitoring the collection activities, total household counts and the number of those serviced were gathered. Whenever there was a change in the neighborhood/area or the truck left an area for another area of the city, the data collection process was repeated. After collecting the actual distances and household counts for a particular

R - Analysis of Waste Collection Service Arrangements.doc Foth Infrastructure & Environment, LLC • 111 June 2009
area/community, comparisons were made to the field trial data. The field trial data sets are used throughout this report as the basis for comparisons and analysis. Field observations conducted of haulers in the in-depth, open collection system cities showed city average distances driven per stop serviced ranging from 275 feet to 586 feet. The actual distance measured per household (all households that could have been serviced while the truck was driving by) ranged from 83 feet to 123 feet. The field observation data results are presented in Table 4-8 and Figure 4-3 below. When the distance per serviced household is plotted against the actual distance per household, the varying degrees of relativity can be shown. Note that the distances per household within a given city are averages. Table 4-8 Field Observations - Average Observed Distances
between Serviced Households versus Average Actual Distance between Households
City
Distance per HH* serviced
(feet)
Actual distance per HH total
route (feet)
Eagan 582 118 Duluth 275 112 Rochester 291 86 Woodbury 315 123 St. Paul 586 83.7
* HH = Households
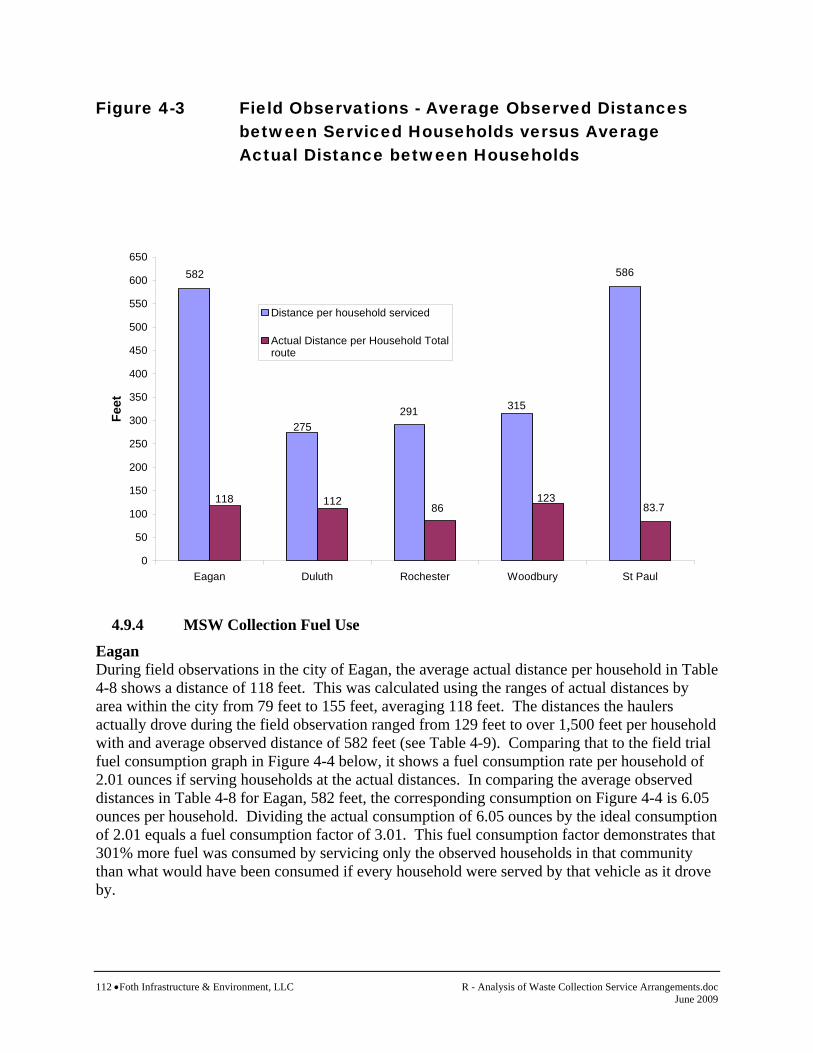
112 •Foth Infrastructure & Environment, LLC R - Analysis of Waste Collection Service Arrangements.doc June 2009
Figure 4-3 Field Observations - Average Observed Distances between Serviced Households versus Average Actual Distance between Households
291
586
315
275
582
112 83.7123
86118
0
50
100
150
200
250
300
350
400
450
500
550
600
650
Eagan Duluth Rochester Woodbury St Paul
Feet
Distance per household serviced
Actual Distance per Household Totalroute
4.9.4 MSW Collection Fuel Use
Eagan During field observations in the city of Eagan, the average actual distance per household in Table 4-8 shows a distance of 118 feet. This was calculated using the ranges of actual distances by area within the city from 79 feet to 155 feet, averaging 118 feet. The distances the haulers actually drove during the field observation ranged from 129 feet to over 1,500 feet per household with and average observed distance of 582 feet (see Table 4-9). Comparing that to the field trial fuel consumption graph in Figure 4-4 below, it shows a fuel consumption rate per household of 2.01 ounces if serving households at the actual distances. In comparing the average observed distances in Table 4-8 for Eagan, 582 feet, the corresponding consumption on Figure 4-4 is 6.05 ounces per household. Dividing the actual consumption of 6.05 ounces by the ideal consumption of 2.01 equals a fuel consumption factor of 3.01. This fuel consumption factor demonstrates that 301% more fuel was consumed by servicing only the observed households in that community than what would have been consumed if every household were served by that vehicle as it drove by.

R - Analysis of Waste Collection Service Arrangements.doc Foth Infrastructure & Environment, LLC • 113 June 2009
Figure 4-4 Fuel Consumption – City of Eagan
2.01
6.05
0
1
2
3
4
5
6
7
0 50 100
150
200
250
300
350
400
450
500
550
600
650
700
Distance between Stops (ft.)
Fuel
Con
sum
ed p
er S
top
(oz.
)
Base Line
Eagan Actual
EaganObserved
Table 4-9 Field Observation Data – City of Eagan
Total distance driven
on route
(miles)
Number of HH
serviced on
route
Total number of HH
on route
Percentage of HH
serviced
Distance per HH
total route (feet)
Distance per HH serviced
(feet) 2.7 12 92 13.0% 155.0 1,188.0 1.3 53 87 60.9% 78.9 129.5 0.9 3 31 9.7% 153.3 1,584.0 5.6 32 273 11.7% 108.3 924.0 3.3 25 135 18.5% 129.1 697.0
Total 13.8 125 618 20.2% 117.9 582.9 The city of Eagan has an open collection system with seven licensed haulers for residential service. Each hauler is required to report the number of residential accounts they service to Dakota County. This data allows the percentage of market share for each hauler to be estimated along with their actual number of stops. Using the data, along with the average distance between all households in Eagan, the average distance between stops can be estimated for each hauler,

114 •Foth Infrastructure & Environment, LLC R - Analysis of Waste Collection Service Arrangements.doc June 2009
based on their respective market shares. Using the field observation fuel consumption graph provides the estimated fuel use by each hauler to serve their market share. The market share reported from Dakota County for the seven haulers serving Eagan is shown below.
♦ Hauler A – 18.4% ♦ Hauler B – 4.8% ♦ Hauler C – 8.1% ♦ Hauler D – 1.2% ♦ Hauler E – 0.1% ♦ Hauler F – 4.9% ♦ Hauler G – 62.5%
Utilizing the reported market shares for the licensed haulers, Table 4-10 – Eagan Fuel Use Based on Estimated Market Shares shows the composite data for the city of Eagan. Because haulers with relatively small market shares may not need to drive past every household to serve their limited customers, haulers having market shares less than 10% were combined. This minimizes the effect haulers with small market shares have on the overall data. The calculation to determine the necessary distances to provide services for that fraction of households is a linear equation based on the measured 118 feet between every household. If a hauler only services half the households, the requisite distance would be 236 feet, as you would skip every other household on average to service one. Understandably, only averages can be used here in that the exact sequence of households serviced is impossible to determine. Having the average distances per household with a corresponding fuel consumption rate per household and the exact number of households serviced, the total fuel use by hauler can be computed.

R - Analysis of Waste Collection Service Arrangements.doc Foth Infrastructure & Environment, LLC • 115 June 2009
Table 4-10 Eagan Fuel Use Based on Estimated Market Shares
Market share
HH serviced
Distance per HH
total route (feet)
Distance per HH service
by hauler (feet)
Fuel cons1 per
serviced stop
(ounces)
Fuel cons per
week (ounces)
Fuel cons per
week (gallons)
Fuel cons per
year (gallons)
Fuel cons per HH per
year (gallons)
Consumption factor
relative to organized fuel cons
Hauler A 18.4% 3,182 118 641 6.24 19,859 155.2 8,068 2.54 Haulers B,C,D,E & F 19.1% 3,304 118 618 6.16 20,350 159.0 8,267 2.50 Hauler G 62.5% 10,810 118 189 3.26 35,241 275.3 14,316 1.32 Total 100% 17,296 75,449 589.4 30,651 1.77 2.16 Organized 100% 17,296 118 118 2.01 34,765 271.6 14,123 0.82 1.00 1cons = consumption

116 •Foth Infrastructure & Environment, LLC R - Analysis of Waste Collection Service Arrangements.doc June 2009
On the last row of Table 4-10 is the calculation for having a single truck service every household in Eagan. The relational factor of fuel efficiency is 30,651 divided by 14,123, or 2.16. This means it takes 216% more fuel to service all of the households by several vehicles than would be necessary for a single vehicle to service all of the households. The difference over one year is calculated to be a savings of 16,528 gallons of fuel. This is lower than calculated from field observations because one hauler was reported to have a more significant market share (62.5%) than was observed in the actual Eagan field observations. Duluth In the city of Duluth, the average actual distance per household in Table 4-11 shows a distance of 112 feet. Comparing that to the field trial fuel consumption graph in Figure 4-5 below, it shows a fuel consumption rate per household of 1.9 ounces, if serving households at the actual distances. Table 4-11 provides the data from the field observations in Duluth. In comparing the averaged observed distances in Table 4-11 for Duluth, 275 feet, the corresponding consumption is 4.3 ounces per household, at averaged observed distances. By dividing the actual consumption of 4.3 ounces by the ideal consumption of 1.9 shows a consumption factor of 2.26. This consumption factor demonstrates that 226% more fuel was consumed by servicing only the observed households in Duluth than what would have been consumed if every household were serviced by that vehicle. Figure 4-5 Fuel Consumption – City of Duluth
1.90
4.30
0
1
2
3
4
5
6
7
0 50 100
150
200
250
300
350
400
450
500
550
600
650
700
Distance between Stops (ft.)
Fuel
Con
sum
ed p
er S
top
(oz.
)
Base Line
Duluth Actual
DuluthObserved

R - Analysis of Waste Collection Service Arrangements.doc Foth Infrastructure & Environment, LLC • 117 June 2009
Table 4-11 Field Observation Data – City of Duluth
Total distance driven
on route
(miles)
Number of HH
serviced on
route
Total number of HH
on route
Percentage of HH
serviced
Distance per HH
total route (feet)
Distance per HH serviced
(feet) 7.1 179 390 45.9% 96.1 209.4 8.2 76 344 22.1% 125.9 569.7
Subtotal 15.3 255 734 34.7% 110.1 316.8
Subtotal 5.2 138 228 60.5% 120.4 199.0
Total 20.5 393 962 40.9% 112.5 275.4 To develop an estimate of the hauler market shares in the city of Duluth, Foth worked with staff at the WLSSD using their records of MSW deliveries to their transfer station and hauler license data. Based on the WLSSD familiarity with the haulers, the following estimates of market share were developed:
♦ Hauler A – 34.62% ♦ Hauler B – 11.48% ♦ Hauler C – 47.99% ♦ Hauler D – 2.47% ♦ Hauler E – 2.35% ♦ Hauler F – 1.09%
Market share data calculations listed above are translated to respective market share of Duluth’s 24,505 dwelling units in Table 4-12 below.
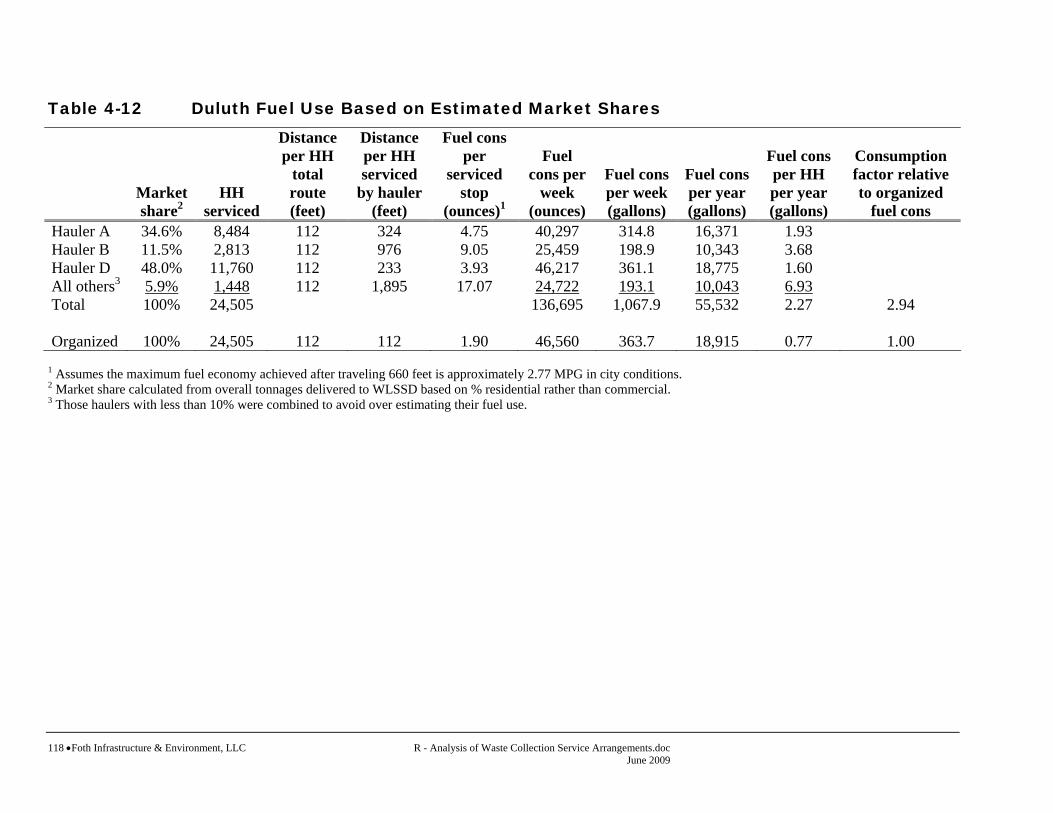
118 •Foth Infrastructure & Environment, LLC R - Analysis of Waste Collection Service Arrangements.doc June 2009
Table 4-12 Duluth Fuel Use Based on Estimated Market Shares
Market share2
HH serviced
Distance per HH
total route (feet)
Distance per HH serviced
by hauler (feet)
Fuel cons per
serviced stop
(ounces)1
Fuel cons per
week (ounces)
Fuel cons per week (gallons)
Fuel cons per year (gallons)
Fuel cons per HH per year (gallons)
Consumption factor relative to organized
fuel cons Hauler A 34.6% 8,484 112 324 4.75 40,297 314.8 16,371 1.93 Hauler B 11.5% 2,813 112 976 9.05 25,459 198.9 10,343 3.68 Hauler D 48.0% 11,760 112 233 3.93 46,217 361.1 18,775 1.60 All others3 5.9% 1,448 112 1,895 17.07 24,722 193.1 10,043 6.93 Total 100% 24,505 136,695 1,067.9 55,532 2.27 2.94 Organized 100% 24,505 112 112 1.90 46,560 363.7 18,915 0.77 1.00
1 Assumes the maximum fuel economy achieved after traveling 660 feet is approximately 2.77 MPG in city conditions. 2 Market share calculated from overall tonnages delivered to WLSSD based on % residential rather than commercial. 3 Those haulers with less than 10% were combined to avoid over estimating their fuel use.

R - Analysis of Waste Collection Service Arrangements.doc Foth Infrastructure & Environment, LLC • 119 June 2009
The three haulers serving Duluth residential accounts with the largest market shares (>10%) are included separately. Because the reported/calculated market share of the three remaining haulers was so small, their count was combined into All Others. This minimizes the effect these haulers with small market shares have on the overall fuel use data because it is not known whether the dwelling unit’s calculated for those small haulers are spread throughout the city or a small concentrated area. Even so, by calculating the fuel consumption of the combined smallest market share haulers, one can see that their consumption factor is substantially higher than any of the others. The calculated fuel consumption of the haulers in total, for a year at 55,532 gallons far exceeds the 18,915 gallons that of a single vehicle servicing all dwelling units at the time they pass by (representing a fuel consumption factor of 2.94). This demonstrates that the existing system uses an estimated 294% more fuel than a potential organized system. Rochester In the city of Rochester, the actual distance per household in Table 4-13 shows a distance of 86 feet. Comparing that distance to the field trial fuel consumption graph in Figure 4-6 below, shows a fuel consumption rate per household of 1.46 ounces per household, at actual distances. In comparing the observed average distances in Table 4-13 for Rochester, 292 feet, the corresponding consumption on Figure 4-6 is 4.45 ounces per household. Dividing the actual consumption of 4.45 ounces by the ideal consumption of 1.46 equals a consumption factor of 3.04. This consumption factor demonstrates that 304% more fuel was consumed by servicing only their subscribed households in that community than what would have been consumed if every household were serviced by that vehicle.

120 •Foth Infrastructure & Environment, LLC R - Analysis of Waste Collection Service Arrangements.doc June 2009
Figure 4-6 Fuel Consumption – City of Rochester
1.46
4.45
0
1
2
3
4
5
6
7
0 50 100
150
200
250
300
350
400
450
500
550
600
650
700
Distance between Stops (ft.)
Fuel
Con
sum
ed p
er S
top
(oz.
)
Base Line
Rochester Actual
RochesterObserved
Table 4-13 Field Observation – City of Rochester Total
distance driven
on route
(miles)
Number of HH
serviced on
route
Total number of HH
on route
Percentage of HH
serviced
Distance per HH
total route (feet)
Distance per HH serviced
(feet) 6.3 150 425 35.3% 78.3 221.8 6.3 130 425 30.6% 78.3 255.9 6.3 40 425 9.4% 78.3 831.6 6.3 105 425 24.7% 78.3 316.8
Subtotal 25.2 425 425 100% 78.3 313.1
Subtotal 6 140 328 42.7% 96.6 226.3
Total 12.3 565 753 75.0% 86.2 291.6 To estimate residential market share in the city of Rochester, the MPCA worked with staff at Olmsted County. Three hauling companies collect the vast majority of the residential accounts. The few accounts not collected by these haulers were thought to be inconsequential to these
R - Analysis of Waste Collection Service Arrangements.doc Foth Infrastructure & Environment, LLC • 121 June 2009
calculations and the accounts were spread over the 3 largest haulers. The estimated residential market share for haulers in the city of Rochester is:
♦ Hauler A – 59.5% ♦ Hauler B – 31.4% ♦ Hauler C – 9.1%
The market share estimates are applied to the city of Rochester household data and average distance between households in Table 4-14 below.

122 •Foth Infrastructure & Environment, LLC R - Analysis of Waste Collection Service Arrangements.doc June 2009
Table 4-14 Rochester Fuel Use Based on Estimated Market Shares
Market share
HH serviced
Distance per HH
total route (feet)
Distance per HH
service by hauler (feet)
Fuel cons per
serviced stop
(ounces)
Fuel cons per week (ounces)
Fuel cons per
week (gallons
Fuel cons per year (gallons)
Fuel cons per HH per year (gallons)
Consumption factor relative to organized
fuel cons Hauler A 59.5% 16,954 86 145 2.48 42,046 328.5 17,081 1.01 Hauler B 31.4% 8,963 86 273 4.29 38,452 300.4 15,621 1.74 Hauler C 9.1% 2,583 86 949 8.82 22,779 178.0 9,254 3.58 Total 100% 28,500 103,277 806.9 41,956 1.47 2.50 Organized 100% 28,500 86 86 1.46 41,610 325.1 16,904 0.59 1.00

R - Analysis of Waste Collection Service Arrangements.doc Foth Infrastructure & Environment, LLC • 123 June 2009
Table 4-14 shows that the composite fuel consumption factor in the city of Rochester is 2.50, which is 250% more fuel is estimated to be used than in an organized collection system. This is lower than calculated from field observations because one hauler was reported to have a more significant market share (59.5%) than was observed in the actual Rochester field observations. Woodbury In the city of Woodbury, the actual distance per household in Table 4-15 shows a distance of 123 feet. Comparing that distance to field trial fuel consumption graph in Figure 4-7 below, shows a fuel consumption rate per household of 2.09 ounces at actual average distances. In comparing the field observed distances in Table 4-16 for Woodbury, 316 feet, the corresponding consumption on Figure 4-7 is 4.66 ounces per household. By dividing the actual consumption of 4.66 ounces by the ideal consumption of 2.09 equals a consumption factor of 2.22. This fuel consumption factor demonstrates that 222% more fuel was consumed by servicing only their subscribed households in that community than what would have been consumed if every household were serviced by that vehicle. Figure 4-7 Fuel Consumption – City of Woodbury
2.09
4.66
0
1
2
3
4
5
6
7
0 50 100
150
200
250
300
350
400
450
500
550
600
650
700
Distance between Stops (ft.)
Fuel
Con
sum
ed p
er S
top
(oz.
)
Base Line
WoodburyActualWoodburyObserved

124 •Foth Infrastructure & Environment, LLC R - Analysis of Waste Collection Service Arrangements.doc June 2009
Table 4-15 Field Observation – City of Woodbury Total
distance driven
on route
(miles)
Number of HH
serviced on
route
Total number of HH
on route
Percentage of HH
serviced
Distance per HH
total route (feet)
Distance per HH serviced
(feet) 1.1 38 49 77.6% 118.5 152.8 1.9 79 91 86.8% 110.2 127.0 3.0 117 140 83.6% 113.1 135.4
Subtotal 6.0 234 280 83.6% 113.1 135.4 10.3 101 420 24.1% 129.5 538.5 5.8 127 275 46.2% 111.4 241.1 3.7 27 175 15.4% 111.6 723.6 5.3 31 185 16.8% 151.3 902.7
Subtotal 25.1 286 1,055 27.1% 125.6 463.4
Total 31.1 520 1,335 39.0% 123.0 315.8 Woodbury residents are required by ordinance to contract for garbage services. In that ordinance is a requirement that recycling services be provided by the licensed MSW hauler and that they report the number of dwelling units serviced. With this data their market share can be calculated. Based upon the 2008 second quarter reports, market shares for different haulers are as follows:
♦ Hauler A – 13.1% ♦ Hauler B – 5.1% ♦ Hauler C – 4.5% ♦ Hauler D – 25.2% ♦ Hauler E – 24.4% ♦ Hauler F – 12.2% ♦ Hauler G – 15.5%
Knowing the market shares, number of households and distances between households, one can calculate an estimate of the fuel consumption for the entire city’s solid waste collection services. In Table 4-16 the haulers are listed in order of market share from smallest to largest. Once again, haulers with less than a 10% market share were grouped together as Haulers B and C.

R - Analysis of Waste Collection Service Arrangements.doc Foth Infrastructure & Environment, LLC • 125 June 2009
Table 4-16 Woodbury Fuel Use Based on Estimated Market Shares
Market share
HH serviced
Distance per HH
total route (feet)
Distance per HH service
by hauler (feet)
Fuel cons per serviced
stop (ounces)
Fuel cons per
week (ounces)
Fuel cons per
week (gallons)
Fuel cons per
year (gallons)
Fuel cons per HH per
year (gallons)
Consumption factor relative to organized
fuel cons Haulers B & C1 9.6% 1,892 123 1,277 11.68 22,099 172.6 8,975 4.75 Hauler F 12.2% 2,393 123 1,010 9.35 22,375 174.8 9,090 3.80 Hauler A 13.1% 2,579 123 937 8.71 22,463 175.5 9,126 3.54 Hauler G 15.5% 3,048 123 793 7.45 22,708 177.6 9,225 3.03 Hauler E 24.4% 4,786 123 505 5.82 27,855 217.6 11,316 2.36 Hauler D 25.2% 4,950 123 488 5.73 28,364 221.6 11,523 2.33 Total 100% 19,648 145,862 1139.5 59,254 3.02 3.55 Organized 100% 19,648 123 123 2.09 41,064 320.8 16,682 0.85 1.00
1 Haulers B & C combined due to small market shares.
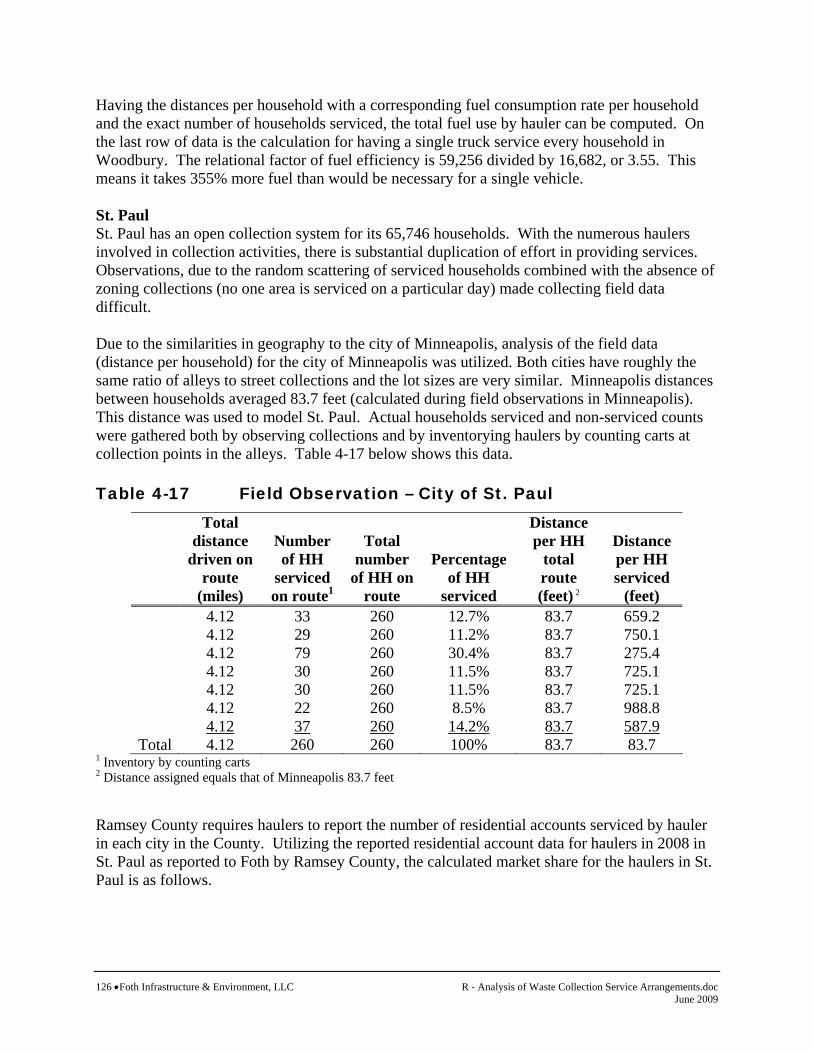
126 •Foth Infrastructure & Environment, LLC R - Analysis of Waste Collection Service Arrangements.doc June 2009
Having the distances per household with a corresponding fuel consumption rate per household and the exact number of households serviced, the total fuel use by hauler can be computed. On the last row of data is the calculation for having a single truck service every household in Woodbury. The relational factor of fuel efficiency is 59,256 divided by 16,682, or 3.55. This means it takes 355% more fuel than would be necessary for a single vehicle. St. Paul St. Paul has an open collection system for its 65,746 households. With the numerous haulers involved in collection activities, there is substantial duplication of effort in providing services. Observations, due to the random scattering of serviced households combined with the absence of zoning collections (no one area is serviced on a particular day) made collecting field data difficult. Due to the similarities in geography to the city of Minneapolis, analysis of the field data (distance per household) for the city of Minneapolis was utilized. Both cities have roughly the same ratio of alleys to street collections and the lot sizes are very similar. Minneapolis distances between households averaged 83.7 feet (calculated during field observations in Minneapolis). This distance was used to model St. Paul. Actual households serviced and non-serviced counts were gathered both by observing collections and by inventorying haulers by counting carts at collection points in the alleys. Table 4-17 below shows this data. Table 4-17 Field Observation – City of St. Paul
Total distance
driven on route
(miles)
Number of HH
serviced on route1
Total number
of HH on route
Percentage of HH
serviced
Distance per HH
total route (feet) 2
Distance per HH serviced
(feet) 4.12 33 260 12.7% 83.7 659.2 4.12 29 260 11.2% 83.7 750.1 4.12 79 260 30.4% 83.7 275.4 4.12 30 260 11.5% 83.7 725.1 4.12 30 260 11.5% 83.7 725.1 4.12 22 260 8.5% 83.7 988.8 4.12 37 260 14.2% 83.7 587.9 Total 4.12 260 260 100% 83.7 83.7
1 Inventory by counting carts 2 Distance assigned equals that of Minneapolis 83.7 feet Ramsey County requires haulers to report the number of residential accounts serviced by hauler in each city in the County. Utilizing the reported residential account data for haulers in 2008 in St. Paul as reported to Foth by Ramsey County, the calculated market share for the haulers in St. Paul is as follows.

R - Analysis of Waste Collection Service Arrangements.doc Foth Infrastructure & Environment, LLC • 127 June 2009
♦ Hauler A – 23.2% ♦ Hauler B – 10.7% ♦ Hauler C – 1.0% ♦ Hauler D – 1.0% ♦ Hauler E – 4.1% ♦ Hauler F – 7.2% ♦ Hauler G – 0.4%
♦ Hauler H – 6.9% ♦ Hauler I – 1.4% ♦ Hauler J – 1.0% ♦ Hauler K – 0.3% ♦ Hauler L – 0.4% ♦ Hauler M – 2.1% ♦ Hauler N – 1.2%
♦ Hauler O – 0.5% ♦ Hauler P – 0.5% ♦ Hauler Q – 0.4% ♦ Hauler R – 21.0% ♦ Hauler S – 16.5%
The total number of accounts reported by the haulers was 4,707 households less than the total of single family residences reported by the city of St. Paul. However, the City also reported that they have routinely assumed that approximately 10% of the households in St. Paul do not contract for services. This includes households that “self haul” their garbage and households that share service. Therefore, the difference between total households eligible and the total reported by the haulers is consistent with the history reported by the City. When calculating the necessary distance a hauler must travel to service any household, the 4,707 households without service must be accounted. Therefore 87.3 feet multiplied by 4,707 households equals 410,921 feet. This distance must be apportioned to those receiving services. The total households reported at 65,746, minus 4,707 households that are not serviced, equals 61,039 households serviced. Dividing the distance of 410,921 feet by 61,039 households serviced, equals 6.7 feet per household. Adding this distance (6.7 feet) to the previously determined distance between households (83.7 feet) equals 90 feet (rounded). Knowing the market shares, number of households and distances between households, one can estimate the fuel consumption for the entire city’s solid waste collection services. In Table 4-18 the haulers are listed in order of market share from largest to smallest. Once again, haulers with less than a 10% market share were grouped together. Haulers E and F were grouped together resulting a combined 14.1%. The remaining 13 haulers were grouped together as All Others because the reported/calculated market share was so small. This minimizes the effects these haulers with small market shares have on the overall fuel consumption data because it is not known whether the dwelling units calculated for those small haulers are spread throughout the city or a small concentrated area. The calculated consumption if each of the haulers collected their percentages of the entire city of 146,695 gallons provides an efficiency factor of 4.37. That is, the existing system uses 437% more fuel than an organized collection system is estimated to use.

128 •Foth Infrastructure & Environment, LLC R - Analysis of Waste Collection Service Arrangements.doc June 2009
Table 4-18 St. Paul Fuel Use Based on Estimated Market Shares
Market share
HH serviced
Distance per HH
total route (feet)1
Distance per HH service
by hauler (feet)
Fuel cons per
serviced stop
(ounces)
Fuel cons per
week (ounces)
Fuel cons per
week (gallons)
Fuel cons per
year (gallons)
Fuel cons per HH per year (gallons)
Consumption factor relative to organized
fuel cons Hauler A 23.3% 14,215 90 386 5.13 72,923 569.7 29,625 2.08 Hauler B 21.0% 12,832 90 428 5.38 69,036 539.3 28,046 2.19 Hauler C 16.5% 10,059 90 546 5.94 59,750 466.8 24,274 2.41 Hauler D 10.7% 6,537 90 840 7.87 51,446 401.9 20,900 3.20 Haulers E & F 14.1% 8,619 90 637 6.22 53,610 418.8 21,779 2.53 All Others 14.4% 8,777 90 626 6.19 54,330 424.5 22,071 2.51 100% 61,039 361,096 2,821 146,695 2.40 4.37 No Service 4,707 Organized 100% 65,746 83.7 83.7 1.36 89,415 698.55 36,325 0.55 1.00
1 There are 4,707 households that are not serviced in St. Paul. To determine the actual distance between total households, 4,707 was multiplied by 83.7 and divided by 61,039. This equals 6.4 additional feet per household. Therefore, the real distance per household equals 83.7 feet plus 6.4 feet whish is rounded to 90 feet.
R - Analysis of Waste Collection Service Arrangements.doc Foth Infrastructure & Environment, LLC • 129 June 2009
4.9.5 Recycling Collection Fuel Use Recycling collection efforts essentially are duplicates of MSW collection efforts. In some instances as with automated single-stream recycling collection, the vehicles involved are used for both collections. If the collection vehicle is dedicated to recycling collections only, with the load weights involved with recycling being less than garbage, the necessary horse power and torque requirements can be less than MSW vehicles. Solid waste industry vehicles are all heavy duty in nature and their fuel consumptions are significant. Lowering the horse power and torque requirements of recycling collection vehicles 10-25% doesn’t necessarily lower fuel consumption by a linear amount. As discussed earlier, this report addresses the relational nature of fuel consumption. Therefore the assumption for fuel economies will be the same for recycling collection activities as was used for MSW services. As presented in the MSW collection portion of this section, the factors involved with distances between stops and the distances between households serviced will be presumed to be identical in that all communities require haulers to provide recycling services (except St. Paul who contracts with a single hauler for recycling collection). Although these services are provided, not every household will participate in every collection. This is also the case for the MSW collection activities. Without having the ability to determine setout rates for either service, the assumptions will be that every household sets out materials at every opportunity. Eagan In order to demonstrate the relationship of fuel consumption for the recycling collection services, the system in Eagan is displayed in two different ways. The current system has differing levels of collection frequencies not all of which were fully determined by the data collection process. The two tables for the city of Eagan display the data as though the entire city is collected on an every other week basis. Doing so tends to minimize the projected fuel use (i.e., provide a sort of “best case” for the existing system fuel use). Table 4-19 models the existing Eagan recycling collection system based on all households collected every other week with a 15 second loading time per stop. The fuel consumption factor for this analysis shows that 216% more fuel is projected to be used in the existing system than in a projected organized system with every other week collection and 15 seconds loading time. The difference is solely attributable to the market share percentages of the existing system versus a 100% market share for an organized system with the same collection parameters.

130 •Foth Infrastructure & Environment, LLC R - Analysis of Waste Collection Service Arrangements.doc June 2009
Table 4-19 Eagan Fuel Use for Recycling Based on Every Other Week Collection – 15 Second Stop
Market share
HH serviced
Distance per HH
total route (feet)
Distance per HH service
by hauler (feet)
Fuel cons per serviced
stop (ounces)
Fuel cons per
week (ounces)
Fuel cons per
week (gallons)
Fuel cons per
year (gallons)
Fuel cons per HH per
year (gallons)
Consumption factor relative to organized
fuel cons Hauler A 18.4% 3,182 118 641 6.24 19,859 155.2 4,034 1.27 Hauler B,C,D,E,F 19.1% 3,304 118 618 6.16 20,350 159.0 4,134 1.25 Hauler G 62.5% 10,810 118 189 3.26 35,241 275.3 7,158 0.66 Total 100% 17,296 75,450 589.4 15,326 0.89 2.16 Organized 100% 17,296 118 118 2.01 34,765 271.6 7,062 0.41 1.00
Table 4-20 Eagan Fuel Use for Recycling Based on Every Other Week Collection – 30 Second Stop
Market share
HH serviced
Distance per HH
total route (feet)
Distance per HH service
by hauler (feet)
Fuel cons per serviced
stop (ounces)
Fuel cons per
week (ounces)
Fuel cons per
week (gallons)
Fuel cons per
year (gallons)
Fuel cons per HH per
year (gallons)
Consumption factor relative to organized
fuel cons Hauler A 18.40% 3,182 118 641 6.77 21,545 168.3 4,376 1.38 Hauler B,C,D,E,F 19.10% 3,304 118 618 6.69 22,101 172.1 4,489 1.36 Hauler G 62.50% 10,810 118 189 3.79 40,970 320.7 8,322 0.77 Total 17,296 84,616 661.1 17,188 0.99 2.42 Organized1 100% 17,296 118 118 2.01 34,765 271.6 7,062 0.41 1.00
1 This organized system is based on automated every other week at 15 seconds per stop.
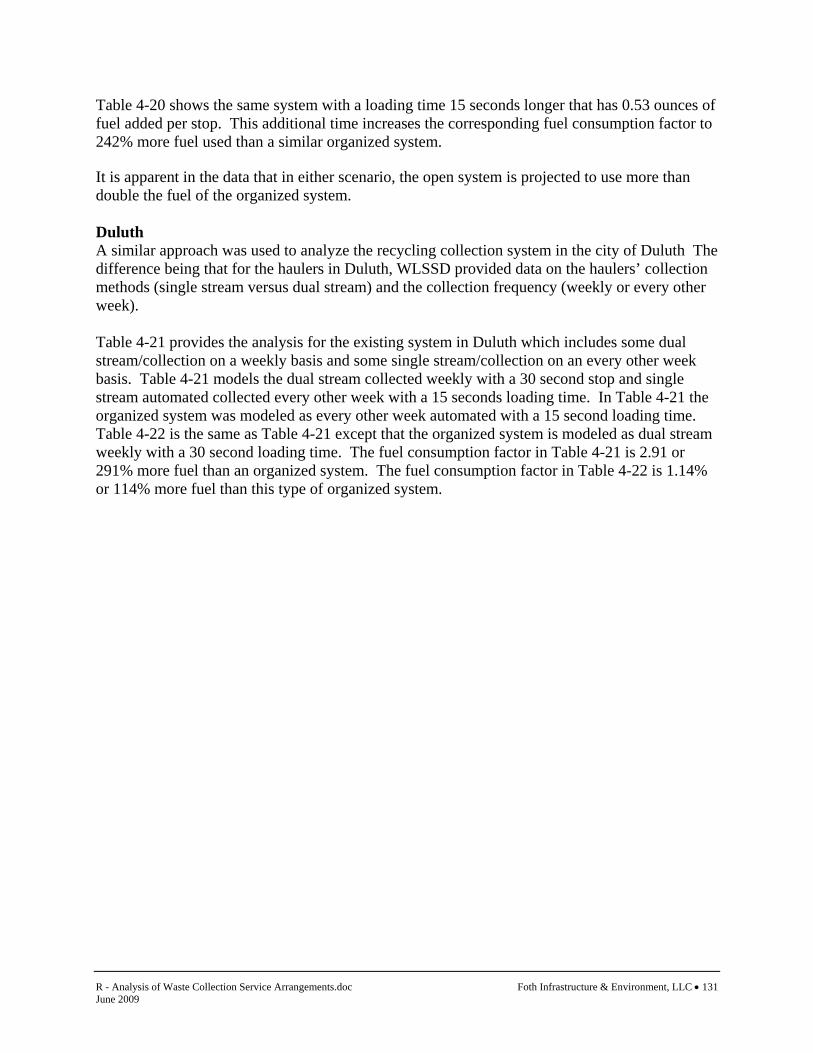
R - Analysis of Waste Collection Service Arrangements.doc Foth Infrastructure & Environment, LLC • 131 June 2009
Table 4-20 shows the same system with a loading time 15 seconds longer that has 0.53 ounces of fuel added per stop. This additional time increases the corresponding fuel consumption factor to 242% more fuel used than a similar organized system. It is apparent in the data that in either scenario, the open system is projected to use more than double the fuel of the organized system. Duluth A similar approach was used to analyze the recycling collection system in the city of Duluth The difference being that for the haulers in Duluth, WLSSD provided data on the haulers’ collection methods (single stream versus dual stream) and the collection frequency (weekly or every other week). Table 4-21 provides the analysis for the existing system in Duluth which includes some dual stream/collection on a weekly basis and some single stream/collection on an every other week basis. Table 4-21 models the dual stream collected weekly with a 30 second stop and single stream automated collected every other week with a 15 seconds loading time. In Table 4-21 the organized system was modeled as every other week automated with a 15 second loading time. Table 4-22 is the same as Table 4-21 except that the organized system is modeled as dual stream weekly with a 30 second loading time. The fuel consumption factor in Table 4-21 is 2.91 or 291% more fuel than an organized system. The fuel consumption factor in Table 4-22 is 1.14% or 114% more fuel than this type of organized system.

132 •Foth Infrastructure & Environment, LLC R - Analysis of Waste Collection Service Arrangements.doc June 2009
Table 4-21 Duluth Fuel Use for Recycling Based on Understanding of Existing Systems
Market share
HH serviced
Distance per HH
total route (feet)
Distance per HH
service by hauler (feet)
Fuel cons per
serviced stop
(ounces)
Fuel cons per
week (ounces)
Fuel cons per week (gallons)
Fuel cons per year (gallons)
Fuel cons per HH per year (gallons)
Consumption factor relative to organized
fuel cons Hauler A 1 34.6% 8,484 112 324 4.75 44,297 314.8 16,371 1.93 Hauler B 2 11.5% 2,813 112 976 9.05 25,459 198.9 5,171 1.84 Hauler C 2 48.0% 11,760 112 233 3.93 46,217 361.1 9,388 0.80 Others 1, 3 5.9% 1,448 112 1,895 17.07 24,722 193.1 10,043 6.93 Total 100.0% 24,505 136,695 1,067.9 27,766 1.13 2.91 Organized2 100% 24,505 112 112 1.9 46,560 363.7 9,457 0.39 1.00 1 Dual or multiple collected weekly at 30 seconds per stop 2 Single collected every other week at 15 seconds per stop 3 Others includes three additional haulers grouped together

R - Analysis of Waste Collection Service Arrangements.doc Foth Infrastructure & Environment, LLC • 133 June 2009
Table 4-22 Duluth Fuel Use for Recycling Based on Understanding of Existing System
Market share
HH serviced
Distance per HH
total route (feet)
Distance per HH
service by hauler (feet)
Fuel cons per
serviced stop
(ounces)
Fuel cons per
week (ounces)
Fuel cons per week (gallons)
Fuel cons per year (gallons)
Fuel cons per HH per year (gallons)
Consumption factor relative to organized
fuel cons Hauler A 1 34.6% 8,484 112 324 4.75 40,297 314.8 8,185 0.96 Hauler B 2 11.5% 2,813 112 976 9.05 25,459 198.9 5,171 1.84 Hauler C 2 48.0% 11,760 112 233 3.93 46,217 361.1 9,388 0.80 Others 1, 3 5.9% 1,448 112 1716 17.07 24,722 193.1 5,022 3.47 Total 100% 24,505 136,695 1,067.9 27,766 1.13 1.14 Organized1 100% 24,505 112 112 2.43 59,547 465.2 24,191 0.99 1.00 1 Dual or multiple collected weekly at 30 seconds per stop 2 Single collected every other week at 15 seconds per stop 3 Others includes three additional haulers grouped together

134 •Foth Infrastructure & Environment, LLC R - Analysis of Waste Collection Service Arrangements.doc June 2009
Rochester Rochester’s recycling is collected every week. Most of the residents participate with a bin system. This dual sort system requires the hauler to manually load the materials on the truck. Approximately one-third of the residents are provided a cart for recycling and the materials are loaded the same as garbage with an ASL. Table 4-23 shows the fuel consumptions for the existing mix of automated and manual bin system with an assumption of 15 seconds of loading time for each approach. The fuel consumption factor is 2.50 or 250% more fuel than an organized system with the difference based solely on the differences in the percent market share of the open system versus the organized system.
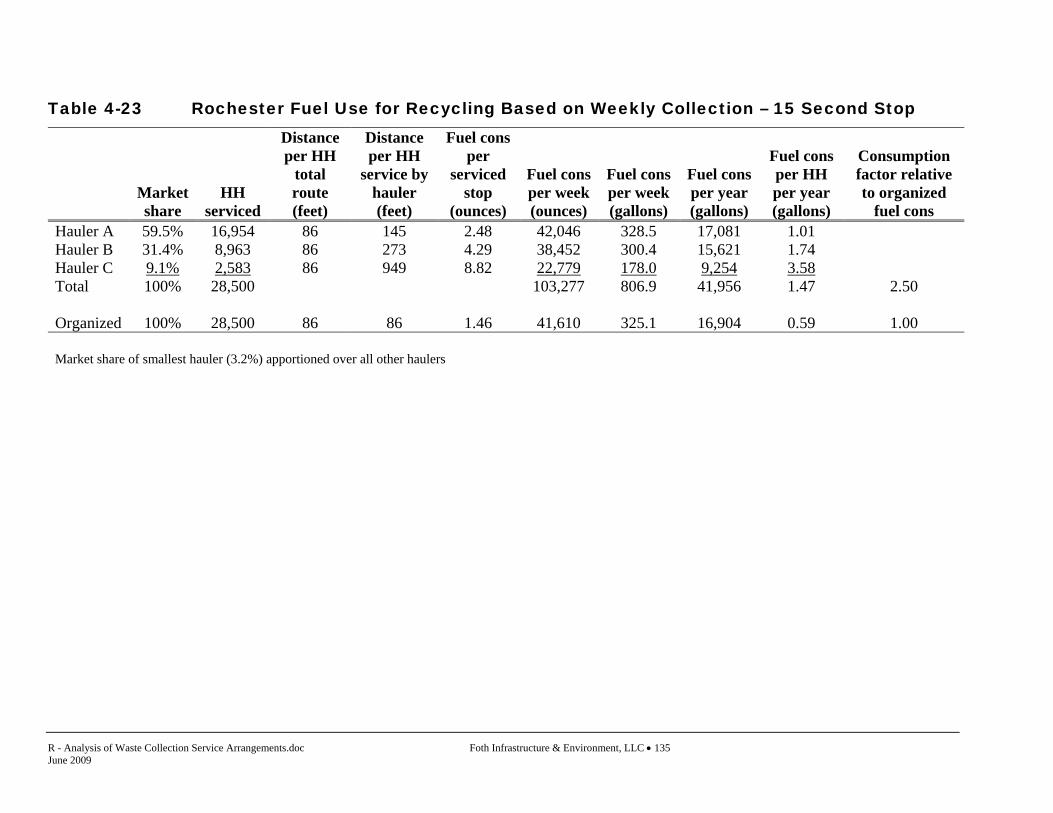
R - Analysis of Waste Collection Service Arrangements.doc Foth Infrastructure & Environment, LLC • 135 June 2009
Table 4-23 Rochester Fuel Use for Recycling Based on Weekly Collection – 15 Second Stop
Market share
HH serviced
Distance per HH
total route (feet)
Distance per HH
service by hauler (feet)
Fuel cons per
serviced stop
(ounces)
Fuel cons per week (ounces)
Fuel cons per week (gallons)
Fuel cons per year (gallons)
Fuel cons per HH per year (gallons)
Consumption factor relative to organized
fuel cons Hauler A 59.5% 16,954 86 145 2.48 42,046 328.5 17,081 1.01 Hauler B 31.4% 8,963 86 273 4.29 38,452 300.4 15,621 1.74 Hauler C 9.1% 2,583 86 949 8.82 22,779 178.0 9,254 3.58 Total 100% 28,500 103,277 806.9 41,956 1.47 2.50 Organized 100% 28,500 86 86 1.46 41,610 325.1 16,904 0.59 1.00 Market share of smallest hauler (3.2%) apportioned over all other haulers

136 •Foth Infrastructure & Environment, LLC R - Analysis of Waste Collection Service Arrangements.doc June 2009
Table 4-24 Rochester Fuel Use for Recycling Based on Every Week Collection – 15 Second Stop
Automated and 30 for Bins
Market share
HH serviced
Distance per HH
total route (feet)
Distance per HH
service by hauler (feet)
Fuel cons per
serviced stop
(ounces)
Fuel cons per week (ounces)
Fuel cons per week (gallons)
Fuel cons per year (gallons)
Fuel cons per HH per year (gallons)
Consumption factor relative to organized
fuel cons Hauler A 1 59.5% 16,954 86 145 3.01 51,032 398.7 20,732 1.22 Hauler B 2 31.4% 8,963 86 273 4.29 38,452 300.4 15,621 1.74 Hauler C1 9.1% 2,583 86 949 9.35 24,148 188.7 9,810 3.80 Total 100% 28,500 113,632 887.7 46,163 1.62 2.75 Organized 100% 28,500 86 86 1.46 41,610 325.1 16,904 0.59 1.00 Organized 3 100% 28,500 86 86 1.46 41,610 325.1 8,452 0.30 0.50 1 Bin service calculated at 30 seconds loading time per stop 2 Automated service at 15 seconds per stop 3 Organized every other week collection model

R - Analysis of Waste Collection Service Arrangements.doc Foth Infrastructure & Environment, LLC • 137 June 2009
Table 4-24 shows the same system with a loading time 15 seconds longer for the bin approach with its associated 0.53 ounces of fuel added per stop for those household receiving two or more sort services. Using these assumptions the corresponding consumption factor is 2.75 or 275% more fuel. Also displayed on Table 4-24 is the comparative fuel use for an organized system that provides every other week collections. This system reduces the annual consumption by 50%. Woodbury The current recycling collection system in Woodbury has differing levels of collection frequencies and methods, depending on the hauler. Table 4-25 below models the existing hauler frequency of weekly and every other week with a loading time of 15 seconds. The fuel consumption factor of the existing system is projected to be 3.00 versus the organized approach based upon comparison to an organized weekly system with a 15 second loading time. Table 4-25 also shows an organized system with 30 seconds average loading time. The fuel consumption per household for the 30 second stop is projected to be 1.06 gallons per household per year versus 0.85 for a system with an average 15 second stop time.

138 •Foth Infrastructure & Environment, LLC R - Analysis of Waste Collection Service Arrangements.doc June 2009
Table 4-25 Woodbury Fuel Use for Recycling Based on 15 Second Stops
Market share
HH serviced
Distance per HH
total route (feet)
Distance per HH service
by hauler (feet)
Fuel cons per serviced
stop (ounces)
Fuel cons per
week (ounces)
Fuel cons per
week (gallons)
Fuel cons per
year (gallons)
Fuel cons per HH per year (gallons)
Consumption factor relative to organized
fuel cons Hauler B & C 1 9.6% 1,892 123 1,277 11.68 22,099 172.6 8,978 4.75 Hauler F 1 12.2% 2,393 123 1,010 9.35 22,375 174.8 9,090 3.80 Hauler A 2 13.1% 2,579 123 937 8.71 22,463 175.5 4,563 1.77 Hauler G 2 15.5% 3,048 123 793 7.45 22,708 177.4 4,612 1.51 Hauler E 1 24.4% 4,786 123 505 5.82 27,855 217.6 11,316 2.36 Hauler D 3 25.2% 4,950 123 488 5.73 28,364 221.6 11,523 2.33 Total 100% 19,648 145,862 1,139.5 50,081 2.55 3.00 Organized 3 100% 19,648 123 123 2.09 41,064 320.8 16,682 0.85 1 Organized 4 100% 19,648 123 123 2.62 51,478 402.2 20,913 1.06 1 1 Two sort weekly collection 2 Every other week single stream automated 3 Single stream weekly automated collection 4 Organized with a 30 second loading time

R - Analysis of Waste Collection Service Arrangements.doc Foth Infrastructure & Environment, LLC • 139 June 2009
Table 4-26 for Woodbury changes the assumption to every other week collection for all haulers and changes the loading time by adding 15 seconds per stop to haulers using the dual stream collection system (single stream systems loading time remains at 15 seconds). Switching to every other week collection reduces fuel consumption. Adding to the loading time slightly increases fuel consumption. Applying these assumptions to the existing hauler system results in 1.56 gallons of fuel projected to be used per household. Table 4-26 provides a comparison to a recycling system collecting all households with a 15 second load time. The projected fuel consumption factor for the existing system compared to the organized with a 15 second load time is 3.71. It is apparent in the data that in either Woodbury scenario, open collections result in approximately 300% to 370% more fuel use during the on route collection process than the various projected approaches to organized systems.
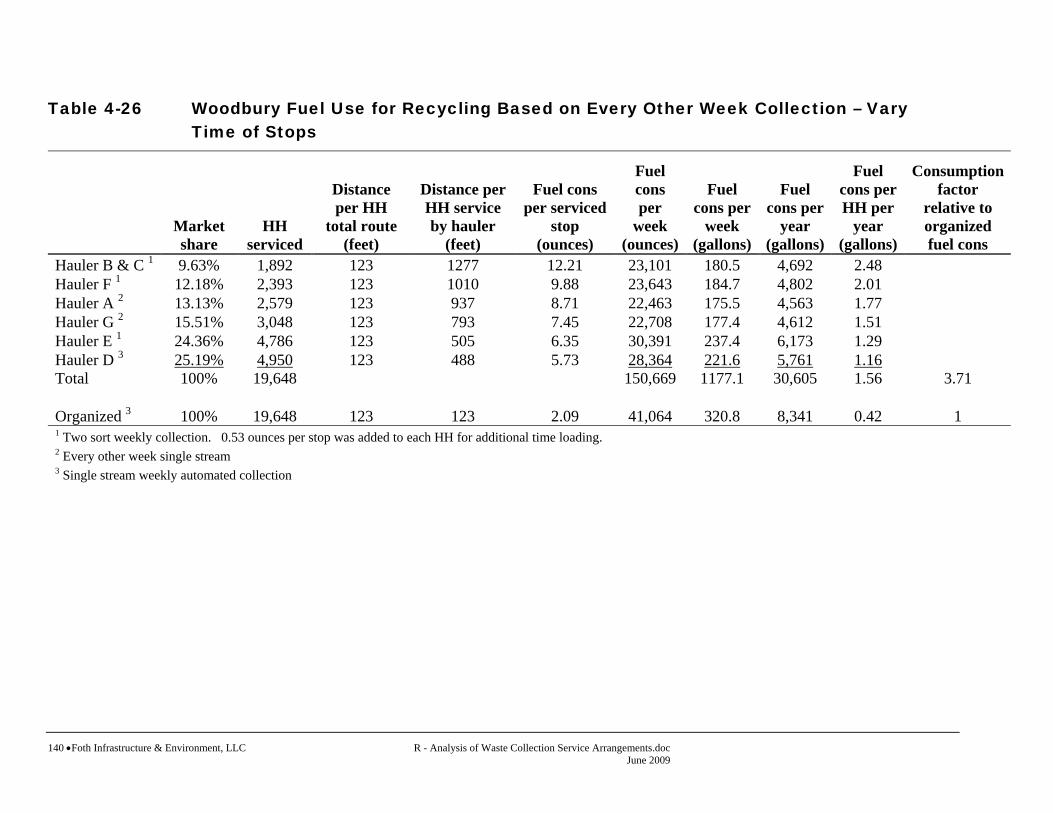
140 •Foth Infrastructure & Environment, LLC R - Analysis of Waste Collection Service Arrangements.doc June 2009
Table 4-26 Woodbury Fuel Use for Recycling Based on Every Other Week Collection – Vary Time of Stops
Market share
HH serviced
Distance per HH
total route (feet)
Distance per HH service by hauler
(feet)
Fuel cons per serviced
stop (ounces)
Fuel cons per
week (ounces)
Fuel cons per
week (gallons)
Fuel cons per
year (gallons)
Fuel cons per HH per
year (gallons)
Consumption factor
relative to organized fuel cons
Hauler B & C 1 9.63% 1,892 123 1277 12.21 23,101 180.5 4,692 2.48 Hauler F 1 12.18% 2,393 123 1010 9.88 23,643 184.7 4,802 2.01 Hauler A 2 13.13% 2,579 123 937 8.71 22,463 175.5 4,563 1.77 Hauler G 2 15.51% 3,048 123 793 7.45 22,708 177.4 4,612 1.51 Hauler E 1 24.36% 4,786 123 505 6.35 30,391 237.4 6,173 1.29 Hauler D 3 25.19% 4,950 123 488 5.73 28,364 221.6 5,761 1.16 Total 100% 19,648 150,669 1177.1 30,605 1.56 3.71 Organized 3 100% 19,648 123 123 2.09 41,064 320.8 8,341 0.42 1 1 Two sort weekly collection. 0.53 ounces per stop was added to each HH for additional time loading. 2 Every other week single stream 3 Single stream weekly automated collection

R - Analysis of Waste Collection Service Arrangements.doc Foth Infrastructure & Environment, LLC • 141 June 2009
St Paul The city of St Paul contracts with Eureka Recycling for recycling collection services. Eureka collects recyclables curbside from over 84,000 households. Collection occurs weekly using a dual stream approach. After contacting Eureka Recycling regarding the loading times for their services which range from 10 to 60 seconds per stop, it was decided to display the average as 30 seconds (slightly below the mid-point between the range of 10 to 60 seconds). Table 4-27 shows the fuel consumption for St. Paul’s recycling collection system. The projected fuel consumed per household is 0.77 gallons. The St. Paul recycling collection system is already organized and therefore, there are no comparisons to be made.

142 •Foth Infrastructure & Environment, LLC R - Analysis of Waste Collection Service Arrangements.doc June 2009
Table 4-27 St. Paul Fuel Use for Recycling Based on Weekly Collection – 30 Second Time of Stop
Market share
HH serviced
Distance per HH
total route (feet)
Distance per HH
service by hauler (feet)
Fuel cons per
serviced stop
(ounces)
Fuel cons per week (ounces)
Fuel cons per week (gallons)
Fuel cons per year (gallons)
Fuel cons per HH per year (gallons)
Consumption factor relative to organized
fuel cons Hauler A 100% 84,771 83.7 83.7 1.89 160,217 1,251.7 65,088 0.77 1.00 Organized 100% 84,771 83.7 83.7 1.89 160,217 1,251.7 65,088 0.77 1.00

R - Analysis of Waste Collection Service Arrangements.doc Foth Infrastructure & Environment, LLC • 143 June 2009
4.9.6 Total Greenhouse Gas Emission for Five Open Cities
With diesel fuel consumption and mileage estimates derived for each hauler in each city, GHG emissions can be estimated. To estimate GHG emissions, the EPA guidance was used (Climate Leaders Greenhouse Gas Inventory Protocol Care Module Guidance, Direct Emissions from Mobile Sources, EPA 430-K-08-004, May 2008). To calculate CO2 emissions, an emission factor of 10.15 kg CO2/gallon (22.37689 lbs. CO2/gallon) was used. The factor is for all on road diesel fuel use. Other GHGs emitted by the combustion of diesel fuel include methane (CH4) and nitrous oxide (N2O). The approach for estimating CH4 and N2O emissions varies from the estimation of CO2 emissions discussed above. Emissions of CH4 and N2O from mobile sources are dependent on the type of catalytic converter on the vehicle and the number of miles traveled. However, CH4 and N2O emissions are minor (2%) compared to CO2 missions for diesel fueled vehicles. To estimate the emissions of CH4 and N2O from the trucks used in the study, each vehicle was assumed to be a heavy duty vehicle. The emission factor for N2O is 0.0048 grams/mile (1.0582x10⁻⁵lbs/mile) and 0.0051 grams/mile (1.124x10⁻⁵lbs/mile) for CH4. The trucks were all assumed to use 100% diesel fuel with no blends or use of biodiesel, compressed natural gas or other alternative fuels. Use of alternative fuels would reduce the GHG emissions slightly (about 7% for biodiesel) but this was not considered in the analysis. To convert GHG to carbon dioxide equivalent (CO2e), global warming potential conversion factors from the Intergovernmental Panel on Climate Change (IPCC) Third Assessment Report (2001) were used for carbon dioxide (CO2), methane (CH4) and nitrous oxide (N20). The conversion factor for CO2 is 1; to CH4 is 23; and for N2O is 296. Total GHG estimated emissions for MSW collection systems are all presented in Table 4-28. GHG emissions for recycling systems are presented in Table 4-29. In both Tables 4-28 and 4-29 the first example on the text for each is compared to an organized system. The St. Paul recycling collection system is already organized so there is no difference there. Table 4-30 summarizes projected savings for these five open cities for just MSW and recyclables collection. The projected savings of CO2e is approximately 3,345 metric tons per year.
144 •Foth Infrastructure & Environment, LLC R - Analysis of Waste Collection Service Arrangements.doc June 2009
Table 4-28 Fuel Usage and Greenhouse Gas Projections for MSW in Five In-depth Open
Cities
Total Annual
Fuel Usage
(gallons)
Total Annual Mileage
Total Annual kg CO2e
Total Annual pounds CO2e
Total Annual kg Ce
Total Annual
Pounds Ce
Duluth First Example 55,532 108,119 563,818 1,243,005 153,769 339,001 Efficient system 18,915 27,030 192,027 423,346 52,371 115,458 Projected savings 36,617 81,089 371,791 819,658 101,398 223,543 Eagan First Example 30,651 60,300 311,202 686,082 84,873 187,113 Efficient system 14,123 20,100 143,382 316,103 39,104 86,210 Projected savings 16,528 40,200 167,820 369,979 45,769 100,903 Rochester First Example 41,956 72,416 425,969 939,099 116,173 256,118 Efficient system 16,904 24,139 171,613 378,342 46,804 103,184 Projected savings 25,052 48,277 254,355 560,757 69,370 152,934 St. Paul First Example 146,695 324,617 1,489,454 3,283,681 406,215 895,549 Efficient system 36,325 54,196 368,779 813,017 100,576 221,732 Projected savings 110,370 270,421 1,120,676 2,470,664 305,639 673,817 Woodbury First Example 59,256 142,805 601,672 1,326,458 164,092 361,761 Efficient system 16,682 23,801 169,363 373,381 46,190 101,831 Projected savings 42,574 119,004 432,309 953,077 117,902 259,930 TOTAL SAVINGS 231,142 558,992 2,346,951 5,174,135 640,078 1,411,128

R - Analysis of Waste Collection Service Arrangements.doc Foth Infrastructure & Environment, LLC • 145 June 2009
Table 4-29 Fuel Usage and Greenhouse Gas Projections for Recycling in Five In-depth Open Cities
Total Annual
Fuel Usage
(gallons)
Total Annual Mileage
Total Annual kg CO2e
Total Annual pounds
CO2e
Total Annual kg Ce
Total Annual pounds
Ce
Duluth First Example 40,973 108,119 416,043 917,216 113,466 250,150 Efficient system 9,457 27,030 96,034 211,719 26,191 57,742 Projected Savings 31,516 81,089 320,008 705,497 87,275 192,408 Eagan First Example 15,326 60,300 155,647 343,143 42,449 93,584 Efficient system 7,062 20,100 71,706 158,086 19,556 43,114 Projected Savings 8,264 40,200 83,941 185,058 22,893 50,470 Rochester First Example 41,956 72,416 425,969 939,099 116,173 256,118 Efficient system 16,904 24,139 171,613 378,342 46,804 103,184 Projected Savings 25,052 48,277 254,355 560,757 69,370 152,934 St. Paul First Example 50,481 54,196 512,461 1,129,783 139,762 308,123 Efficient system 50,481 54,196 512,461 1,129,783 139,762 308,123 Projected Savings 0 0 0 0 0 0 Woodbury First Example 50,081 142,805 508,542 1,121,143 138,693 305,766 Efficient system 16,682 23,801 169,363 373,381 46,190 101,831 Projected Savings 33,399 119,004 339,180 747,762 92,504 203,935 TOTAL SAVINGS 98,231 288,571 997,484 2,199,074 272,041 599,747

146 •Foth Infrastructure & Environment, LLC R - Analysis of Waste Collection Service Arrangements.doc June 2009
Table 4-30 Fuel Usage and Greenhouse Gas Projections for Both MSW and Recycling in Five In-depth Open Cities
Total Annual Fuel
Usage (gallons)
Total Annual Mileage
Total Annual kg CO2e
Total Annual Pounds
CO2e
Total Annual Metric Tons
CO2e
Total Annual kg Ce
Total Annual Pounds
Ce
Total Annual Metric Tons Ce
MSW Totals 231,142 558,992 2,346,951 5,174,135 2,347 640,078 1,411,128 640 Recycling Totals 98,231 288,571 997,484 2,199,074 998 272,041 599,747 272 Totals 329,373 847,563 3,344,435 7,373,209 3,345 912,119 2,010,875 912

R - Analysis of Waste Collection Service Arrangements.doc Foth Infrastructure & Environment, LLC • 147 June 2009
4.9.7 Tool for Estimating Potential GHG Savings Foth prepared an Excel spreadsheet that can be used by individual cities to determine an estimate of GHG savings for their city by changing from an open collection to an organized collection system. The electronic file was provided to the MPCA with the report. A hard copy of the tool is provided in Appendix H. The instructions to use the tool are provided within the spreadsheet. To complete the estimate, the following data is required:
♦ The number of single family households receiving curbside collection service. ♦ The number of households serviced by each hauler or some estimate of the each hauler’s
market share. This may be available from hauler reports provided to cities or counties. One way to develop an estimate if this information if it is not available is to follow haulers on their route and count the houses the hauler serves versus all the households passed (complete a sample for each hauling company). Another potential approach would be to drive a sample area and document carts for each hauler (drive a representative sample of multiple areas of the city).
♦ Calculate the distance per household on the route by dividing the total distance driven by
the total households counted in various sections of the city.
♦ Use the list of distances and fuel consumption rates in the spreadsheet tool to enter the corresponding fuel consumption for the corresponding distance between homes serviced by each hauler (the distance per household serviced by hauler automatically calculates based on the average distance between households and the hauler’s market share).
The spreadsheet will provide estimates of total annual fuel consumption and total annual CO2e and Ce.


X:\MS\IE\2008\08M081\10000 reports\Final Appendices\Appendix A1 - Municipal Survey Questions Final.doc 1
Study of Residential Waste & Recyclable Material Collection Efficiency,
Economic & Environmental Impacts Related to Municipal Collection
The Minnesota Pollution Control Agency (MPCA) is funding a study of residential waste and recyclable
material collection arrangements statewide. This study will look at waste collection services and
arrangements currently in place in the state’s municipalities and the dynamics of their implementation.
Information gained from this study will be used to determine the best methods for ensuring that local waste
and recyclable material collection systems are efficient, economic and environmentally sound.
We have selected an independent contractor, Foth, to collect information as it relates to current waste and
recyclable material collection practices and to gather pertinent data to achieve the study’s goals.
Completion of this work will occur before the end of FY09. The Contract Manager for this study is Jeff
Schneider from MPCA’s Prevention and Assistance Division.
This statewide effort will help to identify and quantify the environmental, economic, and public health
impacts and gauge public opinion related to the collection of residential waste and recyclable materials.
The goal of this study is to provide state and local units of government such as yours with a broad set of
facts to assist in evaluating residential waste and recyclable materials collection systems and programs.
The information that will be compiled will be available to provide information for future stakeholder
discussions.
The attached survey primarily contains Yes/No or fill in the blank questions to minimize your time
to complete it. Please complete and return the survey by October 17, 2008 to:
Jessie Graveen
Foth Infrastructure & Environment, LLC
8550 Hudson Boulevard North, Suite 105
Lake Elmo, MN 55042
Telephone: (651) 288-8586
Fax: (651) 288-8552
Thank you very much for your assistance.

X:\MS\IE\2008\08M081\10000 reports\Final Appendices\Appendix A1 - Municipal Survey Questions Final.doc 2
Review of Solid Waste and Recyclable Materials Collection Systems
(For Minnesota Cities with Population of 10,000 or More)
City Name: ____________________ Contact (person completing survey):__________________________
Telephone # __________________ Fax #_____________ Email address: __________________________
For each statement, place a check after the term that best describes your City’s solid waste and
recycling collection system. If you have any questions, please call Jessie @ (651) 288-8586
1. Which term best describes how solid waste collection is arranged in your City?
Open Collection_____ Municipal (City Crews)_____ City Contracted_____
2. Are all residents required by City ordinance to have solid waste collection services?
Yes_____ No_____
3. Total number of single-family households served in your City: _____________. What services
are provided? Circle all that apply.
a. Garbage collection
b. Recyclables collection
c. Bulky waste collection
d. Yard waste collection
e. Separate organics waste collection
f. Special services for city at no added cost (service city buildings, spring clean-up, other -
please describe _____________________________________________)
4. Total number of multi-family households served by residential routes in your City: ___________
What services are provided? Circle all that apply.
a. Garbage collection
b. Recyclables collection
c. Bulky waste collection
d. Yard waste collection
e. Separate organics waste collection
f. Other ___________________________________________________________
5. Does your City license solid waste haulers?
Yes_____ No_____
6. Does your City require licensed solid waste haulers to report waste disposal tonnages?
Yes_____ No_____
7. Does your City designate a specific facility for solid waste disposal?
Yes_____ No_____

X:\MS\IE\2008\08M081\10000 reports\Final Appendices\Appendix A1 - Municipal Survey Questions Final.doc 3
8. Which facilities currently receive residential solid waste from your City? (List all known)
_____________________ _____________________ _____________________
_____________________ _____________________ _____________________
9. Which term best describes how curbside recycling collection is arranged in your City?
Open Collection_____ Municipal (City Crews)_____ City Contracted_____ County Contracted____
10. Are all residents required by City ordinance to recycle or have recycling services?
Yes_____ No_____
11. Does your City license residential recyclable material collectors?
Yes_____ No_____
12. Does your City require recycling collectors to report residential recycling tonnages?
Yes_____ No_____
13. Does your City designate recyclables to a specific recycling facility?
Yes_____ No______
14. Does your City receive a rebate or revenue sharing from the sale of residential recyclable
materials?
Yes _____ No______
15. Which term best describes the frequency of curbside recycling collection in your City?
Every Week _____ Every Other Week_____ Once Monthly______ Varies by Hauler _____
16. Which term best describes how recyclables must be placed at the curbside for collection?
Not Sorted/Single Sort _____ 2 Sort (containers & paper) ____ 3 or More Sorts ______
17. Does your City coordinate waste and or recycling activities with any other entity? (Joint
Contracts or Joint Powers Agreements, Service Agreements with County or Municipality)
Yes _____ No ______

X:\MS\IE\2008\08M081\10000 reports\Final Appendices\Appendix A1 - Municipal Survey Questions Final.doc 4
18. Does your City receive any direct subsidy to reduce the cost of residential waste or recyclable
material collection?
Yes _____ No ______
19. Does your County have a solid waste service fee in place? (Property tax or hauler collected)
Yes _____ No ______
20. What is the number of miles of residential streets in your City? ________.
21. Has your public works department expressed an opinion with respect to collection vehicle traffic
impacts (emissions, wear and tear on roads, public safety)?
Yes _____ No ______
22. Have your elected officials expressed any interest in the issue(s) of organized waste and
recyclable material collection?
Yes _____ No ______
23. We are also conducting a survey of waste billing statements to compare waste and recycling
services costs from City to City. Would you like to participate in this and see how your bills
compare? All individuals who participate will receive a copy of the billing survey.
Yes _____ No ______
24. Does your City have any experience with establishing an open or organized collection system?
Yes _____ No ______
25. Any additional comments?

X:\MS\IE\2008\08M081\10000 reports\Final Appendices\Appendix A1 - Municipal Survey Questions Final.doc 5
26. May we contact you to clarify any of your answers or to obtain copies of any specific
documents?
Yes _____ No ______
Return completed form via fax, email, or US mail to:
Jessie Graveen
Foth Infrastructure & Environment, LLC
8550 Hudson Boulevard North, Suite 105
Lake Elmo, MN 55042
Telephone: (651) 288-8586
Fax: (651) 288-8552
Thank you for your time and interest.

X:\MS\IE\2008\08M081\10000 reports\Final Appendices\Appendix A2 - In-depth Organized System Survey Questions Final.doc 1
Study of Residential Waste & Recyclable Material Collection Efficiency,
Economic & Environmental Impacts Related to Municipal Collection
The Minnesota Pollution Control Agency (MPCA) is funding a study of residential waste and recyclable
material collection arrangements statewide. This study will look at waste collection services and
arrangements currently in place in the state’s municipalities and the dynamics of their implementation.
Information gained from this study will be used to determine the best methods for ensuring that local waste
and recyclable material collection systems are efficient, economic and environmentally sound.
We have selected an independent contractor, Foth, to collect information as it relates to current waste and
recyclable material collection practices and to gather pertinent data to achieve the study’s goals.
Completion of this work will occur before the end of FY09. The Contract Manager for this study is Jeff
Schneider from MPCA’s Prevention and Assistance Division.
This statewide effort will help to identify and quantify the environmental, economic, and public health
impacts and gauge public opinion related to the collection of residential waste and recyclable materials.
The goal of this study is to provide state and local units of government such as yours with a broad set of
facts to assist in evaluating residential waste and recyclable materials collection systems and programs.
The information that will be compiled will be available to provide information for future stakeholder
discussions.
The attached survey primarily contains Yes/No or fill in the blank questions to minimize your time
to complete it. If you have documents such as contracts or tonnage reports that are readily
available, we would appreciate receiving a copy. I will contact you in a few days to help you work
through the survey. In the meantime, if you have any questions, please feel free to contact me
directly.
Jessie Graveen
Foth Infrastructure & Environment, LLC
8550 Hudson Boulevard North, Suite 105
Lake Elmo, MN 55042
Telephone: (651) 288-8586
Fax: (651) 288-8552
Thank you very much for your assistance.

X:\MS\IE\2008\08M081\10000 reports\Final Appendices\Appendix A2 - In-depth Organized System Survey Questions Final.doc 2
Review of Solid Waste and Recyclable Materials Collection Systems
(For use with the In-depth Analysis for Organized Systems)
City Name: ____________________ Contact (person completing survey):__________________________
Telephone # __________________ Fax #_____________ Email address: __________________________
Please complete an initial review of the following questions. We want to complete the survey in as
efficient manner as possible. We can call to discuss the entire list of questions or simply those that
need some clarification.
1. Which term best describes how solid waste collection is arranged in your City?
Open Collection_____ Municipal (City Crews)_____ City Contracted_____
2. Are all residents required to have solid waste collection services by City ordinance?
Yes_____ No_____
3. Total number of single-family households served in your City: _____________. What services
are provided (circle all that apply)?
a. Garbage collection
b. Recyclables collection
c. Bulky waste collection
d. Yard waste collection
e. Separate organics waste collection
f. Special services for city at no added cost (service city buildings, spring clean-up, other -
please describe _____________________________________________)
4. Total number of multi-family households served by residential routes in your City: ___________
What services are provided (circle all that apply)?
a. Garbage collection
b. Recyclables collection
c. Bulky waste collection
d. Yard waste collection
e. Organics waste collection
f. Other ___________________________________________________________
5. Please provide a breakdown of the cost per household for different levels of service on a separate
sheet of paper.
6. Does your City license residential solid waste haulers?
Yes_____ No_____
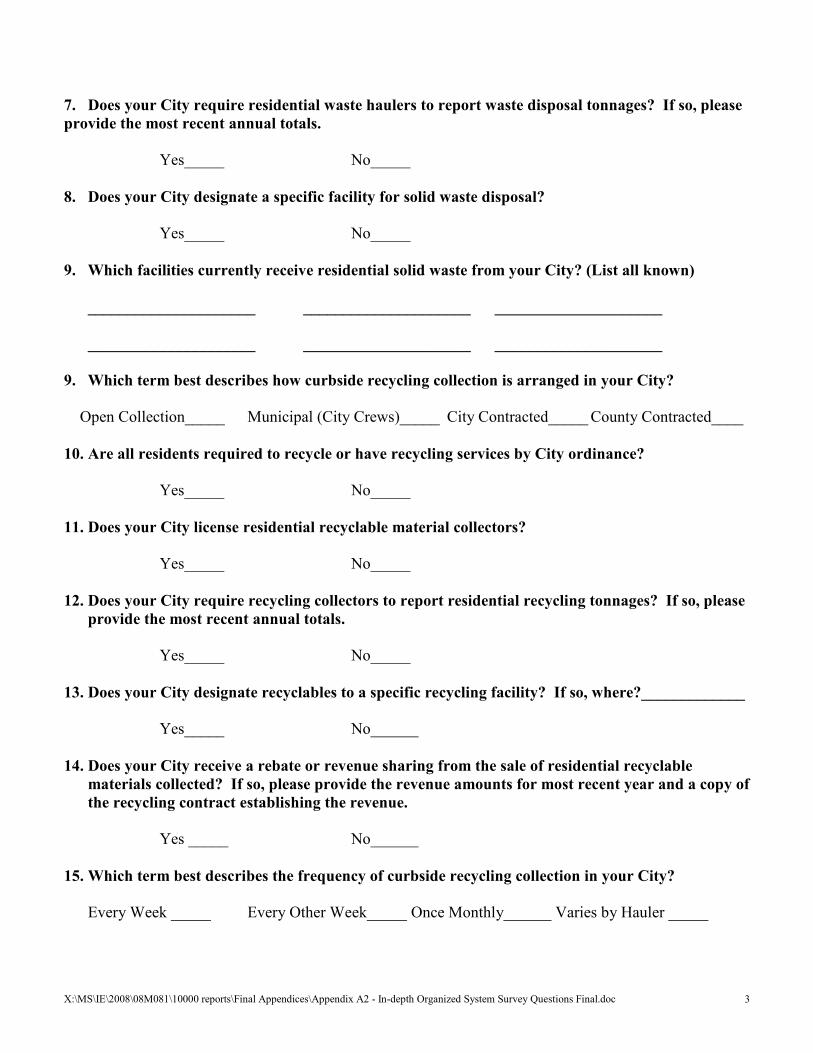
X:\MS\IE\2008\08M081\10000 reports\Final Appendices\Appendix A2 - In-depth Organized System Survey Questions Final.doc 3
7. Does your City require residential waste haulers to report waste disposal tonnages? If so, please
provide the most recent annual totals.
Yes_____ No_____
8. Does your City designate a specific facility for solid waste disposal?
Yes_____ No_____
9. Which facilities currently receive residential solid waste from your City? (List all known)
_____________________ _____________________ _____________________
_____________________ _____________________ _____________________
9. Which term best describes how curbside recycling collection is arranged in your City?
Open Collection_____ Municipal (City Crews)_____ City Contracted_____ County Contracted____
10. Are all residents required to recycle or have recycling services by City ordinance?
Yes_____ No_____
11. Does your City license residential recyclable material collectors?
Yes_____ No_____
12. Does your City require recycling collectors to report residential recycling tonnages? If so, please
provide the most recent annual totals.
Yes_____ No_____
13. Does your City designate recyclables to a specific recycling facility? If so, where?_____________
Yes_____ No______
14. Does your City receive a rebate or revenue sharing from the sale of residential recyclable
materials collected? If so, please provide the revenue amounts for most recent year and a copy of
the recycling contract establishing the revenue.
Yes _____ No______
15. Which term best describes the frequency of curbside recycling collection in your City?
Every Week _____ Every Other Week_____ Once Monthly______ Varies by Hauler _____

X:\MS\IE\2008\08M081\10000 reports\Final Appendices\Appendix A2 - In-depth Organized System Survey Questions Final.doc 4
16. Which term best describes how recyclables must be placed at the curbside for collection?
Not Sorted/Single Sort _____ 2 Sort (containers & paper) 3 or More ______
17. Does your City coordinate waste and or recycling activities with any other entity? (Joint
Contracts or Joint Powers Agreements, Service Agreements with County or Municipality etc)
Yes _____ No ______
18. Does your City receive any direct subsidy to reduce the cost of residential waste or recyclable
material collection? If so, please explain.
Yes _____ No ______
19. Does your County have a solid waste service fee in place? (Property tax or hauler collected). If
so, please provide the background explanation.
Yes _____ No ______
20. What is the number of miles of residential streets (or alleys if used for collection) in your City?
________.
21. Has your public works department expressed an opinion with respect to collection vehicle traffic
impacts (emissions, wear and tear on roads, public safety)? If so, what are the issues and do you
have specific cost information or data available?
Yes _____ No ______
22. Have your elected officials expressed any interest in the issue(s) of or surrounding organized
waste and recyclable material collection?
Yes _____ No ______
24. Describe your City’s past experiences with establishing an open or organized collection system,
describing difficulties or barriers with implementation.

X:\MS\IE\2008\08M081\10000 reports\Final Appendices\Appendix A2 - In-depth Organized System Survey Questions Final.doc 5
25. Any additional comments? What changes could be made to help meet your City’s goals with
respect to solid waste and recyclables collection?
Once again, we anticipate following up with you by phone to complete the survey. Thank you.
Jessie Graveen
Foth Infrastructure & Environment, LLC
8550 Hudson Boulevard North, Suite 105
Lake Elmo, MN 55042
Telephone: (651) 288-8586
Fax: (651) 288-8552

X:\MS\IE\2008\08M081\10000 reports\Final Appendices\Appendix A3 - In-depth Open System Survey Questions Final.doc 1
Study of Residential Waste & Recyclable Material Collection Efficiency,
Economic & Environmental Impacts Related to Municipal Collection
The Minnesota Pollution Control Agency (MPCA) is funding a study of residential waste and recyclable
material collection arrangements statewide. This study will look at waste collection services and
arrangements currently in place in the state’s municipalities and the dynamics of their implementation.
Information gained from this study will be used to determine the best methods for ensuring that local waste
and recyclable material collection systems are efficient, economic and environmentally sound.
We have selected an independent contractor, Foth, to collect information as it relates to current waste and
recyclable material collection practices and to gather pertinent data to achieve the study’s goals.
Completion of this work will occur before the end of FY09. The Contract Manager for this study is Jeff
Schneider from MPCA’s Prevention and Assistance Division.
This statewide effort will help to identify and quantify the environmental, economic, and public health
impacts and gauge public opinion related to the collection of residential waste and recyclable materials.
The goal of this study is to provide state and local units of government such as yours with a broad set of
facts to assist in evaluating residential waste and recyclable materials collection systems and programs.
The information that will be compiled will be available to provide information for future stakeholder
discussions.
The attached survey primarily contains Yes/No or fill in the blank questions to minimize your time
to complete it. If you have documents such as contracts or tonnage reports that are readily
available, we would appreciate receiving a copy. I will contact you in a few days to help you work
through the survey. In the meantime, if you have any questions, please feel free to contact me
directly.
Jessie Graveen
Foth Infrastructure & Environment, LLC
8550 Hudson Boulevard North, Suite 105
Lake Elmo, MN 55042
Telephone: (651) 288-8586
Fax: (651) 288-8552
Thank you very much for your assistance.

X:\MS\IE\2008\08M081\10000 reports\Final Appendices\Appendix A3 - In-depth Open System Survey Questions Final.doc 2
Review of Solid Waste and Recyclable Materials Collection Systems (For use with the In-depth Analysis for Open Systems)
City Name: ____________________ Contact (person completing survey):__________________________
Telephone # __________________ Fax #_____________ Email address: __________________________
Please complete an initial review of the following questions. We want to complete the survey in as
efficient manner as possible. We can call to discuss the entire list of questions or simply those that
need some clarification.
1. Which term best describes how solid waste collection is arranged in your City?
Open Collection_____ Municipal (City Crews)_____ City Contracted_____
2. Are all residents required to have solid waste collection services by City ordinance?
Yes_____ No_____
3. Total number of single-family households served in your City: _____________. What services
are provided (circle all that apply)?
a. Garbage collection
b. Recyclables collection
c. Bulky waste collection
d. Yard waste collection
e. Separate organics waste collection
f. Special services for city at no added cost (service city buildings, spring clean-up, other -
please describe _____________________________________________)
4. Total number of multi-family households served by residential routes in your City: ___________
What services are provided (circle all that apply)?
a. Garbage collection
b. Recyclables collection
c. Bulky waste collection
d. Yard waste collection
e. Organics waste collection
f. Other ___________________________________________________________
5. Does your City license residential solid waste haulers? If so, please fax or email a listing.
Yes_____ No_____
6. Does your City require licensed solid waste haulers to report waste disposal tonnages? If so,
please fax or email tonnage data to the contact below. (Do you have data that could provide
some indication of the percentage of the market each hauler has in your City?)
Yes_____ No_____

X:\MS\IE\2008\08M081\10000 reports\Final Appendices\Appendix A3 - In-depth Open System Survey Questions Final.doc 3
7. Which facilities currently receive residential solid waste from your City? (List all known)
_____________________ _____________________ _____________________
_____________________ _____________________ _____________________
8. Which term best describes how curbside recycling collection is arranged in your City?
Open Collection_____ Municipal (City Crews)_____ City Contracted_____ County Contracted____
9. Are all residents required to recycle or have recycling services by City ordinance?
Yes_____ No_____
10. Does your City license residential recyclable material collectors?
Yes_____ No_____
11. Does your City require recycling collectors to report residential recycling tonnages? If so, please
fax or email tonnage data for the most recent year.
Yes_____ No_____
12. Does your City designate recyclables to a specific recycling facility? If so, where? _____________
Yes_____ No______
13. Does your City receive a rebate or revenue sharing from the sale of residential recyclable
materials collected? If so, please provide the revenue amounts for most recent year and a copy of
the recycling contract establishing the revenue.
Yes _____ No______
14. Which term best describes the frequency of curbside recycling collection in your City?
Every Week _____ Every Other Week_____ Once Monthly______ Varies by Hauler _____
15. Which term best describes how recyclables must be placed at the curbside for collection?
Not Sorted/Single Sort _____ 2 Sort (containers & paper) 3 or More ______
16. Does your City coordinate waste and or recycling activities with any other entity? (Joint
Contracts or Joint Powers Agreements, Service Agreements with County or Municipality etc)
Yes _____ No ______

X:\MS\IE\2008\08M081\10000 reports\Final Appendices\Appendix A3 - In-depth Open System Survey Questions Final.doc 4
17. Does your City receive any direct subsidy to reduce the cost of residential waste or recyclable
material collection? If so, please explain.
Yes _____ No ______
18. Does your County have a solid waste service fee in place? (Property tax or hauler collected). If
so, please provide the background explanation.
Yes _____ No ______
19. What is the number of miles of residential streets (or alleys if used for collection) in your City?
________.
20. Has your public works department expressed an opinion with respect to collection vehicle traffic
impacts (emissions, wear and tear on roads, public safety)? If so, what are the issues and do you
have specific cost information or data available?
Yes _____ No ______
21. Have your elected officials expressed any interest in the issue(s) of organized waste and
recyclable material collection?
Yes _____ No ______
22. We are collecting household cost information. Do you have access to current cost per household
information charge by haulers? Could a survey of City employees living in your City be completed
(perhaps including gathering sample waste hauler bills)?
Yes _____ No ______
23. Describe your City’s past experiences with establishing an open or organized collection system,
describing difficulties or barriers with implementation.
X:\MS\IE\2008\08M081\10000 reports\Final Appendices\Appendix A3 - In-depth Open System Survey Questions Final.doc 5
24. Any additional comments? What changes could be made to help meet your City’s goals with
respect to solid waste and recyclables collection?
Once again, we anticipate following up with you by phone to complete the survey. Thank you.
Jessie Graveen
Foth Infrastructure & Environment, LLC
8550 Hudson Boulevard North, Suite 105
Lake Elmo, MN 55042
Telephone: (651) 288-8586
Fax: (651) 288-8552
X:\MS\IE\2008\08M081\10000 reports\Final Appendices\Appendix A4- City Staff Residental Billing Survey Final.doc
Study of Residential Waste & Recyclable Material Collection Efficiency,
Economic & Environmental Impacts Related to Municipal Collection
The Minnesota Pollution Control Agency (MPCA) is funding a study of residential waste and
recyclable material collection arrangements statewide. This study will look at waste collection
services and arrangements currently in place in the state’s municipalities and the dynamics of
their implementation. Information gained from this study will be used to determine the best
methods for ensuring that local waste and recyclable material collection systems are efficient,
economic and environmentally sound.
MPCA has selected an independent contractor, Foth, to collect information as it relates to current
waste and recyclable material collection practices and to gather pertinent data to achieve the
study’s goals. Completion of this work will occur before the end of FY09.
This statewide effort will help to identify and quantify the environmental, economic, and public
health impacts and gauge public opinion related to the collection of residential waste and
recyclable materials. There is some information that is not readily publicly available such as the
levels of service and costs for residents. Therefore, we are asking staff of the City of
___________ to complete the attached survey as part of the City of ______________’s
participation. A summary of the data collected will be provided.
The attached survey contains some simple questions about the garbage service you receive.
Please complete and return the survey by October 31, 2008 to:
Jessie Graveen
Foth Infrastructure & Environment, LLC
8550 Hudson Boulevard North, Suite 105
Lake Elmo, MN 55042
Telephone: (651) 288-8586
Fax: (651) 288-8552
Thank you very much for your assistance.

X:\MS\IE\2008\08M081\10000 reports\Final Appendices\Appendix A4- City Staff Residental Billing Survey Final.doc
City Staff Survey
Comparison of Collection Systems
Residential Information
Contact Name (person completing survey): __________________________
Street Address: ________________________________________________
City: ________________________________________________
Telephone Number: _______________________
Email address: ___________________________
1. Company Name of waste hauler: ____________________________
2. Level of garbage service received (check one):
30 gallon ___ 60 gallon ___ 90 gallon ___ Other ___
3. Type of garbage collection (check one): Manual (garbage cans or bags)___ Automated
(wheeled cart) ___
4. Frequency of recycling collection (check one): Weekly ___ Every other week ___ Other
________
5. Type of recycling container (check one plus state size): Separate in bin ___ Cart with
wheels ___ (Container size ________)
6. Additional services available that you use (check all that apply):
Bulky waste ___ Yard Waste ___ Other ________________________________
7. Day of the week garbage and recyclables collected ________Are both same day _____
8. Billing frequency: Monthly ___ Every other month ___ Quarterly ___ Other: _________
9. Cost per bill for:
Garbage Service ______ Taxes _____ Surcharges _____ Recycling ___
Yard waste _____ Bulky waste ____ Other _____
(Please attach a copy of a recent bill to the survey or mail at later date)
10. What other waste haulers operate in your neighborhood (if known). _______________,
____________________, ___________________, _____________________________,
____________________, ___________________, _____________________________.
X:\MS\IE\2008\08M081\10000 reports\Final Appendices\Appendix A4- City Staff Residental Billing Survey Final.doc
11. Have you or any neighbors attempted to organize garbage collection on your street?
Yes/No. If so, describe.
______________________________________________________________________
______________________________________________________________________
______________________________________________________________________.
12. What changes could be made to help improve garbage and recyclables collection
(legislation, incentives, etc.)? ______________________________________________
______________________________________________________________________
______________________________________________________________________
______________________________________________________________________.
Thank you for your assistance.

City County Population1
# of SF
Households
Served
# of MF
Households
Served Disposal Facilities
Open Organized Open Organized Yes No Yes No Yes No Yes No Yes
Andover Anoka 30,207 X X X 9,991 300 X X X RRT-Elk River X
East Bethel Anoka 12,142 X X X 4,227 8 X X X Elk River Landfill, Lake Area Disposal, RRT - Elk River X
Apple Valley2
Dakota 48,832 X X X 14,780 3,575 X X X Burnsville Landfill, Pine Bend Landfill, RRT - Empire, RRT - Newport,
Burnsville Dakota 61,048 X X X 24,6225NR X 19,570
10X Burnsville Landfill, Pine Bend Landfill X
Inver Grove Heights Dakota 33,139 X X X 13,170 NR X X X Pine Bend Landfill, RRT - Empire, RRT - Newport
Lakeville Dakota 52,323 X X X 13,811 4,617 X 19,38510
X Burnsville Landfill, Freeway Transfer Station, Pine Bend Landfill, RRT - Empire2
X
Mendota Heights Dakota 11,566 X X X NR 1 X X X
Rosemount Dakota 20,207 X X X 5,119 2,312 X 8,04510
X Burnsville Landfill, Eureka Recycling Center, Pine Bend Landfill, RRT - Empire, SKB Environmental X
South St. Paul2
Dakota 20,024 X X X 6,069 2,094 X X X RRT - Empire, RRT - Newport, Pine Bend Landfill
West St. Paul2
Dakota 18,816 X X X 5,107 3,498 X X X Pine Bend Landfill, RRT - Empire, RRT - Newport
Alexandria Douglas 11,323 X X X 5,438 1,500 X X X Pope/Douglas Solid Waste Incinerator, Local Sanitary Landfill
Albert Lea Freeborn 18,184 X X X NR NR X X X Lake mills, IA
Bloomington Hennepin 85,832 X X X 13,000 0 X X13
X Unknown with the exception of Hennepin County. X
Chanhassen Hennepin/Carver 22,017 X X X 5,990 2,400 X X X Burnsville Landfill, Hennepin County Transfer Station, RRT X
Willmar Kandiyohi 18,948 X X X 5,173 389 X X X Kandiyohi County Sanitary Landfill
Mounds View Ramsey 12,680 X X X 3,569 5,267 X X X X
Faribault Rice 22,733 X X X 6,000 NR X X X X
Prior Lake Scott 21,542 X X X 4000+ 3,000 X X X X
Savage Scott 25,065 X X X 8,300 NR X X X Burnsville Landfill
Oakdale Washington 27,249 X X X 10,803 245 X X X RRT - Newport X
Otsego Wright 11,660 X X X NR NR X X X
SUBTOTAL 21 21 18 3 19 2 9 12 3 18 11
Anoka Anoka 18,076 X X X 4,650 2,550 X X X Ask County X
Ramsey Anoka 22,059 X X X 7,900 NR X X X RRT - Elk River
New Ulm Brown 13,610 X X X 5,500 400 X X X Brown County Landfill
Crystal Hennepin 22,306 X X X 7,7696
0 X X X Elk River Landfill, Hennepin County Transfer Station X
Edina Hennepin 46,896 X X X 14,000 850 X X X X
Maple Grove Hennepin 58,491 X X X 22,000 1,500 X X X
Minnetonka Hennepin 51,519 X X X 16,2757
7,000 X X X Hennepin County facilities and landfills
Plymouth Hennepin 70,676 X X X 19,774 2,855 X X X Brooklyn Park, Elk River, HERC Transfer Stations X
Fairmont Martin 10,720 X X X 4,100 NR X X X Truman Compost Facility
New Brighton Ramsey 22,325 X X X 6,124 0 X X X
Roseville Ramsey 33,969 X X X 9,400 5,600 X X X Burnsville Landfill, Pine Bend Landfill, RRT - Elk River, RRT - Newport, 7-Mile Creek Landfill X
SUBTOTAL 11 11 8 3 11 0 2 9 1 10 5
Columbia Heights Anoka 18,288 X X X 5,800 1,200 X X X X
Ham Lake Anoka 15,005 X X X 4,242 284 X 4,65812
X Elk River Landfill, RRT - Elk River X
Bemidji Beltrami 13,074 X X X 1,900 NR X X13
X Transfer Station
Farmington Dakota 17,495 X X X NR NR X X X Pine Bend Landfill, RRT - Empire, RRT - Newport
Hastings Dakota/Washington 22,001 X X X 6000+ NR X X X
Red Wing Goodhue 16,329 X X X 6,000 300 X 3,18911
X Red Wing WTE Facility X
Hopkins Hennepin 17,389 X X X 2,99019
0 X X X Hennepin County Transfer Station - Brooklyn Park X
Robbinsdale Hennepin 13,698 X X X 4,9007
NR X X X HERC X
St. Peter Nicollet 10,887 X X X 2,9008
0 X X X MN Waste Processing, Ponderosa Landfill X
Fergus Falls4
Otter Tail 13,949 X X X 4,464 1,116 X 8,43621
X Dakota Landfill, Otter Tail County Transfer Station X
Little Canada Ramsey 10,082 X X X 2,166 0 X 1,770 X RRT - Newport X
White Bear Township Ramsey 11,752 X X X 3,400 600 X X X RRT - Newport X
Elk River Sherburne 22,550 X X X 6,288 NR X X X Elk River Landfill, RRT - Elk River X
Hibbing St. Louis 16,283 X X X 7,000 NR X X X St. Louis County
White Bear Lake Washington/Ramsey 24,723 X X X 8,500 0 X X X RRT - Newport X
Buffalo Wright 13,776 X X X 4,653 0 X X X Elk River Landfill, Forest City Landfill X
St. Louis Park Hennepin 44,569 X X X 12,3007
0 X 8,67911
X HERC
SUBTOTAL 17 17 16 1 13 4 13 4 10 7 11
Grand TOTAL 32 17 21 28 42 7 43 6 24 25 14 35 27
Municipal Survey Summary Matrix
MSW Collection System
Recycling Collection
System
Recycling Collection Req'd
by Ordinance?
Req. Haulers to Report
Disposal Tonnages
Designate Facility for MSW
Disposal
Solid Waste Collection
Req'd. by Ordinance License Waste Haulers
X:\MS\IE\2008\08M081\10000 reports\Final Appendices\Appendix B - Municipal & In-depth Survey Matrix Summaries.xls 1 of 3

City
Andover
East Bethel
Apple Valley2
Burnsville
Inver Grove Heights
Lakeville
Mendota Heights
Rosemount
South St. Paul2
West St. Paul2
Alexandria
Albert Lea
Bloomington
Chanhassen
Willmar
Mounds View
Faribault
Prior Lake
Savage
Oakdale
Otsego
SUBTOTAL
Anoka
Ramsey
New Ulm
Crystal
Edina
Maple Grove
Minnetonka
Plymouth
Fairmont
New Brighton
Roseville
SUBTOTAL
Columbia Heights
Ham Lake
Bemidji
Farmington
Hastings
Red Wing
Hopkins
Robbinsdale
St. Peter
Fergus Falls4
Little Canada
White Bear Township
Elk River
Hibbing
White Bear Lake
Buffalo
St. Louis Park
SUBTOTAL
Grand TOTAL
Number of Miles of
Residential Streets
No Yes No Yes No Yes No Yes No Every Week
Every Other
Week Once Monthly
Varies By
Hauler Single Sort Dual Sort
3 or More
Sort
Varies By
Hauler Yes No Yes No Yes No
X 3,05611
X X X X X X X 182
X X X X X X X X X 140
X X X X X X X X X X NR
X X X X X X X X X2
X X X X X X X X X X 135
X 3,52810
X X X X X X X 255.17
X X X X X X X X X X2
50+
X 1,33010
X X X X X X X 102
X X X X X X X X X X NR
X X X X X X X X X X NR
X X X X X X X X X X 85
X X X X X X X X X X 112
X X X X X X X X X 345
X 3,13111
X X X X X X X 55
X X X X X X X X X X 121.8
X X X X X X X X X 42.2
NR NR X X X X X X X X 120
X X X X X X X X X 100+
X X X X X X X X X NR NR 125
X X X X X X X X X 92
X X X X X X X X X X NR
10 11 9 12 9 2 19 0 21 5 10 0 6 9 6 1 5 8 13 5 16 9 12
X 1,28311
X X X X X X X 7 sq.
X X X X X X X X X X 150
X X X X X X X X25
X X NR
X 1,849 X X X X X X X 100
X X X X X X X X X 230
X X 6,01011
X X16
X17
X X X X 250
X X X X X X X X26
X X 25329
X X X X X X X X X 285
X X X X X X X X X X 65
X X 1,67411
X X X X X X X 85.4
X 3,09311
X X X X X X X 99
6 8 3 9 2 1 10 4 7 6 6 0 0 4 7 0 0 4 5 6 5 9 2
X 1,29911
X X X X X X NR NR 61
X 72014
X X X X X X X 147
X X X X X NR NR NR NR NR NR NR NR X X X 80
X X NR NR X X X17
X18
X27
NR NR X 80+
X X X X X X X X X X NR
NR NR 2,14011
X X X X X X X 110
X 86211
X X X X X X X 55
X X X X X X X X X NR
X X X X X X X X X 5030
X 26220
X X X X X X X 120
X 594 X X X X X X X 27
X X X X X X X X X 60
X 1,34111
X X X X X28
X X 146
X X X X X X X X X X 225
X X X X X X X X X 110
X X X X X X X X X 24
X X 3,81111
X X X X X X X NR
5 7 8 13 3 5 12 9 8 7 6 0 2 6 6 2 1 3 12 6 10 16 0
21 26 20 34 14 8 41 13 36 18 22 0 8 19 19 3 6 15 30 17 31 34 14
Municipal Survey Summary Matrix
Frequency of Curbside Recycling Collection How Recyclables Placed at Curbside for Collection
Recycling Collection Req'd
by Ordinance?
Coordinate Activities with
Other Entities
Receive Direct Subsidy to
Reduce Costs Solid Waste Service Fee
License Recycling
Collectors
Req. Collectors to Report
Recycling Tonnages
Designate Facility for
Recyclable Processing
Rebate or Revenue Sharing
from the Sale of Recyclable
Materials
X:\MS\IE\2008\08M081\10000 reports\Final Appendices\Appendix B - Municipal & In-depth Survey Matrix Summaries.xls 2 of 3

City
Andover
East Bethel
Apple Valley2
Burnsville
Inver Grove Heights
Lakeville
Mendota Heights
Rosemount
South St. Paul2
West St. Paul2
Alexandria
Albert Lea
Bloomington
Chanhassen
Willmar
Mounds View
Faribault
Prior Lake
Savage
Oakdale
Otsego
SUBTOTAL
Anoka
Ramsey
New Ulm
Crystal
Edina
Maple Grove
Minnetonka
Plymouth
Fairmont
New Brighton
Roseville
SUBTOTAL
Columbia Heights
Ham Lake
Bemidji
Farmington
Hastings
Red Wing
Hopkins
Robbinsdale
St. Peter
Fergus Falls4
Little Canada
White Bear Township
Elk River
Hibbing
White Bear Lake
Buffalo
St. Louis Park
SUBTOTAL
Grand TOTAL
Yes No Yes No Yes No Yes No
X X X X NA = Not applicable.
X X X X NR = No response.
X X X X1 Populations are from the League of Minnesota Cities.
X2
X X X2 Information provided by Dakota County.
X X X X4 Information provided by Otter Tail County.
X X X X5 Both multi and single family homes.
X X X X6 Includes single family households up to complexes with 8 units.
X X X X7 Includes single family homes up to a 4-plex. Also includes townhomes.
X X X X8 Includes up to a 5 plex.
X X X X9 Includes up to a duplex.
X X X X10
Data from Dakota County for 2005.
X X X X11
Data for 2007.
X X X X12
Data for 2007. Value based on 40.19 lbs per house hold per week. Served 4,458 households in 2007.
X X X X13
Data is reported to the County.
X X X X14
Data for 2006.
X X X X15
Data to date for 2008.
X X X X16
Will receive a rebate starting in January 2009.
X X X X17
Starting in January 2009 recycling will be collected every other week instead of every week.
X X X X18
Starting in January 2009 recycling will be single sort instead of dual sort.
X X X X19
Includes single family homes up to a triplex.
X X X X20
Data from October 2007 through September 2008.
8 14 7 14 7 14 4 1821
Data from Jan 1, 2008 through Oct 31, 2008.
X X X X25
Recycling with the County.
X X X X26
"Handshake" agreement with Plymouth and Golden Valley.
X X X X27
Not collection, just promotion, program education, etc.
X X X X28
Hauler agreement with Sherburne County to ensure processing at RDF facility.
X X X X29
Does not include county, state or federal roads
X X X X30
Without State/Hwy/County Roads.
X X X X
X X X X
X X X X
X X X X
X X X X
6 5 7 4 8 3 2 9
X X X X
X X X X
X X X X
X X X X
X X X X
X X X X
X X X X
X X X X
X X X X
NA X X NA
X X X X
X X X X
X X X X
X X X X
X X X X
X X X X
X X X X
9 7 14 3 15 2 11 5
23 26 28 21 30 19 17 32
Municipal Survey Summary Matrix
Experience Est.
Open/Organized System
Public Works Dept. Opinion
on Collection Vehicle Traffic
Elected Officials Interest in
Issue(s) of Organized
Collection
Interest in Participating in
Billing Survey
X:\MS\IE\2008\08M081\10000 reports\Final Appendices\Appendix B - Municipal & In-depth Survey Matrix Summaries.xls 3 of 3

City County Population1
# of SF
Household
s Served
# of MF
Household
s Served
Open Organized Open Organized Yes No Yes No Yes No
Duluth St. Louis 85,170 X X X 24,505 3,220 X X7
Eagan Dakota 66,508 X X X 17,296 NR X 22,7304
Rochester Olmsted 98,649 X X X 28,500 10,600 X X
Woodbury Washington 55,395 X X X 13,266 6,382 X X
St. Paul Ramsey 286,620 X X X 65,746 33,345 X X5
Blaine Anoka/Ramsey 54,927 X X X 16,143 0 X 16,9306
Mankato Blue Earth 35,493 X X X 8,3002
0 X 6,852
Minneapolis Hennepin 387,970 X X X 104,0003
NR X 105,7116
St. Cloud Stearns 64,711 X X X 17,335 597 X 8,1176,8
Stillwater Washington 17,929 X X X 5,471 195 X X
In-depth Survey Summary Matrix
MSW Collection System
Recycling Collection
System
Solid Waste Collection
Req'd. by Ordinance License Waste Haulers
Req. Haulers to Report
Disposal Tonnages
X:\MS\IE\2008\08M081\10000 reports\Final Appendices\Appendix B - Municipal & In-depth Survey Matrix Summaries.xls 1 of 4

City
Duluth
Eagan
Rochester
Woodbury
St. Paul
Blaine
Mankato
Minneapolis
St. Cloud
Stillwater
Disposal Facilities
Yes No Yes No Yes No Yes No Yes No
X WLSSD Solid Waste Transfer Station, Landfill - Superior Wisconsin X X X X
NA NA Burnsville Landfill, Pine Bend Landfill X X 5,6584
X
NA NA Olmsted County Landfill, Olmsted Waste to Energy Facility, Olmsted County Recycling Center Plus (self haulers) X X X X
NA NA Pine Bend Landfill, RRT - Newport, 7-Mile Creek Landfill X X 5,9486
X
NA NA X X 22,0496
X
X RRT - Elk River X X 4,9066
X
X MN Waste Processing X9
X 1,960 X
X Burnsville Landfill, HERC X X 21,5986
X
X X X 3,6926
X
X RRT - Newport X X 1,23110
In-depth Survey Summary Matrix
Designate Facility for MSW
Disposal
Recycling Collection Req'd
by Ordinance?
License Recycling
Collectors
Req. Collectors to Report
Recycling Tonnages
Designate Facility for
Recyclable Processing
X:\MS\IE\2008\08M081\10000 reports\Final Appendices\Appendix B - Municipal & In-depth Survey Matrix Summaries.xls 2 of 4

City
Duluth
Eagan
Rochester
Woodbury
St. Paul
Blaine
Mankato
Minneapolis
St. Cloud
Stillwater
Yes No Every Week
Every Other
Week
Once
Monthly
Varies By
Hauler Single Sort Dual Sort
3 or More
Sort
Varies By
Hauler Yes No Yes No
X X X X X
X X X X X
X X X X X
X X X X X
X X X X X
X X X X
X X X X X
X X X X X
X11
X X X X
X X X X X
In-depth Survey Summary Matrix
Rebate or Revenue Sharing
from the Sale of Recyclable
Materials Frequency of Curbside Recycling Collection How Recyclables Placed at Curbside for Collection
Coordinate Activities with
Other Entities
Receive Direct Subsidy to
Reduce Costs
X:\MS\IE\2008\08M081\10000 reports\Final Appendices\Appendix B - Municipal & In-depth Survey Matrix Summaries.xls 3 of 4

City
Duluth
Eagan
Rochester
Woodbury
St. Paul
Blaine
Mankato
Minneapolis
St. Cloud
Stillwater
Number of Miles of
Residential Streets
Yes No Yes No Yes No Yes No Yes No
X 580.5 X X X X NA = Not applicable. Question was not included in survey.
X NR X X X X12
NR = No response.
X 500 X X X X1 Populations are from the League of Minnesota Cities.
X 250 X X X X2 Includes up to a duplex.
X 1101 X X X X3 Both multi and single family homes.
NR X X NA NA X4 Data from Dakota County for 2005.
X 164 X X NA NA X5 But it is not enforced.
X NR X X NA NA X6 Data for 2007.
X 799 X X NA NA7 Reported to WLSSD
95 X X NA NA8 Reported to Tri-County Solid Waste
9 Residents pay for this service whether or not they use it.
10 Data to date for 2008.
11 Will receive a rebate starting in January 2009.
12 Information provided by Dakota County.
In-depth Survey Summary Matrix
Solid Waste Service Fee
Public Works Dept. Opinion
on Collection Vehicle
Traffic
Elected Officials Interest in
Issue(s) of Organized
Collection
Interest in Participating in
Billing Survey
Experience Est.
Open/Organized System
X:\MS\IE\2008\08M081\10000 reports\Final Appendices\Appendix B - Municipal & In-depth Survey Matrix Summaries.xls 4 of 4

X:\MS\IE\2008\08M081\10000 reports\Final Appendices\Appendix C - List of Haulers.doc
1
Open Solid Waste/Open Recyclable Materials Collection Systems
Licensed Residential Solid Waste Haulers and Recyclable Material Collectors
Below is a list of licensed residential solid waste haulers and recyclable material collectors for
cities that participated in the municipal survey. These cities have both an open solid waste and
recyclable material collection system. The licensed residential solid waste haulers are bulleted
below the city’s name. Following the solid waste hauler list there is a statement regarding the
city’s licensed residential recyclable material collectors. The majority of this information was
provided by the cities. Some of the information was provided by counties and some was
gathered from the cities’ websites.
Albert Lea ♦ Thompson Sanitation
♦ Waste Management
Albert Lea does not licensed recyclable material collectors.
Alexandria ♦ Alex Rubbish
♦ Corries Sanitation
♦ Waste Management
♦ West Central Sanitation
Licensed recyclable material collectors are the same as the licensed solid waste haulers for this
city.
Andover ♦ Ace Solid Waste
♦ Allied Waste Services
♦ Randy’s Sanitation
♦ Walter’s Recycling & Refuse
♦ Waste Management
Licensed recyclable material collectors are the same as the licensed solid waste haulers for this
city.
Apple Valley ♦ Allied Waste Services
♦ Buckingham Disposal
♦ Dick’s Sanitation
♦ Nitti Sanitation
♦ Waste Management
Apple Valley does not license recyclable material collectors.
Bloomington ♦ Allied Waste Services
♦ Burt’s Disposal
♦ Randy’s Sanitation
♦ Waste Management
Licensed recyclable material collectors are the same as the licensed solid waste haulers for this
city.
Burnsville ♦ Allied Waste Services
♦ Buckingham Disposal
♦ Lakeville Sanitation
♦ Randy’s Sanitation
♦ Waste Management
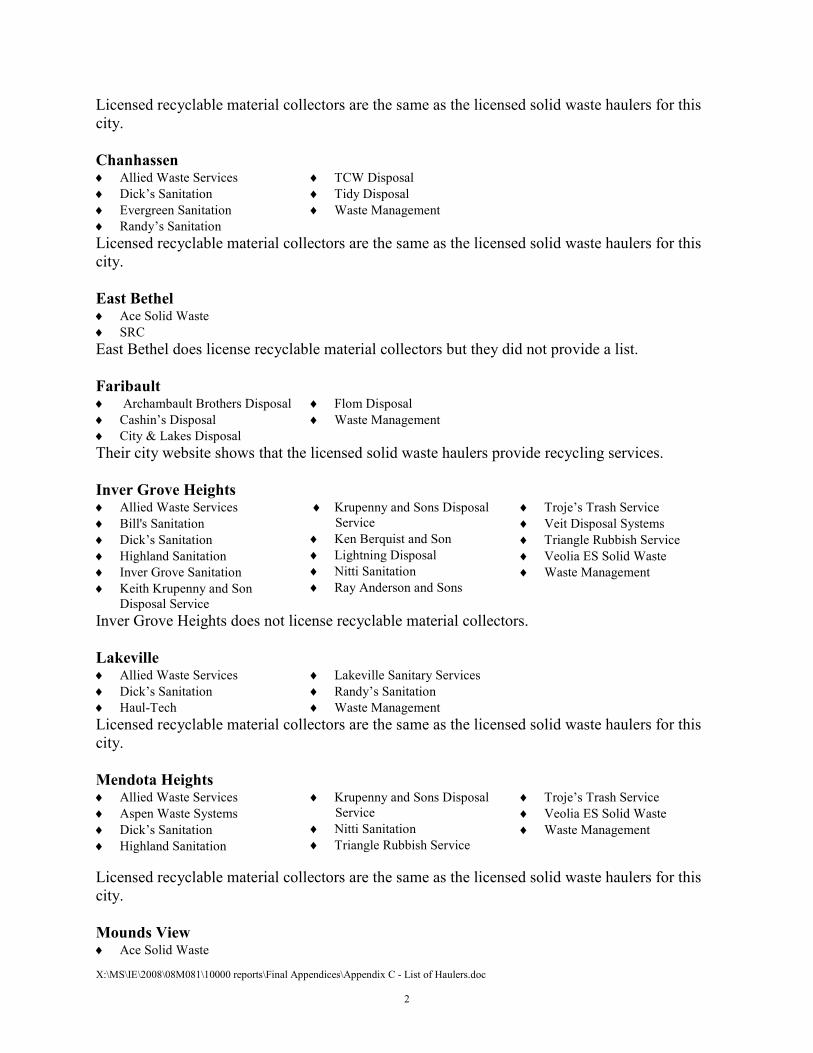
X:\MS\IE\2008\08M081\10000 reports\Final Appendices\Appendix C - List of Haulers.doc
2
Licensed recyclable material collectors are the same as the licensed solid waste haulers for this
city.
Chanhassen ♦ Allied Waste Services
♦ Dick’s Sanitation
♦ Evergreen Sanitation
♦ Randy’s Sanitation
♦ TCW Disposal
♦ Tidy Disposal
♦ Waste Management
Licensed recyclable material collectors are the same as the licensed solid waste haulers for this
city.
East Bethel ♦ Ace Solid Waste
♦ SRC
East Bethel does license recyclable material collectors but they did not provide a list.
Faribault ♦ Archambault Brothers Disposal
♦ Cashin’s Disposal
♦ City & Lakes Disposal
♦ Flom Disposal
♦ Waste Management
Their city website shows that the licensed solid waste haulers provide recycling services.
Inver Grove Heights ♦ Allied Waste Services
♦ Bill's Sanitation
♦ Dick’s Sanitation
♦ Highland Sanitation
♦ Inver Grove Sanitation
♦ Keith Krupenny and Son
Disposal Service
♦ Krupenny and Sons Disposal
Service
♦ Ken Berquist and Son
♦ Lightning Disposal
♦ Nitti Sanitation
♦ Ray Anderson and Sons
♦ Troje’s Trash Service
♦ Veit Disposal Systems
♦ Triangle Rubbish Service
♦ Veolia ES Solid Waste
♦ Waste Management
Inver Grove Heights does not license recyclable material collectors.
Lakeville ♦ Allied Waste Services
♦ Dick’s Sanitation
♦ Haul-Tech
♦ Lakeville Sanitary Services
♦ Randy’s Sanitation
♦ Waste Management
Licensed recyclable material collectors are the same as the licensed solid waste haulers for this
city.
Mendota Heights ♦ Allied Waste Services
♦ Aspen Waste Systems
♦ Dick’s Sanitation
♦ Highland Sanitation
♦ Krupenny and Sons Disposal
Service
♦ Nitti Sanitation
♦ Triangle Rubbish Service
♦ Troje’s Trash Service
♦ Veolia ES Solid Waste
♦ Waste Management
Licensed recyclable material collectors are the same as the licensed solid waste haulers for this
city.
Mounds View ♦ Ace Solid Waste

X:\MS\IE\2008\08M081\10000 reports\Final Appendices\Appendix C - List of Haulers.doc
3
♦ Allied Waste Systems
♦ Walter’s Recycling & Refuse
♦ Waste Management
There was no response from this city regarding their licensed recyclable material collectors.
Oakdale ♦ Allied Waste Services
♦ Maroney’s Sanitation
♦ Tennis
♦ Veolia ES Solid Waste
♦ Waste Management
Licensed recyclable material collectors are the same as the licensed solid waste haulers for this
city.
Otsego
Currently does not license either solid waste hauler or recyclable material collectors.
Prior Lake ♦ Buckingham Disposal
♦ Dick’s Sanitation
♦ Prior Lake Sanitation
♦ Waste Management
Prior Lake does not license recyclable material collectors.
Rosemount ♦ Allied Waste Services
♦ Aspen Waste Systems
♦ Dick’s Sanitation
♦ Highland Sanitation
♦ Inver Grove Sanitation
♦ Nitti Sanitation
♦ Randy’s Sanitation
♦ Ray Anderson & Sons
♦ Troje’s Trash Service
♦ Waste Management
Licensed recyclable material collectors are the same as the licensed solid waste haulers for this
city.
Savage ♦ Allied Waste Services
♦ Buckingham Disposal
♦ Dick’s Sanitation
♦ Evergreen Sanitation
♦ GEMM Minnesota
♦ Lloyd’s Construction Services
♦ Randy’s Sanitation
♦ Tidy Disposal
♦ Veolia ES Solid Waste
♦ Waste Management
Savage does not license recyclable material collectors.
South St. Paul – ♦ Allied Waste Services
♦ Aspen Waste Systems
♦ Bill's Sanitation
♦ Highland Sanitation
♦ Inver Grove Sanitation
♦ Keith Krupenny and Son
Disposal Service
♦ Lightning Disposal
♦ Nitti Sanitation
♦ Red Arrow Waste Disposal
♦ Schmidt Disposal
♦ Tennis
♦ Tony Mudek Sanitary Hauling
♦ Troje’s Trash Service
♦ Veolia ES Solid Waste
♦ Walter’s Recycling & Refuse
♦ Waste Management
South St. Paul does not license recyclable material collectors.
West St. Paul
Currently license solid waste haulers. No further information was provided or available via
website. West St. Paul does not license recyclable material collectors.

X:\MS\IE\2008\08M081\10000 reports\Final Appendices\Appendix C - List of Haulers.doc
4
Willmar
Currently does not license either solid waste hauler or recyclable material collectors.
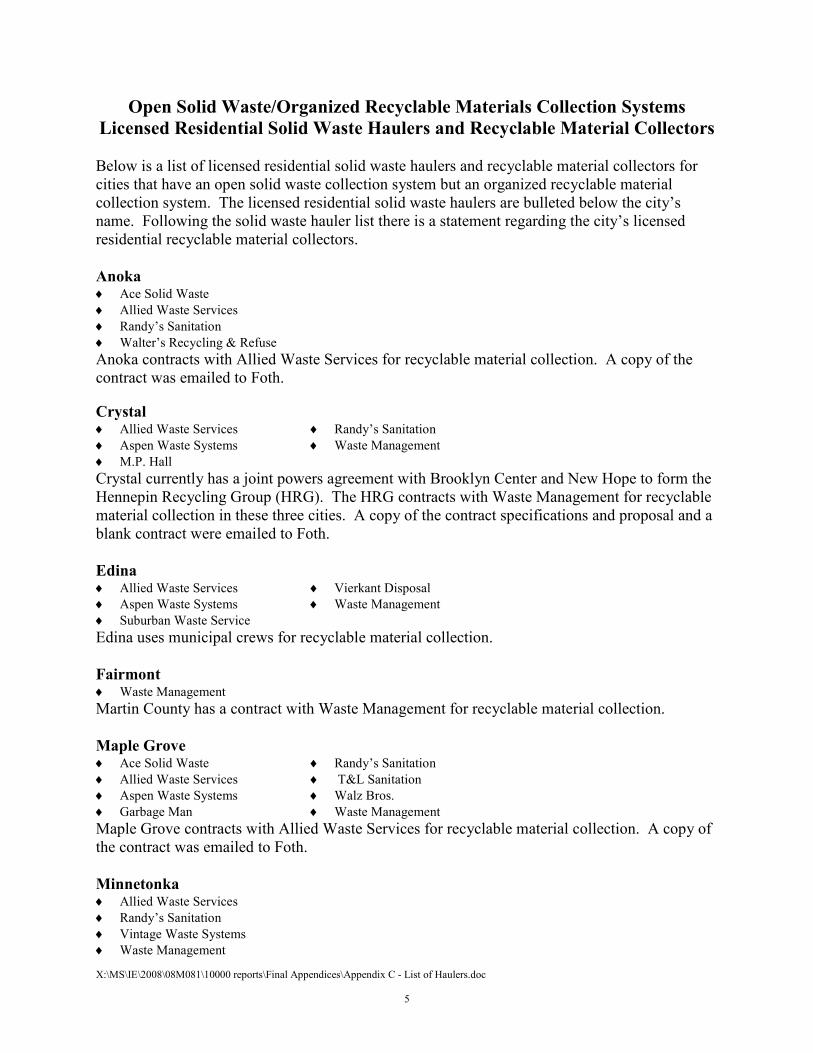
X:\MS\IE\2008\08M081\10000 reports\Final Appendices\Appendix C - List of Haulers.doc
5
Open Solid Waste/Organized Recyclable Materials Collection Systems
Licensed Residential Solid Waste Haulers and Recyclable Material Collectors
Below is a list of licensed residential solid waste haulers and recyclable material collectors for
cities that have an open solid waste collection system but an organized recyclable material
collection system. The licensed residential solid waste haulers are bulleted below the city’s
name. Following the solid waste hauler list there is a statement regarding the city’s licensed
residential recyclable material collectors.
Anoka ♦ Ace Solid Waste
♦ Allied Waste Services
♦ Randy’s Sanitation
♦ Walter’s Recycling & Refuse
Anoka contracts with Allied Waste Services for recyclable material collection. A copy of the
contract was emailed to Foth.
Crystal ♦ Allied Waste Services
♦ Aspen Waste Systems
♦ M.P. Hall
♦ Randy’s Sanitation
♦ Waste Management
Crystal currently has a joint powers agreement with Brooklyn Center and New Hope to form the
Hennepin Recycling Group (HRG). The HRG contracts with Waste Management for recyclable
material collection in these three cities. A copy of the contract specifications and proposal and a
blank contract were emailed to Foth.
Edina ♦ Allied Waste Services
♦ Aspen Waste Systems
♦ Suburban Waste Service
♦ Vierkant Disposal
♦ Waste Management
Edina uses municipal crews for recyclable material collection.
Fairmont ♦ Waste Management
Martin County has a contract with Waste Management for recyclable material collection.
Maple Grove ♦ Ace Solid Waste
♦ Allied Waste Services
♦ Aspen Waste Systems
♦ Garbage Man
♦ Randy’s Sanitation
♦ T&L Sanitation
♦ Walz Bros.
♦ Waste Management
Maple Grove contracts with Allied Waste Services for recyclable material collection. A copy of
the contract was emailed to Foth.
Minnetonka ♦ Allied Waste Services
♦ Randy’s Sanitation
♦ Vintage Waste Systems
♦ Waste Management

X:\MS\IE\2008\08M081\10000 reports\Final Appendices\Appendix C - List of Haulers.doc
6
Minnetonka contracts with Waste Management for recyclable material collection. A copy of the
contract was requested but not received.
New Brighton ♦ Ace Solid Waste
♦ Allied Waste Services
♦ Red Arrow Waste Disposal
♦ Veolia ES Solid Waste
♦ Walter’s Recycling & Refuse
♦ Waste Management
New Brighton contracts with Waste Management for recyclable material collection. A copy of
the contract was emailed to Foth.
New Ulm ♦ Renville Sibley Sanitation
♦ River View Sanitation
♦ Waste Management
New Ulm contracts with Waste Management for recyclable material collection.
Plymouth ♦ Allied Waste Services
♦ Aspen Waste Systems
♦ Dick’s Sanitation
♦ Garbage Man
♦ M. P. Hall
♦ Randy’s Sanitation
♦ Tidy Tim
♦ Waste Management
♦ Waste Technology
Plymouth contracts with Waste Management for recyclable material collection. A copy of the
contract was emailed to Foth.
Ramsey ♦ Ace Solid Waste
♦ Allied Waste Services
♦ Blaine Hauling
♦ Randy’s Sanitation
♦ Waste Management
Ramsey contracts with Ace Solid Waste for recyclable material collection. A copy of the
contract was emailed to Foth.
Roseville ♦ Allied Waste Services
♦ Gene’s Disposal Service
♦ Horrigan’s Hauling
♦ Veolia ES Solid Waste
♦ Walter’s Recycling & Refuse
♦ Waste Management
Roseville contracts with Eureka Recycling for recyclable material collection. A copy of the
contract was emailed to Foth.
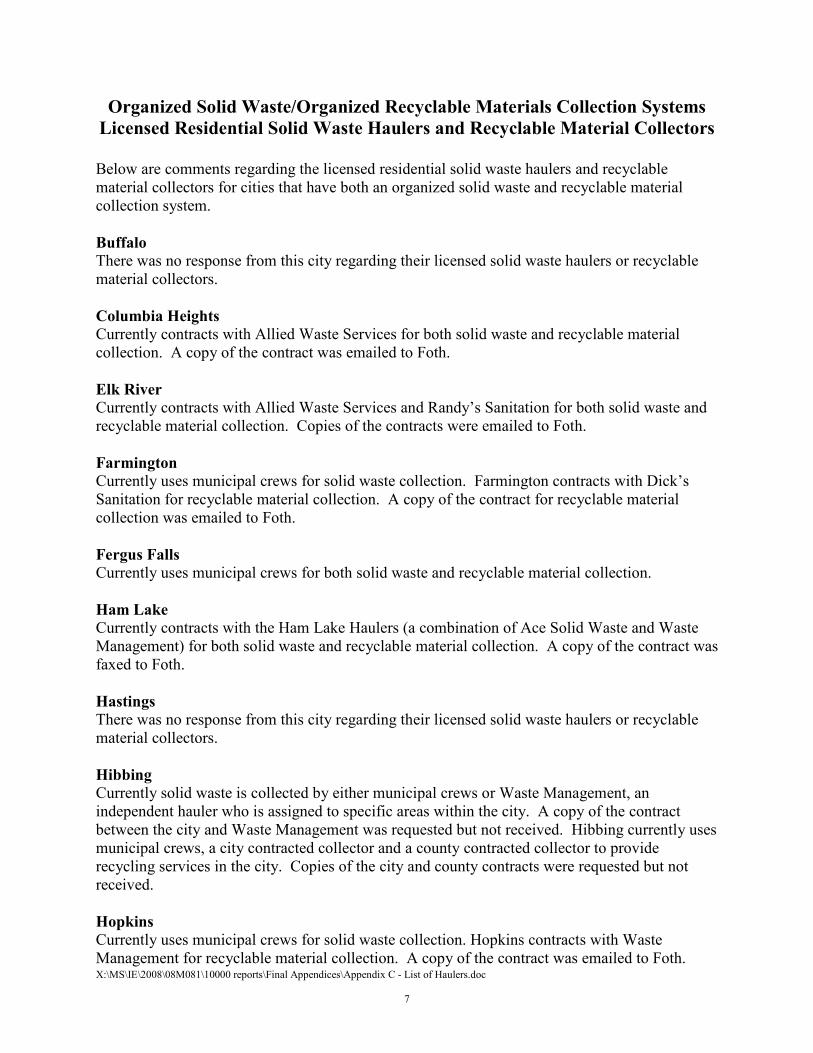
X:\MS\IE\2008\08M081\10000 reports\Final Appendices\Appendix C - List of Haulers.doc
7
Organized Solid Waste/Organized Recyclable Materials Collection Systems
Licensed Residential Solid Waste Haulers and Recyclable Material Collectors
Below are comments regarding the licensed residential solid waste haulers and recyclable
material collectors for cities that have both an organized solid waste and recyclable material
collection system.
Buffalo
There was no response from this city regarding their licensed solid waste haulers or recyclable
material collectors.
Columbia Heights
Currently contracts with Allied Waste Services for both solid waste and recyclable material
collection. A copy of the contract was emailed to Foth.
Elk River
Currently contracts with Allied Waste Services and Randy’s Sanitation for both solid waste and
recyclable material collection. Copies of the contracts were emailed to Foth.
Farmington
Currently uses municipal crews for solid waste collection. Farmington contracts with Dick’s
Sanitation for recyclable material collection. A copy of the contract for recyclable material
collection was emailed to Foth.
Fergus Falls
Currently uses municipal crews for both solid waste and recyclable material collection.
Ham Lake
Currently contracts with the Ham Lake Haulers (a combination of Ace Solid Waste and Waste
Management) for both solid waste and recyclable material collection. A copy of the contract was
faxed to Foth.
Hastings
There was no response from this city regarding their licensed solid waste haulers or recyclable
material collectors.
Hibbing
Currently solid waste is collected by either municipal crews or Waste Management, an
independent hauler who is assigned to specific areas within the city. A copy of the contract
between the city and Waste Management was requested but not received. Hibbing currently uses
municipal crews, a city contracted collector and a county contracted collector to provide
recycling services in the city. Copies of the city and county contracts were requested but not
received.
Hopkins
Currently uses municipal crews for solid waste collection. Hopkins contracts with Waste
Management for recyclable material collection. A copy of the contract was emailed to Foth.

X:\MS\IE\2008\08M081\10000 reports\Final Appendices\Appendix C - List of Haulers.doc
8
Little Canada
Currently contracts with Allied Waste Services, Gene's Disposal, Waste Management and
Horrigan’s Hauling for both solid waste and recyclable material collection. Copies of the
contracts were emailed to Foth.
Red Wing
Currently uses municipal crews for both solid waste and recyclable material collection.
Robbinsdale
Currently contracts with Waste Management for both solid waste and recyclable material
collection. A copy of the contract was emailed to Foth.
St. Louis Park
Currently contracts with Waste Management for solid waste collection. St. Louis Park contracts
with Eureka Recycling for recyclable material collection. Copies of the contracts were requested
but not received.
St. Peter
Currently contracts with Waste Management for both solid waste and recyclable material
collection. A copy of the contract was emailed to Foth.
White Bear Lake
Currently contracts with Veolia ES Solid Waste for both solid waste and recyclable material
collection. A copy of the contract was requested but not received.
White Bear Township
Currently contracts with Allied Waste Services for both solid waste and recyclable material
collection. A copy of the contract was emailed to Foth.

X:\MS\IE\2008\08M081\10000 reports\Final Appendices\Appendix C - List of Haulers.doc
9
Open Solid Waste/Open Recyclable Materials Collection Systems
Licensed Residential Solid Waste Haulers and Recyclable Material Collectors
Below is a list of licensed residential solid waste haulers and recyclable material collectors for
the in-depth cities that have both an open solid waste and recyclable material collection system.
The licensed residential solid waste haulers are bulleted below the city’s name. Following the
solid waste hauler list there is a statement regarding the city’s licensed residential recyclable
material collectors. The majority of this information was provided by the cities. Some of the
information was provided by counties and some was gathered from the cities’ websites.
Duluth ♦ A-1 Disposal
♦ A&B Garbage Service
♦ Hartel’s/DBJ Disposal
♦ Heikes Garbage
♦ Howard Waste Paper
♦ Nordic Waste
♦ North Shore Sanitary
♦ Paul’s Sanitary
♦ Waste Management
Licensed recyclable material collectors are the same as the licensed solid waste haulers for this
city.
Eagan ♦ Allied Waste Services
♦ Dick’s Sanitation
♦ Highland Sanitation
♦ Nitti Sanitation
♦ Triangle Rubbish Service
♦ Veolia ES Solid Waste
♦ Waste Management
Licensed recyclable material collectors are the same as the licensed solid waste haulers for this
city.
Rochester ♦ A to Z Sanitation
♦ Global Resolve
♦ Kellner Services
♦ Steve Lee
♦ Sunshine Sanitation
♦ Nitti Sanitation
♦ Veit Disposal
♦ Veolia ES Solid Waste
♦ Waste Management
♦ WM Hanson Waste Removal &
Recycling
Licensed recyclable material collectors are the same as the licensed solid waste haulers for this
city.
Woodbury ♦ Allied Waste Services
♦ Highland Sanitation
♦ Maroney’s Sanitation
♦ Tennis
♦ Troje’s Trash Service
♦ Veolia ES Solid Waste
♦ Waste Management
Licensed recyclable material collectors are the same as the licensed solid waste haulers for this
city.

X:\MS\IE\2008\08M081\10000 reports\Final Appendices\Appendix C - List of Haulers.doc
10
Open Solid Waste/Organized Recyclable Materials Collection Systems
Licensed Residential Solid Waste Haulers and Recyclable Material Collectors
Below is a list of licensed residential solid waste haulers and recyclable material collectors for
the only in-depth city that has an open solid waste collection system but an organized recyclable
material collection system, St. Paul. The licensed residential solid waste haulers are bulleted
below the city’s name. It should be noted that not all licensed haulers currently report having
residential customers in St. Paul. Following the solid waste hauler list there is a statement
regarding the city’s licensed residential recyclable material collectors.
St. Paul ♦ Allied Waste Services
♦ Aspen Waste Systems
♦ Carey Rubbish Service
♦ Eastside Garbage Company
♦ Gene’s Disposal Service
♦ Highland Sanitation
♦ Horrigan’s Hauling
♦ K. O. Sanitation and Recycling
♦ Krupenny and Sons Disposal
Service
♦ Ken Berquist and Son
♦ Maroney’s Sanitation
♦ Mickey’s City-wide Rubbish
Service
♦ Pete’s Rubbish Hauling
♦ Peterson-Waddle Trash
Removal
♦ R&M Sanitation
♦ Red Arrow Waste Disposal
♦ Robert Logan Hauling
♦ Onyx/Superior Services
♦ Tennis
♦ Tony Mudek Sanitary Hauling
♦ Triangle Rubbish Service
♦ Walter’s Recycling & Refuse
♦ Waste Management
St. Paul contracts with Eureka Recycling for recyclable material collection. A copy of the
contract was emailed to Foth.

X:\MS\IE\2008\08M081\10000 reports\Final Appendices\Appendix C - List of Haulers.doc
11
Organized Solid Waste/Organized Recyclable Materials Collection Systems
Licensed Residential Solid Waste Haulers and Recyclable Material Collectors
Below are comments regarding the licensed residential solid waste haulers and recyclable
material collectors for the in-depth cities that have both an organized solid waste and recyclable
material collection system.
Blaine
Currently contracts with Waste Management for both solid waste and recyclable material
collection. Starting in 2009, Blaine will be contracting with Veolia ES Solid Waste. A copy of
the contract was requested by not received.
Mankato
Currently contracts with Waste Management for both solid waste and recyclable material
collection. A copy of the contract was emailed to Foth.
Minneapolis
Currently uses municipal crews for half of the city and then contracts with Minneapolis Refuse,
Inc. (MRI) for the other half of the city for both solid waste and recyclables collection.
St. Cloud
Currently uses municipal crews for both solid waste and recyclable material collection.
Stillwater
Currently contracts with Waste Management for both solid waste and recyclable material
collection. A copy of the contract was emailed to Foth.

Monthly
Garbage
Service
Monthly
Taxes
Monthly
Surcharges
Monthly
Recycling
Service
Total Monthly
Amount Paid to
Haulers (less
taxes)
Total
Monthly
Charge to
Residents
Monthly
Garbage
Service
Monthly
Taxes
Monthly
Surcharges
Monthly
Recycling
Service
Total Monthly
Amount Paid to
Haulers (less
taxes)
Total
Monthly
Charge to
Residents
Monthly
Garbage
Service
Monthly
Taxes
Monthly
Surcharges
Monthly
Recycling
Service
Total Monthly
Amount Paid to
Haulers (less
taxes)
Total
Monthly
Charge to
Residents
Albert Lea Open Open Hauler 1 $13.42 $1.48 $1.72 $15.15 $16.62 $22.43 $2.47 $2.94 $25.37 $27.84
Alexandria Open Open Hauler 1 $18.66 incl. incl. incl. $18.66 $20.85 $20.85
Alexandria Open Open Hauler 2 $11.50 $1.22 $1.22 $5.00 $17.72 $18.94
Andover Open Open Hauler 1 $20.26 $2.34 $6.02 $7.50 $33.78 $36.12
Big Lake Open Organized Hauler 1 $6.67 $0.80 $3.22 $7.50 $17.39 $18.19
Brooklyn Center Open Organized Hauler 1 $19.05 $3.70 $0.68 $19.73 $23.43
Brooklyn Park Open Organized Hauler 1 $11.00 $2.53 $2.50 $13.50 $16.03
Chanhassen Open Open Hauler 1 $16.00 $1.50 $2.08 $18.08 $19.58
Chanhassen Open Open Hauler 2 $7.00 $0.83 $2.50 $5.00 $14.50 $15.33
Eagan Open Open Hauler 1 $11.00 $1.32 $2.64 $5.50 $19.14 $20.46
Eagan Open Open Hauler 2 $8.25 $0.97 $2.76 $5.00 $16.01 $16.98
Eagan Open Open Hauler 2 $17.02 $2.00 $6.04 $5.00 $28.06 $30.06
Edina Open Open Hauler 1 $10.95 $2.60 $2.86 $13.81 $16.40
Golden Valley Open Organized Hauler 1 $12.94 $2.53 $0.56 $2.67 $16.17 $18.70
Inver Grove heights Open Open Hauler 1
Lino Lakes Open Open Hauler 1 $12.91 $0.75 $2.63 $4.74 $20.28 $21.03
Lino Lakes Open Open Hauler 2 $14.46 $1.72 $3.18 $7.50 $25.14 $26.86
Maplewood Open Organized Hauler 1 $11.55 $4.81 $1.20 $2.12 $14.87 $19.68
New Brighton Open Organized Hauler 1 $15.50 $6.23 $1.01 $16.51 $22.74
New Ulm Open Organized Hauler 1 $13.23 $1.29 $13.23 $14.52 $16.96 $1.65 $16.96 $18.61 $20.88 $2.04 $22.92
New Ulm Open Organized Hauler 1 $10.32 $1.01 $10.32 $11.33
New Ulm Open Organized Hauler 2 $13.54 $1.32 +$ $14.86 $17.39 +$ +$ $17.39 $21.38 +$ +$ $21.38
New Ulm Open Organized Hauler 2 $10.58 $1.03 +$ $11.61
North Oaks Open Organized Hauler 1 $31.05 incl. incl. $31.05
Otsego Open Open Hauler 1 $40.00 $40.00
Plymouth Open Organized Hauler 1 $15.75 $3.64 $3.66 $1.50 $20.91 $24.54
Plymouth Open Organized Hauler 2 $10.95 $2.37 $1.71 $1.50 $14.16 $16.53
Ramsey Open Organized Hauler 1 $16.25 $1.58 $2.42 $2.95 $21.62 $23.20 $18.75 $2.13 $3.08 $2.95 $24.78 $26.91
Rochester Open Open Hauler 1 $17.59 $1.56 incl. incl. $17.59 $19.15 $19.56 $1.91 incl. incl. $19.56 $21.47 $22.51 $2.29 incl. incl. $22.51 $24.80
Rochester Open Open Hauler 2 $12.22 $2.46 $2.42 $7.73 $22.37 $24.82 $19.65 $3.82 $4.62 $7.29 $31.55 $35.37
Rochester Open Open Hauler 2 $11.25 $2.38 $3.19 $7.50 $21.94 $24.32
Rochester Open Open Hauler 3 $14.05 $3.14 $3.11 $7.00 $24.16 $27.31 $16.25 $3.52 $3.47 $7.00 $26.72 $30.25
Rochester Open Open Hauler 3 $14.05 $3.24 $3.77 $7.00 $24.82 $28.07
Rochester Open Open Hauler 3 $11.50 $2.71 $2.70 $7.00 $21.20 $23.90
Roseville Open Organized Hauler 1 $19.70 $8.04 $1.60 $21.30 $29.34
South St. Paul Open Open Hauler 1 $15.25 $1.49 $8.00 $23.25 $24.74
St. Paul Open Organized Hauler 1 $22.25 $2.25 $24.50 $13.47 $1.61 $7.68 $2.25 $23.40 $25.01
St. Paul Open Organized Hauler 2 $13.00 $1.67 $1.67 $2.25 $16.92 $18.59
St. Paul Open Organized Hauler 3 $12.95 $4.89 $2.25 $15.20 $20.09
St. Paul Open Organized Hauler 4 $16.33 $6.16 $2.25 $18.59 $24.75
St. Paul Open Organized Hauler 5 $15.75 $6.00 $2.25 $18.00 $24.00 $20.83 $2.25 $23.09
St. Paul Open Organized Hauler 5 $20.03 $7.56 $2.25 $22.29 $29.85
St. Paul Open Organized Hauler 6 $16.50 $5.88 $2.25 $18.75 $24.63 $25.00 $2.25 $27.25 $20.00 incl. incl. $2.25 $22.25
St. Paul Open Organized Hauler 6 $20.00 $7.55 $2.25 $22.25 $29.80 $12.05 $3.37 $2.25 $17.68
St. Paul Open Organized Hauler 6 $12.95 $5.65 $2.00 $2.25 $17.20 $22.85
St. Paul Open Organized Hauler 7 $16.50 $2.25 $18.75
St. Paul Open Organized Hauler 8 $15.00 $2.25 $17.25 $19.00 $7.40 $0.59 $2.25 $21.84 $29.24
St. Paul Open Organized Hauler 8 $19.00 $7.40 $0.59 $2.25 $21.84 $29.24
St. Paul Open Organized Hauler 8 $23.33 incl. $2.25 $25.59
St. Paul Open Organized Hauler 9 $16.00 $2.25 $18.25
St. Paul Open Organized Hauler 9 $11.62 $4.38 $2.25 $13.87 $18.25
St. Paul Open Organized Hauler 10 $19.40 $7.32 $0.00 $2.25 $21.65 $28.98 $25.34 $9.57 $0.00 $2.25 $27.59 $37.16
St. Paul Open Organized Hauler 10 $33.67 incl. incl. $2.25 $35.92
St. Paul Open Organized Hauler 11 $15.15 incl. incl. $2.25 $17.40
St. Paul Open Organized Hauler 12 $11.69 $5.28 $2.28 $2.25 $16.23 $21.50 $48.00 $2.25 $50.25 $25.65 incl. incl. $2.25 $27.90
St. Paul Open Organized Hauler 12 $12.93 $5.65 $2.03 $2.25 $17.22 $22.87 $28.38 $12.47 $4.66 $2.25 $35.29 $47.76 $15.95 $11.55 incl. $2.25 $18.20 $29.75
St. Paul Open Organized Hauler 12 $15.30 incl. incl. $2.25 $17.55 $18.33 incl. incl. $2.25 $20.59 $22.99 $10.09 $3.74 $2.25 $28.99 $39.08
St. Paul Open Organized Hauler 12 $24.67 $3.00 $13.33 $2.25 $40.25 $43.25 $28.14 $12.62 $5.30 $2.25 $35.69 $48.32
St. Paul Open Organized Hauler 12 $36.99 $2.25 $39.24 $49.96 $2.25 $52.22
St. Paul Open Organized Hauler 12 $9.95 $4.40 $1.69 $2.25 $13.89 $18.29
St. Paul Open Organized Hauler 13 $24.00 $2.25 $26.25 $5.33 $0.52 $1.49 $2.25 $9.08 $9.60 $19.00 $1.86 $5.32 $2.25 $26.57 $28.43
St. Paul Open Organized Hauler 13 $22.83 incl. incl. $2.25 $25.08 $22.73 $2.25 $24.98
St. Paul Open Organized Hauler 13 $18.10 $2.17 $10.45 $2.25 $30.80 $32.97
Woodbury Open Open Hauler 1 $11.72 $7.09 $4.37 $7.50 $23.59 $30.68
Woodbury Open Open Hauler 2 $13.75 $6.77 +$ incl. $13.75 $20.52
Woodbury Open Open Hauler 3 $8.45 $4.17 $0.00 $5.50 $13.95 $18.12 $11.96 $6.26 $1.50 $5.50 $18.96 $25.22
Woodbury Open Open Hauler 3 $6.03 $4.22 $3.67 $13.92 $10.50 $5.18 $5.50 $16.00 $21.18
1 Specific Company names are not provided in the report. Companies are simply listed by number for each city. Haulers with multiple listings in a city have the same numbers.
Level of Garbage Service Level of Garbage Service
90 Gallons60 Gallons
Rate Data from City Staff Billing Survey, Contracts and City Websites
City Name of Hauling Company1MSW Collection
Systems
Recycling
Collection
Systems
Level of Garbage Service
30 Gallons
X:\MS\IE\2008\08M081\10000 reports\Final Appendices\Appendix D - Billing Survey Matrix Summary.xls 1 of 2

Monthly
Garbage
Service
Monthly
Taxes
Monthly
Surcharges
Monthly
Recycling
Service
Total Monthly
Amount Paid to
Haulers (less
taxes)
Total
Monthly
Charge to
Residents
Monthly
Garbage
Service
Monthly
Taxes
Monthly
Surcharges
Monthly
Recycling
Service
Total Monthly
Amount Paid to
Haulers (less
taxes)
Total
Monthly
Charge to
Residents
Monthly
Garbage
Service
Monthly
Taxes
Monthly
Surcharges
Monthly
Recycling
Service
Total Monthly
Amount Paid to
Haulers (less
taxes)
Total
Monthly
Charge to
Residents
Level of Garbage Service Level of Garbage Service
90 Gallons60 Gallons
Rate Data from City Staff Billing Survey, Contracts and City Websites
City Name of Hauling Company1MSW Collection
Systems
Recycling
Collection
Systems
Level of Garbage Service
30 Gallons
Blaine Organized Organized Waste Management $8.15 $0.79 incl. $10.56 $8.94 $11.65 $1.14 incl. $11.40 $12.79 $13.65 $1.33 incl. $12.75 $14.98
Buffalo Organized Organized Waste Management $6.49 incl. $2.25 $8.89 $8.74 $12.49 $2.25 $9.04 $14.74 $20.49 $2.25 $9.18 $22.74
Columbia Heights Organized Organized Allied Waste Services $9.81 incl. $3.44 $13.25 $10.28 $3.44 $13.72 $12.82 $3.44 $16.26
Elk River Organized Organized Allied Waste Services $13.01 inlc. incl. $9.46 $13.01 $14.54 inlc. incl. $9.57 $14.54 $16.83 inlc. incl. $10.80 $16.83
Elk River Organized Organized Randy's Sanitation $13.01 inlc. incl. $9.46 $13.01 $14.54 inlc. incl. $9.57 $14.54 $16.83 inlc. incl. $10.80 $16.83
Farmington Organized Organized City of Farmington/Dick's Sanitation $14.67 $1.43 incl. $14.67 $16.10 $17.67 $1.72 incl. $17.67 $19.39 $20.67 $2.02 incl. $20.67 $22.68
Fergus Falls Organized Organized City of Fergus Falls NA NA NA NA NA NA $13.22 $1.29 $5.40 $18.62 $19.91 $15.20 $1.48 $5.40 $20.60 $22.08
Ham Lake Organized Organized Ham Lake Haulers (Ace Solid Waste & WM) $10.85 $1.06 $0.00 $11.49 $11.91 $13.65 $1.33 $0.00 $14.00 $14.98 $15.34 $1.50 $0.00 $15.98 $16.84
Hopkins Organized Organized City of Hopkins/Waste Management $13.20 $2.48 $3.25 $16.05 $18.93 $15.90 $2.98 $3.25 $19.15 $22.13 $17.25 $3.23 $3.25 $20.50 $23.73
Little Canada Organized Organized Allied/WM/Horrigan's/Gene's $9.00 $3.21 $4.10 $12.60 $16.31 $10.81 $3.89 $4.10 $14.41 $18.80 $13.22 $4.80 $4.10 $16.82 $22.12
Mankato Organized Organized Waste Management $11.30 incl. incl. $5.56 $11.30 $12.65 incl. incl. $5.56 $12.65 NA NA NA NA NA NA
Minneapolis Organized Organized City of Minneapolis $25.00 $3.38 ($7.00) $10.49 $21.38 NA NA NA NA NA NA $27.00 $3.75 ($7.00) $10.49 $23.75
Red Wing Organized Organized City of Red Wing $9.90 $6.74 $1.00 $4.00 $14.90 $21.64 $3.27 $1.00 $4.00 $5.00 $8.27 $19.80 $10.20 $1.00 $4.00 $24.80 $35.00
Robbinsdale Organized Organized Waste Management $19.19 incl. incl. $9.66 $19.19 $21.81 incl. incl. $11.09 $21.81 $24.61 incl. incl. $12.51 $24.61
St. Cloud Organized Organized $8.00 $0.78 $6.45 $14.45 $15.23 $16.00 $1.56 $6.45 $22.45 $24.01 $24.60 $2.40 $6.45 $31.05 $33.45
St. Louis Park Organized Organized Waste Management $14.10 incl. incl. $14.10 $17.63 incl. incl. $17.63 $21.15 incl. incl. $21.15
St. Peter Organized Organized Waste Management $17.28 incl. incl. $17.28 $12.43 $1.21 $8.00 $21.64 $24.60 incl. incl. $24.60
Stillwater Organized Organized Waste Management $8.32 $4.10 $4.55 $12.87 $16.97 $10.31 $5.03 $4.55 $15.07 $19.89 $12.50 $6.09 $4.55 $17.49 $23.14
White Bear Lake Organized Organized Veolia ES Solid Waste $8.85 $0.86 incl. $11.22 $9.71 $13.00 $1.27 incl. $12.76 $14.27 $17.70 $1.73 incl. $14.45 $19.43
White Bear Township Organized Organized Allied Waste Services $15.16 $16.20 $18.29
X:\MS\IE\2008\08M081\10000 reports\Final Appendices\Appendix D - Billing Survey Matrix Summary.xls 2 of 2
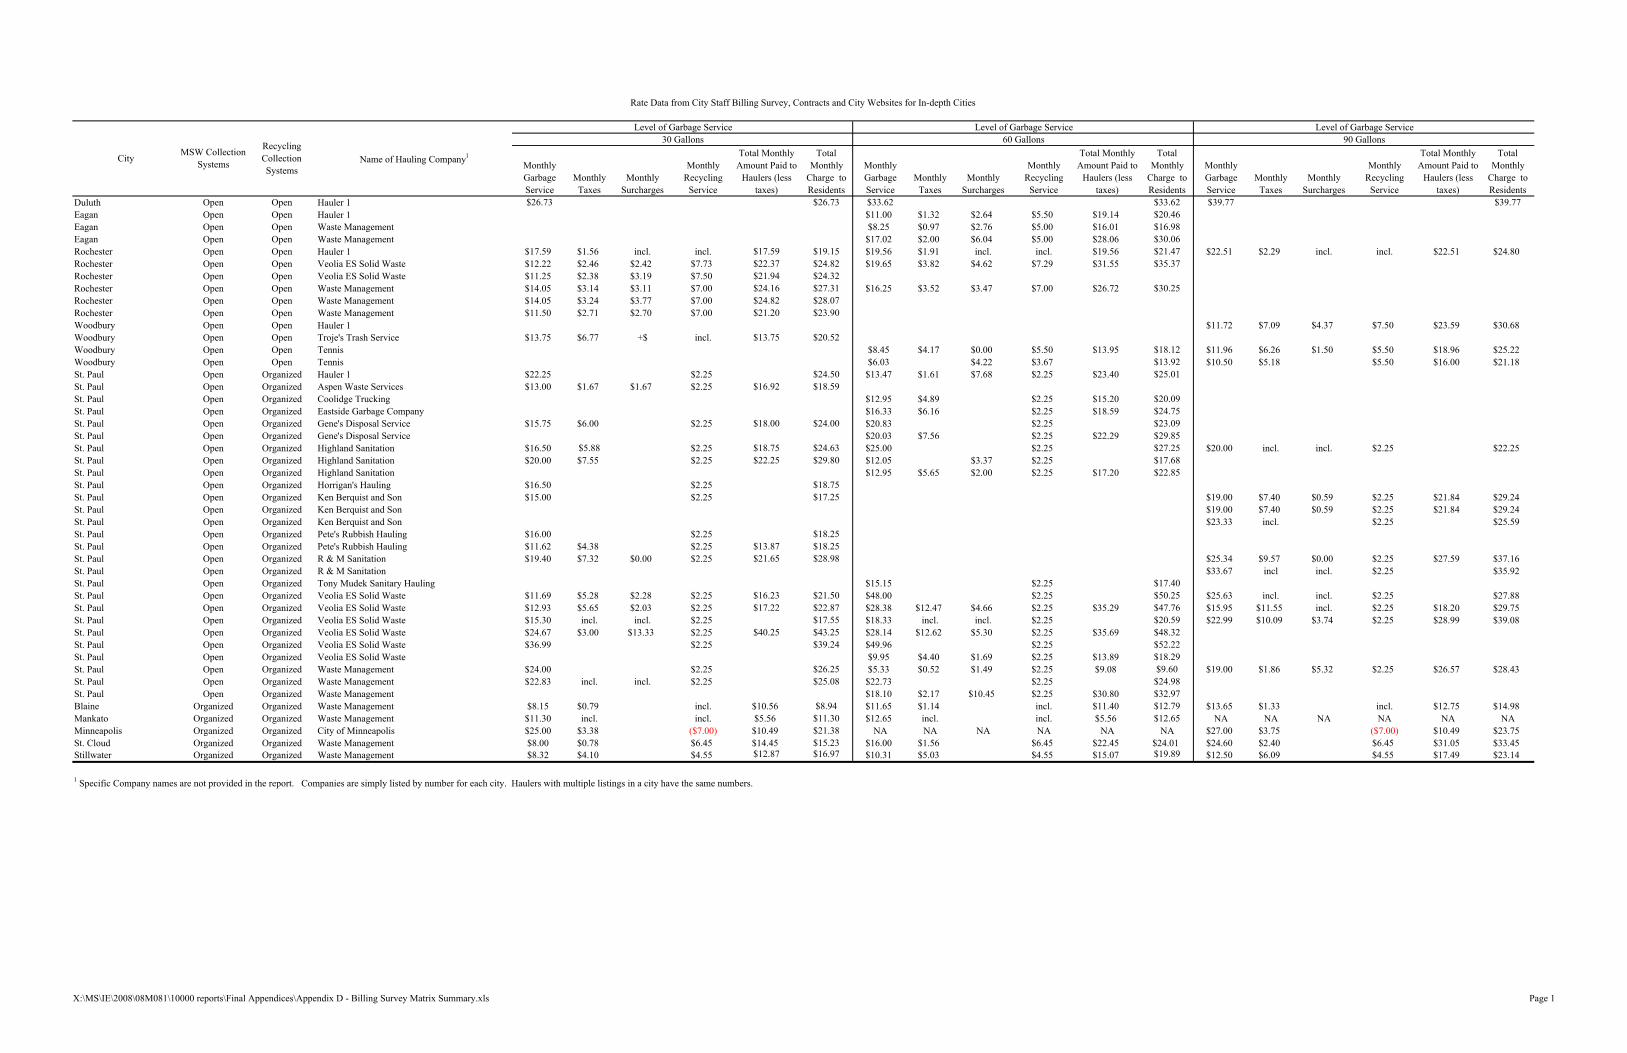
Monthly
Garbage
Service
Monthly
Taxes
Monthly
Surcharges
Monthly
Recycling
Service
Total Monthly
Amount Paid to
Haulers (less
taxes)
Total
Monthly
Charge to
Residents
Monthly
Garbage
Service
Monthly
Taxes
Monthly
Surcharges
Monthly
Recycling
Service
Total Monthly
Amount Paid to
Haulers (less
taxes)
Total
Monthly
Charge to
Residents
Monthly
Garbage
Service
Monthly
Taxes
Monthly
Surcharges
Monthly
Recycling
Service
Total Monthly
Amount Paid to
Haulers (less
taxes)
Total
Monthly
Charge to
Residents
Duluth Open Open Hauler 1 $26.73 $26.73 $33.62 $33.62 $39.77 $39.77
Eagan Open Open Hauler 1 $11.00 $1.32 $2.64 $5.50 $19.14 $20.46
Eagan Open Open Waste Management $8.25 $0.97 $2.76 $5.00 $16.01 $16.98
Eagan Open Open Waste Management $17.02 $2.00 $6.04 $5.00 $28.06 $30.06
Rochester Open Open Hauler 1 $17.59 $1.56 incl. incl. $17.59 $19.15 $19.56 $1.91 incl. incl. $19.56 $21.47 $22.51 $2.29 incl. incl. $22.51 $24.80
Rochester Open Open Veolia ES Solid Waste $12.22 $2.46 $2.42 $7.73 $22.37 $24.82 $19.65 $3.82 $4.62 $7.29 $31.55 $35.37
Rochester Open Open Veolia ES Solid Waste $11.25 $2.38 $3.19 $7.50 $21.94 $24.32
Rochester Open Open Waste Management $14.05 $3.14 $3.11 $7.00 $24.16 $27.31 $16.25 $3.52 $3.47 $7.00 $26.72 $30.25
Rochester Open Open Waste Management $14.05 $3.24 $3.77 $7.00 $24.82 $28.07
Rochester Open Open Waste Management $11.50 $2.71 $2.70 $7.00 $21.20 $23.90
Woodbury Open Open Hauler 1 $11.72 $7.09 $4.37 $7.50 $23.59 $30.68
Woodbury Open Open Troje's Trash Service $13.75 $6.77 +$ incl. $13.75 $20.52
Woodbury Open Open Tennis $8.45 $4.17 $0.00 $5.50 $13.95 $18.12 $11.96 $6.26 $1.50 $5.50 $18.96 $25.22
Woodbury Open Open Tennis $6.03 $4.22 $3.67 $13.92 $10.50 $5.18 $5.50 $16.00 $21.18
St. Paul Open Organized Hauler 1 $22.25 $2.25 $24.50 $13.47 $1.61 $7.68 $2.25 $23.40 $25.01
St. Paul Open Organized Aspen Waste Services $13.00 $1.67 $1.67 $2.25 $16.92 $18.59
St. Paul Open Organized Coolidge Trucking $12.95 $4.89 $2.25 $15.20 $20.09
St. Paul Open Organized Eastside Garbage Company $16.33 $6.16 $2.25 $18.59 $24.75
St. Paul Open Organized Gene's Disposal Service $15.75 $6.00 $2.25 $18.00 $24.00 $20.83 $2.25 $23.09
St. Paul Open Organized Gene's Disposal Service $20.03 $7.56 $2.25 $22.29 $29.85
St. Paul Open Organized Highland Sanitation $16.50 $5.88 $2.25 $18.75 $24.63 $25.00 $2.25 $27.25 $20.00 incl. incl. $2.25 $22.25
St. Paul Open Organized Highland Sanitation $20.00 $7.55 $2.25 $22.25 $29.80 $12.05 $3.37 $2.25 $17.68
St. Paul Open Organized Highland Sanitation $12.95 $5.65 $2.00 $2.25 $17.20 $22.85
St. Paul Open Organized Horrigan's Hauling $16.50 $2.25 $18.75
St. Paul Open Organized Ken Berquist and Son $15.00 $2.25 $17.25 $19.00 $7.40 $0.59 $2.25 $21.84 $29.24
St. Paul Open Organized Ken Berquist and Son $19.00 $7.40 $0.59 $2.25 $21.84 $29.24
St. Paul Open Organized Ken Berquist and Son $23.33 incl. $2.25 $25.59
St. Paul Open Organized Pete's Rubbish Hauling $16.00 $2.25 $18.25
St. Paul Open Organized Pete's Rubbish Hauling $11.62 $4.38 $2.25 $13.87 $18.25
St. Paul Open Organized R & M Sanitation $19.40 $7.32 $0.00 $2.25 $21.65 $28.98 $25.34 $9.57 $0.00 $2.25 $27.59 $37.16
St. Paul Open Organized R & M Sanitation $33.67 incl incl. $2.25 $35.92
St. Paul Open Organized Tony Mudek Sanitary Hauling $15.15 $2.25 $17.40
St. Paul Open Organized Veolia ES Solid Waste $11.69 $5.28 $2.28 $2.25 $16.23 $21.50 $48.00 $2.25 $50.25 $25.63 incl. incl. $2.25 $27.88
St. Paul Open Organized Veolia ES Solid Waste $12.93 $5.65 $2.03 $2.25 $17.22 $22.87 $28.38 $12.47 $4.66 $2.25 $35.29 $47.76 $15.95 $11.55 incl. $2.25 $18.20 $29.75
St. Paul Open Organized Veolia ES Solid Waste $15.30 incl. incl. $2.25 $17.55 $18.33 incl. incl. $2.25 $20.59 $22.99 $10.09 $3.74 $2.25 $28.99 $39.08
St. Paul Open Organized Veolia ES Solid Waste $24.67 $3.00 $13.33 $2.25 $40.25 $43.25 $28.14 $12.62 $5.30 $2.25 $35.69 $48.32
St. Paul Open Organized Veolia ES Solid Waste $36.99 $2.25 $39.24 $49.96 $2.25 $52.22
St. Paul Open Organized Veolia ES Solid Waste $9.95 $4.40 $1.69 $2.25 $13.89 $18.29
St. Paul Open Organized Waste Management $24.00 $2.25 $26.25 $5.33 $0.52 $1.49 $2.25 $9.08 $9.60 $19.00 $1.86 $5.32 $2.25 $26.57 $28.43
St. Paul Open Organized Waste Management $22.83 incl. incl. $2.25 $25.08 $22.73 $2.25 $24.98
St. Paul Open Organized Waste Management $18.10 $2.17 $10.45 $2.25 $30.80 $32.97
Blaine Organized Organized Waste Management $8.15 $0.79 incl. $10.56 $8.94 $11.65 $1.14 incl. $11.40 $12.79 $13.65 $1.33 incl. $12.75 $14.98
Mankato Organized Organized Waste Management $11.30 incl. incl. $5.56 $11.30 $12.65 incl. incl. $5.56 $12.65 NA NA NA NA NA NA
Minneapolis Organized Organized City of Minneapolis $25.00 $3.38 ($7.00) $10.49 $21.38 NA NA NA NA NA NA $27.00 $3.75 ($7.00) $10.49 $23.75
St. Cloud Organized Organized Waste Management $8.00 $0.78 $6.45 $14.45 $15.23 $16.00 $1.56 $6.45 $22.45 $24.01 $24.60 $2.40 $6.45 $31.05 $33.45
Stillwater Organized Organized Waste Management $8.32 $4.10 $4.55 $12.87 $16.97 $10.31 $5.03 $4.55 $15.07 $19.89 $12.50 $6.09 $4.55 $17.49 $23.14
1 Specific Company names are not provided in the report. Companies are simply listed by number for each city. Haulers with multiple listings in a city have the same numbers.
Level of Garbage Service
Rate Data from City Staff Billing Survey, Contracts and City Websites for In-depth Cities
Level of Garbage Service
30 Gallons 60 Gallons 90 Gallons
CityMSW Collection
Systems
Recycling
Collection
Systems
Name of Hauling Company1
Level of Garbage Service
X:\MS\IE\2008\08M081\10000 reports\Final Appendices\Appendix D - Billing Survey Matrix Summary.xls Page 1

X:\MS\IE\2008\08M081\10000 reports\Final Appendices\Appendix E - Participant Comments - Municipal, In-depth and Billing.doc
1
Experiences Establishing Collection Systems
Parts of this study attempted to gain information regarding municipal experiences with different collection approaches to determine their effectiveness. Selected case studies were covered in Section 2.4.3. The municipal survey included a yes/no question asking cities if they had experience establishing an open or organized residential collection system. If participants responded yes to this question, Foth followed-up with the city contact and requested them to elaborate on their response. Below are lists of responses. The lists are separated into sections based on the type of collection systems.
Open MSW/Open Recycling
Bloomington
♦ A residential survey conducted in 1995 showed that residents were in favor of an organized collection system. Based on these results the City started the organized process. This did not go any further than the public hearing because several citizens showed up opposing organized collection.
Chanhassen
♦ We’ve tried to establish organized collection. We still have an open system.
Otsego
♦ Residents like that they can choose their own hauler rather than having them chosen for them.
Prior Lake
♦ We looked at organized collection and decided against it at this time. The council decided against organized collection because of the responses received from Prior Lake residents who were fearful of losing their hauler, day of the week and paying more money for the same services.
Savage (Shakopee)
♦ (The respondent formerly worked for the city of Shakopee and provided the following comments relating to Shakopee.)
At that time (late 80s to early 90s) Waste Management was the contracted hauler for Shakopee’s residential solid waste collection. An open system remained in place for commercial properties. Residents in the community were very upset that their right to choose their own hauler was taken away. You would be surprised at how many people work in the solid waste industry that live in your neighborhood – they want to go with the company they work for or their relative/friend works for. You would also be surprised at the number of people who own their own businesses that take their household garbage to their place of business for disposal. These people are upset that they are charged for garbage collection at their house even though they don’t use it. During the time frame when Waste Management was the contracted hauler, the City billed residents for their garbage service on their utility bill. When residents would go on extended vacations they wanted to temporarily stop their garbage service. The City would have to adjust the

X:\MS\IE\2008\08M081\10000 reports\Final Appendices\Appendix E - Participant Comments - Municipal, In-depth and Billing.doc
2
utility bill for the residents during their vacation time frame and also contact Waste Management to let them know that the service was temporarily stopped. Then when the resident returned to the City, the utility bill had to be adjusted again and Waste Management contacted again to inform them to resume collection service at that resident’s home. This is an example of the labor intensive details the City had to deal with in order to meet the resident’s needs. In the respondent’s own neighborhood (not in Shakopee) the Home Owner’s Association tried to organize collection within the neighborhood. People got involved because they didn’t like having garbage cans out on the street everyday of the week. The Association contacted haulers and asked for prices. They could not sign a contract because they are only an association. The Association shared the prices with the neighborhood using flyers and encouraged people to go with the same hauler. He estimated that 80% of the neighborhood had the same hauler after this attempt. In Savage, some ideas they are considering include creating zones in the City and accepting bids for the different areas. Another option they are considering is creating zones in the City that require collection to be on a certain day. Then haulers who work in the specific zones are required to collect on the designated day. You may still have three or four garbage trucks collecting in one neighborhood but it would all be on the same day. This type of zoning might provoke neighborhoods to start some organizing on their own (residents may take notice of all the different garbage companies on their street).
Open MSW/Organized Recycling
Anoka
♦ The City’s Waste Reduction and Recycling Board (WRRB) maintains the residential recycling program. We present information to the City Council as needed and they are always interested in projects that help increase recycling tonnages and keep the City clean. In the past we have discussed organized vs. open hauling systems with the City Council as it relates to the service of haulers, noise, safety, and street maintenance. Together we determined to maintain an organized recycling system, but provide an open garbage hauling system.
Crystal
♦ The City established an organized recycling collection system in 1989 in accordance with Hennepin County Ordinance #13. The City also conducted an organized waste collection study in 1995 and decided not to organize.
A copy of this study was requested but not received.
Maple Grove
♦ We have had meetings discussing the option of going organized in the past. Waste haulers were opposed. Garbage collection is restricted to two days (Monday and Tuesday) throughout the City. Recycling is required to be collected on the same day as garbage is collected.
Minnetonka

X:\MS\IE\2008\08M081\10000 reports\Final Appendices\Appendix E - Participant Comments - Municipal, In-depth and Billing.doc
3
♦ In 1987 the City began the organized hauling process. After a lawsuit and huge crowds, the City decided not to pursue it.
Plymouth
♦ The City has discussed organized MSW collection several times. Recycling is organized.
Organized MSW/Organized Recycling
Elk River
♦ The City has been organized since around 1990. The respondent did not work at the City at the time but confirmed the change in the system was controversial. The City had to work hard to convince residents that there would be a cost savings for them. They started out with four contracted haulers. The original conversion from open hauling to organized collection involved establishing four areas with relatively equal numbers of households to be served. Now they are down to two contracted haulers and two collection areas as companies have consolidated. They have five year contracts.
Farmington
♦ The City has been organized since 1947.
Ham Lake
♦ The City has been organized since around 1990. When legislation required cities to provide the opportunity for recycling, the City sat down with the haulers to try and agree on a uniform recycling program for the City. The haulers could not agree on a program so they switched to organized collection. They started out with four haulers and are now down to two and they have zoning. They get a handful of calls each year from residents that want an open system.
Hopkins
♦ Prior to my employment, the City tried several refuse and recycling collection systems. (Note: The city of Hopkins is currently organized with municipal crews collecting MSW and Waste Management collecting recyclable materials.) Since I have been here the only change has been from dual stream recycling collection to single stream collection. The only concern was whether bi-weekly collection would be sufficient. This turned out to be a non-issue since the recycling carts were available in three sizes and residents were allowed to have more than one cart at no extra charge if it was deemed necessary.
Little Canada
♦ The City has been organized for many years, renewing the contract every 5 years. Adding a fuel surcharge to the 2007 contract was a change from previous contracts because of the increased costs of diesel fuel. Changing to single sort recycling was also a major change in our contract.
Red Wing
♦ In 2006 the City tried to designate that materials go to the WTE facility. A lawsuit ensued and as a resolution the City rewrote the ordinance to have an environmental service charge instead of designating an end facility for the waste.

X:\MS\IE\2008\08M081\10000 reports\Final Appendices\Appendix E - Participant Comments - Municipal, In-depth and Billing.doc
4
Robbinsdale
♦ The City originally had municipal crews doing collection and changed to one contracted hauler.
St. Louis Park
♦ Organized collection was established for single family households up to a 4-plex in the 1980’s. City Council would like to offer City collection to multi-family households and commercial businesses.
White Bear Lake
♦ White Bear Lake has operated with contracted organized collection service since 1926. At one point it included all residential units but in the mid 1990s it changed apartment buildings with greater than three units to an open system. The City’s contracts have generally ranged from three to five years and are openly bid. The hauler is required to provide same day recycling collection and the City designates the disposal location for both waste and recycling. Contracts include revenue sharing as an incentive. The City has a volume based pricing system that encourages recycling.
White Bear Township
♦ The town converted to organized collection over 20 years ago and the Town Board still favors it.

X:\MS\IE\2008\08M081\10000 reports\Final Appendices\Appendix E - Participant Comments - Municipal, In-depth and Billing.doc
5
Comments on Improving Existing Services
The municipal survey sought any insight on ways to improve management of collection systems. The billing survey also included an open ended question asking if any changes could be made to help improve the cities’ existing MSW and recycling collection services (legislation, incentives, etc.). Some city staff that participated in the billing survey provided opinions on how their existing services could be improved. Below are lists of responses. The lists are separated into sections based on the type of collection systems.
Open MSW/Open Recycling
Chanhassen
♦ Have more commercial single stream recycling.
Richfield
♦ Having a single hauler like Robbinsdale (Waste Management) offers economy of scale. Same hauler (Waste Management) that would charge $5 in solid waste stickers (Robbinsdale program) to remove a small dresser charged me $22 to remove a small dresser in Richfield! This was at time of regular stop. Five dollars of the $22 was a fuel surcharge. I got mad and cancelled service after many years. They (Waste Management) wanted me to talk to a “residential specialist” and offered to reduce or waive the fee. Phooey. I got estimates from competitors and recently went with Burt’s Disposal. Then, to remove Waste Management carts they wanted nearly $20 for a cart removal charge. Five dollars of THAT was a fuel surcharge! Fat chance collecting that. This is same company that would have picked up the dresser for $5 in Robbinsdale where I work doing code enforcement. What is so different from Richfield to Robbinsdale and cost of moving a stupid dresser? Problem: People who move from one city to another find a patchwork quilt of refuse hauling systems, programs, costs and ordinances. To have company “A” overcharge some customers as they drive down the alley burning fossil fuels while ignoring a mattress and a sofa at another property not on their customer list, only to have a company “B” truck need to lumber down the alley and remove the mattress but not the sofa. Are waste haulers free to charge fuel or tip your hat surcharges as they see fit?
Open MSW/Organized Recycling
Big Lake
♦ Make it mandatory that each residence have a recycling container.
Plymouth
♦ Organized collection and education for the public on Reduce, Reuse, and Recycle.
Roseville
♦ Our service is excellent. We wouldn’t do anything to change. ♦ Organize collection with franchise agreement.

X:\MS\IE\2008\08M081\10000 reports\Final Appendices\Appendix E - Participant Comments - Municipal, In-depth and Billing.doc
6
Organized MSW/Organized Recycling
White Bear Township
♦ Better markets for recycled glass.
Farmington
♦ Use an unsorted recycling can instead of bin.
Hopkins
♦ No sorting required. Keep recycling low cost and/or combine recycling bill with garbage.
♦ Anything to bring down costs, less frequent pickup, central deposit, customer sorts more items for recycling.
Robbinsdale
♦ Remove all recycling fees – recycling should be self efficient and not require fees.

X:\MS\IE\2008\08M081\10000 reports\Final Appendices\Appendix E - Participant Comments - Municipal, In-depth and Billing.doc
7
Comments on Opportunities to Reduce the Impacts and Costs Related to
Collection Vehicle Traffic on the Public Infrastructure
One of the commonly cited concerns for open systems is related to the impacts of truck traffic. The municipal survey included a yes/no question asking cities if their public works department had expressed opinions with respect to collection vehicle traffic impacts. If participants responded yes to this question, Foth followed-up with the City contact and requested them to elaborate on their response. Below are lists of responses. The lists are separated in to sections based on the type of collection systems.
Open MSW/Open Recycling
Bloomington
♦ The City engineer put together a memo that references MnDOT studies. This memo also outlines the Bloomington road weight restrictions, comparisons of heavy traffic, and costs for repair. In addition, the City has photos of road wear in cul-de-sacs where garbage trucks are the only trucks entering (school buses and other heavy trucks do not enter cul-de-sacs).
Lakeville
♦ We do not have a position on how collection vehicles impact our roads. We’re sure they do, but it has not recently been addressed or studied.
Prior Lake
♦ We know there are impacts but we have no studies.
Rosemount
♦ There have been some comments from the public works department but mostly there have been comments from elected officials.
Savage
♦ Anyone who says their public works department has not expressed concern over this issue is out of touch with their public works department. The weight of trucks causes wear and tear on the roadways. There has been some discussion of mandating hauling to become organized or create zones for haulers.
Open MSW/Organized Recycling
Crystal
♦ Our City engineer/public works director recognizes the additional wear and tear on roads from collection vehicle traffic.
Maple Grove
♦ One truck is better than five trucks driving down the same street for collecting garbage.

X:\MS\IE\2008\08M081\10000 reports\Final Appendices\Appendix E - Participant Comments - Municipal, In-depth and Billing.doc
8
New Brighton ♦ The City received an inquiry from a resident concerned about the amount of solid waste
trucks on their street on pick-up days. They thought it might be wasteful and had concerns they relayed to a council member and the City manager. The City manager forwarded it to me to do some research on the subject. I looked at studies done by Arden Hills and Falcon Heights on the effects of these types of vehicles driving on residential streets. I compiled a file and if the City Council ever wants to have a discussion on the issue, I am prepared. When compiling the file I talked with our public works department and got their feedback regarding some of the more scientific language in the report. There was interest from the council member and our City manager but I haven’t had to follow up yet. Foth received a copy of the file containing these studies from New Brighton.
Plymouth
♦ The public works director and superintendent have voiced opinions in public meetings.
Roseville
♦ Our City has relied on other studies done by other entities that show garbage trucks having significantly greater wear on streets. I don't have copies of any specific reports. Our public works director has referred to a formula from MnDOT that says one garbage truck trip is equal to 1,000 car trips and to pavement design manuals that show cars have a load factor of 0.0007 and that garbage trucks load factor can be as high as 1.6.

X:\MS\IE\2008\08M081\10000 reports\Final Appendices\Appendix E - Participant Comments - Municipal, In-depth and Billing.doc
9
Comments on Improving Existing Services
The following are comments about potential improvements obtained directly from surveys. The comments cover a wide range of topics and various preferences.
Open MSW/Open Recycling – Residents
Woodbury
♦ I am happy with collection, but the cost is 2-3 times what I paid in Arizona! Although there the collection was managed by the City.
♦ I would like to see more done for an incentive for recycling. When we lived in Forest
Lake we received a $2.00 credit per month for recycling. That was a large incentive to us to continue to make the extra effort to recycle. I think continued education is always helpful too.
Open MSW/Organized Recycling – Residents
St. Paul
♦ I would like to see organized collection using one hauler on the same day each week. I would like to see a process of selection based on price and level of service.
♦ Limit days of week for collection.
♦ Incentives for organized hauling.
♦ Move recyclable service back to the alley. Have neighbors try attempt to organize
collection.
♦ One hauler per neighborhood – doesn’t matter if one block is organized because the trucks serving the blocks to the east and west barrel down our alley.
♦ It would be nice to have the garbage collection and recycling on the same day. Makes it
a little easier to remember.
♦ Recycling is fine, though I’d like to see organics added. Would also like to see one hauler for our neighborhood instead of multiple trucks. But St. Paul doesn’t have the guts to change its open system, and my neighbors also aren’t motivated to get together on this.
♦ The City takes over the collection of solid waste entirely. I HATE this system of
independent haulers who specialize in the garbage they take. I MUCH prefer the Minneapolis model.
♦ Legislation to have block segments with organized hauling or assign specific
neighborhoods with haulers based on their current % of service to the area. Encourage

X:\MS\IE\2008\08M081\10000 reports\Final Appendices\Appendix E - Participant Comments - Municipal, In-depth and Billing.doc
10
garbage and recycling day to be the same day of the week in these areas. Explore every other week garbage collection.
♦ Curbside collection of electronics is a real need. Lots of them sit in alleys. And, I would
like to see zoned hauling in the City. I like my small hauler and value the customer service and the fact that they are a locally owned and operated business so I don’t want to see that disappear. Any zoned hauling would have to include specific preferences for small haulers. While organics collection would be great for my family, I know lots of folks who won’t switch from using their backyard compost pile. I completely understand that curbside organics can capture more than what goes into the compost, but those folks of which I speak want to continue to harvest compost and have not indicated interest in a 3rd, 4th, or 5th container in the kitchen. Alley collection of recyclables is preferred by our family even though that is not offered. We would be very disappointed if garbage collection moved to the street.
♦ Larger recycle bins.
♦ Begin to recycle all types of plastic, begin to recycle food scraps, begin penalizing people
who don’t recycle, offer plastic bag recycling in more places than the grocery store – maybe curbside?
♦ One bin recycling (right now we separate into two bins)
♦ Recycling could be one container, machine dumped for efficiency, and sorted at some
central location by automated and trained staff; I have heard other municipalities have done that and reduce labor and equipment costs, but would require providing a uniform container for people to use (large up front capital investment) and an auto dump truck.
♦ Mandate recycling.
♦ Expand items to be recycled (i.e. TVs, electronics curbside, or vouchers like
Minneapolis). Bloomington has a day each year that junk can be put on the curb – this would be great!
♦ Collection of refrigerated paper boxes.
♦ Electronics recycle pickup at home.
♦ Curbside composting will be great. More plastics collection.

As of 2-24-2009
Community 1
County
Household
Count 2
Annual Tons of
Recyclable
Material 3
Annual
Pounds per
Household
Open MSW, Open Recycling :
Andover Anoka 9,621 3,349.81 696
Coon Rapids Anoka 23,551 6,301.81 535
East Bethel Anoka 4,062 662.23 326
Lexington Anoka 804 248.20 617
Lino Lakes Anoka 5,958 1,721.33 578
Oak Grove Anoka 2,733 506.59 371
Saint Francis Anoka 2,519 447.31 355
Spring Lake Park Anoka 2,142 589.96 551
Chanhassen Carver 8,024 2,198.27 548
Chaska Carver 8,662 1,609.96 372
Victoria Carver 2,188 611.56 559
Waconia Carver 3,759 1,049.36 558
Apple Valley Dakota 18,846 4,038.69 429
Burnsville Dakota 24,622 4,582.52 372
Eagan Dakota 25,536 5,338.78 418
Inver Grove Heights Dakota 13,170 2,883.47 438
Lakeville Dakota 17,755 3,305.96 372
Mendota Heights Dakota 4,472 1,318.45 590
Rosemount Dakota 7,104 1,448.65 408
South St. Paul Dakota 8,163 2,444.46 599
West St. Paul Dakota 8,605 1,006.85 234
Bloomington Hennepin 25,988 8,585.20 661
Dayton Hennepin 1,570 288.50 368
Eden Prairie Hennepin 18,188 7,216.46 794
Greenwood Hennepin 290 86.09 594
Hanover Hennepin 195 71.23 731
Richfield Hennepin 10,420 2,932.08 563
Rogers Hennepin 2,360 563.27 477
St. Anthony Hennepin 2,109 377.54 358
Mounds View Ramsey 3,569 968.30 543
North Oaks Ramsey 1,568 544.22 694
St. Anthony Ramsey 494 148.05 599
Denmark Twp Washington 606 240.46 794
Hugo Washington 4,301 931.07 433
Lake Elmo Washington 2,787 793.71 570
Newport Washington 1,372 160.73 234
Oakdale Washington 11,002 1,985.62 361
St. Paul Park Washington 2,013 452.63 450
Stillwater Twp Washington 874 296.37 678
Woodbury Washington 21,350 5,950.20 557
Number of Communities with Open MSW, Open Recycling Systems: 1
40
Percent of Total 36%
Average of Recovery Rates: 510
Subtotals 313,352 78,255.94
Percent of Total 38% 36%
X:\MS\IE\2008\08M081\10000 reports\Final Appendices\Appendix F - Re-TRAC Recycling Data.xls Page 1 of 4

As of 2-24-2009
Community 1
County
Household
Count 2
Annual Tons of
Recyclable
Material 3
Annual
Pounds per
Household
Open MSW, Organized Recycling :
Anoka Anoka 4,924 1,338.00 543
Fridley Anoka 8,300 2,091.36 504
Ramsey Anoka 7,108 2,709.27 762
Brooklyn Park Hennepin 21,071 5,259.30 499
Corcoran Hennepin 2,032 355.10 350
Edina Hennepin 14,600 5,137.50 704
Golden Valley Hennepin 6,910 2,184.82 632
Hassan Hennepin 937 189.70 405
Hennepin Recycling Group (HRG) Hennepin 20,977 5,344.00 510
Maple Grove Hennepin 21,471 5,694.60 530
Minnetonka Hennepin 16,273 5,717.25 703
Minnetrista Hennepin 2,240 744.90 665
Mound Hennepin 3,579 733.39 410
Plymouth Hennepin 22,509 6,772.95 602
Shorewood Hennepin 2,800 916.40 655
Spring Park Hennepin 309 113.10 732
W Hennepin Recycling Commission Hennepin 8,266 2,323.65 562
Woodland Hennepin 192 81.87 853
Arden Hills Ramsey 2,845 939.40 660
Falcon Heights Ramsey 1,280 433.41 677
Gem Lake Ramsey 159 20.50 258
Lauderdale Ramsey 562 142.71 508
Maplewood Ramsey 11,360 2,200.40 387
New Brighton Ramsey 6,350 1,641.00 517
Roseville Ramsey 9,366 3,091.75 660
Shoreview Ramsey 9,563 3,108.60 650
St. Paul Ramsey 84,771 18,239.32 430
Baytown Twp Washington 571 139.86 490
Birchwood Washington 356 138.40 778
Dellwood Washington 385 173.00 899
Grant Washington 1,486 514.40 692
Lake St. Croix Beach Washington 484 163.70 676
Lakeland Washington 696 191.13 549
Lakeland Shores Washington 122 32.68 536
Mahtomedi Washington 2,788 1,020.00 732
May Township Washington 1,129 126.89 225
New Scandia Twp Washington 1,490 173.82 233
Pine Springs Washington 138 57.60 835
St. Mary's Point Washington 154 51.90 674
West Lakeland Twp Washington 1,245 464.90 747
Willernie Washington 227 55.30 487
Number of Communities with Open MSW, Organized Recycling Systems: 1
41
Percent of Total 37%
Average of Recovery Rates: 583
Subtotals 302,025 80,827.83
Percent of Total 36% 37%
X:\MS\IE\2008\08M081\10000 reports\Final Appendices\Appendix F - Re-TRAC Recycling Data.xls Page 2 of 4

As of 2-24-2009
Community 1
County
Household
Count 2
Annual Tons of
Recyclable
Material 3
Annual
Pounds per
Household
Organized MSW, Organized Recycling :
Blaine Anoka 16,160 5,729.44 709
Centerville Anoka 1,310 422.75 645
Circle Pines Anoka 1,889 611.20 647
Columbia Heights Anoka 5,846 1,343.85 460
Ham Lake Anoka 4,000 1,544.91 772
Hilltop Anoka 270 79.76 591
Hastings Dakota 8,346 2,210.61 530
Champlin Hennepin 6,691 2,057.00 615
Deephaven Hennepin 1,460 545.47 747
Excelsior Hennepin 619 163.32 528
Hopkins Hennepin 2,990 871.80 583
Minneapolis Hennepin 105,008 24,749.50 471
Osseo Hennepin 598 154.70 517
Robbinsdale Hennepin 5,037 1,386.30 550
St. Bonifacius Hennepin 841 176.42 420
St. Louis Park Hennepin 12,225 3,911.35 640
Tonka Bay Hennepin 574 163.03 568
Little Canada Ramsey 1,664 594.32 714
North St. Paul Ramsey 3,679 1,030.00 560
Vadnais Heights Ramsey 4,451 1,060.80 477
White Bear Lake, City of Ramsey 7,174 2,086.55 582
White Bear Twp Ramsey 4,410 1,324.70 601
Afton Washington 1,053 578.02 1,098
Bayport Washington 802 196.44 490
Forest Lake Washington 6,806 1,278.72 376
Marine on St. Croix Washington 296 84.84 573
Oak Park Heights Washington 2,038 334.80 329
Stillwater Washington 7,074 1,917.70 542
White Bear Lake Washington 206 29.73 289
Number of Communities with Organized MSW, Organized Recycling Systems: 1
29
Percent of Total 26%
Average of Recovery Rates: 573
Subtotals 213,517 56,638.03
Percent of Total 26% 26%
Subtotal number of communities in both "Org. MSW + Org. Rec." plus "Open MSW + Org. Rec.": 70
Average of Recovery Rates of communities in both "Org. MSW + Org. Rec." plus "Open MSW + Org. Rec.": 579
Difference Between Average Recovery Rates of communities in "Org. Rec." and "Open Rec.": 69
Additional tons if all 41 "Open Rec." converted to "Org. Rec.": 10,810.64
X:\MS\IE\2008\08M081\10000 reports\Final Appendices\Appendix F - Re-TRAC Recycling Data.xls Page 3 of 4

As of 2-24-2009
Community 1
County
Household
Count 2
Annual Tons of
Recyclable
Material 3
Annual
Pounds per
Household
TOTAL NUMBER OF COMMUNITIES: 110
Open MSW Subtotal 81
Percent of Total 74%
Organized Recycling Subtotal 70
Percent of Total 64%
AVERAGE OF RECOVERY RATES 554
TOTALS: 828,894 215,721.80
Percent of Total 100% 100%
Footnotes:
1 "Communities" includes cities, townships, and multi-city groups that cooperate on recycling program
management such that recycling data is aggregated and reported as one entity in Re-TRAC.
2 "Household count" represents the best available data of the actual number of households served with
curbside recycling collection services as reported by municipalities and SWMCB member Counties.
3 "Annual Tons of Recyclable Material" is curbside tonnages only (not including recovery from
drop-off centers, special events, or other collection programs) as reported by communities
and Counties in Re-TRAC
X:\MS\IE\2008\08M081\10000 reports\Final Appendices\Appendix F - Re-TRAC Recycling Data.xls Page 4 of 4

In our March 28, 1980 report, Solid Waste Collection Alternatives, we analyzed the problems with our solid waste collection operation and recommended remedies. We terminated the operation on May 9th as planned. A lot of activities were required including reassignment of employees, disposal of trucks, and assistance to city customers in finding private haulers. I also committed the Public Works Department to an improved enforcement program and we are mandated by the City Council to prepare an organized solid waste collection report by September 1, 1980.
TERMINATION OF COLLECTION OPERATION
We successfully terminated the city collection operation--we no longer pick up residential refuse. Three city crews continue to provide refuse pickup for litter baskets in the downtown area, city playgrounds, fire stations, libraries and public buildings. We are still doing the bookkeeping and accounting work necessary to close out the fund. All Solid Waste employees are working in their own or equivalent titles with no loss of time or rate of pay through the phasing out period. CITY CUSTOMER ASSISTANCE The Department of Public Works made a major effort to communicate with the 13,200 city customers that we were stopping the city service on May 9th and the reasons for it. Customers were provided information on licensed private haulers and were encouraged to make arrangements as soon as possible. The week preceding May 9th it was my judgment that 80% of the City's customers had made arrangements for a private hauler. I think that estimate was too low and I think the number was over 90%. There are few problems during the week of May 9th in the immediate transition period and there has been little or no problem since. We have a "hot line" number set up in Public Works to answer calls on refuse, since May 9th, anticipating a fairly large number of calls, but as it turned out we've hardly had any calls, even the days following May 9th. Right now it's only one or two calls per day. In my judgment almost all of the City customers now have service from private haulers. Private haulers have absorbed the City's customers without any great difficulty, as we anticipated. PRIVATE HAULER CHARGES In the March 28 report we said that in our judgment 3/4 of the approximately 50 licensed residential private haulers were charging the same or less than our rate at that time of $1.45 per week or $6.00 per month. We said further that some of the private haulers had raised their rates since the first of the year but the large majority were following the City and would raise their rates only the City did. It goes without saying that the private haulers have the same expenses the city would have and would have to adjust their rates at some point. There are two major areas that affect the rates: first - fuel costs and; secondly - landfill disposal costs. Fuel costs have not changed significantly since the March 28th report. Landfill disposal costs have taken a sharp increase. The Pine Bend Landfill, where perhaps 80% of all St. Paul's refuse is disposed, has

Mayor Latimer - 2 - raised their "tipping charge" from $5.00 per ton to $6.50 per ton on June 1st. This is a 30% increase but when converted back to a household charge would probably result in a 15% increase. Private haulers have no choice but to pass on these higher disposal costs. I have no idea when they will do this but the higher landfill costs are now in effect. ENFORCEMENT Since May 9th the Department of Public Works has stepped up the enforcement of the existing Solid Waste Ordinance. That ordinance required that all households have garbage pick up every "seven calendar days". Private refuse haulers as well as district planning officials are working with us in identifying households not having garbage collection. Public Works staff members are calling on these people and encouraging them to arrange for collection service. Later we will follow up with ticketing if necessary but our major thrust now is education. Increased attention has been given to sanitation problems such as dumping on vacant property throughout the city. Public Works has also been working with the License Inspector in cracking down on unlicensed refuse haulers. I think we are making definite progress in cleaning up the city. We have not seen any increases in the summary abatement cleanups but we are prepared to respond to the Housing Code section if those needs occur. Our course of action is to steadily tighten down the existing sanitation ordinance and stressing education. With a final appraisal in the report to be submitted in the fall.
SOLID WASTE MANAGEMENT PLAN
A May 8th Council Resolution directed us to prepare a report on organized mandatory solid waste collection. You know we agree on the need for a more organized approach--not only for collection--but also for solid waste transportation and the disposal or recovery of solid waste. COLLECTION The final plan will contain a detailed discussion of pros and cons of several alternatives available for establishing an organized system. The issued will be: A. Whether the "open system" of collection should be continued with tighter controls or whether a contract should be sued. If a contract is used should it be a negotiated contract. B. Duration of the contract. C. Involvement of the neighborhood planning districts. D. The question of city crews involvement. E. How the system will be funded (through property tax, through city billing, or through private billing), and F. Administrative controls.

Mayor Latimer - 3 - Included also will be a brief analysis of the performance of private haulers in the May 9 - September 1 interim. The work will be used as an indication of their future performance and their ability to conform to the plan's requirements. As I see it, the main municipal involvement will have to be a strong enforcement program. It's our determination and ability to use the strength of existing ordinances--not our involvement in actual collection--that will determine the success of any organized system. Perhaps improper and illegal storage of materials in the city. TRANSPORTATION For as long as we must rely on landfills it will remain important to extend their useful life. Transfer stations are flexible for different final disposal methods and would actually encourage methods other than landfilling since it would provide a physical concentration of the solid waste flow. DISPOSAL (INCLUDING RECYCLING RESOURCE RECOVERY) This was not mandated by the Council Resolution, but the report will discuss it since I feel this will be the critical area in solid waste for the city. Landfills are an interim solution at best. We will be reviewing and advocating courses of action for disposal which will include resource recovery, recycling, and modular incineration. We will study the relationships of these to St. Paul's district heating program. We are tying these together within our Environmental Protection Agency grant work. Decisions related to the grant will be coming to a head in a way that will tie in very well with our Solid Waste Management Plan. As Director of Public Works I intend to take on the responsibility of doing the report and making the recommendation to you. I don't intend to go out into the community and solicit more input but I would welcome inputs from various groups such as the unions, private haulers, district councils, Chamber of Commerce, etc. and individuals
Friday, April 25th, 1980 Memo
The private refuse haulers would handle the 13,000 city customers and also provide a rate for senior citizens comparable to our subsidized rate. On April 22, 1980 Don met with Councilman McMahon and Councilwoman Showalter, Frank Rauschnot, George Oxford and Mike Heinz, private haulers, on the Executive Board of the Association. They had been meeting exclusively with Councilwoman Showalter and wanted to resurrect the plan of a year ago which called for a combination of city and private haulers and a negotiated five-year contract based on prevailing wages in the city factor. Obviously this is a tremendous deal for the private haulers. Mrs. Showalter obviously strongly supports this and had brought the haulers into George McMahon and I think was trying to persuade him to take a firm position supporting this and delaying the May 9th stopping of the city collection for possibly 90 days while this would be worked out. We had discussed this at our Wednesday morning meeting with George McMahon present. A year ago, a long-term negotiated contract may have made sense, but I am less in favor of that approach as time goes by. I think the haulers now see their only chance of getting such an agreement is to have the city as part of it and, of course, the higher city prevailing wages would be used and desirable from their part. We must understand, too, that most of the private
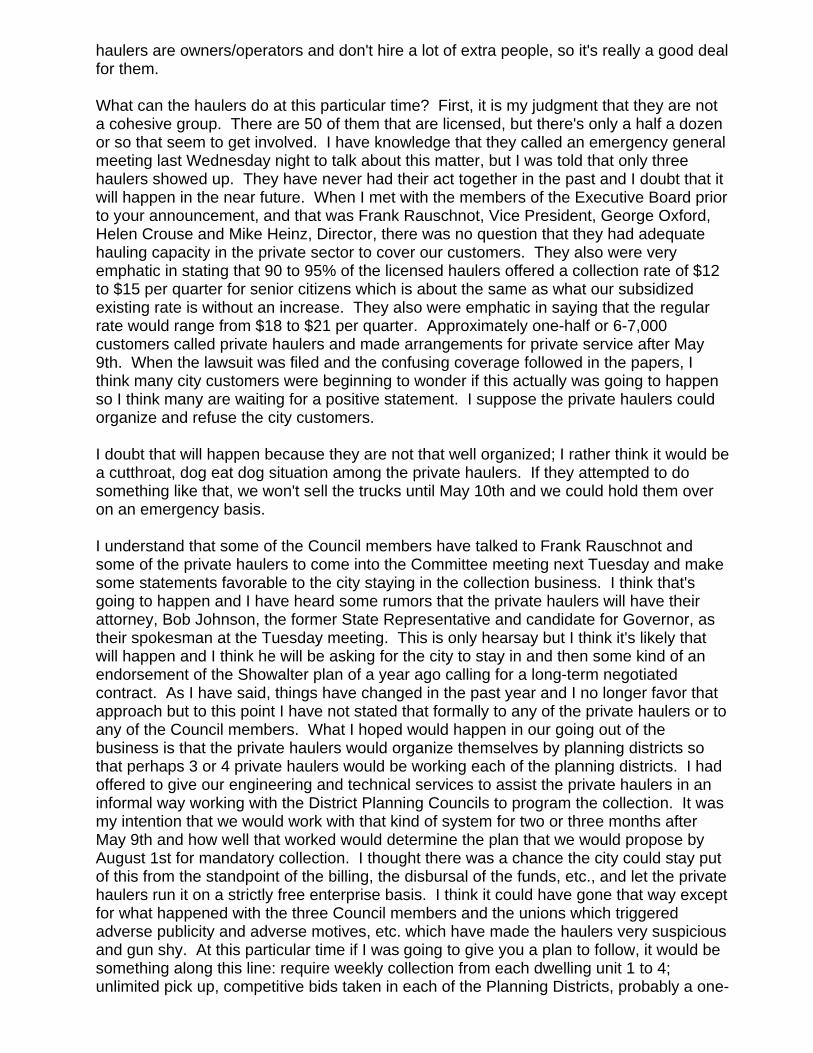
haulers are owners/operators and don't hire a lot of extra people, so it's really a good deal for them. What can the haulers do at this particular time? First, it is my judgment that they are not a cohesive group. There are 50 of them that are licensed, but there's only a half a dozen or so that seem to get involved. I have knowledge that they called an emergency general meeting last Wednesday night to talk about this matter, but I was told that only three haulers showed up. They have never had their act together in the past and I doubt that it will happen in the near future. When I met with the members of the Executive Board prior to your announcement, and that was Frank Rauschnot, Vice President, George Oxford, Helen Crouse and Mike Heinz, Director, there was no question that they had adequate hauling capacity in the private sector to cover our customers. They also were very emphatic in stating that 90 to 95% of the licensed haulers offered a collection rate of $12 to $15 per quarter for senior citizens which is about the same as what our subsidized existing rate is without an increase. They also were emphatic in saying that the regular rate would range from $18 to $21 per quarter. Approximately one-half or 6-7,000 customers called private haulers and made arrangements for private service after May 9th. When the lawsuit was filed and the confusing coverage followed in the papers, I think many city customers were beginning to wonder if this actually was going to happen so I think many are waiting for a positive statement. I suppose the private haulers could organize and refuse the city customers. I doubt that will happen because they are not that well organized; I rather think it would be a cutthroat, dog eat dog situation among the private haulers. If they attempted to do something like that, we won't sell the trucks until May 10th and we could hold them over on an emergency basis. I understand that some of the Council members have talked to Frank Rauschnot and some of the private haulers to come into the Committee meeting next Tuesday and make some statements favorable to the city staying in the collection business. I think that's going to happen and I have heard some rumors that the private haulers will have their attorney, Bob Johnson, the former State Representative and candidate for Governor, as their spokesman at the Tuesday meeting. This is only hearsay but I think it's likely that will happen and I think he will be asking for the city to stay in and then some kind of an endorsement of the Showalter plan of a year ago calling for a long-term negotiated contract. As I have said, things have changed in the past year and I no longer favor that approach but to this point I have not stated that formally to any of the private haulers or to any of the Council members. What I hoped would happen in our going out of the business is that the private haulers would organize themselves by planning districts so that perhaps 3 or 4 private haulers would be working each of the planning districts. I had offered to give our engineering and technical services to assist the private haulers in an informal way working with the District Planning Councils to program the collection. It was my intention that we would work with that kind of system for two or three months after May 9th and how well that worked would determine the plan that we would propose by August 1st for mandatory collection. I thought there was a chance the city could stay put of this from the standpoint of the billing, the disbursal of the funds, etc., and let the private haulers run it on a strictly free enterprise basis. I think it could have gone that way except for what happened with the three Council members and the unions which triggered adverse publicity and adverse motives, etc. which have made the haulers very suspicious and gun shy. At this particular time if I was going to give you a plan to follow, it would be something along this line: require weekly collection from each dwelling unit 1 to 4; unlimited pick up, competitive bids taken in each of the Planning Districts, probably a one-

year contract which would be highly undesirable to the private haulers, and a restriction of no more than 2 planning district contracts for any one vendor. This would eliminate the possibility of a big operator coming in and taking over. This approach would mean that no one vendor would have more than 6 trucks operating in the city which is similar to the way it's set up right now. Recycling could be worked into these contracts either at the source or at a central drop-off point. I would favor setting up two locations, perhaps one east and one west, in the city that would be transfer points for disposal of the refuse and also could act as recycling depots. These transfer stations would be in effect until something is developed on the modular incinerators which is a few years down the line. As you know, our study from the EPA grant is due on July lst. But this plan that I have outlined would be the ideal as I see it at this point in the event discussions would come out at the Tuesday meeting. Needless to say, this plan would not be favored by the private haulers, but I think it would be fair to them and would be a reasonable plan that would guarantee the citizens getting the lowest possible rate for refuse collection. I think we should be careful not to get drawn into discussions of this plan beyond May 9th unless it is absolutely necessary. The reason I say this is that if you talk any kind of a competitive bid, it will rile up the private haulers and it may bring them together in a cohesive group but again I think we should be prepared in case the private haulers come on strong through their attorney to rebut what they say. It is my judgement that not only are the unions and the city refuse collectors in a quandary right now, but I also think it is more true in the private refuse collection area. The private haulers are now sitting on the fence and they don't know which way to go. They started out working with us in a very cooperative way and a very reasonable way and now they are starting to drift toward’s the union position. Some of the astute private haulers recognize what's happening but not too many of them do. It's always been my position, Mayor, that if the private haulers really screwed us up during this transition period that our option in the future was very clear -- that being a competitive bid. Some of the private haulers realize that and that's why I feel they are in such a quandary right now. Many of the refuse haulers in Minneapolis have been inquiring about the situation in St. Paul and whether they can be considered for work here. In response to the questions, we have been generally vague at this point, but I know they are watching the situation very closely.
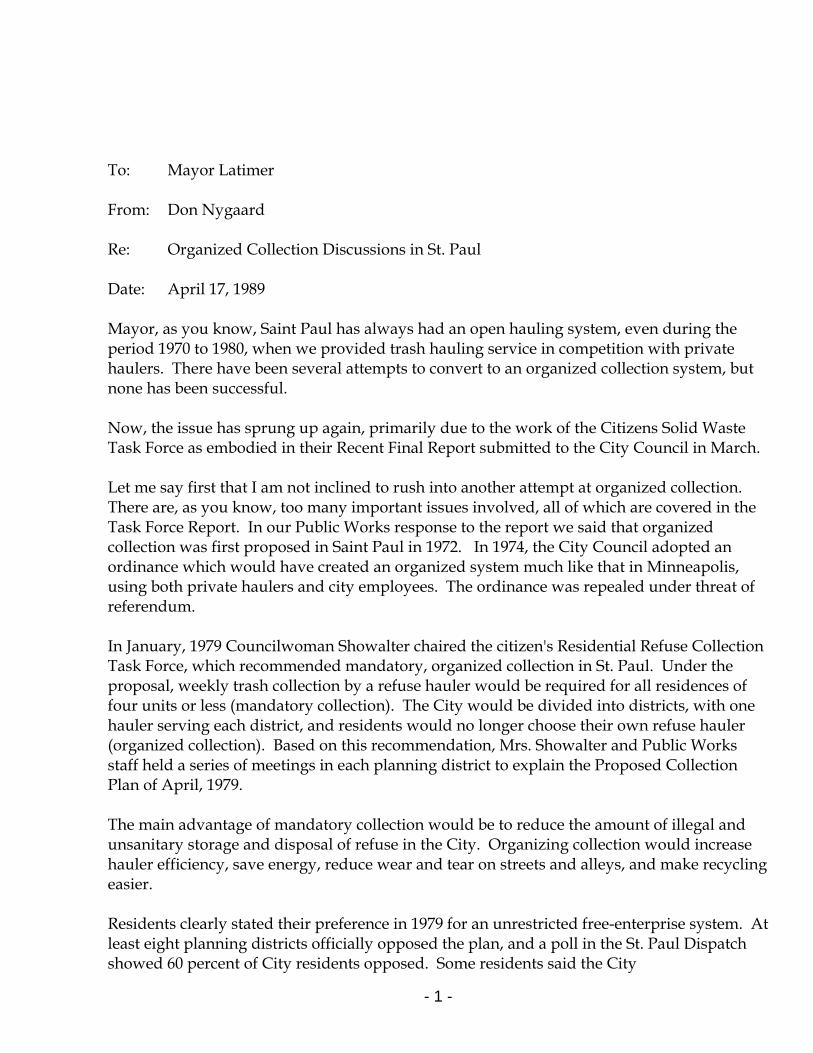
- 1 -
To: Mayor Latimer From: Don Nygaard Re: Organized Collection Discussions in St. Paul Date: April 17, 1989 Mayor, as you know, Saint Paul has always had an open hauling system, even during the period 1970 to 1980, when we provided trash hauling service in competition with private haulers. There have been several attempts to convert to an organized collection system, but none has been successful. Now, the issue has sprung up again, primarily due to the work of the Citizens Solid Waste Task Force as embodied in their Recent Final Report submitted to the City Council in March. Let me say first that I am not inclined to rush into another attempt at organized collection. There are, as you know, too many important issues involved, all of which are covered in the Task Force Report. In our Public Works response to the report we said that organized collection was first proposed in Saint Paul in 1972. In 1974, the City Council adopted an ordinance which would have created an organized system much like that in Minneapolis, using both private haulers and city employees. The ordinance was repealed under threat of referendum. In January, 1979 Councilwoman Showalter chaired the citizen's Residential Refuse Collection Task Force, which recommended mandatory, organized collection in St. Paul. Under the proposal, weekly trash collection by a refuse hauler would be required for all residences of four units or less (mandatory collection). The City would be divided into districts, with one hauler serving each district, and residents would no longer choose their own refuse hauler (organized collection). Based on this recommendation, Mrs. Showalter and Public Works staff held a series of meetings in each planning district to explain the Proposed Collection Plan of April, 1979. The main advantage of mandatory collection would be to reduce the amount of illegal and unsanitary storage and disposal of refuse in the City. Organizing collection would increase hauler efficiency, save energy, reduce wear and tear on streets and alleys, and make recycling easier. Residents clearly stated their preference in 1979 for an unrestricted free-enterprise system. At least eight planning districts officially opposed the plan, and a poll in the St. Paul Dispatch showed 60 percent of City residents opposed. Some residents said the City
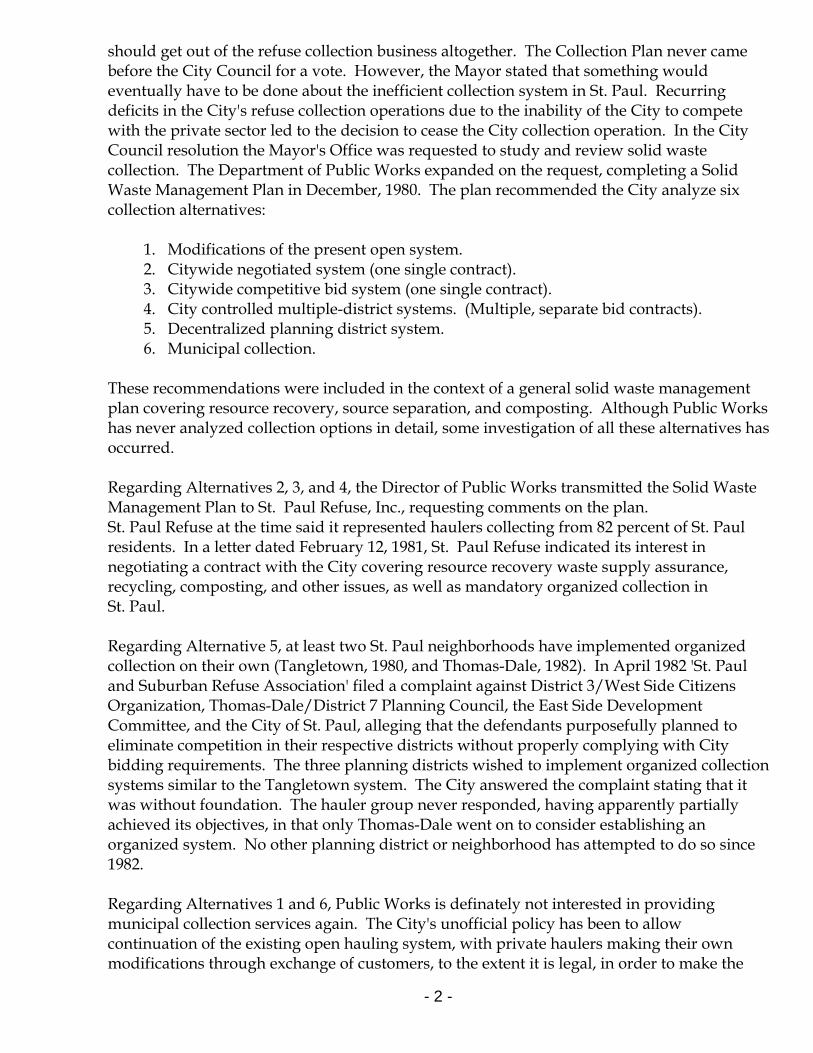
- 2 -
should get out of the refuse collection business altogether. The Collection Plan never came before the City Council for a vote. However, the Mayor stated that something would eventually have to be done about the inefficient collection system in St. Paul. Recurring deficits in the City's refuse collection operations due to the inability of the City to compete with the private sector led to the decision to cease the City collection operation. In the City Council resolution the Mayor's Office was requested to study and review solid waste collection. The Department of Public Works expanded on the request, completing a Solid Waste Management Plan in December, 1980. The plan recommended the City analyze six collection alternatives: 1. Modifications of the present open system. 2. Citywide negotiated system (one single contract). 3. Citywide competitive bid system (one single contract). 4. City controlled multiple-district systems. (Multiple, separate bid contracts). 5. Decentralized planning district system. 6. Municipal collection. These recommendations were included in the context of a general solid waste management plan covering resource recovery, source separation, and composting. Although Public Works has never analyzed collection options in detail, some investigation of all these alternatives has occurred. Regarding Alternatives 2, 3, and 4, the Director of Public Works transmitted the Solid Waste Management Plan to St. Paul Refuse, Inc., requesting comments on the plan. St. Paul Refuse at the time said it represented haulers collecting from 82 percent of St. Paul residents. In a letter dated February 12, 1981, St. Paul Refuse indicated its interest in negotiating a contract with the City covering resource recovery waste supply assurance, recycling, composting, and other issues, as well as mandatory organized collection in St. Paul. Regarding Alternative 5, at least two St. Paul neighborhoods have implemented organized collection on their own (Tangletown, 1980, and Thomas-Dale, 1982). In April 1982 'St. Paul and Suburban Refuse Association' filed a complaint against District 3/West Side Citizens Organization, Thomas-Dale/District 7 Planning Council, the East Side Development Committee, and the City of St. Paul, alleging that the defendants purposefully planned to eliminate competition in their respective districts without properly complying with City bidding requirements. The three planning districts wished to implement organized collection systems similar to the Tangletown system. The City answered the complaint stating that it was without foundation. The hauler group never responded, having apparently partially achieved its objectives, in that only Thomas-Dale went on to consider establishing an organized system. No other planning district or neighborhood has attempted to do so since 1982. Regarding Alternatives 1 and 6, Public Works is definately not interested in providing municipal collection services again. The City's unofficial policy has been to allow continuation of the existing open hauling system, with private haulers making their own modifications through exchange of customers, to the extent it is legal, in order to make the

- 3 -
system more efficient. There are areas of Saint Paul where some degree of informal 'organized' collection is already taking place (e.g. haulers not accepting new accounts in parts of the city where they do not already have a significant number of customers; trading customers). The collection system today in St. Paul is more efficient than it was five and ten years ago. In the last few years, organized collection proposals have again surfaced in Saint Paul from a number of sources. The Elder Council recommended in 1985 that Saint Paul adopt residential organized collection by means of a negotiated contract for mixed solid waste. Source separation would be mandatory and pickups would be made regularly for recyclables (paper, cardboard, glass, aluminum, ferrous metals, and plastics). On-call or specially scheduled pickups would be made for yard wastes and for "special wastes" (tires, tree wastes, household hazardous wastes, demolition debris, and large articles such as refrigerators, beds and springs). The system would be financed either by a special assessment or through property taxes. District 14 has developed a proposal for an "optimal collection system" to be operated through the district council. District 14's optimal collection would include organized mixed waste collection (negotiated contract), weekly recycling collections on the same days as mixed waste collections, and separate yard waste collections. District 14's process would begin with a survey of residents and haulers, to determine their needs, attitudes, and desires about solid waste collection. If the survey showed optimal collection to be feasible, the district council would seek authority from the city to organize collection services. Financing would come from customer fees, plus Met Council and county grants. The 1988 authorizing resolution for the Solid Waste Task Force contained a proposal from City Councilmembers for the task force to consider. The Councilmembers' proposal would have either the city or a nonprofit corporation administer organized collection and divide the city into districts or routes. Haulers would bid competitively on each route. Bids would be rotated across the city throughout the year. The selection of a hauler for each route would be made by a vote of residents served by that route. No hauler would be permitted to have more than a predetermined percentage of stops or routes in the city. On March 30, 1989 Glynnis Jones and I met with representatives of 12 residential haulers operating in St. Paul. Mary Ayde, Minnesota Waste Association Secretary and St. Paul Solid Waste Task Force co-chair, and John Cairnes, Counsel to the Minnesota Waste Association from Briggs and Morgan, also attended. The purpose of the meeting was to discuss the volume-based fee initiative. The position expressed by Don Hinz of Eagle Sanitation was that the haulers do not want to discuss a separate volume-based fee initiative or mandatory source separation because they have already proposed a system which would achieve this through organized collection. The hauler group claims to have letters of intent from 75 percent of the residential haulers licensed in St. Paul.

- 4 -
The Solid Waste Task Force recommends that St. Paul should develop a comprehensive solid waste management system, including the following key features: organized collection of mixed solid waste, mandatory collection of mixed waste, curbside recycling, yard waste collection, and volume based pricing. The so-called "Champlin amendment" to the Minnesota Waste Management Act (Minnesota Statutes 115A.94) affords municipalities considerable flexibility in designing and implementing organized collection systems. In addition to the Waste Management Act, the city of Saint Paul has had its own antitrust exemption for many years. Laws 1975, Chapter 332 (not coded) specifically permits Saint Paul to organize collection without violating state antitrust laws. The adequacy of the Champlin amendment was questioned in 1988. A letter from the state attorney general's office responding to hauler concerns resulted in abandonment of organized collection plans in Maplewood. Attempts to organize collection by a Brooklyn Center and Crystal joint powers board resulted in a lawsuit from a hauler. Minnetonka was later added to the suit. The basis for the lawsuit was a directive from Brooklyn Center and Crystal for haulers to form a corporation, which then would allocate routes and negotiate a contract with the cities. The plaintiff hauler (BFI) believed that joining the corporation would mean engaging in activity prohibited by antitrust laws (e.g. allocating routes). On the other hand, the hauler believed that failure to join the corporation would mean loss of residential business in the two cities. The hauler obtained a temporary restraining order, and a hearing was held in Hennepin County District Court December 2, 1988. A decision in the case is anticipated in June, 1989. The "Champlin amendment" contains the following provisions: 1. Cities and counties are authorized to organize collection by a variety of methods, including municipal service, franchise, negotiated or bidded contract, or other means, using one or more collectors or an organization of collectors. 2. A city must follow specified procedures and requirements in organizing refuse collection:
a. The municipality must announce its intent to organize collection at least 90 days before proposing an organized collection system, via a resolution of intent.
b. The resolution of intent must be preceded by a public hearing which must be held
two weeks after public notice and mailed notice to all licensed haulers. c. Upon request, the city must provide mailed notice of all subsequent organized
collection proceedings. d. During the 90+ day period after adoption of the resolution of intent, the city must
develop or supervise development of possible organized collection plans or

- 5 -
proposals. The city may invite and employ assistance of interested persons (including haulers) in developing these plans and proposals. [The St. Paul hauler group has already submitted a draft proposal.]
e. Organized collection systems must not impair preservation and development of
recycling and recycling markets, and may exempt recycling materials from the organized collection system.
f. Mixed solid waste collected by the organized collection system must comply with
the county designation ordinance (i.e. in Ramsey County mixed waste must go to Newport).
3. The statute also authorizes counties to require cities to organize collection, and permits counties to organize collection for a city that does not comply with a county organized collection requirement. Assuming the "Champlin amendment" is upheld in the courts or, if not, that the Legislature passes new legislation, Public Works has stated in its response to the Task Force Report that we will proceed with development of an organized collection system as outlined in 2.d. and e. above, as soon as the City Council passes a resolution of intent and holds the required public hearing. Mandatory refuse collection is one of the most controversial issues in the Task Force report, because it involves as many as 10,000 households which do not now pay for refuse collection, and would therefore be the most expensive item for these citizens and/or the City under a mandatory organized collection system. Whichever organized system might be adopted, Public Works will have higher costs under organized collection for managing and supervising the solid waste system, and the city possibly could incur additional costs due to liability and city billing (if adopted). Public Works will have to assign staff to conduct negotiations and acquire new staff for regular, ongoing supervision and monitoring of an organized system. This was pointed out during the 1989 budget process. Also, the City Attorney will have to assign staff during the negotiation phase. Some cities gain overall cost advantages from city billing (e.g. where waste charges can be included with existing municipal water or sewer bills), but it is unclear whether city billing would be an advantage in Saint Paul.

Saint Paul Refuse, Inc. Proposal Saint Paul Refuse, Inc. (SPRI) is a consortium of approximately forty independent haulers who presently provide residential hauling services in the City of St. Paul. SPRI is pleased to submit this proposal for the development and implementation of organized collection in St. Paul. The attached proposal is submitted in response to your November 9, 1989 request. SPRI supports the recommendations and findings of both the St. Paul Elder Council and the St. Paul Citizen's Solid Waste Task Force that the City of St. Paul implement an organized collection system. As noted by the Task Force in its' February 1989 report to the City Council, organized collection has the following advantages: 1. Orqanized collection is more efficient than open haulinq. Organized collection can provide haulers with increased efficiency in terms of lower maintenance costs, increased productivity, less fuel consumption and less vehicle pollution. 2. Orqanized collection will promote achievinq abatement qoals better than open haulinq. The simultaneous implementation of organized collection and volume based fees will encourage residents to increase their participation in recycling activities in the City of St. Paul. 3. Orqanized collection will reduce the number of trucks on a qiven street or alley thus producinq savinqs on city street maintenance costs. In some parts of St. Paul today, there are six or more refuse haulers serving a single city block. Organized collection will decrease truck traffic by assigning specific hauling districts to individual haulers. This district concept will reduce noise, pollution and wear and tear on city streets. 4. Compared to open haulinq orqanized collection will reduce liter illegal dumping summary abatements. In addition to the advantages of organized collection noted by the Elder Council and Citizens Solid Waste Task Force, SPRI ' s proposal offers the City efficiency and flexibility in implementing organized collection in St. Paul. SPRI members presently serve St. Paul residents and are knowledgeable about residents' waste collection needs. SPRI provides a central point of contact for customer or city concerns associated with waste collection in St. Paul. As noted in our proposal, SPRI believes the best way to implement organized collection is through a negotiated contract between the City of St. Paul and SPRI. A negotiated contract provides an excellent vehicle for addressing, in detail, each of the issues raised in our proposal for organized collection. SPRI is ready and willing to assist the City in any fashion as it further explores organized collection. SPRI representatives are willing to appear at community meetings to explain organized collection and assist in educating St. Paul residents about changes in the city waste collection process.

Please contact Mr. Michael Hinz or any member of the SPRI board to further discuss our proposal. We look forward to hearing from you and working with the City of St. Paul. Introduction St Paul Refuse, Inc ("SPRI") is a consortium of approximately forty independent refuse haulers who presently provide residential refuse hauling services in the City of St. Paul. A list of the Board of Directors of SPRI is attached as Appendix A. SPRI offers this proposal for the discussion, development and implementation of organized collection for residential units in the City of St. Paul. This proposal very briefly lists the topics of and procedures to be addressed more completely in a negotiated contract to implement organized collection. SPRI believes that a long term negotiated contract between the City of St. Paul and SPRI offers the best method for implementing organized collection in the City. A negotiated contract would be developed by a team of representatives from the City and SPRI and would address, in detail, each of the subjects listed below. Collection and Haulinq Services SPRI will supply all equipment, labor and materials necessary to make complete collection of all refuse and yard waste from all St. Paul residential dwelling units. The City will be divided into geographic zones or hauling districts. All residential dwelling units within a hauling district will be serviced by a single vehicle for refuse and a single vehicle for yard waste. Collection within a hauling district will take place on a specified, assigned day. This specified hauling district date will reduce wear and tear on City streets and alleys and reduce neighborhood congestion and noise associated with multiple haulers and hauling dates in a single neighborhood. SPRI will work to enhance and promote existing recycling programs in the City of St. Paul. SPRI's implementation of volume based waste collection fees will encourage residents to increase their recycling efforts. Yard Waste Collection Yard waste collection services will be available to all St. Paul residents. Yard waste will be collected separately from refuse on a designated collection date. Yard waste will be collected more frequently during the summer growing season. Volume Based Pricing The charges for refuse and yard waste collection will be based on the volume of waste generated by each household. These volume based rates will encourage residents to recycle and recognize that St. Paul residents have varying refuse collection needs. Residents will pay only for waste collected. Special consideration and lower rates will be given to low volume waste generators such as elderly St. Paul residents.
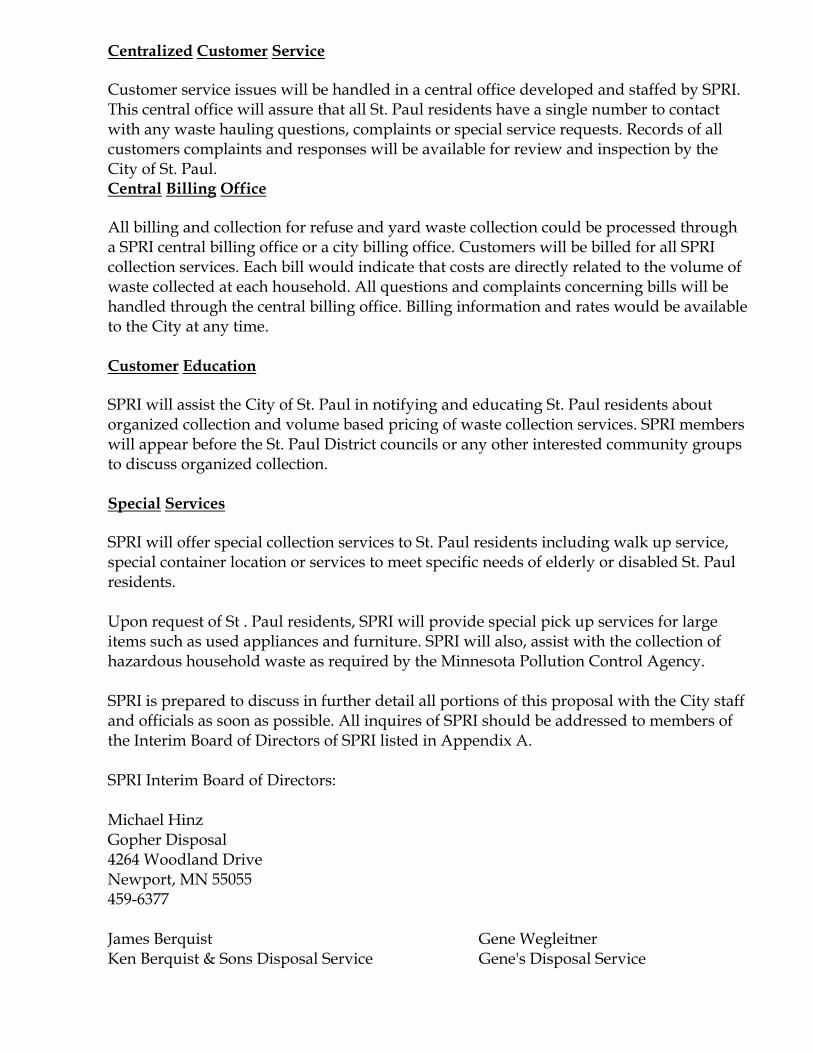
Centralized Customer Service Customer service issues will be handled in a central office developed and staffed by SPRI. This central office will assure that all St. Paul residents have a single number to contact with any waste hauling questions, complaints or special service requests. Records of all customers complaints and responses will be available for review and inspection by the City of St. Paul. Central Billing Office All billing and collection for refuse and yard waste collection could be processed through a SPRI central billing office or a city billing office. Customers will be billed for all SPRI collection services. Each bill would indicate that costs are directly related to the volume of waste collected at each household. All questions and complaints concerning bills will be handled through the central billing office. Billing information and rates would be available to the City at any time. Customer Education SPRI will assist the City of St. Paul in notifying and educating St. Paul residents about organized collection and volume based pricing of waste collection services. SPRI members will appear before the St. Paul District councils or any other interested community groups to discuss organized collection. Special Services SPRI will offer special collection services to St. Paul residents including walk up service, special container location or services to meet specific needs of elderly or disabled St. Paul residents. Upon request of St . Paul residents, SPRI will provide special pick up services for large items such as used appliances and furniture. SPRI will also, assist with the collection of hazardous household waste as required by the Minnesota Pollution Control Agency. SPRI is prepared to discuss in further detail all portions of this proposal with the City staff and officials as soon as possible. All inquires of SPRI should be addressed to members of the Interim Board of Directors of SPRI listed in Appendix A. SPRI Interim Board of Directors: Michael Hinz Gopher Disposal 4264 Woodland Drive Newport, MN 55055 459-6377 James Berquist Gene Wegleitner Ken Berquist & Sons Disposal Service Gene's Disposal Service

8579 Bower Court 6808 117th Avenue Inver Grove Heights, MN 55075 White Bear Lake, MN 55110 699-2442 426-1224 J. John Wynne, III James Cashill Wynnes Rubbish Removal 668 Victoria Street South 746 Hyacinth Avenue East Saint Paul, MN 55102 Saint Paul, MN 55106 738-3053
774-8386

TABLE OF CONTENTS Page 1. Term 1 1.1. Five Year 1 1.2. Renewal 1 2. General Description of Services 1 2.1. Services 1 2.2. Route 1 3. Definitions 2 3.1. Collection Service 2 3.2. Container 2 3.3. Day-Certain Collection 2 3.4. Compost 2 3.5. Garbage 2 3.6. Independent Contractor 2 3.7. Price 2 3.8. Recyclables 2 3.9. Refuse 2 3.10. Residential Dwelling Unit 3 3.11. Rubbish 3 3.12. Toxic and Hazardous Wastes 3 3.13. Waste Materials 3 3.14. White Goods 3 4. Basic Collection Service 3 4.1. Service 3 4.2. Exclusions 4 4.3. Container 4 4.4. Frequency 4 4.5. Supply Necessary Items 4 4.6. No Claims 4 4.7. Indemnification 5 5. Additional Collection Service 5 5.1. Description 5 5.2. Location 5 5.3. Frequency 5

6. City Undertakings 5 6.1. License Limits 5 6.2. Ordinances 5 6.3. Name and Address Lists 6 6.4. New Residence 6 6.5. Weight Permits 6 7. Service Schedule 6 7.1. Hours 6 7.2. Collection Days 6 7.3. Holidays 7 7.4. Street Improvements 7 8. Administration 7 8.1. Offices 7 8.2. Complaint Logs 7 8.4. Billing 7 8.5.Change in Ownership 7 9. Fees 8 9.1. Basic Collection Service 8 9.2. CPI Revisions 8 9.3. Taxes and Other Charges 8 9.4. Additional Collection Services 8 10. Liability Insurance 9 11. Worker's Compensation Insurance 9 12. Equipment 9 12.1. Vehicle Protection 9 12.2. Cleaning 9 12.3. Painting 9 12.4. Maintenance 9 - ii -
Page 13. Personnel Requirements 10 13.1. Responsibility 10 13.2. Driver 10 13.3. Collector 10 14. Supervision 11 15. Title 11 16. Subletting or Assignment of Contract 11 17. Non-Discrimination 11 18. Health Regulations and Ordinances 11 19. Dispute Resolution 11 20. Governing Law 11 21. Notice 12 22 . Severability 12 23. Termination 12 24 . Performance Assurance 12 25. Independent Contractor 12 26. Entire Agreement 12 EXHIBIT A -- List of Holidays EXHIBIT B -- Route Map EXHIBIT C -- Pricing EXHIBIT D -- Operating Costs

- iii - SAINT PAUL REFUSE SERVICE CONTRACT THIS CONTRACT, made and entered into this_____day of, ___________ 1989, by and between the CITY OF SAINT PAUL, a municipal corporation in the county of Washington, herein referred to as "City," and SAINT PAUL REFUSE, INC., a Minnesota Cooperative, herein referred to as "SPRI." R E C I T A L S : WHEREAS, City requires the collection and disposal of garbage and rubbish, compost, and recyclables (collectively hereafter identified as "Waste Materials") from residences in the city of Saint Paul; WHEREAS, SPRI is engaged in the business of collecting and disposing Waste Materials; and WHEREAS, the City desires to hire the services of SPRI and SPRI desires to provide the services to the City; NOW, THEREFORE, it is agreed by and between the parties: 1. Term. 1. 1. Five Years. Subject to Paragraph 1.2 hereafter, this Contract shall be in full force and effect for the period beginning , __________ 19_____ and ending ___________, 19______. 1 .2. Renewal. At the conclusion of this period, it is expected that the parties will wish to renew this Contract for additional five (5) year terms. Negotiation for said renewal shall begin six (6) months prior to the end of the term set forth in Paragraph 1.1. 2. General Description of Services. 2. 1. Services. SPRI shall supply all labor, materials, and equipment necessary to make a complete collection of Refuse from all Residential Dwelling Units as defined hereinafter in the City of Saint Paul at least once in each calendar week during the term of this Contract and convey the waste Materials to a Minnesota Pollution Control Agency approved disposal facility. 2. 2. Route. Collection service shall be provided over the agreed-upon routes shown on Exhibit B hereto. These routes are designed to provide an efficient system and to minimize multiple vehicle movement along city streets.

3. Definitions. For purposes of this Contract, the following terms shall have the following meanings: 3. 1. Collection Service. Collection Service is a private operation engaged in collection and transportation of Waste Materials. 3. 2. Container. Container means the can or cart or bin in which Refuse are placed by residents. 3. 3. Day-Certain Collection. Day-Certain Collection is a city-approved plan for weekly Collection Services by an established day-certain schedule. This schedule requires that a route must be collected on the same day of each week and is based on a five (5) day, Monday through Friday, working week. The only exceptions to the "day-certain" plan shall be during those weeks in which occur legal holidays. 3. 4. Compost. Compost includes grass clippings and leaves, and specifically excludes brush and limbs, Recyclables, and Refuse. 3. 5. Garbage. Garbage is organic waste, including discarded material resulting from the handling, processing, storage, preparation, serving and consumption 3. 6. Independent Contractor. Independent Contractor means person or persons authorized by SPRI to perform refuse collection services on a prescribed route within the City of Saint Paul. 3. 7. Price. All costs of service. 3. 8. Recyclables. Recyclables are reusable or reprocessable materials approved and agreed to by the parties hereto. Recyclables may include such items as newsprint, ledger paper, tin cans, aluminum, used motor oil, glass and other metal goods and other materials if markets develop. Recyclables specifically exclude Refuse and Compost. 3. 9. Refuse. Refuse is putrescible and nonputrescible solid waste from Residential Dwelling Units including Garbage and Rubbish, and specifically excluding Compost, Recyclables, and Toxic and Hazardous Wastes. Refuse further excludes industrial, commercial, agricultural, and construction garbage or rubbish and wastes. 3. 10. Residential Dwelling Unit. A Residential Dwelling Unit is any habitable room or rooms located within a single building of four units or less used as

a habitable unit with facilities which are used or intended to be used for living, sleeping, cooking, and eating. 3. 11 Rubbish. Rubbish is inorganic solid waste, including ashes, consisting of both combustible and noncombustible wastes, such as wood, bedding, crockery, and other nonreuseable waste. Rubbish also includes nonrecyclable types of glass, paper, cardboard, and metal cans. 3. 12. Toxic and Hazardous Wastes. Toxic and hazardous wastes are waste materials including but not limited to poisons, pesticides, herbicides, acids, caustics, pathological wastes, radioactive materials, flammable or explosive materials, and similar harmful chemicals and wastes which require special handling and must be disposed of in a manner to conserve the environment and protect the public health and safety. 3. 13 Waste Materials. Waste Materials are collectively the items described in definitions 3.5, 3.7, 3.8 and 3.10 herein. 3. 14 White Goods. Large household items including refrigerators, stoves, dishwashers, washers and dryers, water heaters, carpeting and padding, mattresses, chairs, couches, tables, and other such items of furniture. 4. Basic Collection Service. 4. 1. Service. Basic Collection Service shall include the curbside or alley collection of Refuse for Residential Dwelling Units. To assure Day-Certain Collection and a designation Collection Service, SPRI will provide a means for call-back service on any Residential Dwelling Unit missed on the scheduled day of collection. This call-back service will be performed by SPRI within twenty-four (24) hours (excluding Saturdays, Sundays, and holidays) after SPRI has received notice that a Residential Dwelling Unit has been missed. 4.1.1 If materials are improperly prepared for collection at a Residential Dwelling Unit, Independent Contractor shall collect if possible and leave a written indication to the generator describing the problem. In the event that materials are thereafter improperly prepared by 'that same generator, Independent Contractor may avoid collection and give notice to the City that the generator has failed to prepare materials correctly. 4. 2. Exclusions. Basic Collection Service shall not include the collection of: 4.2.1. Recyclables.

4.2.2. Toxic, Hazardous Wastes and paint in liquid form.. 4.2.3. Items on Exhibit C hereto. 4.2.4. Animal waste and solid waste materials resulting from industrial, commercial and agricultural operations, and from community activities. 4.2.5. Earthen fill, boulders, rock and other materials normally handled in construction operations, solids or dissolved material in domestic sewage or other significant pollutants in waste resources, such as silt, dissolved or suspended solids in industrial waste water effluents, dissolved materials in irrigation return flows; or other common water pollutants. 4. 3. Containers. Collection shall be from approved Refuse containers with a maximum 33 gallon capacity and 40 pound weight per Residential Dwelling Unit. 4. 4. Frequency. Each Residential Dwelling Unit shall have its Refuse collected once per week. 4. 5. Supply Necessary Items. SPRI shall supply all labor, material, and equipment necessary for the carrying out of this Contract. No Claims. SPRI agrees to pay all persons doing work or furnishing skill, 4. 6. tools, machinery, or materials or insurance premiums or equipment or supplies and all just claims for such work, material, equipment insurance, and supplies in and about the performance of this Contract. 4. 7. Indemnification. SPRI further agrees to take all precautions to protect the public against injury and shall save the City harmless 'from all damages and claims of damages that may arise by reason of any negligence of SPRI or SPRI's agents, or employees which engaged in the performance of this Contract, and will indemnify the City against all claims, liens, expenses, and claims for liens, for work, tools, machinery, materials, or insurance premiums
or equipment or supplies, and against all loss by reason of the failure of SPRI in any respect to fully perform all obligations of this Contract.
5. Additional Collection Service. 5. 1. Description. Additional Collection Service shall include (i) the collection of additional items listed on Exhibit C hereto. 5. 2. Location. Residential Dwelling Units, unless Additional Service has been requested by the resident owner, shall have their Additional Items located at designated point of collection.
5. 3. Frequency. Additional Items shall be collected from Residential Dwelling Units upon request by the resident, made to SPRI. 6. City Undertakings . 6. 1. License Limits. The City shall limit Residential Dwelling Unit Refuse and Recycling collection to members of SPRI. 6.2 Ordinances. The City shall adopt appropriate ordinances to allow SPRI to complete its obligation under this contract, including: 6.2.1. Ordinance allowing organized solid waste collection to be negotiated with SPRI. 6.2.2. Ordinance permitting curbside or alley pickup of all solid waste 6.2.3. Ordinance requiring alley addresses for all Residential Dwelling Units. 6.2.4. An ordinance mandating that every residence receive and pay for refuse collection service. Guaranteed certification shall be assured through City tax rolls. An annual submittal of uncollectible debts shall be furnished to the City for certification on or before September 1, of each year. 6.2.5. An ordinance preventing SPRI from collecting Refuse which contains any Recyclables. 6. 3. Name and Address List. The City shall provide SPRI with a complete list of resident names and addresses for purposes of billing, and on the fifteenth day of each month during the term of this Contract, the City shall provide SPRI with a name and address list containing all new residents. 6. 4. New Residents. The City shall provide new residents of the City with the proper information for contacting SPRI in order to establish Basic Collection Service. 6. 5. Weight Permits. The City shall provide SPRI with weight permit during months of year that weight restrictions apply. 7. Service Schedule. 7. 1. Hours. SPRI shall perform all Collection Services between the hours of 6:30 a.m. and 6:00 p.m., on Monday through Friday, except when an emergency shall exist, at which time WRI shall notify the City of such emergency. WRI may perform collection services on Saturday when a holiday falls on a weekday.
7.2. Collection Days. SPRI shall provide Day-Certain Collection. Unless otherwise agreed to by the parties hereto, Collection Services will be on Monday, Tuesday, Wednesday, Thursday and Friday. Prior to_________ , 19_____, SPRI will notify each resident of the day of Collection Service. 7.2.1 SPRI may request a change in the day of pickup by requesting such change in writing to the City at least thirty (30) days from the proposed date the requested change is to take effect. A change shall be effected only upon authorization from the City and fourteen (14) day notice to the resident. 7.2.2. SPRI shall bear all costs involved in notifying residents of approved schedule changes. 7. 3. Holidays. SPRI will observe all legal holidays, described on Exhibit A hereto, ,on which their offices and operations will be closed. When holidays fall on a weekday, the collection for each day of that week after the holiday shall be made one (l) working day later. 7. 4. Street Improvements. The City reserves the right to improve any street or alley which may prevent SPRI from traveling its accustomed route or routes for collection. 8. Administration. 8 . 1. Offices. SPRI shall maintain an of f ice equipped with telephones and staffed with sufficient personnel to handle complaints, orders for special service, and/or to receive instructions. 8.1.1. The office shall be staffed from 7:30 a.m. to 4:00 p.m., Monday through Friday (except holidays). 8. 2. Complaint Logs. SPRI shall maintain a monthly written log of all complaints, the date thereof and the action taken pursuant thereto or the reason for non-action. A copy of each monthly log shall be provided to the City Administrator upon request. 8. 3. Records. SPRI shall keep complete and accurate records in accordance with generally accepted accounting practices and shall make available for inspection by the City any and all of such records upon request by the City. 8. 4. Billing. SPRI shall bill and collect monies due from residents for Collection Service. 8. 5. Change in Ownership. SPRI shall provide notice to the City of any change of stock ownership of SPRI and SPRI shall provide the City with an affirmative undertaking regarding this Contract by the buyer of the SPRI stock.
9. Fees. 9. 1. Basic Collection Service. SPRI shall charge prices for Basic Collection Service according to the schedule on Exhibit C hereto. 9.1.1. Each customer shall select a desired service level and may change level of service upon payment of an administrative charge as shown in Exhibit . There shall be no charge for any changes of service occurring during the first six (6) months of the term of this Contract. 9. 2. CPI Revisions. The Price shall be subject to automatic revision effective the first day of September of each year, being increased or decreased by the annualized rate of change in Price Index, during the eleven (11) month period next preceding the first day of September each year of this Contract. The Price established after each such automatic revision shall be the price on which the next subsequent revision shall be based. 9. 3. Taxes and Other Charges. The parties further agree that the prices stated herein shall be automatically adjusted for all changes of disposal (or tipping) fees and all existing and subsequently imposed federal, state, local, or other governmental agency excise taxes, sales taxes, surcharges, abatement fees or other charges imposed on the Basic Collection Service provided herein or the disposal costs of SPRI during the term of this Contract or any renewal term thereof. 9. 4. Additional Collection Services. Charges for pickup of Additional Items and for Additional Service shall be made directly to the resident owner by SPRI or the hauler at the prices stated in Exhibit C hereto. Said prices shall be subject to change from time to time by SPRI based on changes in Disposal Fees; provided that SPRI shall notify the City in writing of any changes under this Paragraph 10.4. 9. 5. Disposal Fees. The Price contemplates that SPRI will pay all disposal fees for Basic Collection Service. If the City begins paying disposal fees directly to the landfill, the Residential Dwelling Unit Price shall be reduced accordingly. 10. Liability Insurance. SPRI shall perform under this Contract in a clean, neat manner and shall operate such trucks and motor vehicles as are reasonably necessary and suitable to the rendering of such services and shall keep the same insured with a minimum public liability insurance of $300,000 for any one person; $600,000 for any one accident; $50,000 for property damage, together with Contractor's public liability insurance of $300,000 for any one person, $600,000 for any one accident; and property damage of $50,000. Certificates of Insurance shall be provided to the City by WRI or haulers upon request of the City. 11. Worker's Compensation Insurance. SPRI shall at all times keep fully insured, at its own expense, all persons employed by it in connection with the performance of this

Contract as required by the laws of the State of Minnesota relating to Workers' Compensation Insurance and shall hold the City free and harmless from all liability from any cause that may arise by reason of injuries to any employee of the Contractor who may be injured while performing work or labor performed to carry out the provisions of the Contract. 12. Equipment. SPRI shall provide necessary collection equipment including back-up vehicles to cover breakdowns or missed stops. 12.1. Vehicle Protection. All trucks or motor vehicles used by SPRI shall be covered to prevent the scattering of its contents upon the public streets or private properties in the City. Should any garbage be dropped or spilled in collecting or transporting, it shall be immediately cleaned up. 12.2. Cleaning. All vehicles shall be kept in a clean and sanitary condition. 12.3. Painting. The packer body shall be painted and numbered, and shall have the hauler's name and telephone number painted in letters of a contrasting color, at lease three inches (3") high, on each side of the vehicle and the number painted or decayed on the rear. 12.4. Maintenance. The trucks shall be maintained in good working order. They shall be equipped to meet all federal, state, and municipal regulations concerning vehicles used on public roads and maintained to meet these standards. 13. Personnel Requirements. 13.1. Responsibility. 13.1.1. There shall be no limitation on the size of the hauler's collection crew, so long as they are sufficient to fulfill the requirements of the specifications and contract. 13.1.2. Each collection crew shall adhere to all applicable Ordinances of the City of Saint Paul and all of those rules, regulations, and conditions for Refuse collection as established by the City Administrator. 13.2. Driver. 13.2.1. The driver must have a valid Minnesota Chauffeur's License. 13.2.2. The driver must obey all traffic laws. 13.3. Collector. 13.3.1. The driver and collector(s) shall at all times have a courteous attitude toward the general public.

13.3.2. The driver and collector(s) shall be of sound character, competent, and sober throughout the entire work day. 13.3.3. The driver and collector(s) shall have the ability to remember the order of collection and location of all containers on the assigned routes. 13.3.4. The driver and collector(s) shall make a concerted effort to have at all times a presentable appearance. 13.3.5. The members of each crew shall be physically able to perform their duties and at least eighteen (18) years old except as otherwise provided by the laws of the State of Minnesota. 13.3.6. SPRI shall perform its work in a neat and a quiet manner and clean up all Refuse Compost spilled in collection under any circumstance. 13.3.7. Damage to containers or other property shall be avoided. 13.3.8. Consumption of any beverages containing alcohol or use of prohibited substances shall be forbidden during or before work hours of any collection day. 13.3.9. Before the start of each collection day, the collection crew shall check to see that the collection vehicle is equipped with at least one broom and shovel for use in cleaning up Refuse or Compost. 14. Supervision. All services to be performed for the City by SPRI pursuant to the terms of this Contract shall be supervised by such employee, agent, or officer of the City. 15. Title. Title to all collected Waste Materials shall remain vested in SPRI until all said materials are delivered to a proper disposal facility. 16. Subletting or Assignment of Contract. No assignment or sublettinq of this Contract, all or in part, will be permitted without authorization of City. SPRI alone will be held responsible for full and faithful performance of this Contract. 17. Non-Discrimination. SPRI agrees that, during the life of this Contract, SPRI will not, within the State of Minnesota, discriminate against any employee or applicant for employment because of race, color, creed, sex, national origin, or ancestry, and will include a similar provision in all subcontracts entered into for the performance thereof. 18. Health Regulations and Ordinances. The Contractor shall acquaint itself with all pertinent City Ordinances and shall comply with all health regulations and Ordinances of the City of Woodbury, County of Washington, and the State of Minnesota in effect at this time or hereafter adopted.
19. Dispute Resolution 20. Governing Law. This Contract is governed in all respects by the laws of the State of Minnesota, and all obligations are enforceable in accordance therewith; and SPRI, where required, must obtain all licences or permits to transact a Refuse collection business in the City. 21. Notice. Except as otherwise herein provided, all notices required to be served by either party on the other shall be in writing and forwarded by certified mail to the principal office of the party to which notice is given as follows: To the City of Saint Paul: To SPRI: Saint Paul Refuse, Inc. (address) _______________________ With a copy to: John A. Cairns Briggs and Morgan, P.A. 2400 IDS Center Minneapolis, Minnesota 55402 All such notices shall be effective when received. 22. Severability. All parts and provisions of this Contract are severable. If any part or provision shall be held invalid, the remainder of this Contract shall remain in effect. 23. Performance Assurance. In a manner acceptable to the City, SPRI shall provide cash or equivalent surety in an amount to be negotiated in the event SPRI is unable for whatever reason to perform its obligations hereunder. 24. Independent Contractor. SPRI is declared to be an independent contractor, and nothing in this Contract shall be construed to create the relationship of employer and employee between the City and SPRI or its agents, or make SPRI, its agents, or employees, subject to City Civil Service rules. 25. Entire Agreement. This Contract, along with attachments and exhibits hereto which are incorporated herein by reference, is the entire agreement between the parties. No modification of this Contract shall be valid or effective, unless made in writing and signed by the parties hereto.

IN WITNESS WHEREOF, the parties hereto have set their hands on this____ day of____________, 1989. IN THE PRESENCE OF: CITY OF SAINT PAUL, A MUNICIPAL CORPORATION __________________________ By: ___________________________ Mayor ___________________________ By: ___________________________ City Administrator Approved as to Form: ___________________________ City Attorney SAINT PAUL REFUSE, INC. By:____________________________ ____________: ______________________________ Secretary H145

EXHIBIT A LIST OF HOLIDAYS 1. New Year's Day (January l) 2. Memorial Day 3. Independence Day (July 4) 4. Labor Day 5. Thanksgiving Day 6. Christmas Day (December 25)

EXHIBIT B ROUTE MAP (To Be Provided)

EXHIBIT C PRICING A) Basic Collection Service: One container (not to exceed $ /Mo./Residential 33 gallons in capacity) Dwelling Unit Two containers or 60 gallons $ /Mo./Residential Dwelling Unit Three containers or 90 gallons $ /Mo./Residential Dwelling Unit B) Change of Service Charge: First change - (For number of changes during Subsequent - C) Property owners who have more trash than the limit they have subscribed to may leave extra containers one time only at a cost of $__________ per extra container, such charge being added to the next monthly bill. D) Property owners may request service by SPRI for special collection. A service charge of $__________ will be assessed in addition to the charges set forth n Paragraph F. E) Additional Services 1. Compost/Yard Waste 2. Walk-up Service 3. Clothes washer 4. Clothes dryer 5. Refrigerator 6. Freezer 7. Dishwasher 8. Carpet - 12X12 Room* 9. Carpet pad - 12X12 Room* 10. Tires - Auto Auto with Rim Truck Truck with Rim 11. Mattresses - King or Queen* Double*

Single* 12. Box spring - King or Queen Double Single 13. Sofa 14. Love seat 15. Overstuffed chair 16. Kitchen chairs or armchair 17. Remodeling materials Weight dependent _____ per 100 lbs. 18. Items such as batteries, tires, construction material and motor oils. 19. Water heater 20. Stove 21. Brush (in bundles less than _____ per bundle 4 feet in length and 2 feet in diameter) (Prices subject to change as set by resource recovery plant) ____________________ * All carpets and mattresses dry. EXHIBIT D OPERATING COSTS Refuse Collection Costs Recyclable Collection Costs Office Costs Total Operating Costs
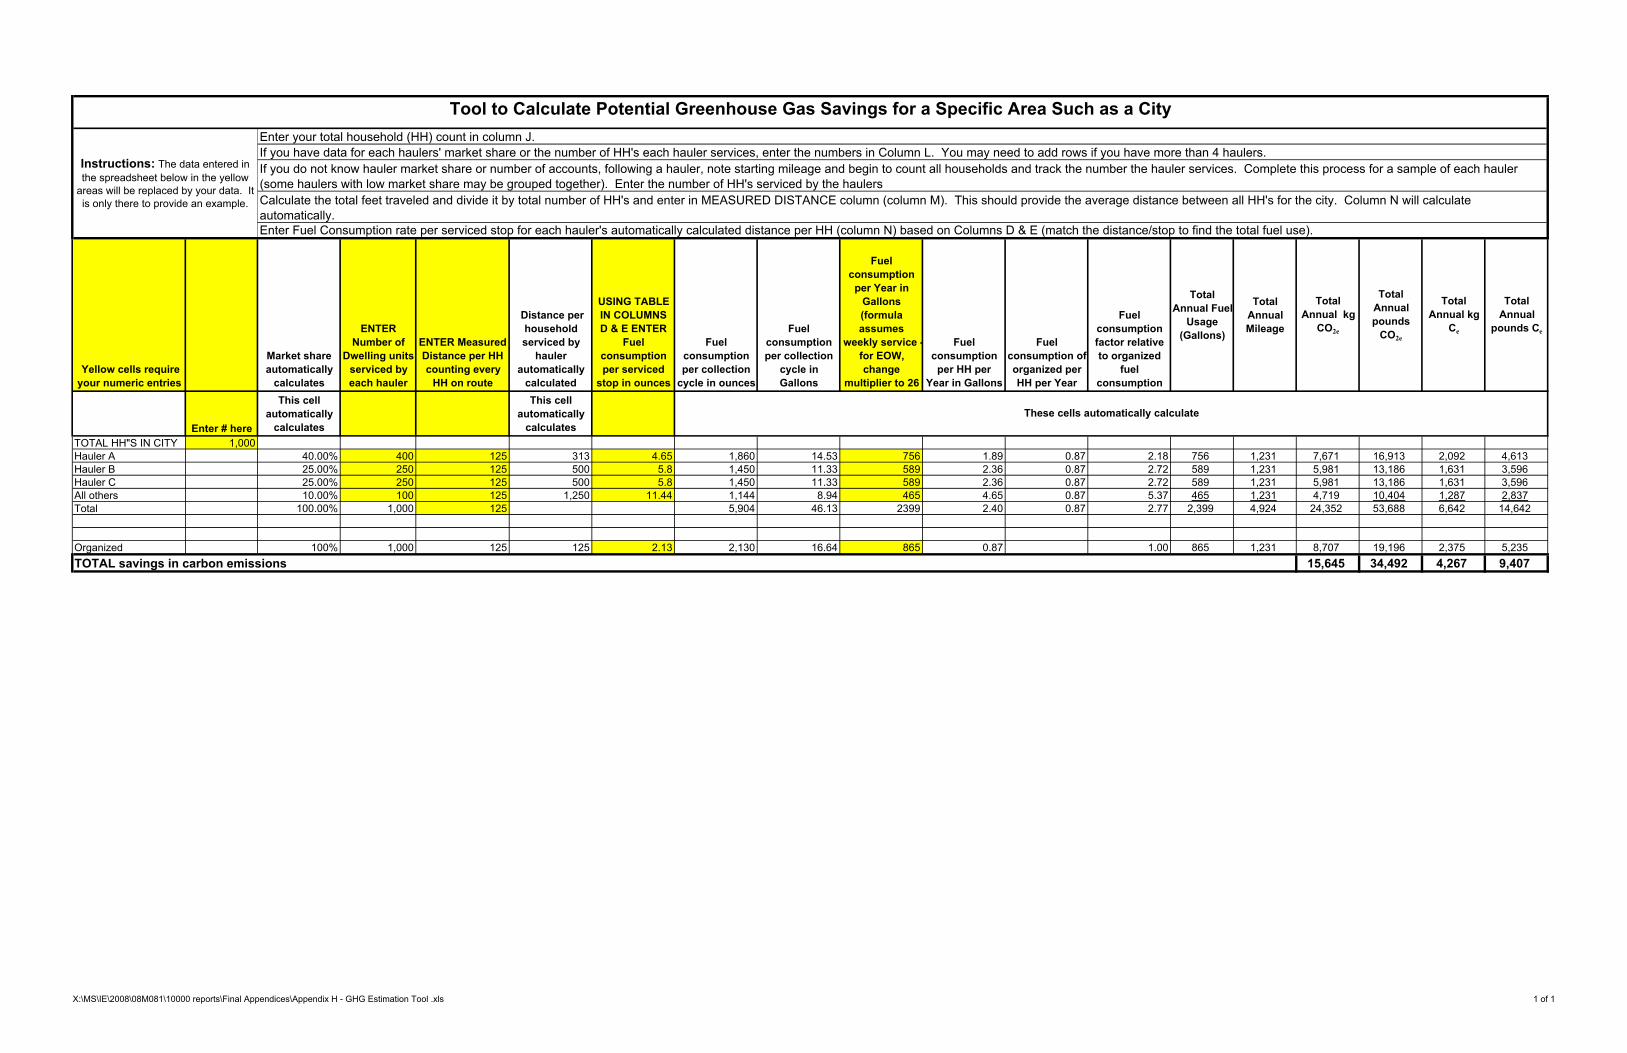
Yellow cells require
your numeric entries
Market share
automatically
calculates
ENTER
Number of
Dwelling units
serviced by
each hauler
ENTER Measured
Distance per HH
counting every
HH on route
Distance per
household
serviced by
hauler
automatically
calculated
USING TABLE
IN COLUMNS
D & E ENTER
Fuel
consumption
per serviced
stop in ounces
Fuel
consumption
per collection
cycle in ounces
Fuel
consumption
per collection
cycle in
Gallons
Fuel
consumption
per Year in
Gallons
(formula
assumes
weekly service -
for EOW,
change
multiplier to 26
Fuel
consumption
per HH per
Year in Gallons
Fuel
consumption of
organized per
HH per Year
Fuel
consumption
factor relative
to organized
fuel
consumption
Total
Annual Fuel
Usage
(Gallons)
Total
Annual
Mileage
Total
Annual kg
CO2e
Total
Annual
pounds
CO2e
Total
Annual kg
Ce
Total
Annual
pounds Ce
Enter # here
This cell
automatically
calculates
This cell
automatically
calculates
TOTAL HH"S IN CITY 1,000
Hauler A 40.00% 400 125 313 4.65 1,860 14.53 756 1.89 0.87 2.18 756 1,231 7,671 16,913 2,092 4,613
Hauler B 25.00% 250 125 500 5.8 1,450 11.33 589 2.36 0.87 2.72 589 1,231 5,981 13,186 1,631 3,596
Hauler C 25.00% 250 125 500 5.8 1,450 11.33 589 2.36 0.87 2.72 589 1,231 5,981 13,186 1,631 3,596
All others 10.00% 100 125 1,250 11.44 1,144 8.94 465 4.65 0.87 5.37 465 1,231 4,719 10,404 1,287 2,837
Total 100.00% 1,000 125 5,904 46.13 2399 2.40 0.87 2.77 2,399 4,924 24,352 53,688 6,642 14,642
Organized 100% 1,000 125 125 2.13 2,130 16.64 865 0.87 1.00 865 1,231 8,707 19,196 2,375 5,235
15,645 34,492 4,267 9,407
These cells automatically calculate
TOTAL savings in carbon emissions
Tool to Calculate Potential Greenhouse Gas Savings for a Specific Area Such as a City
Instructions: The data entered in the spreadsheet below in the yellow
areas will be replaced by your data. It
is only there to provide an example.
If you do not know hauler market share or number of accounts, following a hauler, note starting mileage and begin to count all households and track the number the hauler services. Complete this process for a sample of each hauler
(some haulers with low market share may be grouped together). Enter the number of HH's serviced by the haulers
Calculate the total feet traveled and divide it by total number of HH's and enter in MEASURED DISTANCE column (column M). This should provide the average distance between all HH's for the city. Column N will calculate
automatically.
Enter Fuel Consumption rate per serviced stop for each hauler's automatically calculated distance per HH (column N) based on Columns D & E (match the distance/stop to find the total fuel use).
If you have data for each haulers' market share or the number of HH's each hauler services, enter the numbers in Column L. You may need to add rows if you have more than 4 haulers.
Enter your total household (HH) count in column J.
X:\MS\IE\2008\08M081\10000 reports\Final Appendices\Appendix H - GHG Estimation Tool .xls 1 of 1

X:\MS\IE\2008\08M081\10000 reports\Final Appendices\Appendix I1 - Public Comments.doc 1
May 4, 2009 (E-Mail Comment from Mark Gamm, Dodge County EQ Director)
Hi Jeffrey. Here are my comments from very quick review of Draft Report. Generally like the format and it seems to answer the right questions with a couple of exceptions: 1. Felt like the "Introduction" set-up a good question that was never answered... why is the rest of the country different than Minnesota in that over 70% of the US cities surveyed have organized collection while only 30% of MN cities are organized? Even our likable neighbor, Iowa, has 85% of cities organized. I think a part of the report should address this question. 2. It feels like the vast amount of data presented is lopsided toward larger cities and suburbs of metropolitan area. As a result, smaller cities in greater MN may not find the report very relevant. I believe there are many examples of small cities that have organized collection (in some form) that may have data relevant to other small cities in MN. From my experience, small cities are interested in organizing collection for the same reasons larger cities are but may have different dynamics that could make organizing easier than in larger cities. It seems like this should be addressed somehow in the report. Thanks, Mark

X:\MS\IE\2008\08M081\10000 reports\Final Appendices\Appendix I1 - Public Comments.doc 2
May 4, 2009 (E-Mail and Attachment from Jean Buckley, City of Bloomington Minnesota,
Public Works Project Coordinator)
Getting it to you just under the wire. Thanks for all the work on this long overdue study! Look forward to meeting you at the ARM workshop next month. Jean Buckley City of Bloomington 952-563-8751
Comments on Draft Report of Analyses of Waste Collection Service Arrangements
1. Summary pg 5: The City of Bloomington did hold a Public Hearing to consider organized
collection in 1996. Perhaps NSWMA was not aware of this. It does say we did this in Appendix E, pg 1.
2. Summary pg 6: It is mentioned that obtaining cost of service can be complex but you may
want to mention a few reasons why. For example, residents in Bloomington pay as much as $10/month for recycling. Are you sure recycling was included in the trash costs for the cities that provided rate data? I am told a hauler will often do this to avoid the State tax and County fees. Also fuel charges can vary substantially in different communities and between haulers now. The data is very old (from 2003-2004) before many had fuel charges and the cost of recycling skyrocketed in open systems. There should be more current information on this. Oops, I just noted fuel charges mentioned on p12. I think it should be moved up to the discussion on rates and not after the Minneapolis summary.
3. Summary pg12: I am not sure about other contracted cities but in Minneapolis there is no
limit to what can be set at the curb. This is important to note since many rates show 90 gallon as the top rate paid when actually there is not a limit on set out if you have the largest cart size. In Minneapolis you can use free vouchers to take construction items to the transfer station. In Bloomington, you can avoid the extra bulk pickup cost by saving it for the city-wide curbside clean up. This program costs the City approximately $500,000/yr and each resident pays an extra $20/yr for it which could be added to their cost of trash service. So maybe note that 90 gallon is not the limit in all cases.
4. Summary pg 14: I have recently received customer counts from haulers and found that
approximately 25% of our residents DO NOT have trash service. This can be a large cost to a city and businesses community from the amount of illegal dumping that takes place when people don’t have trash service. I think this piece should be mentioned in your report. It also greatly impacts the recycling numbers. If a city is missing the recyclables from 25% of their residents then their numbers will be down in comparison to an organized collection of recyclables.

X:\MS\IE\2008\08M081\10000 reports\Final Appendices\Appendix I1 - Public Comments.doc 3
5. Summary, pg 15: The section on “Meeting Public Policy Goals” should be at the end so information on GHG, fuel, and budget constraints for infrastructure and road improvements can be included as bullet points.
6. Summary pg 20 and pg 66: In the summary as well as in the report the amount of fuel is
compared for the different collection systems as well as the conversion to GHG. Is there a way to put some perspective on this. For example, MNDOT uses x amount of fuel to plow x amount of miles of street for a snowstorm. Or, another example, x many tons of GHG is equal to that of x cars. That would be helpful information.
7. Pg 3: In the summary accidents or safety is mentioned as a big concern for many
communities when they consider organized collection and sell it to residents. I didn’t find much more of it than just a mention here. Pg 41 says it doesn’t look at it but when people remember stories of kids being killed by a garbage truck it warrants being considered.
8. Pg 4: Add increased illegal dumping in list of disadvantages for an open system. Also
Hazardous waste handling is difficult to manage when people don’t have a hauler (computers, TV…)
9. Pg 6 Table 2-2: Reduced fuel and GHG should be included in list of advantages of
organized collection. Below that you list “the primary potential advantages of organized collection are three-fold-lower prices, reduced truck traffic and community control…” Reduced truck traffic in what way? Wear and tear or safety? I would argue that the advantages are the savings of infrastructure and resources (roads, fuel and money) or expand prices as costs to everyone through taxes to improve roads, illegal dumping, pollution…
10. Pg 96: alley is spelled wrong.
11. Pg 103 Bloomington does neighborhood organizing also with minimal success, primarily
is works best in cul-de-sacs.
12. Pg 109. The report is not supposed to offer conclusions but I think it would be helpful. Is the message from the field trial study that short distances are more fuel efficient? Then say that and why more clearly and put in summary. Also my Equipment Superintendent had never heard of “Puff Arresters” and when we googled there was no good information.
13. Pg 111 Table 4-8 and 4-9: It was difficult to understand what the average observed
distances between services households versus average actual distance between households is and why that is important to measure. At the end of pg114 it says that “having the average distance per household with a corresponding fuel consumption rate per household and the exact number of households serviced, the total fuel use by hauler can be computed.” Please explain more so it is easier to understand.
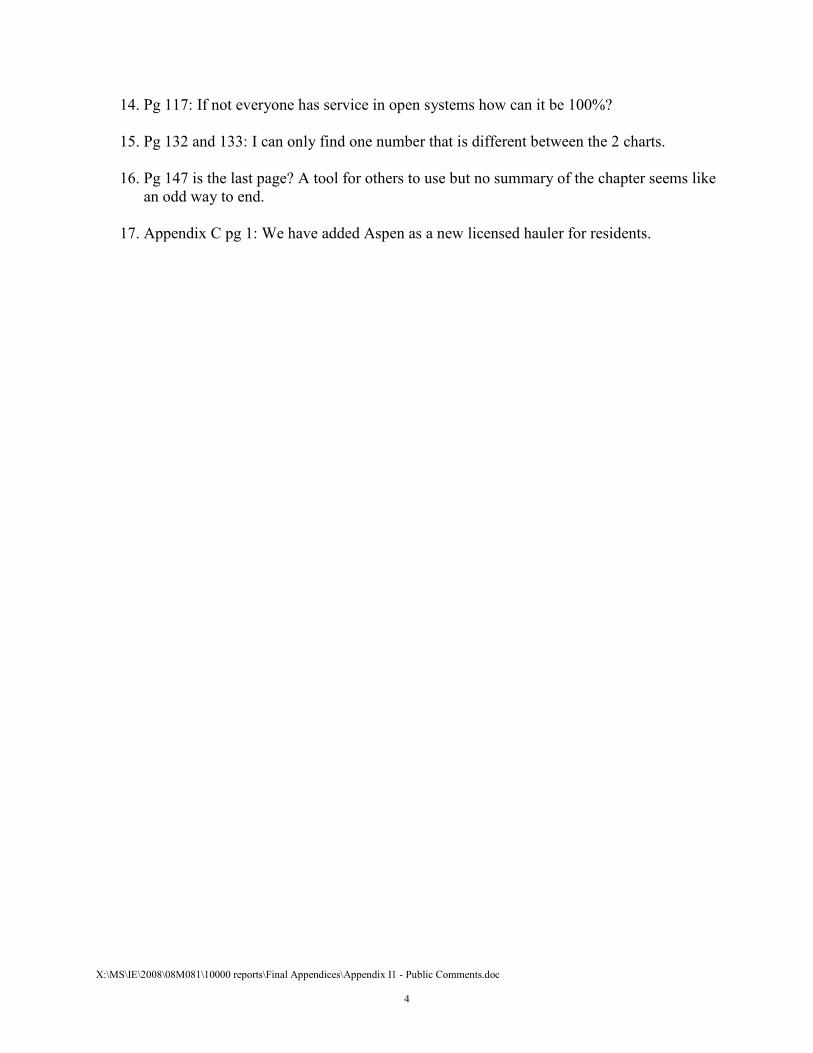
X:\MS\IE\2008\08M081\10000 reports\Final Appendices\Appendix I1 - Public Comments.doc 4
14. Pg 117: If not everyone has service in open systems how can it be 100%?
15. Pg 132 and 133: I can only find one number that is different between the 2 charts.
16. Pg 147 is the last page? A tool for others to use but no summary of the chapter seems like an odd way to end.
17. Appendix C pg 1: We have added Aspen as a new licensed hauler for residents.

X:\MS\IE\2008\08M081\10000 reports\Final Appendices\Appendix I1 - Public Comments.doc 5
May 6, 2009 (E-Mail from Mike Hanan Otter Tail County Solid Waste Director)
Jeff: I have reviewed the organized collection study and I have seen comments by both Mark Gamm and Doug Morris. I think that both Mark and Doug have presented good comments and have asked good questions. I also was struck by the fact that everything within the study seems to indicate that there are both environmental and societal benefits to organized collection in both the metropolitan area as well as in the more rural cities and counties. I would strongly suggest that the MPCA and the state of Minnesota not place this study (and the potential benefits of organized collection) on a shelf somewhere to be forgotten. In Minnesota, we like to believe that we are leaders in the area of environmental protection and in environmental policy. This is likely an area that we are taking a backseat to most of the rest of the country. Mike

X:\MS\IE\2008\08M081\10000 reports\Final Appendices\Appendix I1 - Public Comments.doc 6
May 6, 2009 (E-mail question from Mike Robertson, Mike Robertson - Environmental
Policy Staff with the Minnesota Chamber of Commerce)
From: [email protected] <[email protected]> To: [email protected] <[email protected]> Sent: Wed May 06 15:16:40 2009 Subject: Shuros study Tim--- I was looking at the Shuros report on collection. There is no indication on the title pages who paid for it and how much. (In fact, I think it says something about copyright etc.). Can you tell who funded the work and what it cost? Thanks, Mike

X:\MS\IE\2008\08M081\10000 reports\Final Appendices\Appendix I1 - Public Comments.doc 7
May 7, 2009 (E-Mail Attachment from Doug Morris, Crow Wing County Waste
Management Director)
CROW WING COUNTY
Douglas R. Morris, Waste Management Director Analysis of Waste Collection Service Arrangements (March 2009) Comments
May 7, 2009 Before focusing in detail on specific issues in the draft Report, it may be useful to clarify the counties role within solid waste. Counties have been tasked by the State, to manage recycling and solid waste management programs since the 1990’s under the State’s Waste Management Act. Solid waste is a “must manage” product of society and environmentally sound solid waste management is an essential public service. For that reason, counties have been tasked by the State to be responsible for safely managing solid waste that is generated by residential, commercial or industrial activities, while also protecting public health and welfare. Since the 1990’s counties in Greater Minnesota have invested hundreds of millions of dollars in creating the existing integrated solid waste infrastructure – WTE, sanitary and C&D landfills, transfer stations, material recovery facilities, and other solid waste related activities and facilities. One key aspect that is missing in this equation is – no matter how great a management system you have in place, it can only properly manage solid waste once it enters into the infrastructure that has been created. Comments: 1. State leadership. A key aspect that is missing from the Report is actions to be taken. The Report clearly identifies that the existing rules governing organized collection has seriously hindered counties efforts to truly establish a fully integrated solid waste system that address waste from point of generation to final disposal. This point is high lighted from past actions. From 1994 till recently, waste designation under the “Carbone” decision by the US Supreme Court significantly impacted counties on their efforts to control the waste within their own boundary. Organized collection offered a solution to address waste designation, but even facing sever fiscal repercussions almost all counties choose not to use the existing organized collection statute. According to this Report, the prevalence of open collection in Minnesota versus organized collection systems nationally appears to have an opposite trend! The Report was unable to identify any other state that had a similar statute a city or county had to follow to change from an open system to an organized system. Why place this handicap on the counties and cities within Minnesota? More important, why continue it? In the past, their has been significantly less effort spent on ensuring waste is entering the solid waste system than on managing it once it is in the system. Only through State leadership can this

X:\MS\IE\2008\08M081\10000 reports\Final Appendices\Appendix I1 - Public Comments.doc 8
deficiency be addressed. It is time for the State to take a proactive leadership role and address this key issue. 2. Environmental impacts. One thing that needs to be point out is, while each phase in the solid waste management process produces GHG (green house gas) emissions overall the solid waste management sector has accomplished very significant reductions of GHG emissions from solid waste activities. According to a study for the Journal of the Air & Water Management Association, greenhouse gas emissions from the solid waste sector have been reduced by 75% while the total generation of solid waste has more than doubled. No other major industrial sector in North America can make a similar claim for the goods or services they provide. These reductions have been achieved through an integrated system of solid waste management that includes landfill gas recovery, waste-to-energy, increased diversion from landfills through recycling and composting, as well as compliance with emissions requirements and improvement in overall management. The only aspect where GHG emissions showed an increase within solid waste has been in transportation. This seems to point more to an “organized” collection effort for the State to promote, but under the Minnesota Climate Change Advisory Group (MCCAG) this was never identified as an initiative! What would be the statewide saving in both fuel costs and reduction in GHG if a statewide initiative to have organized collection was in place? Plus as outlined in the Report, residents usually see a cost saving under an organized collection – what would that saving be statewide? The main point is, residents can save money and at the same time reduce the fuel being used and GHG emissions within the State. One item the MCCAG did point out was to increase the level of recycling. This Report does highlight that under organized collection there is a significant increase in recycling pounds per household (“recovery rate”). So under the GHG scenario, organized collection has many benefits. One thing the Report did not address was the benefits of organized collection in a rural environment versus an urban one. Intuitively, it would be more beneficial to have one hauler going down a county road. With one hauler, they can maximize their efficiency while minimizing their cost. This has many benefits – being cheaper means they can extend their route and service more county residents at a price people are now accustomed to. With more rural residents under a solid waste pickup service, this should start a decrease in illegal dumping and burning. Plus you have the additional benefits of using less fuel, reduction in GHG, and less wear-and-tear on the roads. An additional environmental issue that was not addressed in this Report was burn barrels. Without an organized collection system in place, there is no incentive for people to do the right thing. Many find it cheaper to burn than hire a hauler. A large concern voiced by counties in Greater Minnesota is illegal dumping. Reviewing the Zenith Report, Open Burning in Rural Minnesota (OEA, 2005), they estimated that 45% of the people in Greater Minnesota occasionally use a burn barrel, fire pit, fireplace, wood stove, or other method to dispose of their garbage. As outlined on the MPCA website, burn barrels has as much as 80 times more air
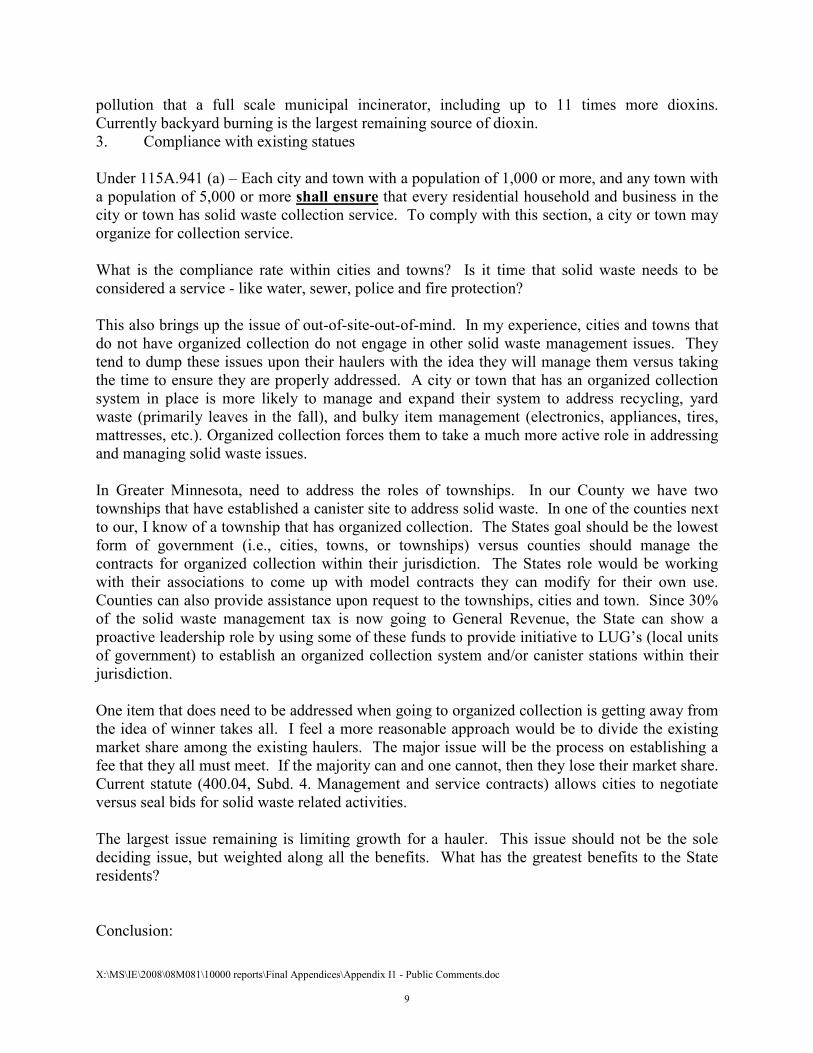
X:\MS\IE\2008\08M081\10000 reports\Final Appendices\Appendix I1 - Public Comments.doc 9
pollution that a full scale municipal incinerator, including up to 11 times more dioxins. Currently backyard burning is the largest remaining source of dioxin. 3. Compliance with existing statues Under 115A.941 (a) – Each city and town with a population of 1,000 or more, and any town with a population of 5,000 or more shall ensure that every residential household and business in the city or town has solid waste collection service. To comply with this section, a city or town may organize for collection service. What is the compliance rate within cities and towns? Is it time that solid waste needs to be considered a service - like water, sewer, police and fire protection? This also brings up the issue of out-of-site-out-of-mind. In my experience, cities and towns that do not have organized collection do not engage in other solid waste management issues. They tend to dump these issues upon their haulers with the idea they will manage them versus taking the time to ensure they are properly addressed. A city or town that has an organized collection system in place is more likely to manage and expand their system to address recycling, yard waste (primarily leaves in the fall), and bulky item management (electronics, appliances, tires, mattresses, etc.). Organized collection forces them to take a much more active role in addressing and managing solid waste issues. In Greater Minnesota, need to address the roles of townships. In our County we have two townships that have established a canister site to address solid waste. In one of the counties next to our, I know of a township that has organized collection. The States goal should be the lowest form of government (i.e., cities, towns, or townships) versus counties should manage the contracts for organized collection within their jurisdiction. The States role would be working with their associations to come up with model contracts they can modify for their own use. Counties can also provide assistance upon request to the townships, cities and town. Since 30% of the solid waste management tax is now going to General Revenue, the State can show a proactive leadership role by using some of these funds to provide initiative to LUG’s (local units of government) to establish an organized collection system and/or canister stations within their jurisdiction. One item that does need to be addressed when going to organized collection is getting away from the idea of winner takes all. I feel a more reasonable approach would be to divide the existing market share among the existing haulers. The major issue will be the process on establishing a fee that they all must meet. If the majority can and one cannot, then they lose their market share. Current statute (400.04, Subd. 4. Management and service contracts) allows cities to negotiate versus seal bids for solid waste related activities. The largest issue remaining is limiting growth for a hauler. This issue should not be the sole deciding issue, but weighted along all the benefits. What has the greatest benefits to the State residents? Conclusion:

X:\MS\IE\2008\08M081\10000 reports\Final Appendices\Appendix I1 - Public Comments.doc 10
Environmentally and economically, organized collection benefits greatly outweigh the concerns of a small group of haulers. The States need to step in and show a more proactive leadership role on moving the State toward a statewide organized collection system. The first step is to revise the existing organized collection statute.
X:\MS\IE\2008\08M081\10000 reports\Final Appendices\Appendix I1 - Public Comments.doc 11
May 11, 2009 (E-Mail Attachment Forwarded to Jeff Schneider from the National Solid
Waste Management Association, NSWMA)
(Warren, this Document was forwarded to me as a PDF file and I will Attach it as a separate document in the email.)

X:\MS\IE\2008\08M081\10000 reports\Final Appendices\Appendix I1 - Public Comments.doc 12
May 14, 2009 (E-Mail Notice of Minnesota Solid Waste Administrators Association
Executive Board’s Plan to Discuss the MPCA Study of Waste Collection Service
Arrangements on June 18, 2009)
Mark Gamm Dodge County EQ Director 22 6th Street East Mantorville, MN 55955 Good Morning: Please plan to attend a SWAA Exec Board meeting on June 18 in St. Cloud from 10 AM to 2:30 PM. I will send you agenda and meeting location information soon. Please let me know if there are any particular issues you would like to add to the agenda: So far, I anticipate: 1. A discussion of 2009 legislative session including Paint Bill communication 2. SWAA Annual Conference 3. Review of MPCA GHG Stakeholder process (and other stakeholder meetings) 4. MPCA's Study of Waste Collection Service Arrangements AT 11:00 AM - MPCA STAFF WILL LEAD a discussion proposed landfill rulemaking driven by legislative mandates passed in May 2008. The Legislature required the MPCA to promulgate new rules before it issues permits for any new landfills in Minnesota, with few exceptions. The MPCA is to report back to the Legislature in January 2010, before it completes the process. Here are the mandates: (1) The MPCA is to develop rule language requiring improved financial assurance at landfills. Financial assurance is a guarantee that a landfill operator puts up to ensure the public doesn't have to pay for emergency response, closure, or post-closure care. Under current rules, not all types of landfills have to put up financial guarantees. The kind of financial mechanism is likely to be an issue, as well as the scope. (2) The MPCA is to write rules taking hydrogeological sensitivity into account when landfills are sited. Mark Gamm Dodge County EQ Director 22 6th Street East Mantorville, MN 55955 Ph: 507-635-6273 e-mail: [email protected]

X:\MS\IE\2008\08M081\10000 reports\Final Appendices\Appendix I1 - Public Comments.doc 13
May 15, 2009 (E-mail Comment from Ted Troolin Director, St. Louis County
Environmental Services Department)
Jeff Schneider - I believe that the comment period is too short. The first notice I received from you on this was on May 1, and indicated a May 4 deadline. Afterwards this deadline was extended by 11 days. However, this is a significant report and I believe that more time should be devoted to reviewing and discussing it. There are various future opportunities for discussion (for example, June Solid Waste Administrators Meeting), and I believe comments should continue to be actively solicited. That being said I have the following general comments. 1. Most of the cities in St. Louis County's Service Area have organized collection, either provided by city staff or by private contractors. Organized collection appears to work well for those cities. 2. Organized collection can provide benefits in various ways, including lower collection fees to residents, less wear and tear on the roads, reduced fuel utilization and greenhouse gas generation, and improved public safety through less traffic. 3. Public education/information is an important component in future landfill abatement and resource recovery strategies. Organized systems offer advantages with regards to consistent recycling and special management programs and consistent public information. 4. If non-organized cities or counties decide to consider organized collection, it is important that they incorporate private waste industry input in system consideration, design, and development. Ted Troolin Director, St. Louis County Environmental Services Department