Analysis of Volatile Organic Compounds in Air by Online TD-GC
5
Introduction Volatile Organic Compounds (VOCs) have been identified as a major source of air pollution, and as such, have been regulated as a cause of both primary and secondary pollution, such as photochemistry smog. The U.S. Environmental Protection Agency (U.S. EPA) regulates 189 hazardous air pollutants under the Clean Air Act (CAA) of 1990, 51% of which are VOCs. The CAA offers further regulation and guidance for the monitoring of VOCs and ozone pollution in ambient air with a list of 57 ozone-precursor target analytes monitored under U.S. EPA’s Technical Assistance Document for Sampling and Analysis of Ozone Precursors, EPA/600-R-98/161 (1998) 1 , as well as the requirement of states to establish Photochemical Assessment Monitoring Stations (PAMS). In 2017, U.S. EPA released guidance 2 to all PAMS required sites strongly suggesting the collection of hourly speciated VOC measurements, with analysis of 27 primary and 37 optional compounds by gas chromatography. 3 In the same year, China also initiated regulations requiring monitoring of the 57 VOC compounds included in the original PAMS guidance, as well as 13 aldehydes and ketones, and 47 halohydrocarbons and oxygen containing VOCs. Analysis of Volatile Organic Compounds in Air by Online TD-GC Gas Chromatography APPLICATION NOTE Authors: Kira. Yang Yong. Xu PerkinElmer, Inc. Shanghai, China
Transcript of Analysis of Volatile Organic Compounds in Air by Online TD-GC

Introduction
Volatile Organic Compounds (VOCs) have been identified as a major source of air pollution, and as such, have been regulated as a cause of both primary and secondary pollution, such as
photochemistry smog. The U.S. Environmental Protection Agency (U.S. EPA) regulates 189 hazardous air pollutants under the Clean Air Act (CAA) of 1990, 51% of which are VOCs. The CAA offers further regulation and guidance for the monitoring of VOCs and ozone pollution in ambient air with a list of 57 ozone-precursor target analytes monitored under U.S. EPA’s Technical Assistance Document for Sampling and Analysis of Ozone Precursors, EPA/600-R-98/161 (1998)1, as well as the requirement of states to establish Photochemical Assessment Monitoring Stations (PAMS).
In 2017, U.S. EPA released guidance2 to all PAMS required sites strongly suggesting the collection of hourly speciated VOC measurements, with analysis of 27 primary and 37 optional compounds by gas chromatography.3 In the same year, China also initiated regulations requiring monitoring of the 57 VOC compounds included in the original PAMS guidance, as well as 13 aldehydes and ketones, and 47 halohydrocarbons and oxygen containing VOCs.
Analysis of Volatile Organic Compounds in Air by Online TD-GC
Gas Chromatography
A P P L I C A T I O N N O T E
Authors:
Kira. Yang
Yong. Xu
PerkinElmer, Inc. Shanghai, China

2
Results and Discussion The chromatograms of calibration standards for low and high carbon channels are shown in Figures 2 and 3, with good peak shapes and baseline resolution of the target compounds. The heartcut time was 9.8 minutes, thus the compounds that eluted earlier than cis-1,2-Dichloroethene were switched to the PLOT column for further separation, and other compounds went through the restrictor tubing for detection. Tables 2-5 summarize the results for retention time (RT), method dynamic range, and signal to noise (S/N) at the reporting limit. The determination coefficients (r2) of all compounds were over 0.996, showing the reliability of the analysis in the range of 1-40 ppbc. The results for retention time stability, peak area precision and S/N were measured by analyzing six replicates at the concentration specified.
The PerkinElmer TurboMatrix™ 300 TD is an effective and efficient thermal desorber, developed for automated sampling and concentrating of hydrocarbons in the C2 – C12 range. When combined with a PerkinElmer Clarus® GC, ambient air samples can be analyzed with ease and accuracy for VOC contamination in accordance with regulatory requirements. The PerkinElmer system is the gold standard for ozone precursor analysis, with high repeatability and low quantitation limits.
This paper details an application for VOC monitoring with an extended target compound list utilizing a PerkinElmer TurboMatrix online 300 TD and PerkinElmer Clarus 580 GC. The application note demonstrates results with good repeatability, linearity and detection limits.
Experimental
InstrumentationA PerkinElmer Clarus 580 dual GC/FID with a TurboMatrix online 300 TD was used to perform this experiment, with the conditions presented in Table 1. A BP-1 column (50 m x 0.22 mm x 1.0 μm) was used as the primary column, and was directly connected with the Thermal Desorption transfer line. A classic Alumina PLOT column was used for separation of the lighter components in the sample. Heavier components were separated by switching to an FID through a fused silica restrictor tubing and a D-Swafer™ with a heartcutting technique. A schematic diagram of the system is presented in Figure 1.
An enhanced air monitoring trap was used in this study to concentrate the target compounds. As discussed in a prior application note describing ambient air monitoring4, a small guard zone with the weaker adsorbent is positioned ahead of the two stronger adsorbents to enhance precision and recovery of heavier compounds.
Gas StandardsCalibration gas mixtures, PAMS and TO-15, were purchased from Linde Gas and diluted by a dynamic diluter (Besser Technology).
Thermal Desorber Parameters GC Parameters
Sampling Time 40 min Initial Oven Temp 45 °C
Pump Flow 15 mL/min Oven Hold 15.0 min
Mode Online Ramp 5 °C/min
Concentrator Trap Low -30 °C 2nd Oven Temp 170 °C
Concentrator Trap High 320 °C Oven Hold 0 min
Concentrator Trap Hold 6 min Ramp 15 °C/min
Concentrator Trap Heating Rate
40 °C/min 3rd Oven Temp 200 °C
Valve Temp 180 °C Oven Hold 6.0 min
Transfer Line Temp 220 °C FPD Temp 200 °C
Column Pressure 38.5 psi Air Flow 400 mL/min
Inlet Split OFF H2 Flow 40 mL/min
Outlet Split 4 mL/min Heartcut Time 9.8 min
Table 1. Analytical parameters.
Figure 1. Schematic diagram of the online TD-GC system.

3
Figure 2. The chromatograms of PAMS calibration standards for low (A) and high (B) carbon channels at 50 ppbc.
RT Compound Name CAS Channel
Linearity (1 – 40 ppbc)
Reporting Limit
Precision (RSD%) at 5 ppbc
r2 SN at 0.5 ppbc RT Area
8.53 Ethane 74-84-0 Low 0.9998 7.25 0.19 2.83
9.26 Ethylene 74-85-1 Low 0.9962 6.53 0.91 1.93
12.55 Propane 74-98-6 Low 0.9987 2.01 1.17 3.07
20.25 Proplyene 115-07-1 Low 0.9983 4.91 2.23 2.44
23.71 Isobutane 75-28-5 Low 0.9993 8.86 1.48 3.73
24.96 Butane 106-97-8 Low 0.999 20.85 1.41 3.70
25.32 Acetylene 74-86-2 Low 0.9961 5.51 2.24 3.59
29.90 t-2-Butene 107-01-7 Low 0.9986 18.87 1.24 3.45
30.50 1-Butene 106-98-9 Low 0.9995 19.45 1.25 8.62
31.95 Cis-2-Butene 590-18-1 Low 0.9988 18.78 1.13 3.80
33.83 Cyclopentane 287-92-3 Low 0.9982 25.32 0.92 3.80
33.83 Iso-Pentane 78-78-4 Low 0.9982 25.32 0.92 3.80
34.62 n-Pentane 109-66-0 Low 0.9984 12.13 0.90 3.66
37.34 t-2-Pentene 646-04-8 Low 0.9983 26.52 0.89 3.74
38.39 1-Pentene 109-67-1 Low 0.9981 26.08 0.94 3.38
38.95 Cis-pentene 627-20-3 Low 0.9982 24.31 0.89 3.65
40.63 2,2-Dimethylbutane 75-83-2 Low 0.9981 26.78 0.78 3.92
41.81 Isoprene 78-79-5 Low 0.9992 26.82 0.75 3.89
Table 2. Results for retention time (RT), method dynamic range and signal to noise (S/N) at the reporting limit for low carbon channel for AMS components.

4
RT Compound Name CAS Channel
Linearity (1 – 40 ppbc)
Reporting Limit
Precision (RSD%) at 5 ppbc
r2 SN at 0.25 ppbc RT Area
10.75 2,3-Dimethylbutane 79-29-8 High 0.9993 23.68 0.04 1.89
10.93 2-Methylpentane 107-83-5 High 0.9998 16.24 0.04 4.55
11.69 3-Methylpentane 96-14-0 High 0.9995 14.27 0.05 1.06
12.00 1-Hexene 592-41-6 High 0.9994 12.85 0.04 1.73
12.71 n-Hexane 110-54-3 High 0.9992 12.50 0.04 0.69
14.80 Methylcyclopentane 96-37-7 High 0.9995 12.84 0.05 1.26
15.03 2,4-Dimethylpentane 108-08-7 High 0.9998 15.01 0.04 0.79
16.81 Benzene 71-43-2 High 0.9996 21.27 0.03 2.57
17.57 Cyclohexane 110-82-7 High 0.9996 16.45 0.03 1.37
18.16 2-Methylhexane 591-76-4 High 0.9998 18.85 0.03 0.69
18.35 2,3-Dimethylpentane 565-59-3 High 0.9996 18.43 0.03 0.81
18.87 3-Methylhexane 589-34-4 High 0.9996 21.78 0.03 0.53
19.97 2,2,4-Trimethylpentane 540-84-1 High 0.9995 22.61 0.02 0.96
20.73 n-Heptane 142-82-5 High 0.9994 24.43 0.02 0.54
22.37 Methylcyclohexane 108-87-2 High 0.9994 17.49 0.03 0.72
24.41 2,3,4-Trimethylpentane 565-75-3 High 0.9992 37.38 0.02 0.38
24.74 Toluene 108-88-3 High 0.9994 30.99 0.02 1.08
25.41 2-Methylheptane 592-27-8 High 0.9994 56.37 0.02 0.28
25.91 3-Methylheptane 589-81-1 High 0.9991 51.42 0.02 0.26
27.50 n-Octane 111-65-9 High 0.9992 28.05 0.02 0.65
30.50 Ethylbenzene 100-41-4 High 0.9996 43.13 0.02 0.25
30.95 p-Xylene 108-38-3 High 0.9993 34.00 0.02 0.65
31.01 m-Xylene 106-42-3 High 0.9998 32.11 0.01 0.52
31.92 Styrene 100-42-5 High 0.9998 14.77 0.01 1.02
32.20 o-Xylene 95-47-6 High 0.9999 33.24 0.01 1.76
32.93 Nonane 111-84-2 High 0.9993 49.85 0.02 0.41
33.81 Isopropylbenzene 98-82-8 High 0.9995 32.25 0.02 0.11
35.23 n-Propylbenzene 103-65-1 High 0.9994 32.38 0.02 0.51
35.54 m-Ethyltoluene 620-14-4 High 0.9993 28.46 0.01 0.47
35.66 p-Ethyltoluene 622-96-8 High 0.9995 25.78 0.01 0.36
35.89 1,3,5-Trimethylbenzene 108-67-8 High 0.9995 29.14 0.01 0.53
36.41 o-Ethyltoluene 611-14-3 High 0.9995 22.80 0.01 0.68
37.07 1,2,4-Trimethylbenzene 95-63-6 High 0.9993 14.81 0.01 1.99
37.49 n-Decane 124-18-5 High 0.9994 25.91 0.01 0.61
38.34 1,2,3-Trimethylbenzene 526-73-8 High 0.9997 12.88 0.01 0.74
39.35 m-Diethylbenzene 141-93-5 High 0.9993 20.38 0.01 1.12
39.64 p-Diethylbenzene 105-05-5 High 0.9992 16.77 0.00 1.50
41.38 n-Undecane 1120-21-4 High 0.9996 12.69 0.00 1.72
44.53 n-Dodecane 112-40-3 High 0.9995 7.70 0.01 2.56
Table 3. Results for retention time (RT), method dynamic range and signal to noise (S/N) at the reporting limit for high carbon channel for PAMS components.
For a complete listing of our global offices, visit www.perkinelmer.com/ContactUs
Copyright ©2019, PerkinElmer, Inc. All rights reserved. PerkinElmer® is a registered trademark of PerkinElmer, Inc. All other trademarks are the property of their respective owners. 014798_01 PKI
PerkinElmer, Inc. 940 Winter Street Waltham, MA 02451 USA P: (800) 762-4000 or (+1) 203-925-4602www.perkinelmer.com
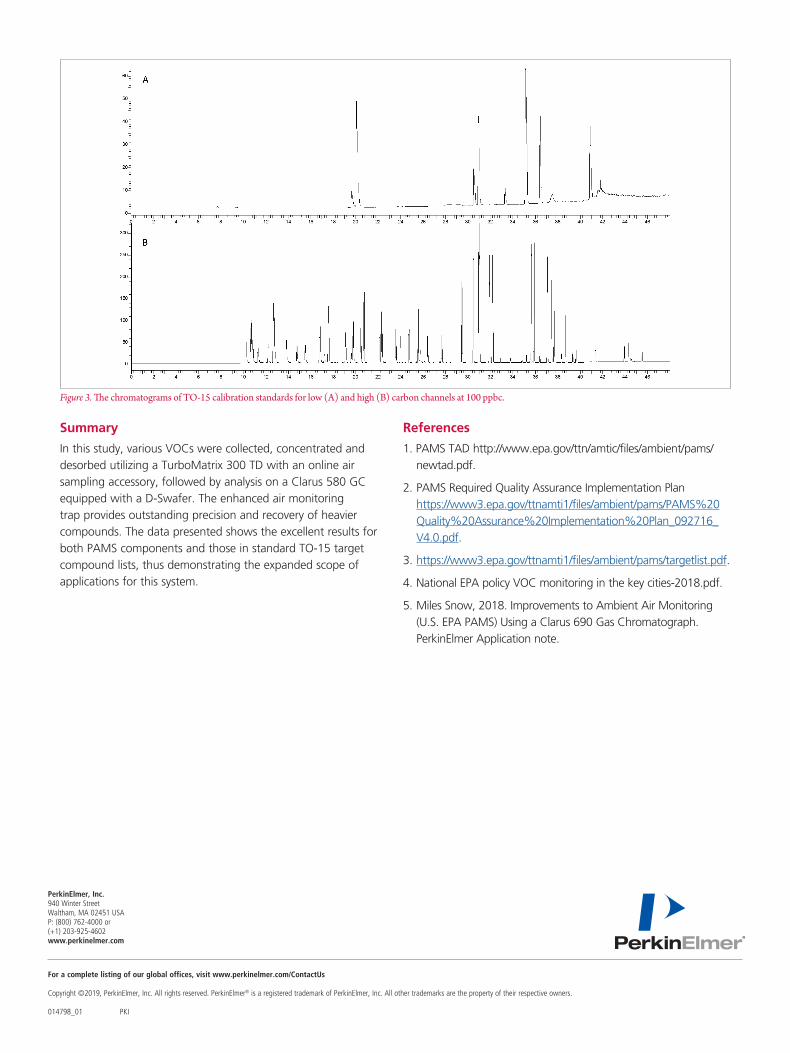
Figure 3. The chromatograms of TO-15 calibration standards for low (A) and high (B) carbon channels at 100 ppbc.
Summary
In this study, various VOCs were collected, concentrated and desorbed utilizing a TurboMatrix 300 TD with an online air sampling accessory, followed by analysis on a Clarus 580 GC equipped with a D-Swafer. The enhanced air monitoring trap provides outstanding precision and recovery of heavier compounds. The data presented shows the excellent results for both PAMS components and those in standard TO-15 target compound lists, thus demonstrating the expanded scope of applications for this system.
References
1. PAMS TAD http://www.epa.gov/ttn/amtic/files/ambient/pams/ newtad.pdf.
2. PAMS Required Quality Assurance Implementation Plan https://www3.epa.gov/ttnamti1/files/ambient/pams/PAMS%20Quality%20Assurance%20Implementation%20Plan_092716_V4.0.pdf.
3. https://www3.epa.gov/ttnamti1/files/ambient/pams/targetlist.pdf.
4. National EPA policy VOC monitoring in the key cities-2018.pdf.
5. Miles Snow, 2018. Improvements to Ambient Air Monitoring (U.S. EPA PAMS) Using a Clarus 690 Gas Chromatograph. PerkinElmer Application note.