
Analysis of VOC (Voice of Customer) Data for …ieomsociety.org/ieom_2016/pdfs/154.pdfProceedings of...
12
Proceedings of the 2016 International Conference on Industrial Engineering and Operations Management Kuala Lumpur, Malaysia, March 8-10, 2016 Analysis of VOC (Voice of Customer) Data for Assessing Corporate Image of a Housing Equipment Company Hiroaki Takagi, Kaoru Ema, Ushio Sumita, Takaki Hayashi and Masahiro Okada Graduate School of Business Administration Keio University Yokohama, Kanagawa, Japan [email protected], [email protected], [email protected], [email protected], [email protected] Abstract—A housing equipment company under consideration typically receives about 110000 phone calls per month at three call centers. The resulting data, called VOC data, involve a variety of contents including complaints about products, requests for product information and questions about maintenance services. In this paper, we analyze the VOC data for the month of March 2015, through text mining combined with other data mining techniques, so as to assess the corporate image of the company collectively perceived by the callers. Focusing on calls related to toilets, bath modules, sash windows and bathroom sinks and further eliminating meaningless data such as sentences too short, 22838 calls are extracted for the study. Then 1956 calls are chosen at random, each of which is evaluated by three people along the following binary axes: 1) sales potential; 2) negative attitude; and 3) urgency. Using 1304 calls as a learning data set and the remaining 652 calls as a testing data set, an algorithmic procedure is developed for establishing a special dictionary and quantifying the three scores of each call. The procedure is applied to the entire VOC data, thereby enabling one to capture the corporate image of the company represented by the VOC data. Keywords—Text mining; Data mining; Document categorization; Voice Of Customer; Call center I. INTRODUCTION Since the beginning of this century, the advancement of information technologies surrounding the Internet has been evolving with amazing speed, represented by a variety of mobile devices, SNS services and cloud computing services, to name only a few. Because of this, it is now affordable for many corporations to have accesses to massive amounts of digitized texts that come from all sorts of different sources. However, it is not an easy task to establish a path from insights to values in the sea of the massive data for deriving useful managerial implications. In order to overcome this difficulty, the most prevalent analytical approach has been the automated categorization of texts into pre-specified categories based on machine learning, where a general inductive process automatically produces a classifier by learning from a set of pre-specified documents. The reader is referred to Sebastiani (2002)[1] for further discussion of automated categorization. Applications of automated categorization can be found in many different areas, including automated learning of decision rules by Apte, Damerau and Weiss (1994)[2], anti-spam filtering with e-mail messages by Androutsopoulos et al. (2000)[3], trends recognition in journal papers by Terachi et al. (2006)[4], e-government research by Heeks and Bailur (2007)[5], Irani, Love and Montazemi (2007)[6], and Evangelopoulos and Visinescu (2012)[7], among others. Furthermore, the automated categorization approach also has been applied to study various markets, represented by Das and Chen (2001)[8], Dave, Lawrence and Pennock (2003)[9], Hu and Liu (2004)[10], and the like. The purpose of this paper is to analyze a set of VOC (Voice Of Customer) data, recorded at three different call centers and then digitized subsequently, where VOCs are categorized into three groups: 1) those with sales potential; 2) those with negative attitude; and 3) those with urgency so as to assess the corporate image of the company collectively perceived by the callers. The structure of this paper is as follows. In Section 2, the data set provided by the company would be described in detail. Furthermore, a procedure is presented for specifying a subset of VOCs of interest for the study so as to conduct the necessary text mining analysis with speed and efficiency, but still sufficient enough to extract useful managerial implications. Section 3 is devoted to development of a segmentation algorithm for classifying VOCs which satisfy certain pre-specified conditions. In Section 4, the segmentation algorithm is applied for identifying VOCs with sales potential, those with negative attitude and those with urgency. Numerical results reveal that the segmentation algorithm performs excellently, thereby demonstrating its efficiency and accuracy. Finally in Section 5, some concluding remarks are given. 545 © IEOM Society International
Transcript of Analysis of VOC (Voice of Customer) Data for …ieomsociety.org/ieom_2016/pdfs/154.pdfProceedings of...

Proceedings of the 2016 International Conference on Industrial Engineering and Operations Management Kuala Lumpur, Malaysia, March 8-10, 2016
Analysis of VOC (Voice of Customer) Data for Assessing Corporate Image of a Housing Equipment Company
Hiroaki Takagi, Kaoru Ema, Ushio Sumita, Takaki Hayashi and Masahiro Okada Graduate School of Business Administration
Keio University Yokohama, Kanagawa, Japan
[email protected], [email protected], [email protected], [email protected], [email protected]
Abstract—A housing equipment company under consideration typically receives about 110000 phone calls per month at three call centers. The resulting data, called VOC data, involve a variety of contents including complaints about products, requests for product information and questions about maintenance services. In this paper, we analyze the VOC data for the month of March 2015, through text mining combined with other data mining techniques, so as to assess the corporate image of the company collectively perceived by the callers. Focusing on calls related to toilets, bath modules, sash windows and bathroom sinks and further eliminating meaningless data such as sentences too short, 22838 calls are extracted for the study. Then 1956 calls are chosen at random, each of which is evaluated by three people along the following binary axes: 1) sales potential; 2) negative attitude; and 3) urgency. Using 1304 calls as a learning data set and the remaining 652 calls as a testing data set, an algorithmic procedure isdeveloped for establishing a special dictionary and quantifying the three scores of each call. The procedure is applied to the entireVOC data, thereby enabling one to capture the corporate image of the company represented by the VOC data.
Keywords—Text mining; Data mining; Document categorization; Voice Of Customer; Call center
I. INTRODUCTION
Since the beginning of this century, the advancement of information technologies surrounding the Internet has been evolving with amazing speed, represented by a variety of mobile devices, SNS services and cloud computing services, to name only a few. Because of this, it is now affordable for many corporations to have accesses to massive amounts of digitized texts that come from all sorts of different sources. However, it is not an easy task to establish a path from insights to values in the sea of the massive data for deriving useful managerial implications. In order to overcome this difficulty, the most prevalent analytical approach has been the automated categorization of texts into pre-specified categories based on machine learning, where a general inductive process automatically produces a classifier by learning from a set of pre-specified documents. The reader is referred to Sebastiani (2002)[1] for further discussion of automated categorization.
Applications of automated categorization can be found in many different areas, including automated learning of decision rules by Apte, Damerau and Weiss (1994)[2], anti-spam filtering with e-mail messages by Androutsopoulos et al. (2000)[3], trends recognition in journal papers by Terachi et al. (2006)[4], e-government research by Heeks and Bailur (2007)[5], Irani, Love and Montazemi (2007)[6], and Evangelopoulos and Visinescu (2012)[7], among others. Furthermore, the automated categorization approach also has been applied to study various markets, represented by Das and Chen (2001)[8], Dave, Lawrence and Pennock (2003)[9], Hu and Liu (2004)[10], and the like.
The purpose of this paper is to analyze a set of VOC (Voice Of Customer) data, recorded at three different call centers and then digitized subsequently, where VOCs are categorized into three groups: 1) those with sales potential; 2) those with negative attitude; and 3) those with urgency so as to assess the corporate image of the company collectively perceived by the callers.
The structure of this paper is as follows. In Section 2, the data set provided by the company would be described in detail. Furthermore, a procedure is presented for specifying a subset of VOCs of interest for the study so as to conduct the necessary text mining analysis with speed and efficiency, but still sufficient enough to extract useful managerial implications. Section 3 is devoted to development of a segmentation algorithm for classifying VOCs which satisfy certain pre-specified conditions. In Section 4, the segmentation algorithm is applied for identifying VOCs with sales potential, those with negative attitude and those with urgency. Numerical results reveal that the segmentation algorithm performs excellently, thereby demonstrating its efficiency and accuracy. Finally in Section 5, some concluding remarks are given.
545© IEOM Society International

Proceedings of the 2016 International Conference on Industrial Engineering and Operations Management Kuala Lumpur, Malaysia, March 8-10, 2016
II. DATA DESCRIPTION AND SPECIFICATION OF A SUBSET OF VOCS FOR THE STUDY In this section, we describe a set of real data to be employed for the study. This data set is provided by the company with
which we have been conducting a joint research project. The core of the data set consists of VOCs (Voice Of Customers) collected through a call center of the company during March 2015. VOCs were recorded first, and then documented subsequently. A unique ID is attached to each VOC, along with the following items: 1) a type of the caller; 2) reasons for the call; and 3) product types of the major concern for the call, among others. The number of VOCs for the study is 112618, which is somewhat too large for conducting text mining analyses in an efficient way. The purpose of this section is to specify a subset of the VOCs, which is small enough to allow us to conduct data mining analyses with speed and efficiency, while it is large enough to provide a sound basis for extracting reliable implications valid for the entire set of VOCs.
In Table 2.1, the composition of the whole set of VOCs is given in terms of Types of Callers. One finds that the largest source of these VOCs is End Users with 52.9 %, followed by Local Construction Companies with 23.6 % and Contracted Sales Agents with 6.5 %. It should be noted that End Users constitute general consumers, while other types of callers consist of professionals in the related business fields. Since the purpose of this study is to assess the corporate image of the housing equipment company among general consumers, we focus on End Users in this paper.
The composition of the VOCs in terms of Reasons of Calls is summarized in Table 2.2. The majority of the VOCs are called because of Consultation, which amount to 80.8 %. The next two major reasons are Repair Request with 5.9 % and Parts Request with 4.5 %. From the point of view of our purpose for the study, it is natural to focus on the top reason, that is Consultation. Out of 59531 VOCs made by End Users, 76.5 % of them happen to call with reason of Consultation, resulting in 45566 VOCs.
In order to narrow down the subset of VOCs further, we next pay attention to the composition of the VOCs in terms of product types of concern for the callers. Table 2.3 shows that the spread of the VOCs over different types of concern for the callers is rather wide, where Toilets is the top concern with 29.3 %, followed by Kitchen, Sinks and Counters with 9.0 %, Bath Modules with 8.6 %, Exterior Walls and Gates with 6.5 %, Sash Windows with 6.2 %, Bathroom Sinks with 6.1 %, and Floorings with 2.8 %. Because of this wide spread, we focus on products which constitute in-house facilities, that is, we focus on Toilets, Kitchen, Sinks and Counters, Bath Modules, Sash Windows and Bathroom Sinks. Through this selection of product types, the size of the subset of VOCs for the study is reduced to 29777. By eliminating incomplete VOC data from these, the final subset of VOCs to be employed for the study now contains 22838 VOCs.
Table 2.1 Composition of VOCs by Types of Callers
Types of Callers No. of VOCs %End Users 59531 52.9%Local Construction Companies 26603 23.6%Contracted Sales Agents 7295 6.5%Design offices 4355 3.9%House Makers 2271 2.0%Discount Shops and Home Centers 2132 1.9%Reform Companies 1391 1.2%Group Companies 864 0.8%Competitors 217 0.2%General Construction Companies 179 0.2%Others 7780 6.9%Total 112618 100.0%
546© IEOM Society International

Proceedings of the 2016 International Conference on Industrial Engineering and Operations Management Kuala Lumpur, Malaysia, March 8-10, 2016
Table 2.2 Composition of VOCs by Reasons for Calls
Table2.3 Composition of VOCs by Product Types of Concern
III. DEVELOPMENT OF SEGMENTATION ALGORITHM FOR IDENTIFYING VOCS SATISFYING CERTAIN CONDITIONS Let v be a typical VOC and the set of VOCs under consideration is denoted by VOC . This set contains 22838 VOCs. WithinVOC , of interest is to identify three types of VOCs from the rest: those VOCs with sales potential; those with negative attitude; and those with urgency. In what follows, we describe a segmentation algorithm for achieving this goal in a generic form. Although the segmentation algorithm does depend on what types of VOCs ought to be separated to some extent, it can be readily applied to the three different cases discussed above in a similar manner.
Let D be a subset of VOC consisting of those VOCs judged manually whether certain conditions are satisfied (represented by 1)( =vI ) or not (represented by 0)( =vI ). It should be noted that such conditions are set differently for each of the three classes. Consequently, each VOCv ∈ may take different values of )(vI for different classes. In order to employ those VOCs in D for machine learning, the subset D is further decomposed into two subsets: a set of VOCs for learning, described by LD , and the remaining VOCs in D for testing, denoted by TD . The purpose of this section is to develop a segmentation algorithm for judging whether or not an arbitrary DVOCv \∈ has the value 1.
For this purpose, the first step is to establish a score of a word measuring the likelihood of that word being used in v with 1)( =vI . In this paper, we focus on meaningful nouns, adjectives, adverbs and verbs for text mining. Such words used in
more than three VOCs in LD are first extracted, using a text mining software package named MeCab and a computer language R. Then meaningless words such as numbers and symbols are eliminated, resulting in 1286 nouns, 48 adjectives, 262 adverbs and 51 verbs with total of 1647 words. The set of these words is denoted by W . Let )(vW be a set of those words in W contained in v and define )(wr for each Ww ∈ by
Reasons for Calls No. of VOCs %Consultation 91023 80.8%Repair Request 6603 5.9%Parts Request 5107 4.5%Other Request 2109 1.9%Catalogue Request 1867 1.7%Complaint 826 0.7%Appreciation 154 0.1%Others 4929 4.4%Total 112618 100.0%
Product Types of Concern No. of VOCs %Toilets 32956 29.3%Kitchen, Sinks and Counters 10176 9.0%Bath Modules 9655 8.6%Exterior Walls and Gates 7336 6.5%Sash Windows 6970 6.2%Bathroom Sinks 6908 6.1%Floorings 3134 2.8%Others 35483 31.5%Total 112618 100.0%
547© IEOM Society International
Proceedings of the 2016 International Conference on Industrial Engineering and Operations Management Kuala Lumpur, Malaysia, March 8-10, 2016
{ }{ }1)(:
1)()(:)(
=∈=∧∈∈
=vILDv
vIvWwLDvwr
.
Here, X denotes the cardinality of a set X . As shown below, a score of Ww ∈ , denoted by )(wws , can now be
introduced for representing the likelihood of )(vWw∈ for some LDv ∈ with 1)( =vI at three different levels.
31)(0 ≤≤ wr 0)( =wws
32)(
31 ≤< wr 5.0)( =wws
1)(32 ≤< wr 1)( =wws
The next step is to evaluate a similar score for LDv ∈ based on )(wws for )(vWw∈ . For )(vWw∈ and LDv ∈ ,
let ),( vwn be the number of appearances of w in v and define ∑ ∈=
)(),()(
vWwvwnvN . Furthermore, let ),( vwTF be
the term frequency for )(vWw∈ and LDv ∈ defined by
)(),(),(
vNvwnvwTF = .
We also define the inverse document frequency, )(wIDF , as
{ } 1)(:
log)( 2 +∈∈
=vWwLDv
LDwIDF .
The reader is referred to [1] for further details concerning ),( vwTF and )(wIDF . We are now in a position to introduce a score of an arbitrary DVOCv \∈ , which we denote by )(vvs , defined as
∑∈
××=)(
)(),()()(vWw
wIDFvwTFwwsvvs .
The next step for developing a segmentation algorithm to identify whether or not 1)( =vI for each DVOCv \∈ is to employ the logit model approach for evaluating the logit value )(vLogit based on )(vvs . It turns out that a single variable
logit model is sufficient for our purpose, as we will see. More specifically, let xx 10)( βββ += and define
)()(1
)(log xxp
xp β=−
,
so that
548© IEOM Society International
Proceedings of the 2016 International Conference on Industrial Engineering and Operations Management Kuala Lumpur, Malaysia, March 8-10, 2016
)()(
)(
11
1)( xx
x
eeexp ββ
β
−+=
+= .
Using the data set LD for learning, we estimate 0β and 1β by solving the logit model, resulting in *0β and *
1β . More specifically, one has
{ } ] ))(()( [ minarg,( 2
,(
**0
10
∑ ∈−=
LDvvvspvI
)1 )
ββββ .
If we define )(* xβ and )(* xp by
xx *1
*0
* )( βββ += ; )(
**
11)(
xexp
β−+= ,
the logit value )(vLogit for each LDVOCv \∈ can be computed as
))(()( * vvspvLogit = .
In order to identify whether or not 1)( =vI , one has to convert )(vLogit into )(vI by specifying the threshold value *z so that
⎩⎨⎧ ≥
= else 0
)( 1)(
*zvLogitifvI .
The threshold value *z may be determined based on LD , where its appropriateness would be tested through TD . More specifically, given a segmentation level 0>z , let )|( zvI be defined for each LDv ∈ as
⎩⎨⎧ ≥
= else 0)( 1
)|(zvLogitif
zvI .
549© IEOM Society International

Proceedings of the 2016 International ConfKuala Lumpur, Malaysia, March 8-10, 2016
Since LDv ∈ , the value of )(vI is knvalue )(vI , one can obtain the following co
Here, )(zxij means the number of sessio
that is, { vIizvILDvzxij =∈= (,)|(:)(
Two important measures of interest in da
)(Recall z =
It should be noted that )(Recall z reprwhile )(Precision z describes how many s
as z increases with 1)0(Recall = , whi
)(Precision z is maximized subject to Re
[ maxarg* =zz
In the next section, we will apply the abo
IV. SEGMENTATION OF VOCIn this section, we apply the segmentat
DVOC \ : those VOCs with Sales Potenprepare a dictionary by text mining all Vmeaningful and appear in three or more VO51 verbs with total of 1647 words. This seteach Ww ∈ , the two word scores )(wrcomputed.
ference on Industrial Engineering and Operations Manag6
nown. By comparing the computed value )|( zvI against onfusion matrix.
ons in LD which are judged as { }1 ,0∈i but, its true va
}jv =) .
ata mining are )(Recall z and )(Precision z defined by
)()(
1
11
zYzx= :
)()()(Precision
1
11
zXzxz = .
resents how many sessions with the true value 1 are judsessions are judged to have the value 1 correctly. In gener
ile )(Precision z increases as z increases. In this p
γ≥)(ecall z for some [ ]1,0∈γ , that is,
] )(Recall subject to )(Precision γ≥zz .
ove procedure to identify VOCs with sales potential, negat
CS WITH SALES POTENTIAL, NEGATIVE ATTITUDE AND UR
tion algorithm developed in Section 3 so as to identify tntial; those with Negative Attitude; and those with UrgeVOCs in LD , where those nouns, adjectives, adverbOCs, have been selected, resulting in 1286 nouns, 48 adjt of words is denoted by W as in Section 3. For each of and )(wws together with the inverse document frequ
gement
the manually determined
alue is { }1,0∈j ,
y
dged to have the value 1, ral, )(Recall z decreases
aper, we set *z so that
tive attitude and urgency.
RGENCY three classes of VOCs in ency. The first step is to bs and verbs, which are ectives, 262 adverbs and
f the three classes and for uency )(wIDF are then
550© IEOM Society International
Proceedings of the 2016 International ConfKuala Lumpur, Malaysia, March 8-10, 2016
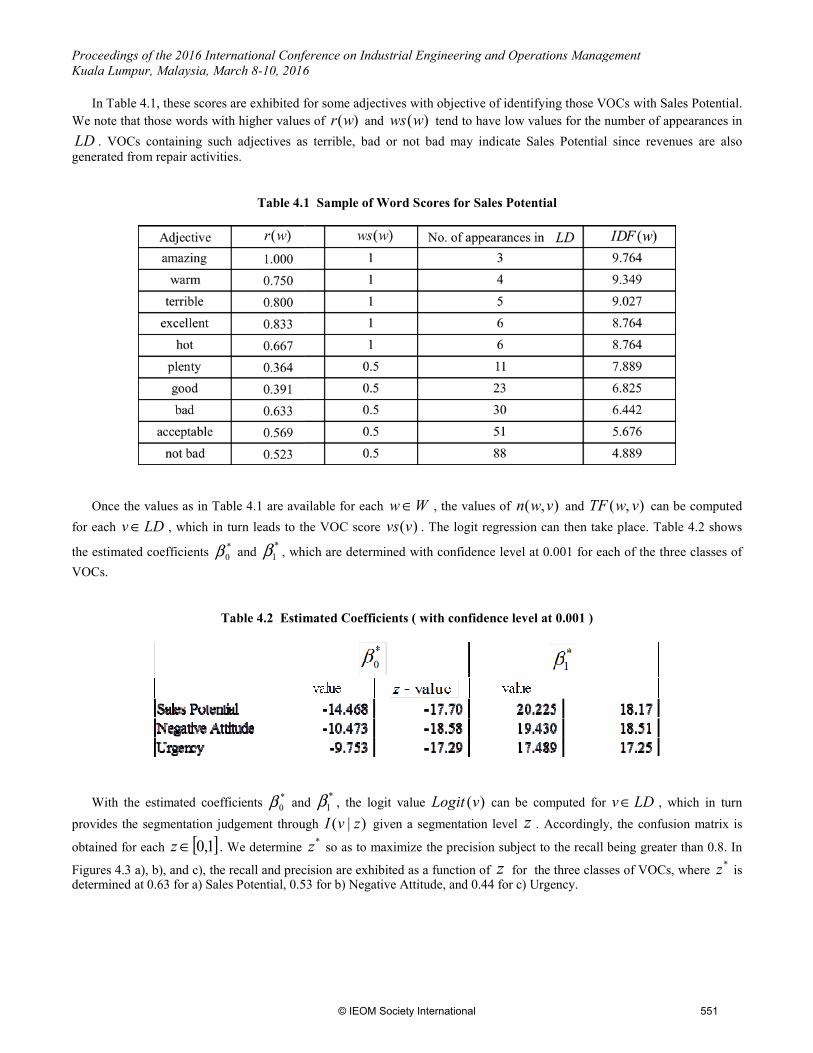
In Table 4.1, these scores are exhibited fWe note that those words with higher valueLD . VOCs containing such adjectives asgenerated from repair activities.
Table 4.1
Once the values as in Table 4.1 are avafor each LDv ∈ , which in turn leads to th
the estimated coefficients *0β and *
1β , whVOCs.
Table 4.2 Estim
With the estimated coefficients *0β an
provides the segmentation judgement throu
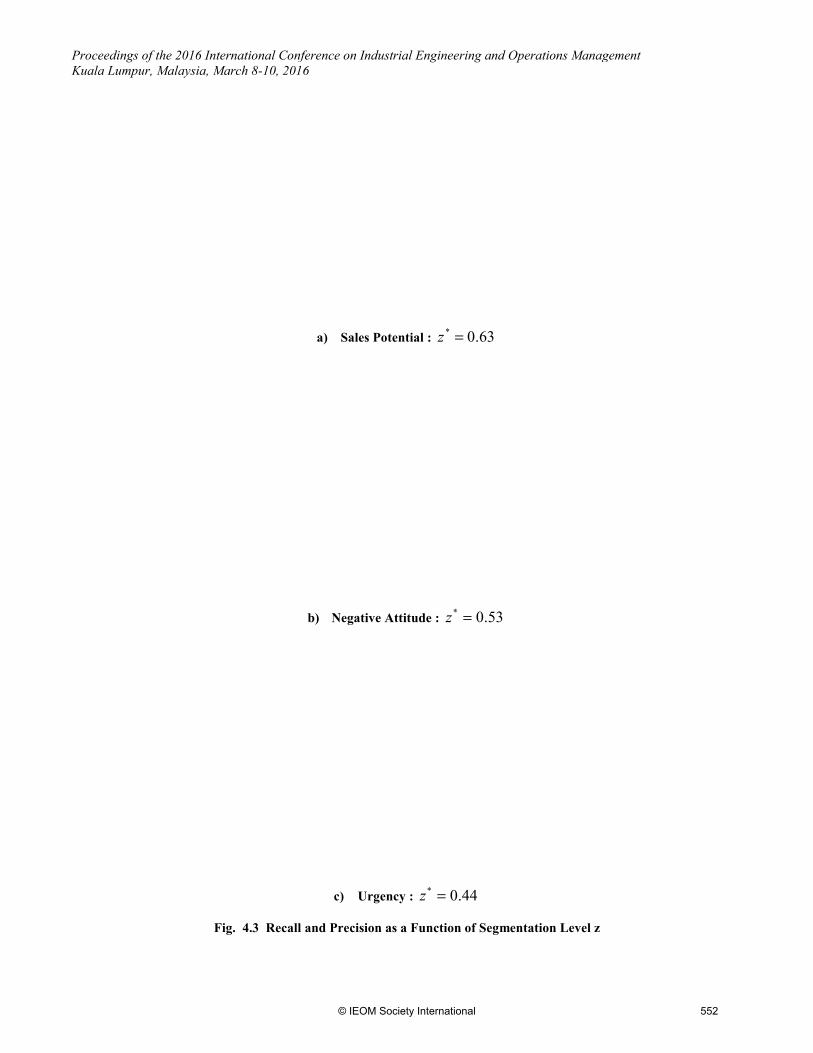
obtained for each [ ]1,0∈z . We determine
Figures 4.3 a), b), and c), the recall and precdetermined at 0.63 for a) Sales Potential, 0.5
ference on Industrial Engineering and Operations Manag6
for some adjectives with objective of identifying those VOes of )(wr and )(wws tend to have low values for the ns terrible, bad or not bad may indicate Sales Potential
1 Sample of Word Scores for Sales Potential
ailable for each Ww ∈ , the values of ),( vwn and TFhe VOC score )(vvs . The logit regression can then take
hich are determined with confidence level at 0.001 for ea
mated Coefficients ( with confidence level at 0.001 )
nd *1β , the logit value )(vLogit can be computed for
ugh )|( zvI given a segmentation level z . Accordingly*z so as to maximize the precision subject to the recall b
cision are exhibited as a function of z for the three class53 for b) Negative Attitude, and 0.44 for c) Urgency.
gement
OCs with Sales Potential. number of appearances in
since revenues are also
),( vw can be computed e place. Table 4.2 shows
ch of the three classes of
LDv ∈ , which in turn y, the confusion matrix is
being greater than 0.8. In
ses of VOCs, where *z is
551© IEOM Society International
Proceedings of the 2016 International ConfKuala Lumpur, Malaysia, March 8-10, 2016
Fig. 4.3 Recall
ference on Industrial Engineering and Operations Manag6
a) Sales Potential : 63.0* =z
b) Negative Attitude : 53.0* =z
c) Urgency : 44.0* =z
and Precision as a Function of Segmentation Level z
gement
552© IEOM Society International

Proceedings of the 2016 International Conference on Industrial Engineering and Operations Management Kuala Lumpur, Malaysia, March 8-10, 2016
For the class of VOCs with Sales Potential, Tables 4.4 a) and b) show the confusion matrices with 63.0* =z for LD and TD , respectively. Naturally, Recall ( 0.806 ) and Precision ( 0.889 ) for LD are higher than those values ( 0.771 and 0.755 ) for TD , since *z is determined based on LD . However, the values for TD are also quite high. If one chooses
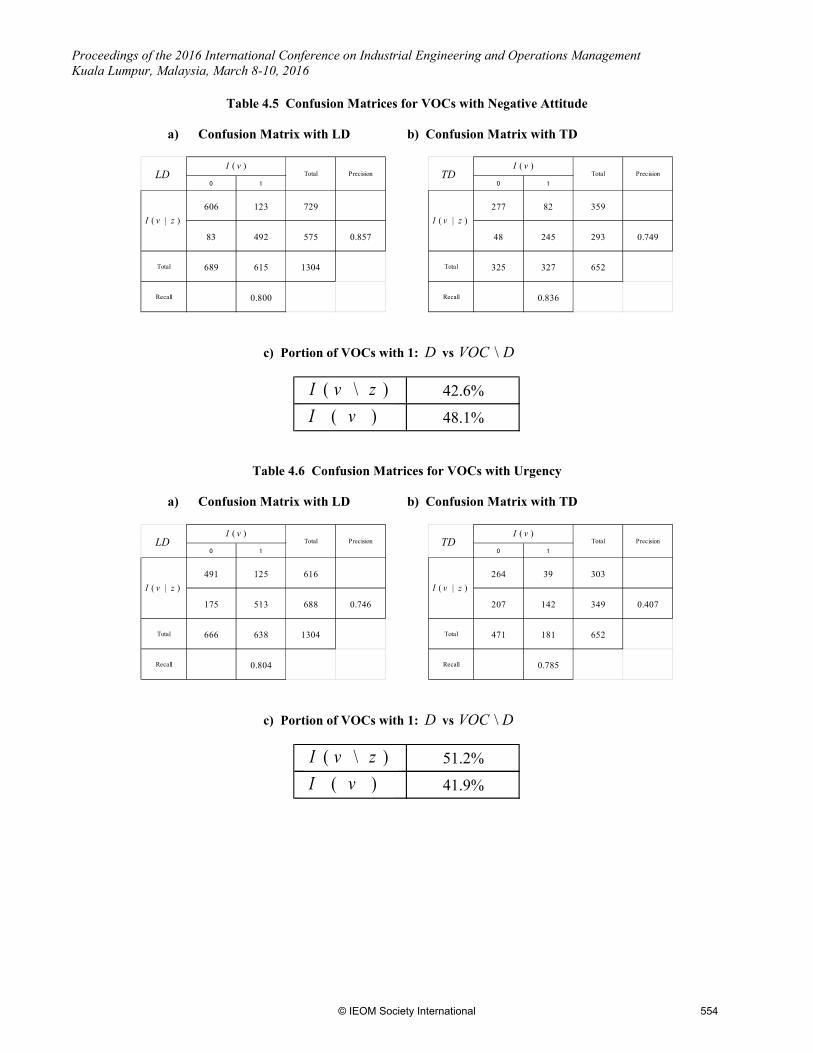
TDv ∈ at random, for example, and guess 1)( =vI , the probability of the guess being correct is 380/652=0.583. Accordingly, the probability of having 293 or more correct guesses out of 388 randomly chosen samples would be next to none, in comparison with 0.755 of Precision, correctly judging 293 out of the selection of 388. Consequently, the testing of the selection algorithm for Sales Potential is quite satisfactory. This claim is also supported indirectly by the figures in Table 4.4 c), where the application of the segmentation algorithm to the set DVOC \ results in judging 12698 VOCs with Sales Potential out of 22838 VOCs in DVOC \ , or 56.8 %. This figure is close to 55.6 %, the same ratio judged by actually reading those VOCs in D . The results for the class of VOCs with Negative Attitude are similar, as shown in Tables 4.5 a), b) and c), having Recall of 0.836 and Precision of 0.749 for TD , and 42.6 % against DVOC \ in comparison with 48.1 % in D . For the class of VOCs with Urgency, the segmentation algorithm works somewhat less effectively, as can be seen in Tables 4.6 a), b) and c). The corresponding figures are Recall of 0.785 and Precision of 0.407 for TD , and 51.2 % against
DVOC \ in comparison with 41.9 % in D . Perhaps this is so because it is difficult to figure out how desperately a caller feels Urgency by reading the content of the VOCs. Accordingly, the judgement of 1)( =vI by actual reading for the class of VOCs with Urgency may not be accurate.
Table 4.4 Confusion Matrices for VOCs with Sales Potential
a) Confusion Matrix with LD b) Confusion Matrix with TD
c) Portion of VOCs with 1: D vs DVOC \
0 1
422 155 577
81 646 727 0.889
Total 503 801 1304
Recall 0.806
PrecisionTotal)( vI
)|( zvI
LD0 1
177 87 264
95 293 388 0.755
Total 272 380 652
Recall 0.771
PrecisionTotal)( vI
)|( zvI
TD
56.8%
55.6%
)\( zvI)( vI
553© IEOM Society International
Proceedings of the 2016 International Conference on Industrial Engineering and Operations Management Kuala Lumpur, Malaysia, March 8-10, 2016
Table 4.5 Confusion Matrices for VOCs with Negative Attitude
a) Confusion Matrix with LD b) Confusion Matrix with TD
c) Portion of VOCs with 1: D vs DVOC \
Table 4.6 Confusion Matrices for VOCs with Urgency
a) Confusion Matrix with LD b) Confusion Matrix with TD
c) Portion of VOCs with 1: D vs DVOC \
0 1
606 123 729
83 492 575 0.857
Total 689 615 1304
Recall 0.800
PrecisionTotal)( vI
)|( zvI
LD0 1
277 82 359
48 245 293 0.749
Total 325 327 652
Recall 0.836
PrecisionTotal)( vI
)|( zvI
TD
42.6%
48.1%
)\( zvI)( vI
0 1
491 125 616
175 513 688 0.746
Total 666 638 1304
Recall 0.804
PrecisionTotal)( vI
)|( zvI
LD0 1
264 39 303
207 142 349 0.407
Total 471 181 652
Recall 0.785
PrecisionTotal)( vI
)|( zvI
TD
51.2%
41.9%
)\( zvI)( vI
554© IEOM Society International

Proceedings of the 2016 International Conference on Industrial Engineering and Operations Management Kuala Lumpur, Malaysia, March 8-10, 2016
V. CONCLUDING REMARKS This research has been conducted in collaboration with a housing equipment company. While the company has been
attempting to analyze the contents of VOC data gathered through its three call centers, laborious works necessary to extract meaningful information has prevented the success. Recently, the company developed an automated documentation system so that recorded voice calls could be converted into digitized texts, thereby opening a path for conducting the text mining analysis in an efficient manner. A joint task force team involving members of the company, and professors and graduate students of Keio Business School has been working together to take advantage of this opportunity. The joint collaboration has produced a variety of useful results, including the segmentation algorithm presented in this paper.
As demonstrated in Section 4, the segmentation algorithm enables one to identify those VOCs with sales potential, those with negative attitude and those with urgency with speed and accuracy. According, the company can select VOCs to be manually read and analyzed out of the massive volume of VOCs, thereby substantially reducing the cost necessary for extracting useful information from VOCs. In this paper, the analysis is restricted to casual callers. Apparently, it is of interest to expand the analysis to include professional callers. This expansion is in progress and will be reported elsewhere in due course.
ACKNOWLEGMENT This research is supported by MEXT Grand-in-Aid for Scientific Research (B) 25282086.
REFERENCES [1] F.Sebastiani, "Machine learning in automated text categorization." ACM computing surveys (CSUR) 34.1, pp.1-47, 2002. [2] C. Apte, F. Damerau and S. M. Weiss, "Automated learning of decision rules for text categorization." ACM Transactions on
Information Systems (TOIS) 12.3, pp.233-251, July 1994. [3] I. Androutsopoulos, et al., "An experimental comparison of naive Bayesian and keyword-based anti-spam filtering with personal
e-mail messages." Proceedings of the 23rd annual international ACM SIGIR conference on Research and development in information retrieval. ACM, 2000.
[4] M. Terachi, R. Saga and H. Tsuji, "Trends recognition in journal papers by text mining." Systems, Man and Cybernetics, 2006. SMC'06. IEEE International Conference on. Vol. 6. IEEE, 2006.
[5] R. Heeks, and S. Bailur, "Analyzing e-government research: Perspectives, philosophies, theories, methods, and practice." Government information quarterly 24.2, pp.243-265, 2007.
[6] Z. Irani, P. ED. Love and A. Montazemi, "E-government: past, present and future." European Journal of Information Systems 16.2, pp.103, 2007.
[7] N. Evangelopoulos and L. Visinescu, "Text-mining the voice of the people." Communications of the ACM 55.2, pp.62-69, 2012. [8] S. Das, and M. Chen, "Yahoo! for Amazon: Extracting market sentiment from stock message boards." Proceedings of the Asia Pacific
finance association annual conference (APFA), Vol. 35, 2001. [9] K. Dave, S. Lawrence and D. M. Pennock, "Mining the peanut gallery: Opinion extraction and semantic classification of product
reviews." Proceedings of the 12th international conference on World Wide Web. ACM, 2003. [10] M. Hu, and B. Liu "Mining and summarizing customer reviews." Proceedings of the tenth ACM SIGKDD international conference on
Knowledge discovery and data mining. ACM, 2004.
BIOGRAPHY Hiroaki Takagi graduated from Advanced Course in Industrial and Systems Engineering, Takamatsu National College of Technology in 2006, majoring in Electrical and Computer Engineering. After graduation, he worked for Hitachi Systems Ltd. for eight years, as a Technical Sales Person in IT Solution Sales Department and subsequently as a Chief in IT Product Procurement Department. In April 2014, he entered Graduate School of Business Administration, Keio University. He is currently a second year MBA student at Keio. His career goal is to establish his own IT company, providing powerful tools in big data analytics, in particular, in text mining and data mining to corporate clients. His research interest includes development of practical tools in big data analytics. Kaoru Ema graduated from Faculty of Commerce, Waseda University majoring in Corporate governance. After graduation, he worked f at HR division of Canon Marketing Japan Inc. He worked for organization management team and was responsible for quarterly organizational changes process support. In April 2014, he entered Graduate School of Business Administration, Keio University. He is currently a second year MBA student at Keio. He is working to develop the common template to identify the outstanding performer by interviewing with management and analysis of data. He would like to work as HR professional for international company in the future.
555© IEOM Society International
Proceedings of the 2016 International Conference on Industrial Engineering and Operations Management Kuala Lumpur, Malaysia, March 8-10, 2016
Ushio Sumita is a Research Project Professor at Graduate School of Business Administration, Keio University, Japan. Prior to joining Keio, he has worked for such universities as Graduate School of Systems and Information Engineering, University of Tsukuba, Japan, for which he is a Professor Emeritus, Graduate School of International Management, The International University of Japan, William E. Simon Graduate School of Business Administration, University of Rochester, U.S.A, and Department of Industrial Engineering and Operations Research, Syracuse University, U.S.A. With his first Ph.D. in 1981 from the University of Rochester, U.S.A. and his second Ph.D. in 1987 from the Tokyo Institute of Technology, Japan, he has a wide range of research interests in both theoretical and functional areas, including applied probability, stochastic processes, financial engineering, e-marketing, information and communication technology, production and logistics systems, organizational theory, and comparative analysis of global management approaches, among others. He has published more than 160 papers in leading archive journals in such areas. He also has extensive experiences in business consulting in both the United States and Japan. Takaki Hayashi is Professor of Management Science at Keio Business School. Previously, he was Assistant Professor of Statistics at Columbia University in the City of New York. He was also appointed as COE Visiting Associate Professor at the Graduate School of Mathematical Sciences, the University of Tokyo in 2004. Prior to joining academia, he worked as a financial engineer at the Industrial Bank of Japan, Ltd. His research interests are in statistical science for business and management, quantitative finance and financial econometrics, in particular statistical modeling and analysis of large-scale, high-frequency data. His research has appeared in a number of academic journals, including Bernoulli, Mathematical Finance, and Stochastic Processes and their Applications. He earned his Ph.D. in statistics from the University of Chicago. He earned his master's and bachelor's degrees in engineering from the University of Tokyo. He has been a Director of the Japanese Association of Financial Econometrics and Engineering (JAFEE) since 2006.
Masahiro Okada is a Professor of Strategic Management at the Graduate School of Business Administration, Keio University, Japan. He earned his Ph.D. in Business Administration from The Ohio State University in 1999. He also has an extensive working experience both as an administrator in Honda Motor Company and as a consultant in Arthur D. Little (Japan), a strategy consulting company. His research interests lie in the strategy theories and their application to business activities in emerging markets such as South East Asian countries and Sub-Sahara African countries. His current research topic includes how to measure the value of firm strategy not only in terms of economic value but also in terms of social value, which is the value generated by firms for stakeholders other than shareholders. His recent published articles include “Can Creating Shared Value Be a Source of Competitive Advantage? The Destination of a New View of the Firm” Diamond Harvard Business Review (Japanese edition) January 2015.
556© IEOM Society International


![Development of Sustainable Performance …ieomsociety.org/ieom_2016/pdfs/311.pdfpresent generation without compromising the ability of future generations to meet economy needs [1],](https://static.fdocuments.in/doc/165x107/5b0334b47f8b9a3c378be27b/development-of-sustainable-performance-generation-without-compromising-the-ability.jpg)


