Analysis of Variance and Design of...
23
MODULE X LECTURE - 39 EXERCISES Dr. Shalabh Department of Mathematics & Statistics Indian Institute of Technology Kanpur Analysis of Variance and Design of Experiments-II
Transcript of Analysis of Variance and Design of...

MODULE X
LECTURE - 39
EXERCISES
Dr. ShalabhDepartment of Mathematics & StatisticsIndian Institute of Technology Kanpur
Analysis of Variance and Design of Experiments-II
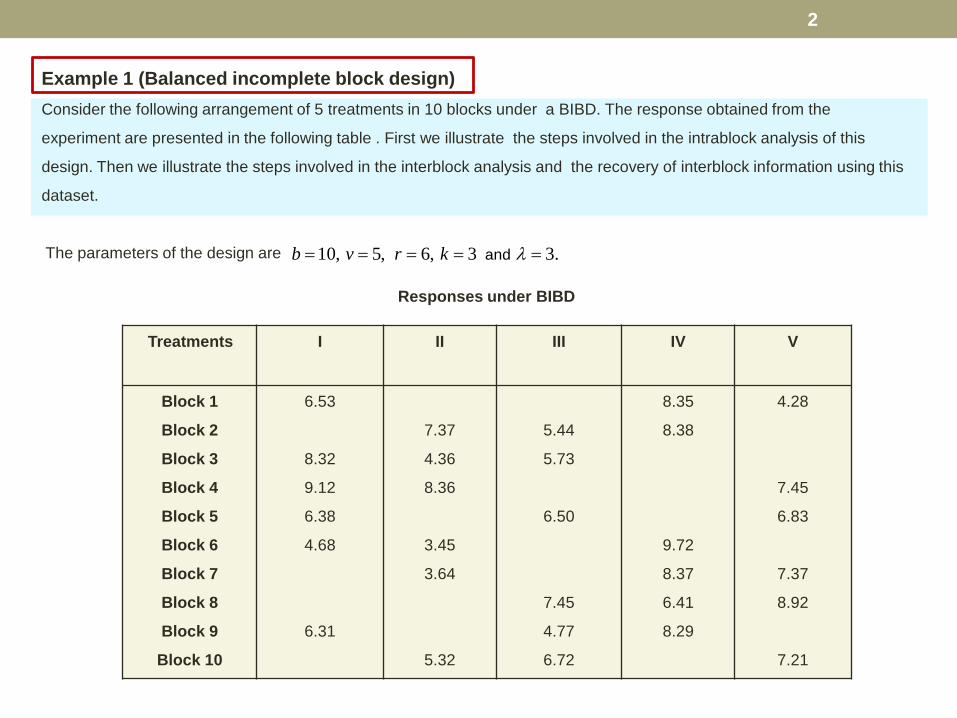
Example 1 (Balanced incomplete block design)Consider the following arrangement of 5 treatments in 10 blocks under a BIBD. The response obtained from the
experiment are presented in the following table . First we illustrate the steps involved in the intrablock analysis of this
design. Then we illustrate the steps involved in the interblock analysis and the recovery of interblock information using this
dataset.
The parameters of the design are
Responses under BIBD
10, 5, 6, 3 3.andb v r k λ= = = = =
Treatments I II III IV V
Block 1
Block 2
Block 3
Block 4
Block 5
Block 6
Block 7
Block 8
Block 9
Block 10
6.53
8.32
9.12
6.38
4.68
6.31
7.37
4.36
8.36
3.45
3.64
5.32
5.44
5.73
6.50
7.45
4.77
6.72
8.35
8.38
9.72
8.37
6.41
8.29
4.28
7.45
6.83
7.37
8.92
7.21
2

The block totals are obtained as the sum of responses in each of the block as follows:
1
2
3
4
5
6
7
8
9
6.53 8.35 4.28 19.16,
7.37 5.44 8.38 21.19,
8.32 4.36 5.73 18.41,
9.12 8.36 7.45 24.93,
6.38 6.50 6.83 19.71,
4.68 3.45 9.72 17.85,
3.64 8.37 7.37 19.38,
7.45 6.41 8.92 22.78,
6.31
B
B
B
B
B
B
B
B
B
= + + =
= + + =
= + + =
= + + =
= + + =
= + + =
= + + =
= + + =
= +
10
4.77 8.29 19.35,
5.32 6.72 7.21 19.25.B
+ =
= + + =
The treatment totals are obtained as the sum of responses corresponding to each treatment in various blocks as follows:
1
2
3
4
5
6.53 8.32 9.12 6.38 4.68 6.31 41.34,
7.37 4.36 8.36 3.45 3.64 5.32 32.50,
5.44 5.73 6.50 7.45 4.77 6.72 36.61
8.35 8.38 9.72 8.37 6.41 8.29 49.52
4.28 7.45 6.83 7.37 8.92 7.21 42.06,
V
V
V
V
V
= + + + + + =
= + + + + + =
= + + + + + =
= + + + + + =
= + + + + + =
and grand total (G) = 202.03
3

In this case, the diagonal an doff-diagonal elements of the C-matrix are
4 1 1 1 11 4 1 1 1
.1 1 4 1 11 1 1 4 11 1 1 1 4
C
− − − − − − − − = − − − − − − − − − − − −
respectively. Thus the C- Matrix is given as
'
66 ,3
3 , ',3
and
jj
jj
c
c j j
= −
= − ≠
The incidence matrix N indicating the presence of any treatment in the blocks is given by
1 0 1 1 1 1 0 0 1 00 1 1 1 0 1 1 0 0 10 1 1 0 1 0 0 1 1 11 1 0 0 0 1 1 1 1 01 0 0 1 1 0 1 1 0 1
N
=
4
This is obtained by observing the arrangement of the observations in the given BIBD.

Now the adjusted treatment totals are obtained as
10
1 11
10
2 21
10
3 31
4 4
19.16 18.41 24.93 19.71 17.85 19.35 119.41,
21.19 18.41 24.93 19.71 17.85 19.38 19.25 121.01,
21.19 18.41 19.71 22.78 19.35 19.25 120.71,
19.16 21.19
i ii
i ii
i ii
i i
T n B
T n B
T n B
T n B
=
=
=
= = + + + + + =
= = + + + + + + =
= = + + + + + =
= = +
∑
∑
∑10
1
10
5 51
17.85 19.38 22.78 19.25 119.73,
19.16 24.93 19.71 19.38 22.78 19.25 125.21.
i
i ii
T n B
=
=
+ + + + =
= = + + + + + =
∑
∑
11 1
22 2
33 3
44 4
55 5
1.53,
7.84,
3.63,
9.61,
0.32.
TQ VkTQ Vk
TQ VkTQ Vk
TQ Vk
= − =
= − = −
= − = −
= − =
= − =
5

The adjusted treatment sum of squares is
52
( )1
33.89,Treat adj jj
kSS Qvλ =
= =∑
the unadjusted block sum of squares is2 210
( )1
14.11,iBlock unadj
i
B GSSk bk=
= − =∑
the total sum of squares is
25 52
1 182.22,Total ij
i j
GSS ybk= =
= − =∑∑
and residual sum of squares
( ) ( ) ( ) 34.22.Error t Total Block unadj Treat adjSS SS SS SS= − − =
The test statistics for is0( ) 1 2 3 4 5:tH τ τ τ τ τ= = = =
52
1
( )
1. . 3.961
jj
TrError t
Qk bk b vFv v SSλ
=− − += =
−
∑
and is rejected at 5% level of significance.0.95,4.16 0( )3.01, so tF H=
6

The analysis of variance table in this case is obtained as follows.
Intrablock analysis of variance of BIBD for 0( ) 1 2 3 4 5: .tH τ τ τ τ τ= = = =
Source Sum of squares Degrees of
freedom
Mean squares F
Between treatments
(adjusted)
Between blocks
(unadjusted)
Intrablock error
33.89
14.11
34.22
(by Subtraction)
4
9
16
8.47
1.57
2.14
Total 82.22 29
3.96TrF =
The variance of an elementary contrast of treatments is estimated as
'
22ˆ ˆj j
kVvτ τ σ
λ− =
= 0.85
where is estimated by2σ ( )2ˆ1
2.14Error tSSbk b v
σ = =− − +
7

the unadjusted sum of squares due to treatments is obtained as
2 2
( )1
25.924,v
jTreat unadj
j j
V GSSr bk=
= − =∑
where the values of ’s and G are obtained from the calculations of intrablock analysis. The adjusted sum of squares
due to blocks is obtained as jV
( ) ( ) ( ) ( )
33.89 14.11 25.92 22.08.
Block adj Treat adj Block unadj Treat UnadjSS SS SS SS= + −
= + − =
So the adjusted mean squares due to blocks is
( )22.076 2.45
9Block adjMS = =
and thus
2( )
1ˆ [ )
0.11.
Block adjb MS MSE
bk vβσ−
= −−
=
8
Example (Continued, the interblock analysis and recovery of interblock information)Now we illustrate the interblock analysis and recovery of interblock information with the set up of Example 1.
From the intrablock analysis of variance, we find
2ˆ 2.14,σ =
and thus*
1 2*
1 2
ˆ ˆˆ 0.0638.ˆ ˆ( 1) ( )v k v kω ωωω ω−
= =− + −
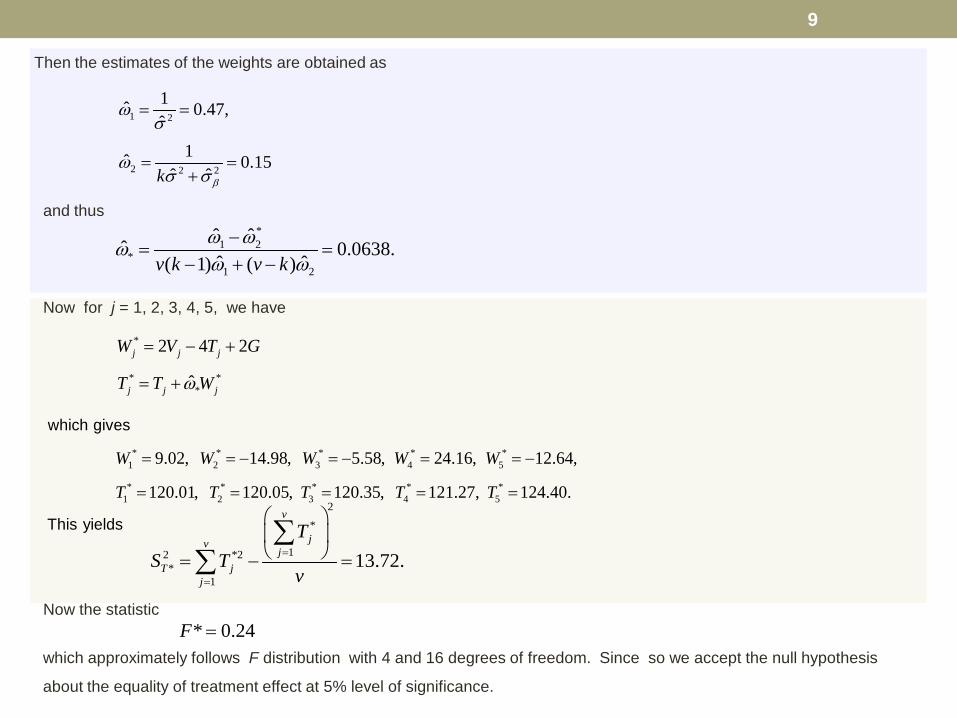
Now for j = 1, 2, 3, 4, 5, we have
*
* **
2 4 2
ˆ
j j j
j j j
W V T G
T T Wω
= − +
= +
* * * * *1 2 3 4 5
* * * * *1 2 3 4 5
9.02, 14.98, 5.58, 24.16, 12.64,
120.01, 120.05, 120.35, 121.27, 124.40.
which gives
This yields
W W W W W
T T T T T
= = − = − = = −
= = = = =2
*
12 *2*
113.72.
v
jvj
T jj
TS T
v=
=
= − =∑
∑Now the statistic
* 0.24F =
9
Then the estimates of the weights are obtained as
1 2
2 2 2
1ˆ 0.47,ˆ
1ˆ 0.15ˆ ˆk β
ωσ
ωσ σ
= =
= =+
which approximately follows F distribution with 4 and 16 degrees of freedom. Since so we accept the null hypothesis
about the equality of treatment effect at 5% level of significance.
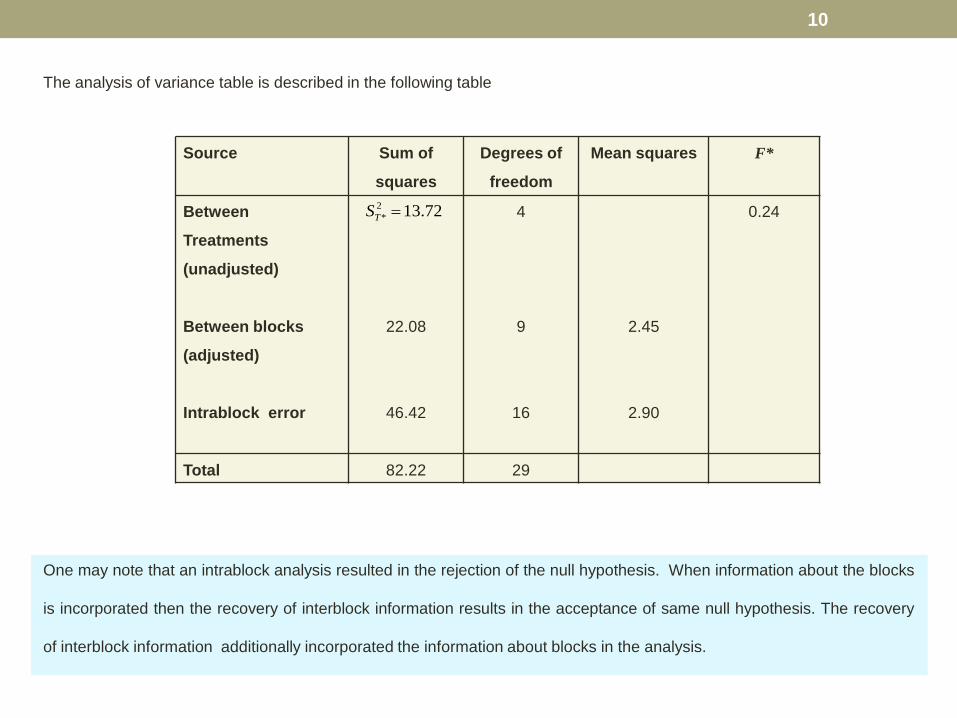
The analysis of variance table is described in the following table
Source Sum of
squares
Degrees of
freedom
Mean squares F*
Between
Treatments
(unadjusted)
Between blocks
(adjusted)
Intrablock error
22.08
46.42
4
9
16
2.45
2.90
0.24
Total 82.22 29
2* 13.72TS =
One may note that an intrablock analysis resulted in the rejection of the null hypothesis. When information about the blocks
is incorporated then the recovery of interblock information results in the acceptance of same null hypothesis. The recovery
of interblock information additionally incorporated the information about blocks in the analysis.
10
11
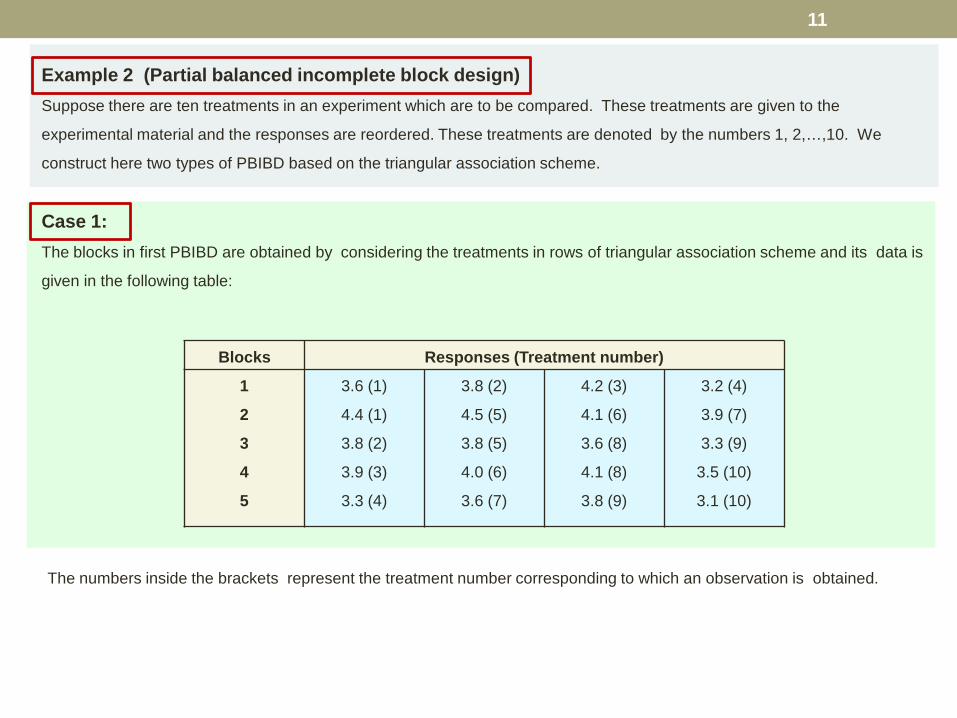
Example 2 (Partial balanced incomplete block design) Suppose there are ten treatments in an experiment which are to be compared. These treatments are given to the
experimental material and the responses are reordered. These treatments are denoted by the numbers 1, 2,…,10. We
construct here two types of PBIBD based on the triangular association scheme.
Case 1: The blocks in first PBIBD are obtained by considering the treatments in rows of triangular association scheme and its data is
given in the following table:
Blocks Responses (Treatment number)
1
2
3
4
5
3.6 (1)
4.4 (1)
3.8 (2)
3.9 (3)
3.3 (4)
3.8 (2)
4.5 (5)
3.8 (5)
4.0 (6)
3.6 (7)
4.2 (3)
4.1 (6)
3.6 (8)
4.1 (8)
3.8 (9)
3.2 (4)
3.9 (7)
3.3 (9)
3.5 (10)
3.1 (10)
The numbers inside the brackets represent the treatment number corresponding to which an observation is obtained.
12
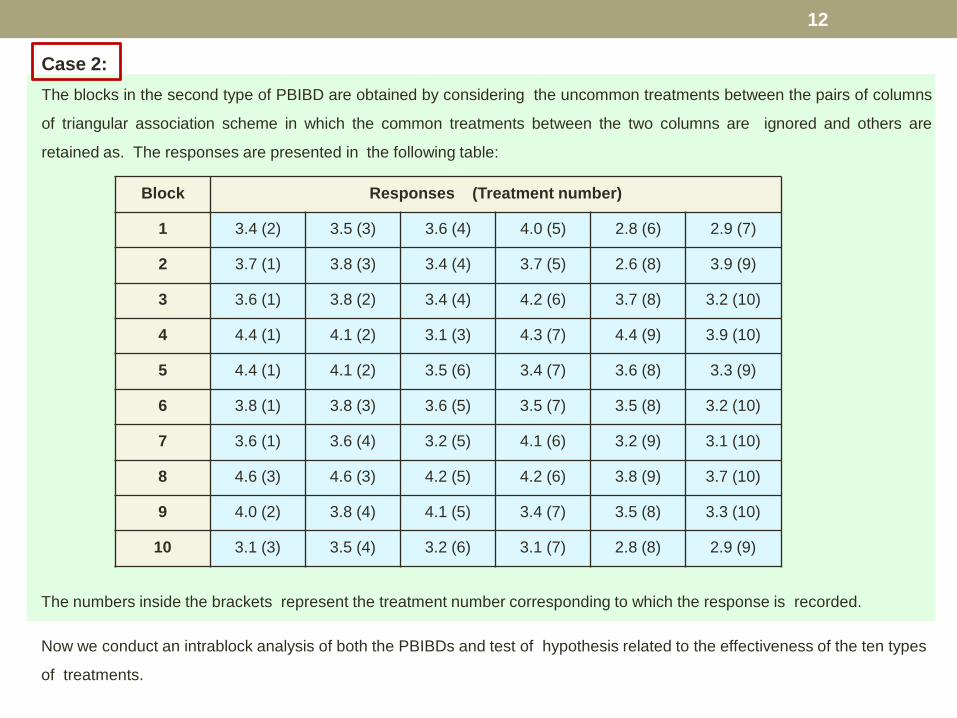
Case 2: The blocks in the second type of PBIBD are obtained by considering the uncommon treatments between the pairs of columns
of triangular association scheme in which the common treatments between the two columns are ignored and others are
retained as. The responses are presented in the following table:
Block Responses (Treatment number)
1 3.4 (2) 3.5 (3) 3.6 (4) 4.0 (5) 2.8 (6) 2.9 (7)
2 3.7 (1) 3.8 (3) 3.4 (4) 3.7 (5) 2.6 (8) 3.9 (9)
3 3.6 (1) 3.8 (2) 3.4 (4) 4.2 (6) 3.7 (8) 3.2 (10)
4 4.4 (1) 4.1 (2) 3.1 (3) 4.3 (7) 4.4 (9) 3.9 (10)
5 4.4 (1) 4.1 (2) 3.5 (6) 3.4 (7) 3.6 (8) 3.3 (9)
6 3.8 (1) 3.8 (3) 3.6 (5) 3.5 (7) 3.5 (8) 3.2 (10)
7 3.6 (1) 3.6 (4) 3.2 (5) 4.1 (6) 3.2 (9) 3.1 (10)
8 4.6 (3) 4.6 (3) 4.2 (5) 4.2 (6) 3.8 (9) 3.7 (10)
9 4.0 (2) 3.8 (4) 4.1 (5) 3.4 (7) 3.5 (8) 3.3 (10)
10 3.1 (3) 3.5 (4) 3.2 (6) 3.1 (7) 2.8 (8) 2.9 (9)
The numbers inside the brackets represent the treatment number corresponding to which the response is recorded.
Now we conduct an intrablock analysis of both the PBIBDs and test of hypothesis related to the effectiveness of the ten types
of treatments.

13
It may be noted that the allocation of ten treatments under the triangular association scheme can be done as follows:
The blocks resulting from this scheme gives rise to a PBIBD termed as PBIBD1 as follows:
Rows 1 2 3 4 5
Columns
1 1 2 3 4
2 1 5 6 7
3 2 5 8 9
4 3 6 8 10
5 4 7 9 10
××
××
×
Blocks Treatments
Block 1 1, 2, 3, 4
Block 2 1, 5, 6, 7
Block 3 2, 5, 8, 9
Block 4 3, 6, 8, 10
Block 5 4, 7, 9, 10
Blocks of PBIBD1
14
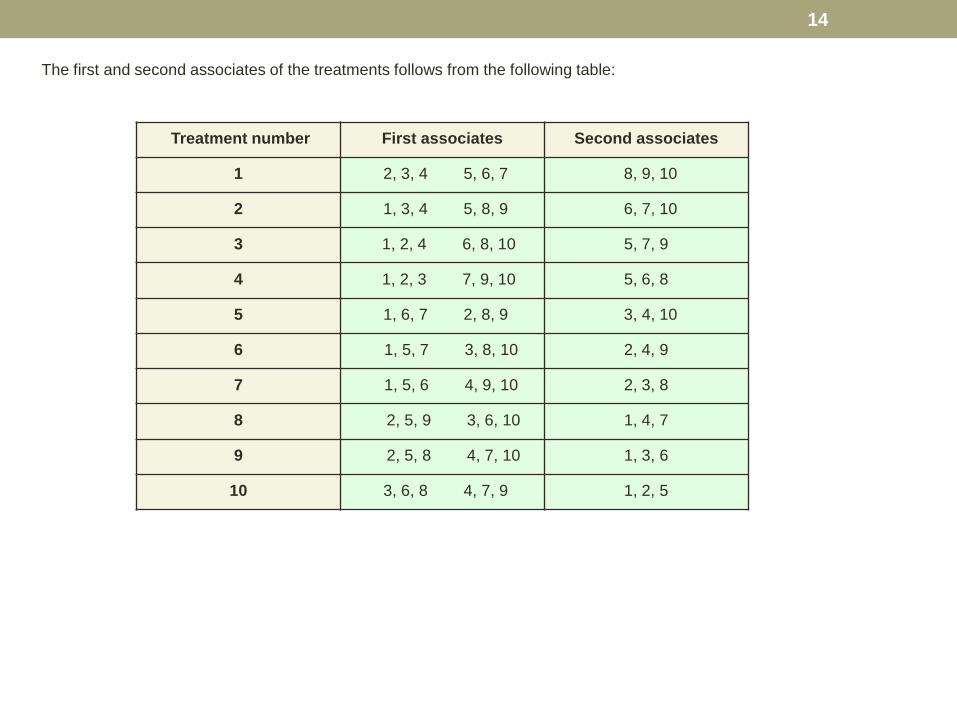
The first and second associates of the treatments follows from the following table:
Treatment number First associates Second associates
1 2, 3, 4 5, 6, 7 8, 9, 10
2 1, 3, 4 5, 8, 9 6, 7, 10
3 1, 2, 4 6, 8, 10 5, 7, 9
4 1, 2, 3 7, 9, 10 5, 6, 8
5 1, 6, 7 2, 8, 9 3, 4, 10
6 1, 5, 7 3, 8, 10 2, 4, 9
7 1, 5, 6 4, 9, 10 2, 3, 8
8 2, 5, 9 3, 6, 10 1, 4, 7
9 2, 5, 8 4, 7, 10 1, 3, 6
10 3, 6, 8 4, 7, 9 1, 2, 5

15
The blocks from these first and second associates are obtained as follows which gives rise to another PBIBD, termed as
PBIBD2Blocks of PBIBD2
Blocks Columns of
association scheme
Treatments
Block 1 (1, 2) 2, 3, 4, 5, 6, 7
Block 2 (1, 3) 1, 3, 4, 5, 8, 9
Block 3 (1, 4) 1, 2, 4, 6, 8, 10
Block 4 (1, 5) 1, 2, 3, 7, 9, 10
Block 5 (2, 3) 1, 2, 6, 7, 8, 9
Block 6 (2, 4) 1, 3, 5, 7, 8, 10
Block 7 (2, 5) 1, 4, 5, 6, 9, 10
Block 8 (3, 4) 2, 3, 5, 6, 9, 10
Block 9 (3, 5) 2, 4, 5, 7, 8, 10
Block 10 (4, 5) 3, 4, 6, 7, 8, 9

16
Analysis of PBIBD1
The parameters of this PBIBD1 are .
Other related values are
The diagonal elements of C-matrix are
and the off-diagonal elements of C-matrix are
The block totals are obtained as the sum of responses from a particular block
1 25, 10, 2, 4, 1 0.b v r k λ λ= = = = = =and
1 2 1 2
3 2 4 26, 3, .
2 1 2 0n n P P = = = =
and
( 1) 3 ( 1,2,...,10)2ij
r kc jk−
= = =
1
' '1 2
1 , '41
0, ' ' 1, 2,...,10).
the
the
if treaments and are the first associates
if treaments and are the second associates (
b
jj ij iji
j jk
c n nk
j j j jk
λ
λ=
− = −= − = − = ≠ =
∑
1
2
3
4
5
3.6 3.8 4.2 3.2 14.8,
4.4 4.5 4.1 3.9 16.9,
3.8 3.8 3.6 3.3 14.5,
3.9 4.0 4.1 3.5 15.5,
3.3 3.6 3.8 3.1 13.8.
B
B
B
B
B
= + + + =
= + + + =
= + + + =
= + + + =
= + + + =

17
The treatment totals are obtained as the sum of responses for a given treatment as follows:
1
2
3
4
5
6
7
8
9
10
3.6 4.4 8.0,3.8 3.8 7.6,4.2 3.9 8.1,3.2 3.3 6.5,4.5 3.8 8.8,4.1 4.0 8.1,3.9,3.6 7.5,3.6 4.1 7.7,3.3 3.8 7.1,3.5 3.1 6.6.
VVVVVVVVVV
= + == + == + == + == + == + == == + == + == + =
The values of (sum of block totals in which jth treatment occurs) are obtained as follows:**jT
**1 1 2
**2 1 3
**3 1 4
**4 1 5
**5 2 3
**6 2 4
**7 2 5
**8 3 4
**9 3 5
**10 4 5
31.7,
29.3,
30.3,
28.6,
31.4,
32.4,
30.7,
30.0,
28.3,
29.3.
T B B
T B B
T B B
T B B
T B B
T B B
T B B
T B B
T B B
T B B
= + =
= + =
= + =
= + =
= + =
= + =
= + =
= + =
= + =
= + =

18
The values of are obtained as follows: jQ
**1
1 1
**2
1 2
**3
3 3
**4
4 4
**5
5 5
**6
6 6
**7
7 7
**8
8 8
**9
9 9
**10
10 10
0.08,
0.27,
0.53,
0.75,
0.45,
0,
0.17,
0.20,
0.02,
0.72.
TQ Vk
TQ Vk
TQ Vk
TQ Vk
TQ Vk
TQ Vk
TQ Vk
TQ Vk
TQ Vk
TQ Vk
= − =
= − =
= − =
= − = −
= − =
= − =
= − = −
= − =
= − =
= − = −
19
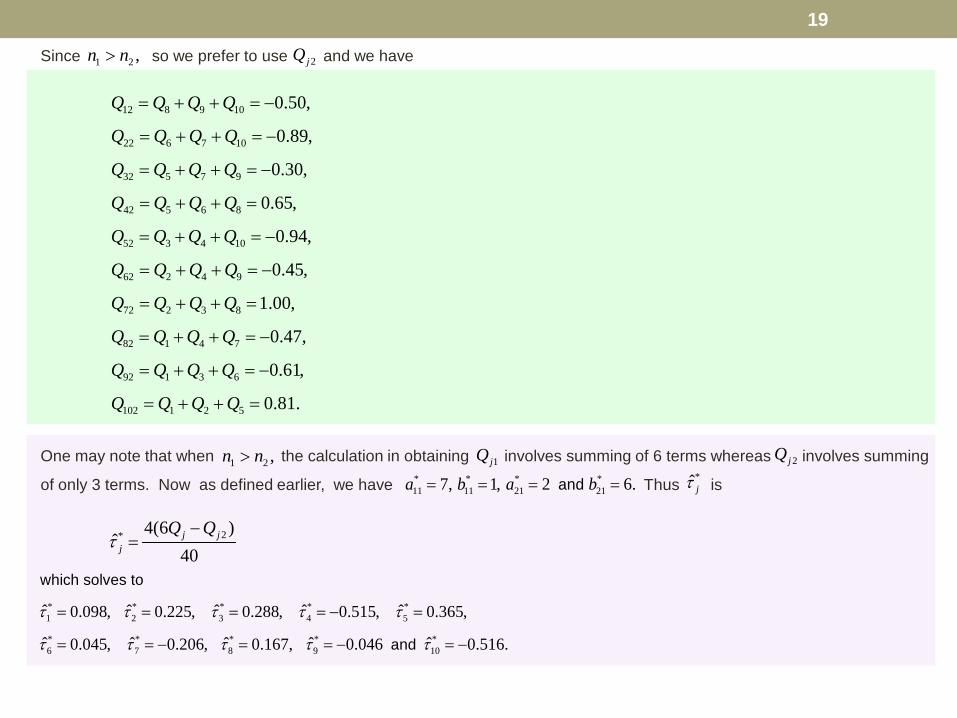
Since so we prefer to use and we have1 2 ,n n> 2jQ
12 8 9 10
22 6 7 10
32 5 7 9
42 5 6 8
52 3 4 10
62 2 4 9
72 2 3 8
82 1 4 7
92 1 3 6
102 1 2 5
0.50,
0.89,
0.30,
0.65,
0.94,
0.45,
1.00,
0.47,
0.61,
0.81.
Q Q Q Q
Q Q Q Q
Q Q Q Q
Q Q Q Q
Q Q Q Q
Q Q Q Q
Q Q Q Q
Q Q Q Q
Q Q Q Q
Q Q Q Q
= + + = −
= + + = −
= + + = −
= + + =
= + + = −
= + + = −
= + + =
= + + = −
= + + = −
= + + =
One may note that when the calculation in obtaining involves summing of 6 terms whereas involves summing
of only 3 terms. Now as defined earlier, we have Thus is1 2 ,n n> 1jQ 2jQ
* * * *11 11 21 217, 1, 2 6.and a b a b= = = = *ˆ jτ
2* 4(6 )ˆ
40j j
j
Q Qτ
−=
* * * * *1 2 3 4 5
* * * * *6 7 8 9 10
ˆ ˆ ˆ ˆ ˆ0.098, 0.225, 0.288, 0.515, 0.365,
ˆ ˆ ˆ ˆ ˆ0.045, 0.206, 0.167, 0.046 0.516.
which solves to
and
τ τ τ τ τ
τ τ τ τ τ
= = = = − =
= = − = = − = −

20
( )1
2 2
( )1
ˆ 1.215,
1.385,
The adjusted sum of squares due to treatments is
the unadjusted sum of squares due to blocks is
the total sum of
v
Treat adj j jj
bi
Block unadji
SS Q
B GSSk bk
τ=
=
= =
= − =
∑
∑
22
1 1
( ) ( ) ( )
2.798,
0.198.
squares is
and thesum of squares due to error is
Thus the -statistic is
b v
Total iji j
Error t Total Block unadj Treat adj
TTr
F
GSS ybk
SS SS SS SS
SSF
= =
= − =
= − − =
=
∑∑
( )
( )
0.05;9,6
/ ( 1). 4.09,
/ ( 1)
4.10,and so reject the null hypothesis at 5% level of significance.
reat adj
Error unadj
vSS bk b v
F
−=
− − +
=

21
The corresponding analysis of variance table of data in PBIBD1 is given as follows:
Source Sum of
squares
Degrees of
freedom
Mean squares F
Between treatments (adjusted)
Between blocks (unadjusted)
Intrablock error
1.385
1.215
0.198
4
9
6
0.135
0.033
4.091
Total 2.798 19
22
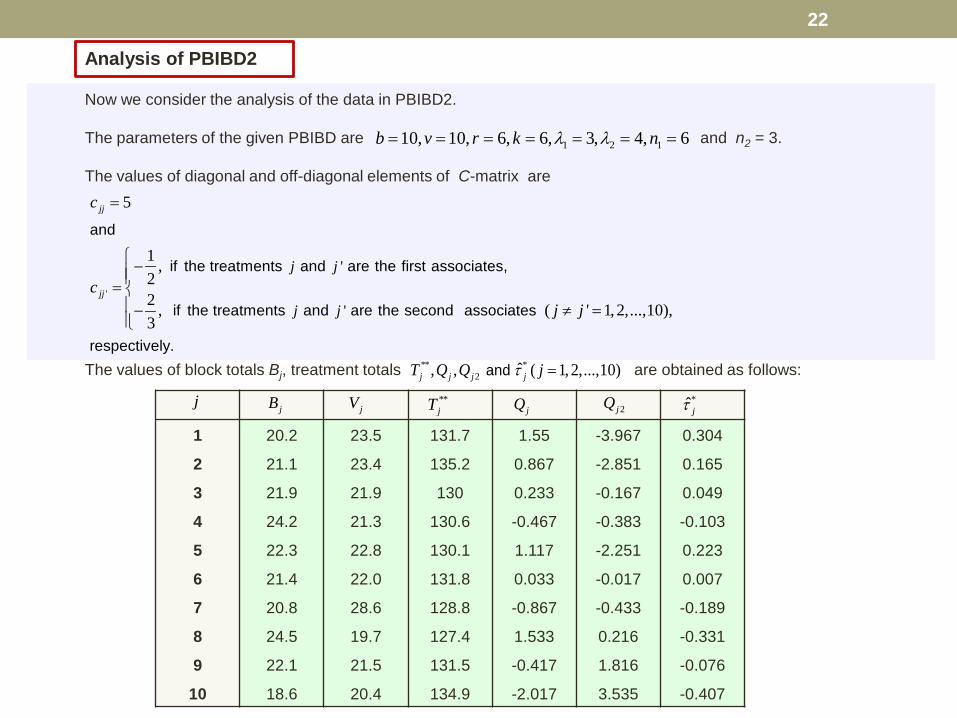
Analysis of PBIBD2
Now we consider the analysis of the data in PBIBD2.
The parameters of the given PBIBD are and n2 = 3.
The values of diagonal and off-diagonal elements of C-matrix are
1 2 110, 10, 6, 6, 3, 4, 6b v r k nλ λ= = = = = = =
'
'
'
5
1 ,22 , ( ' 1, 2,...,10),3
and
if the treatments and are the first associates,
if the treatments and are the second associates
respectively.
jj
jj
j j
j j
c
cj j
=
−= − ≠ =
The values of block totals Bj, treatment totals are obtained as follows:
1
2
3
4
5
6
7
8
9
10
20.2
21.1
21.9
24.2
22.3
21.4
20.8
24.5
22.1
18.6
23.5
23.4
21.9
21.3
22.8
22.0
28.6
19.7
21.5
20.4
131.7
135.2
130
130.6
130.1
131.8
128.8
127.4
131.5
134.9
1.55
0.867
0.233
-0.467
1.117
0.033
-0.867
1.533
-0.417
-2.017
-3.967
-2.851
-0.167
-0.383
-2.251
-0.017
-0.433
0.216
1.816
3.535
0.304
0.165
0.049
-0.103
0.223
0.007
-0.189
-0.331
-0.076
-0.407
j jB jV **jT jQ 2jQ *ˆ jτ
** *2 ˆ, , ( 1, 2,...,10)andj j j jT Q Q jτ =
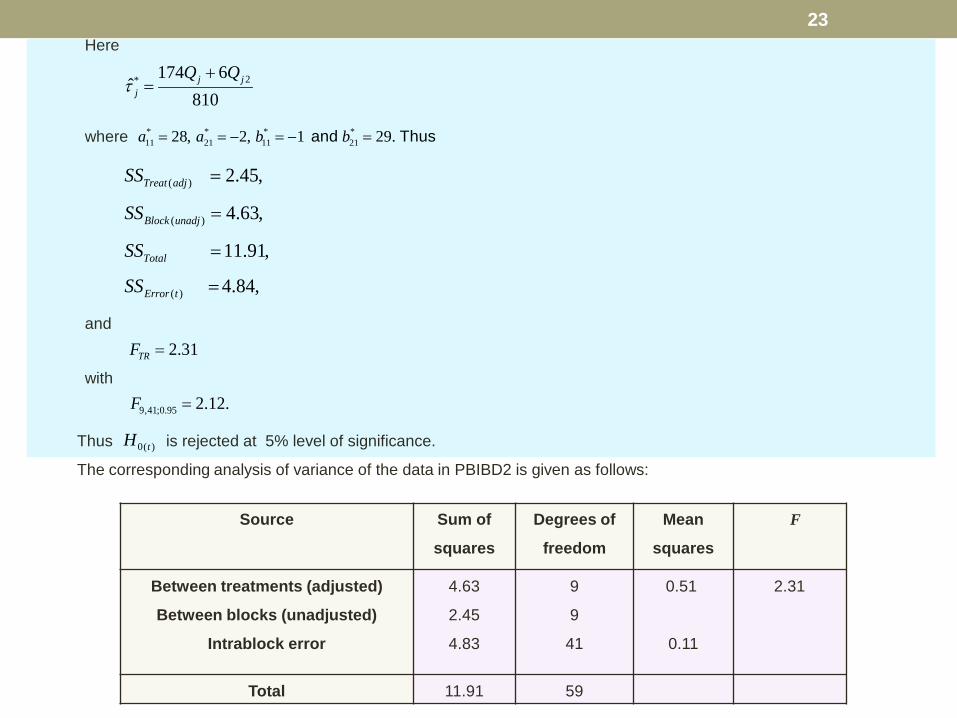
23Here
2* 174 6ˆ
810j j
j
Q Qτ
+=
where * * * *11 21 11 2128, 2, 1 29.and Thusa a b b= = − = − =
( )
( )
( )
2.45,
4.63,
11.91,
4.84,
Treat adj
Block unadj
Total
Error t
SS
SS
SS
SS
=
=
=
=
and2.31TRF =
with
9,41;0.95 2.12.F =
Thus is rejected at 5% level of significance.
The corresponding analysis of variance of the data in PBIBD2 is given as follows: 0( )tH
Source Sum of
squares
Degrees of
freedom
Mean
squares
F
Between treatments (adjusted)
Between blocks (unadjusted)
Intrablock error
4.63
2.45
4.83
9
9
41
0.51
0.11
2.31
Total 11.91 59