Analysis of Tourism Dynamics and Special Events … · Analysis of Tourism Dynamics and Special...
6
Cite as: Y. Leng, A. Noriega, A.S. Pentland, I. Winder, N. Lutz and L. Alonso: ”Analysis of Tourism Dynamics and Special Events through Mobile Phone Metadata”. 2016. Proceedings of Data for Good Exchange (D4GX) 2016. New York, NY. Analysis of Tourism Dynamics and Special Events through Mobile Phone Metadata Yan Leng MIT Media Lab Cambridge, MA [email protected] Alejandro Noriega MIT Media Lab Cambridge, MA [email protected] Alex ’Sandy’ Pentland MIT Media Lab Cambridge, MA [email protected] Ira Winder MIT Media Lab Cambridge, MA [email protected] Nina Lutz MIT Media Lab Cambridge, MA [email protected] Luis Alonso MIT Media Lab Cambridge, MA [email protected] ABSTRACT Tourism has been an increasingly important factor in global economy, society and environment, accounting for a signifi- cant share of GDP and labor force. Policy and research on tourism traditionally rely on surveys and economic datasets, which are based on small samples and depict tourism dy- namics at low spatial and temporal granularity. Anonymous call detail records (CDRs) are a novel source of data, show- ing enormous potential in areas of high societal value: such as epidemics, poverty, and urban development. This study demonstrates the added value of using CDRs for the formu- lation, analysis and evaluation of tourism strategies, at the national and local levels. In the context of the European country of Andorra, we use CDRs to evaluate marketing strategies in tourism, understand tourists’ experiences, and evaluate revenues and externalities generated by touristic events. We do this by extracting novel indicators in high spa- tial and temporal resolutions, such as tourist flows per coun- try of origin, flows of new tourists, tourist revisits, tourist externalities on transportation congestion, spatial distribu- tion, economic impact, and profiling of tourist interests. We exemplify the use of these indicators for the planning and evaluation of high impact touristic events, such as cultural festivals and sports competitions. 1 Keywords Tourism planning; Mobile phone records; Data mining; Events analytics; Indicators 1. INTRODUCTION Tourism has been an increasingly important factor in global economy, society and environment, accounting for a signif- icant share of GDP and labor force [23, 26]. Economists and governments have been attempting to understand the contribution and impact of tourism to economy for years [5, 24]. The growing importance of event tourism, an ap- plied field devoted to understanding and improving tourism 1 This paper is a draft for submission for Data for Good Exchange (2016). The improvements in synthesis, analysis and writing are yet to be implemented throughout. Bloomberg Data for Good Exchange Conference. 25-Sep-2016, New York City, NY, USA. through events, have resulted in substantial global competi- tion and generated values for both public and private sectors [17]. Research on events and tourism planning, operation and marketing have grown exponentially since 2008, which involves accommodation, attraction, transport and ancillary services[18]. The success of tourism events expand the po- tential of tourism and the capacity of the tourism area to step beyond a narrow leisure-based tourism [18]. Most tourism and events analytics literatures are based on surveys, interviews, observations or focus group studies [18, 13, 6, 14]. Pettersson (2009) [22] studied the spatial and temporal nature of event experiences through interviews, participant observation and photography at a major sport- ing event in Sweden, contributing to a better understanding of how visitors interact with the event setting and with each other, and help build theory on experiences. Li (2008) [20] conducted two-phase online surveys with six-month interval to analyze first- time and repeat visitors via demographic characteristics, travel planning behavior, pre and post-trip congruency in travel activity preferences, and post-trip eval- uation on first-time and repeated visitors. However, these studies are small in size, unrepresentative, low in spatial- temporal resolutions, and unable to measure travel experi- ences. In recent years, big data, mobile sensors and social media, generated many incredible opportunities for its supposed capacity to provide answers for questions related to trav- elers’ behaviors and experiences [4]. Applying big data in tourism has the following advantages: larger reliability than self-reported data and intentions; easier to cross-reference with other data based on the geo-spatial information; more knowledge about the industry’s target market producted by the customers themselves. Birenboim (2016) [9] tracked 25 students with an mobile application, which triggers up to three micro-surveys an hour for subjective evaluation of mo- mentary sense of crowdedness and sense of security. Wood (2013) [28] combined field investigation and Flickr data, showing that Flickr data can be used to understand what elements of nature attract tourists and how this would alter visiting behaviors. Bassolas (2016) [7] analyzed the attrac- tiveness of tourists sites using geopositioned twitter. Large-scale geo-located Information and Communication Tech- arXiv:1610.08342v1 [cs.CY] 26 Oct 2016
Transcript of Analysis of Tourism Dynamics and Special Events … · Analysis of Tourism Dynamics and Special...

Cite as: Y. Leng, A. Noriega, A.S. Pentland, I. Winder, N. Lutz and L. Alonso: ”Analysis of Tourism Dynamics and SpecialEvents through Mobile Phone Metadata”. 2016. Proceedings of Data for Good Exchange (D4GX) 2016. New York, NY.
Analysis of Tourism Dynamics and Special Events throughMobile Phone Metadata
Yan LengMIT Media LabCambridge, MA
Alejandro NoriegaMIT Media LabCambridge, [email protected]
Alex ’Sandy’ PentlandMIT Media LabCambridge, [email protected]
Ira WinderMIT Media LabCambridge, MA
Nina LutzMIT Media LabCambridge, MA
Luis AlonsoMIT Media LabCambridge, [email protected]
ABSTRACTTourism has been an increasingly important factor in globaleconomy, society and environment, accounting for a signifi-cant share of GDP and labor force. Policy and research ontourism traditionally rely on surveys and economic datasets,which are based on small samples and depict tourism dy-namics at low spatial and temporal granularity. Anonymouscall detail records (CDRs) are a novel source of data, show-ing enormous potential in areas of high societal value: suchas epidemics, poverty, and urban development. This studydemonstrates the added value of using CDRs for the formu-lation, analysis and evaluation of tourism strategies, at thenational and local levels. In the context of the Europeancountry of Andorra, we use CDRs to evaluate marketingstrategies in tourism, understand tourists’ experiences, andevaluate revenues and externalities generated by touristicevents. We do this by extracting novel indicators in high spa-tial and temporal resolutions, such as tourist flows per coun-try of origin, flows of new tourists, tourist revisits, touristexternalities on transportation congestion, spatial distribu-tion, economic impact, and profiling of tourist interests. Weexemplify the use of these indicators for the planning andevaluation of high impact touristic events, such as culturalfestivals and sports competitions. 1
KeywordsTourism planning; Mobile phone records; Data mining; Eventsanalytics; Indicators
1. INTRODUCTIONTourism has been an increasingly important factor in globaleconomy, society and environment, accounting for a signif-icant share of GDP and labor force [23, 26]. Economistsand governments have been attempting to understand thecontribution and impact of tourism to economy for years[5, 24]. The growing importance of event tourism, an ap-plied field devoted to understanding and improving tourism
1This paper is a draft for submission for Data for GoodExchange (2016). The improvements in synthesis, analysisand writing are yet to be implemented throughout.
Bloomberg Data for Good Exchange Conference.25-Sep-2016, New York City, NY, USA.
through events, have resulted in substantial global competi-tion and generated values for both public and private sectors[17]. Research on events and tourism planning, operationand marketing have grown exponentially since 2008, whichinvolves accommodation, attraction, transport and ancillaryservices[18]. The success of tourism events expand the po-tential of tourism and the capacity of the tourism area tostep beyond a narrow leisure-based tourism [18].
Most tourism and events analytics literatures are based onsurveys, interviews, observations or focus group studies [18,13, 6, 14]. Pettersson (2009) [22] studied the spatial andtemporal nature of event experiences through interviews,participant observation and photography at a major sport-ing event in Sweden, contributing to a better understandingof how visitors interact with the event setting and with eachother, and help build theory on experiences. Li (2008) [20]conducted two-phase online surveys with six-month intervalto analyze first- time and repeat visitors via demographiccharacteristics, travel planning behavior, pre and post-tripcongruency in travel activity preferences, and post-trip eval-uation on first-time and repeated visitors. However, thesestudies are small in size, unrepresentative, low in spatial-temporal resolutions, and unable to measure travel experi-ences.
In recent years, big data, mobile sensors and social media,generated many incredible opportunities for its supposedcapacity to provide answers for questions related to trav-elers’ behaviors and experiences [4]. Applying big data intourism has the following advantages: larger reliability thanself-reported data and intentions; easier to cross-referencewith other data based on the geo-spatial information; moreknowledge about the industry’s target market producted bythe customers themselves. Birenboim (2016) [9] tracked 25students with an mobile application, which triggers up tothree micro-surveys an hour for subjective evaluation of mo-mentary sense of crowdedness and sense of security. Wood(2013) [28] combined field investigation and Flickr data,showing that Flickr data can be used to understand whatelements of nature attract tourists and how this would altervisiting behaviors. Bassolas (2016) [7] analyzed the attrac-tiveness of tourists sites using geopositioned twitter.
Large-scale geo-located Information and Communication Tech-
arX
iv:1
610.
0834
2v1
[cs
.CY
] 2
6 O
ct 2
016
Cite as: Y. Leng, A. Noriega, A.S. Pentland, I. Winder, N. Lutz and L. Alonso: ”Analysis of Tourism Dynamics and SpecialEvents through Mobile Phone Metadata”. 2016. Proceedings of Data for Good Exchange (D4GX) 2016. New York, NY.
nology, such as Call Detail Records collected from mobilephones, created new ways to understand the interconnect-edness among travelers, social events, urban infrastructures[7]. It has been the most salient source of information, elicit-ing large-scale patterns of human mobility [11]. CDRs havebeen applied various fields, such as mobility modeling [3],epidemics [15], disaster response [10]. However, this large-scale and longitudinal data source has seldom been used intourism analytics. In this study, we demonstrate how to uti-lize mobile phone data to evaluate tourism marketing strate-gies, understand tourists’ experiences, evaluate revenues andexternalities generated by tourism.
This paper contributes and adds value to tourism planningand event analytics by novel indicators extracted from mo-bile phone records. With higher spatial-temporal resolu-tions comparing with self-reported surveys, CDRs revealsmore insights and improved knowledge into various aspectsof tourism industry. We extract various indicators, includ-ing tourists flows per country of origin, dynamics of newtourists, flows of revisits, tourists externalities due to con-gestion, spatial distribution, economic impacts and profilingof tourists interests. These indicators help other industriesto enhance services they offer and the management. Thestudy can be replicated in other regions and sectors aidingbetter decision-makings. In the context of Andorra, we useCDRs to evaluate marketing strategies in tourism, under-stand tourists’ experiences, and evaluate revenues and ex-ternalities generated by touristic events. We exemplify theuse of these indicators for the planning and evaluation ofhigh impact touristic events in 2015, such as cultural festi-vals and sports competitions.
The remaining of the paper is structured as follows: Section2 introduces the context of Andorra and the data used in thisstudy. Section 4 describes the novel indicators extracted mo-bile phone records. Section 5 summaries the performances ofevents. Finally, section 6 concludes this study and discussesfuture works.
2. ANDORRA AND DATAIn this section, we briefly introduce the context of Andorraand the data used to conduct the study.
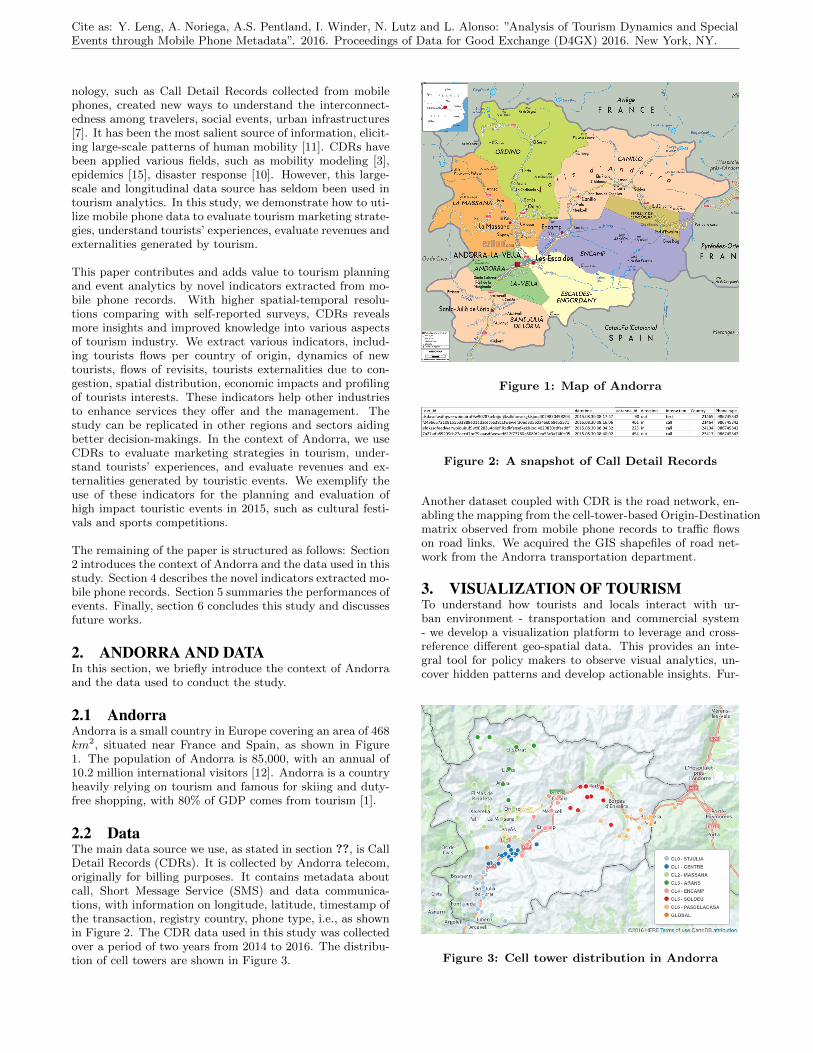
2.1 AndorraAndorra is a small country in Europe covering an area of 468km2, situated near France and Spain, as shown in Figure1. The population of Andorra is 85,000, with an annual of10.2 million international visitors [12]. Andorra is a countryheavily relying on tourism and famous for skiing and duty-free shopping, with 80% of GDP comes from tourism [1].
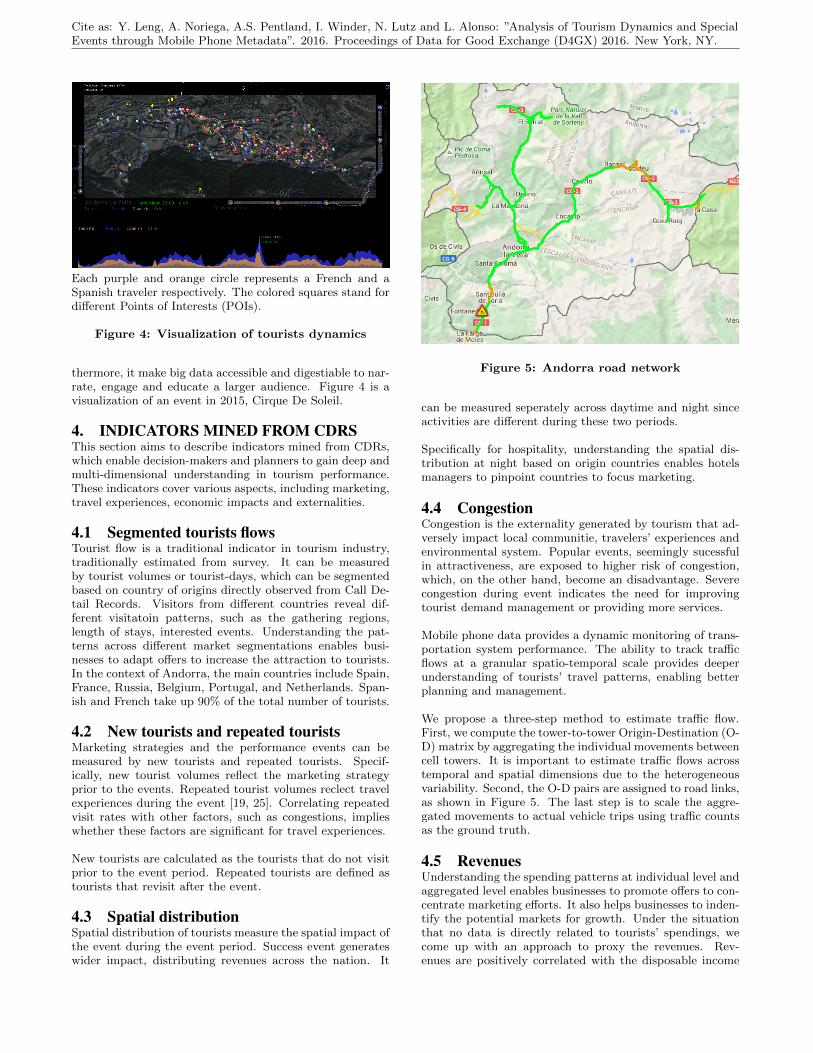
2.2 DataThe main data source we use, as stated in section ??, is CallDetail Records (CDRs). It is collected by Andorra telecom,originally for billing purposes. It contains metadata aboutcall, Short Message Service (SMS) and data communica-tions, with information on longitude, latitude, timestamp ofthe transaction, registry country, phone type, i.e., as shownin Figure 2. The CDR data used in this study was collectedover a period of two years from 2014 to 2016. The distribu-tion of cell towers are shown in Figure 3.
Figure 1: Map of Andorra
Figure 2: A snapshot of Call Detail Records
Another dataset coupled with CDR is the road network, en-abling the mapping from the cell-tower-based Origin-Destinationmatrix observed from mobile phone records to traffic flowson road links. We acquired the GIS shapefiles of road net-work from the Andorra transportation department.
3. VISUALIZATION OF TOURISMTo understand how tourists and locals interact with ur-ban environment - transportation and commercial system- we develop a visualization platform to leverage and cross-reference different geo-spatial data. This provides an inte-gral tool for policy makers to observe visual analytics, un-cover hidden patterns and develop actionable insights. Fur-
Figure 3: Cell tower distribution in Andorra
Cite as: Y. Leng, A. Noriega, A.S. Pentland, I. Winder, N. Lutz and L. Alonso: ”Analysis of Tourism Dynamics and SpecialEvents through Mobile Phone Metadata”. 2016. Proceedings of Data for Good Exchange (D4GX) 2016. New York, NY.
Each purple and orange circle represents a French and aSpanish traveler respectively. The colored squares stand fordifferent Points of Interests (POIs).
Figure 4: Visualization of tourists dynamics
thermore, it make big data accessible and digestiable to nar-rate, engage and educate a larger audience. Figure 4 is avisualization of an event in 2015, Cirque De Soleil.
4. INDICATORS MINED FROM CDRSThis section aims to describe indicators mined from CDRs,which enable decision-makers and planners to gain deep andmulti-dimensional understanding in tourism performance.These indicators cover various aspects, including marketing,travel experiences, economic impacts and externalities.
4.1 Segmented tourists flowsTourist flow is a traditional indicator in tourism industry,traditionally estimated from survey. It can be measuredby tourist volumes or tourist-days, which can be segmentedbased on country of origins directly observed from Call De-tail Records. Visitors from different countries reveal dif-ferent visitatoin patterns, such as the gathering regions,length of stays, interested events. Understanding the pat-terns across different market segmentations enables busi-nesses to adapt offers to increase the attraction to tourists.In the context of Andorra, the main countries include Spain,France, Russia, Belgium, Portugal, and Netherlands. Span-ish and French take up 90% of the total number of tourists.
4.2 New tourists and repeated touristsMarketing strategies and the performance events can bemeasured by new tourists and repeated tourists. Specif-ically, new tourist volumes reflect the marketing strategyprior to the events. Repeated tourist volumes reclect travelexperiences during the event [19, 25]. Correlating repeatedvisit rates with other factors, such as congestions, implieswhether these factors are significant for travel experiences.
New tourists are calculated as the tourists that do not visitprior to the event period. Repeated tourists are defined astourists that revisit after the event.
4.3 Spatial distributionSpatial distribution of tourists measure the spatial impact ofthe event during the event period. Success event generateswider impact, distributing revenues across the nation. It
Figure 5: Andorra road network
can be measured seperately across daytime and night sinceactivities are different during these two periods.
Specifically for hospitality, understanding the spatial dis-tribution at night based on origin countries enables hotelsmanagers to pinpoint countries to focus marketing.
4.4 CongestionCongestion is the externality generated by tourism that ad-versely impact local communitie, travelers’ experiences andenvironmental system. Popular events, seemingly sucessfulin attractiveness, are exposed to higher risk of congestion,which, on the other hand, become an disadvantage. Severecongestion during event indicates the need for improvingtourist demand management or providing more services.
Mobile phone data provides a dynamic monitoring of trans-portation system performance. The ability to track trafficflows at a granular spatio-temporal scale provides deeperunderstanding of tourists’ travel patterns, enabling betterplanning and management.
We propose a three-step method to estimate traffic flow.First, we compute the tower-to-tower Origin-Destination (O-D) matrix by aggregating the individual movements betweencell towers. It is important to estimate traffic flows acrosstemporal and spatial dimensions due to the heterogeneousvariability. Second, the O-D pairs are assigned to road links,as shown in Figure 5. The last step is to scale the aggre-gated movements to actual vehicle trips using traffic countsas the ground truth.
4.5 RevenuesUnderstanding the spending patterns at individual level andaggregated level enables businesses to promote offers to con-centrate marketing efforts. It also helps businesses to inden-tify the potential markets for growth. Under the situationthat no data is directly related to tourists’ spendings, wecome up with an approach to proxy the revenues. Rev-enues are positively correlated with the disposable income

Cite as: Y. Leng, A. Noriega, A.S. Pentland, I. Winder, N. Lutz and L. Alonso: ”Analysis of Tourism Dynamics and SpecialEvents through Mobile Phone Metadata”. 2016. Proceedings of Data for Good Exchange (D4GX) 2016. New York, NY.
of tourists, which can, to some degree, be proxied by theprice of the phone being used.
The brand, model, operation system of the phone can beobtained with IMEI-TAC code of the records. The price ofthe phone are scraped from Amazon API based on the aboveinformation. The phone type distribution across nations areshown in Figure 6.
Note that accurate revenues and individual spendings gen-erated from events can be measured by banking transactions[27] if available.
Figure 6: Phone type distribution across country
4.6 Tourists interests profilesThe understanding of tourists’ interests offer businesses andtourism department a series of tactical and strategic rec-ommendations on deicision-makings. As detailed footprintsare tracked, the behavioral patterns for each interest cate-gory increase the knowledge of the industry’s target market.This enables businesses to promote various service bundlesto retain and attract customers.
Personal interests are inferred in two steps. We first inte-grate the geo-location of cell towers and Point of Interests(POIs), tagging each cell towers with the potential activitiesindividuals may perform nearby. Second, we aggregate thecell towers each individual connect to. With this, we obtaina distribution for activities individuals are interested in.
5. CASE STUDYIn this section, we use the proposed indicators in section 4to showcase a comprehensive assessment of the high-impactevents based on CDRs, extending beyond traditional indi-cators learned from surveys.
5.1 Summer events analyticsFigure 7 shows the performances of five summer events ona radar chart, based on tourist days, new tourists, spatialdistribution, income profiles and peak congestion. We targetthe following summer events:
• Storia by Cirque du Soleil: 2015/07/15 - 2015/07/20.
• Volta als Ports d’Andorra: 2015/07/12.
• MTB Masters World Championships: 2015/08/23 -2015/08/27.
• Tour of Spain: 2015/08/31 - 2015/09/03.
• UCI Trial Masters World Championships: 2015/09/01- 2015/09/06.
Insights from Figure 7 include:
• UCI Trials Master World Championship was relativelymore successful in most dimensions. Planners carriedout successful marketing strategies and winned highpopularity. Activities were not as attractive to high-income visitors as low-income ones, the former onesmay generate more revenues.
• MTB World Master Championships attracted a largevolume of tourist and new tourists, indicating the pop-ularity and success in marketing strategies. Touristswere centralized in central area and caused severe con-gestion, indicating more efforts in: 1) marketing sub-urban areas; 2) organize events or develop businessesin attracting high-income visitors; 3) manage traveldemand to reduce congestion.
The relative position indicates the relative performance inthe five events. Each spoke represents each indicator, withcolors standing for events.
Figure 7: Summer events analytics
5.2 Winter events analyticsTourist flows during events measures the popularities of theevents. However, more insights about the characteristicsand segmentation of the population dynamics reveal betterknowledge about marketing strategy prior to the events andtravel experiences during the events. The targeted winterevents include:
• Free-ride Junior World Championship: 2015/02/07 -2015/02/08
• Speed Skiing World Championship: 2015/02/28 - 2015/03/03
• Alpine Skiing European Cup Finals: 2015/03/18 - 2015/3/22
• Total Fight Master of Freestyle: 2015/03/26 - 2015/04/04
As shown in Figure 8, Free-ride Junior World Championship,though less popular, attracted a large number of new tourists

Cite as: Y. Leng, A. Noriega, A.S. Pentland, I. Winder, N. Lutz and L. Alonso: ”Analysis of Tourism Dynamics and SpecialEvents through Mobile Phone Metadata”. 2016. Proceedings of Data for Good Exchange (D4GX) 2016. New York, NY.
and repeated visits. This indicates its success in not onlythe marketing, but also the management and organization ofthe events. On the contrary, though Total Flight Master ofFreestyl had high popularity, lowest revisit rate implies poortravel experiences, requiring more analytics on the specificaspects to be improved to retain tourists.
Figure 8: Winter events analytics
5.3 Tourists interests profilesThe interests of tourists across nations are informative intarget marketing. As shown in Figure 9, the Spanish andthe French are more interested in shopping and nature ac-tivities, which take up 2
3and 1
4respectively. 2
3Russian are
interested in nature activities, with another 16
interested in
cultural activities. 13
Netherlands are interested in natureand shopping activities.
Figure 9: Nationality vs. interests
6. CONCLUDING REMARKSGrowth in leisure travel has become increasingly significanteconomically, socially, and environmentally, accounting fora significant share of GDP and labor force. Policy andresearch on tourism traditionally rely on surveys and eco-nomic datasets, which are based on small samples and depicttourism dynamics at low spatial and temporal granularity.Anonymous call detail records (CDRs) are a novel source ofdata, with an enormous potential in areas of high societalvalue, such as epidemics, poverty, and urban development.
This study demonstrates how to make use of the potentialand added value of CDR for the formulation, analysis and
evaluation of tourism strategies, at the national and locallevels. In the context of the European country of Andorra,we use CDRs to evaluate marketing strategies, understandtourists’ experiences, and evaluate revenues and externali-ties generated by touristic events. We do this by extractingmany indicators in high spatial and temporal resolutions,such as tourist flows per country of origin, flows of newtourists, revisitation patterns, tourist externalities on trans-portation congestion, spatial distribution, economic impact,and profiling of tourist interests. Some of the indicators aretraditionally used by tourism industry and others could notbe quantified without large-scale and longitudinal data. Weexemplify the use of these indicators for the planning andevaluation of high impact touristic events in Andorra, suchas cultural festivals and sports competitions.
For future study, we plan to build an overreaching and au-tomatic platform for tourisms and events management. Theapplication of CDR data in tourism is promising in that itcan be integrated with other geopositioned data for a com-prehensive tourism monitoring and optimization platform,such as WiFi - more granular in movements, social media -momentary feelings and hidden interests, banking transac-tions - accurate revenue.
7. ACKNOWLEDGEMENTThis project is in collaboration with Changing Places Groupat MIT Media lab, directed by Professor Kent Larson. Wethank them, especially Arnaud Grignard, Naichun Chen,Nuria Macia and Yan Zhang, for the data support, visu-alizations and discussions.
8. REFERENCES[1] Hoteleria i turisme. 2015.
[2] R. Akcelik. Travel time functions for transportplanning purposes: Davidson’s function, its timedependent form and alternative travel time function.Australian Road Research, 21(3), 1991.
[3] F. Alhasoun, A. Almaatouq, K. Greco, R. Campari,A. Alfaris, and C. Ratti. The city browser: Utilizingmassive call data to infer city mobility dynamics. In3rd International Workshop on Urban Computing(UrbComp 2014). UrbComp: New York, NY, 2014.
[4] R. Baggio. Big data, business intelligence and tourism:a brief analysis of the literature.
[5] J. Balaguer and M. Cantavella-Jorda. Tourism as along-run economic growth factor: the spanish case.Applied economics, 34(7):877–884, 2002.
[6] J. Balaguer and M. C. Jorda. Tourism as a long-runeconomic growth factor: the spanish case. Workingpapers= Documentos de trabajo: Serie EC (InstitutoValenciano de Investigaciones Economicas), (10):1,2000.
[7] A. Bassolas, M. Lenormand, A. Tugores, B. Goncalves,and J. J. Ramasco. Touristic site attractiveness seenthrough twitter. EPJ Data Science, 5(1):1, 2016.
[8] M. Ben-Akiva and M. Bierlaire. Discrete choicemethods and their applications to short term traveldecisions. In Handbook of transportation science, pages5–33. Springer, 1999.
[9] A. Birenboim. New approaches to the study of touristexperiences in time and space. Tourism Geographies,

Cite as: Y. Leng, A. Noriega, A.S. Pentland, I. Winder, N. Lutz and L. Alonso: ”Analysis of Tourism Dynamics and SpecialEvents through Mobile Phone Metadata”. 2016. Proceedings of Data for Good Exchange (D4GX) 2016. New York, NY.
18(1):9–17, 2016.
[10] V. D. Blondel, A. Decuyper, and G. Krings. A surveyof results on mobile phone datasets analysis. EPJData Science, 4(1):1, 2015.
[11] A. P. Brian Wheatman, Alejandro Noriega. Electricitydemand and population dynamics prediction frommobile phone metadata. 2016.
[12] Cia.gov. Cia world factbook entry: Andorra. 2012.
[13] P. Crowther, J. Bostock, and J. Perry. Review ofestablished methods in event research. EventManagement, 19(1):93–107, 2015.
[14] A. Dupeyras and N. MacCallum. Indicators formeasuring competitiveness in tourism. 2013.
[15] E. Frıas-Martınez, G. Williamson, andV. Frıas-Martınez. Simulation of epidemic spreadusing cell-phone call data: H1n1 case study.
[16] D. Getz. Event tourism: Definition, evolution, andresearch. Tourism management, 29(3):403–428, 2008.
[17] D. Getz and S. J. Page. Event studies: Theory,research and policy for planned events. Routledge,2016.
[18] D. Getz and S. J. Page. Progress and prospects forevent tourism research. Tourism Management, 52:593– 631, 2016.
[19] J. Y. Lee. Investigating the effect of festival visitors’emotional experiences on satisfaction, psychologicalcommitment, and loyalty. PhD thesis, Texas A&MUniversity, 2009.
[20] X. R. Li, C.-K. Cheng, H. Kim, and J. F. Petrick. Asystematic comparison of first-time and repeat visitorsvia a two-phase online survey. Tourism Management,29(2):278–293, 2008.
[21] A. Lima, R. Stanojevic, D. Papagiannaki,P. Rodriguez, and M. C. Gonzalez. Understandingindividual routing behaviour. Journal of The RoyalSociety Interface, 13(116):20160021, 2016.
[22] R. Pettersson and D. Getz. Event experiences in timeand space: a study of visitors to the 2007 world alpineski championships in are, sweden. ScandinavianJournal of Hospitality and Tourism, 9(2-3):308–326,2009.
[23] S. Proenca and E. Soukiazis. Tourism as an economicgrowth factor: a case study for southern europeancountries. Tourism Economics, 14(4):791–806, 2008.
[24] H. Song, L. Dwyer, G. Li, and Z. Cao. Tourismeconomics research: A review and assessment. Annalsof Tourism Research, 39(3):1653–1682, 2012.
[25] T. Thiumsak and A. Ruangkanjanases. Factorsinfluencing international visitors to revisit bangkok,thailand.
[26] U. N. W. T. O. UNWTO. World tourism barometer.2015.
[27] A. B. R. G. e. Victor Sust, Enrique Illera. Big dataand tourism: New indicators for tourism management.2014.
[28] S. A. Wood, A. D. Guerry, J. M. Silver, andM. Lacayo. Using social media to quantifynature-based tourism and recreation. Scientificreports, 3, 2013.


![Tourism month calendar of events [r]](https://static.fdocuments.in/doc/165x107/55a280b91a28ab26408b481f/tourism-month-calendar-of-events-r.jpg)