Analysis of the variation of horizontal stresses and ...
136
Graduate Theses, Dissertations, and Problem Reports 2004 Analysis of the variation of horizontal stresses and strains in Analysis of the variation of horizontal stresses and strains in bedded deposits in the eastern and Midwestern United States bedded deposits in the eastern and Midwestern United States Dennis R. Dolinar West Virginia University Follow this and additional works at: https://researchrepository.wvu.edu/etd Recommended Citation Recommended Citation Dolinar, Dennis R., "Analysis of the variation of horizontal stresses and strains in bedded deposits in the eastern and Midwestern United States" (2004). Graduate Theses, Dissertations, and Problem Reports. 1425. https://researchrepository.wvu.edu/etd/1425 This Thesis is protected by copyright and/or related rights. It has been brought to you by the The Research Repository @ WVU with permission from the rights-holder(s). You are free to use this Thesis in any way that is permitted by the copyright and related rights legislation that applies to your use. For other uses you must obtain permission from the rights-holder(s) directly, unless additional rights are indicated by a Creative Commons license in the record and/ or on the work itself. This Thesis has been accepted for inclusion in WVU Graduate Theses, Dissertations, and Problem Reports collection by an authorized administrator of The Research Repository @ WVU. For more information, please contact [email protected].
Transcript of Analysis of the variation of horizontal stresses and ...
Graduate Theses, Dissertations, and Problem Reports
2004
Analysis of the variation of horizontal stresses and strains in Analysis of the variation of horizontal stresses and strains in
bedded deposits in the eastern and Midwestern United States bedded deposits in the eastern and Midwestern United States
Dennis R. Dolinar West Virginia University
Follow this and additional works at: https://researchrepository.wvu.edu/etd
Recommended Citation Recommended Citation Dolinar, Dennis R., "Analysis of the variation of horizontal stresses and strains in bedded deposits in the eastern and Midwestern United States" (2004). Graduate Theses, Dissertations, and Problem Reports. 1425. https://researchrepository.wvu.edu/etd/1425
This Thesis is protected by copyright and/or related rights. It has been brought to you by the The Research Repository @ WVU with permission from the rights-holder(s). You are free to use this Thesis in any way that is permitted by the copyright and related rights legislation that applies to your use. For other uses you must obtain permission from the rights-holder(s) directly, unless additional rights are indicated by a Creative Commons license in the record and/ or on the work itself. This Thesis has been accepted for inclusion in WVU Graduate Theses, Dissertations, and Problem Reports collection by an authorized administrator of The Research Repository @ WVU. For more information, please contact [email protected].
Analysis of the Variation of Horizontal Stresses and Strains in Bedded Deposits in
the Eastern and Midwestern United States
by
Dennis R. Dolinar
Thesis submitted to the College of Engineering and Mineral Resources
West Virginia University
In partial fulfillment of the requirements for a degree of
Master of Science
in
Mining Engineering
Syd S. Peng, Ph.D., Chair
Keith Heasley, Ph.D.
Yi Luo, Ph.D.
Department of Mining Engineering
Morgantown, West Virginia
2004
Keywords: In situ stress, horizontal stress, horizontal strain
Copyright 2004 Dennis R. Dolinar
Analysis of the Variation of Horizontal Stresses and Strains in Bedded Deposits in
the Eastern and Midwestern United States
by
Dennis R. Dolinar
ABSTRACT
The variation of the horizontal stress magnitude in bedded deposits in the eastern
and Midwestern United States is analyzed with respect to the site depth and the rock
elastic modulus using data from 40 sites. For the development of adequate regression
models with the elastic modulus, zones with sufficiently uniform strains must be
established. A low strain zone encompassing much of the eastern United States and a
high strain zone encompassing a portion of southern West Virginia are delineated. In
each zone, the regression models with the elastic modulus as the independent variable
explains about 85 percent of the maximum horizontal stress variation. In general, the
minimum horizontal stress is much less dependent on the elastic modulus. Though the
site depths range from 275 to 2,300 ft, depth can explain only 15 percent of the maximum
horizontal stress variation and is apparently not a significant independent factor.

iii
DEDICATION
I dedicate this thesis to my dad who always provided encouragement for me to continue
my education but did not see the completion of this work.
Stanley F. Dolinar
1915 to 2003
iv
ACKNOWLEDGEMENTS
The author wishes to thank those who have contributed to the preparation and
completion of this thesis. Special appreciation is given to the members of his advisory
and examination committee: Dr. Yi Luo and Dr. Keith Heasley. A debt of gratitude is
especially owed to Dr. Syd S. Peng for supervision, general guidance and development of
critical evaluation techniques that were instrumental for this study.
The author also thanks Dr. Chris Mark and Dr. Winton Gale, Mr. Murali Mohan
Gadde for critical discussion on horizontal stress. These discussions provided helpful
direction to this study. Sincere thanks needs to be given to Kathleen Stabryla for
assistance in finding reference material without which the thesis would not have been as
complete.
Special appreciation is given to fellow students and staff at CEMR, especially
Karen Centofanti who provided assistance and guidance through the graduate school
maze.
Finally, I express my deepest appreciation to my mother, Mrs. Emma Dolinar who
provided encouragement in the pursuit of higher educational goals.

v
TABLE OF CONTENTS
Page
Abstract ................................................................................................................... ii
Dedication ............................................................................................................... iii
Acknowledgements ................................................................................................ iv
Table of Contents.................................................................................................... v
List of Figures ......................................................................................................... ix
List of Tables .......................................................................................................... xiii
List of Abbreviations .............................................................................................. xv
CHAPTER 1 – INTRODUCTION ........................................................................ 1
CHAPTER 2 – REVIEW OF LITERATURE................................................... 3
CHAPTER 3 - MODEL TYPES AND STRESS MEASUREMENTS USED
IN THE STUDY....................................................................... 6
3.1 Models Used to Analyze the Stress Variation...................................... 6
3.2 Stress Measurements Used in Analysis................................................ 10
CHAPTER 4 - HORIZONTAL STRESS MEASUREMENTS FROM SITES
IN THE EASTERN UNITED STATES .................................. 12
4.1 Central Appalachian Region ................................................................ 12
4.1.1 Beckley Coalfield.......................................................................... 14
4.1.2 Olga Mine, Pocahontas #4 Seam ................................................. 15
4.1.3 Mine, Eagle Seam ........................................................................ 15
4.1.4 Hendrix Mine, Elkhorn #3 Seam ................................................. 16
4.1.5 Summary of Central Appalachian Region ................................... 16
4.2 Northern Appalachian Region ............................................................ 16
4.2.1 Loyalhanna Limestone Formation ............................................... 17
4.2.2 Columbus Limestone ................................................................... 18
4.2.3 Pittsburgh Coal Seam................................................................... 18
4.2.4 Lower Kittanning Seam ............................................................... 19
4.2.5 Summary of Northern Appalachian Region ............................... 20
4.3 Eastern Mid-Continent Region ........................................................... 20

vi
Page
4.3.1 Wabash Mine ............................................................................... 21
4.3.2 Monterey Mine............................................................................. 22
4.3.3 Galatia Mine................................................................................. 22
4.3.4 Turris Mine .................................................................................. 22
4.3.5 Peabody # 10 Mine ...................................................................... 23
4.3.6 Peabody #2 Mine ......................................................................... 23
4.3.7 Ft. Campbell Limestone............................................................... 23
4.3.8 North River Mine......................................................................... 24
4.3.9 Jim Walters # 7 Mine................................................................... 24
4.3.10 Immel Mine.................................................................................. 24
4.3.11 Summary of Eastern Mid-Continent Region ............................... 25
CHAPTER 5 - BECKLEY COAL SEAM........................................................ 26
5.1 Variation of the Horizontal Stress with the Elastic Modulus.............. 26
5.2 Variation of Horizontal Stress with Depth .......................................... 33
5.3 Variation of Horizontal Stress with Both the Elastic Modulus and
Depth ................................................................................................... 35
5.4 Excess Horizontal Stress .................................................................... 36
5.5 Variation of the Horizontal Stress with the Elastic Modulus Based
on Site Average Stresses ..................................................................... 37
5.6 Variation of the Horizontal Stress with the Elastic Modulus at
Individual Sites and Mines ...................................................................... 38
5.7 Beckley Seam Analysis-Conclusions...................................................... 41
CHAPTER 6 - VARIATION OF STRAINS IN THE EASTERN UNITED
STATES .................................................................................. 43
6.1 Determination of the Applied Horizontal Strains................................ 43
6.2 Local Strain Variations........................................................................ 44
6.3 Regional Strain Variations .................................................................. 50
6.3.1 Eastern Mid-Continent Region .................................................... 51
6.3.2 Northern Appalachian Region ..................................................... 51
vii
Page
6.3.3 Central Appalachian Region ........................................................ 54
6.3.4 Summary of Regional Strain Fields ............................................ 57
6.3.5 Comparison of Regional Strain Fields......................................... 57
6.4 Strain Variation Across the Eastern United States .............................. 59
6.5 Regional Strain Variation-Conclusions............................................... 62
CHAPTER 7 - REGIONAL AND LOCAL STRESS AND STRAIN
MODELS.............................................................................. 63
7.1 Regional Stress And Strain Models..................................................... 63
7.1.1 Variation of the Horizontal Stress with the Elastic Modulus........ 63
7.1.2 Variation of Horizontal Stress with Depth .................................... 71
7.1.3 Variation of the Horizontal Stress with the Elastic Modulus
and Depth ...................................................................................... 75
7.1.4 Variation of the Strain from the Maximum Horizontal Stress
With Depth .................................................................................... 78
7.1.5 Excess Horizontal Stresses ........................................................... 78
7.2 Variation of the Horizontal Stresses with the Elastic Modulus for
Specific Seams and Mines .................................................................. 80
7.2.1 Pittsburgh Seam ........................................................................... 81
7.2.2 Lower Kittanning Seam ............................................................... 82
7.2.3 Peabody #10 Mine, Eastern Mid-Continent Region ................... 84
7.3 Regional and Local Models-Conclusions............................................ 85
CHAPTER 8 - HORIZONTAL STRESS AND DEPTH MODELS
FOR EASTERN UNITED STATES....................................... 87
8.1 Variation of the Horizontal Stress with the Elastic Modulus ................. 87
8.2 Maximum Horizontal Stress Versus Depth ............................................ 91
8.3 Horizontal Stress and Depth Models for the Eastern United States-
Conclusions.............................................................................................. 95
CHAPTER 9 - SUMMARY AND CONCLUSIONS....................................... 96
Bibliography ..................................................................................................... 103

viii
Page
Appendix A....................................................................................................... 110
Appendix B ....................................................................................................... 116
Appendix C ....................................................................................................... 117
Appendix D....................................................................................................... 118

ix
LIST OF FIGURES
Page
Figure 4-1 Location of stress measurements sites used in study.
Numbers in parentheses indicates multiple sites in close
proximity ..................................................................................... 12
Figure 4-2 Average mine and district horizontal stresses measured in the
Beckley seam (modified from Agapito et al., 1980A) ................ 14
Figure 5-1 The maximum horizontal stress versus the elastic modulus,
Beckley coal seam (combined strain zones)................................ 27
Figure 5-2 Low and high strain zones in the Beckley Seam (modified from
Agapito et al., 1980A) ................................................................. 29
Figure 5-3 The maximum horizontal stress versus the elastic modulus,
Beckley coal seam (high strain zone).......................................... 29
Figure 5-4 The maximum horizontal stress versus the elastic modulus,
Beckley coal seam (low strain zone) ........................................... 30
Figure 5-5 The minimum horizontal stress versus the elastic modulus,
Beckley coal seam (high strain zone).......................................... 31
Figure 5-6 The minimum horizontal stress versus the elastic modulus,
Beckley coal seam (low strain zone) ........................................... 32
Figure 5-7 The maximum horizontal stress versus the depth, Beckley coal
seam............................................................................................. 34
Figure 5-8 The strain from the maximum horizontal stress versus the
depth, Beckley coal seam (combined strain zones)..................... 35
Figure 5-9 The maximum horizontal stress versus the elastic modulus,
Bonny mine ................................................................................. 41
Figure 6-1 Distribution of the standard deviation of the maximum applied
strain given in percent ................................................................. 47
Figure 6-2 Distribution of the standard deviation of the minimum applied
strain given in percent ................................................................. 48
Figure 6-3 Maximum applied horizontal strain versus distance of the
measurement from the opening, eastern United States ............... 49

x
Page
Figure 6-4 Approximate regional boundaries based on site groupings......... 50
Figure 6-5A Distribution of the applied horizontal strain in the eastern Mid-
Continent region, maximum........................................................ 52
Figure 6-5B Distribution of the applied horizontal strain in the eastern Mid-
Continent region, minimum ........................................................ 52
Figure 6-6A Distribution of the applied horizontal strain in the northern
Appalachian region, maximum ................................................... 53
Figure 6-6B Distribution of the applied horizontal strain in the northern
Appalachian region, minimum .................................................... 53
Figure 6-7A Distribution of the applied horizontal strain in the central
Appalachian region, maximum ................................................... 55
Figure 6-7B Distribution of the applied horizontal strain in the central
Appalachian region, minimum .................................................... 55
Figure 6-8A Distribution of the maximum applied horizontal strain across the
eastern United States, maximum ................................................. 61
Figure 6-8B Distribution of the maximum applied horizontal strain across
the eastern United States, minimum............................................ 61
Figure 7-1A The maximum horizontal stress versus the elastic modulus,
northern Appalachian region ...................................................... 64
Figure 7-1B The maximum horizontal stress versus the elastic modulus,
eastern Mid-Continent region (with the Turris and North River
sites)............................................................................................. 65
Figure 7-1C The maximum horizontal stress versus the elastic modulus,
eastern Mid-Continent region (without the Turris and North
River sites)................................................................................... 65
Figure 7-1D The maximum horizontal stress versus the elastic modulus,
central Appalachian region (high strain zone) ............................ 66
Figure 7-1E The maximum horizontal stress versus the elastic modulus,
central Appalachian region (low strain zone).............................. 66

xi
Page
Figure 7-2A The minimum horizontal stress versus the elastic modulus,
northern Appalachian region ....................................................... 69
Figure 7-2B The minimum horizontal stress versus the elastic modulus,
eastern Mid-Continent region...................................................... 69
Figure 7-2C The minimum horizontal stress versus the elastic modulus,
central Appalachian region (low strain zone).............................. 70
Figure 7-2D The minimum horizontal stress versus the elastic modulus,
central Appalachian region (high strain zone) ............................ 70
Figure 7-3A The maximum horizontal stress versus the depth, northern
Appalachian region...................................................................... 72
Figure 7-3B The maximum horizontal stress versus the depth, central
Appalachian region (low strain zone) ......................................... 73
Figure 7-3C The maximum horizontal stress versus the depth, central
Appalachian region (high strain zone) ........................................ 73
Figure 7-3D The maximum horizontal stress versus the depth, central
Appalachian region...................................................................... 74
Figure 7-3E The maximum horizontal stress versus the depth, eastern
Mid-Continent region .................................................................. 74
Figure 7-4A Strain from the maximum horizontal stress versus the depth for
the northern Appalachian region ................................................. 76
Figure 7-4B Strain from the maximum horizontal stress versus the depth for
the eastern Mid-Continent region................................................ 76
Figure 7-4C Strain from the maximum horizontal stress versus the depth for
the central Appalachian region (low strain zone)........................ 77
Figure 7-4D Strain from the maximum horizontal stress versus the depth for
the central Appalachian (high strain zone).................................. 77
Figure 7-5 The maximum horizontal stress versus the elastic modulus for
the Pittsburgh seam ..................................................................... 81

xii
Page
Figure 7-6 The maximum horizontal stress versus the elastic modulus for
the lower Kittanning seam........................................................... 83
Figure 7-7 The maximum horizontal stress versus the elastic modulus for
the Peabody #10 Mine................................................................. 85
Figure 8-1 The maximum excess horizontal stress versus the elastic
modulus for the eastern United States ......................................... 88
Figure 8-2 The maximum average excess horizontal stress versus the site
average elastic modulus for the eastern United States ................ 89
Figure 8-3 The maximum average excess horizontal stress versus the site
average elastic modulus for the eastern United States (two low
strain models) .............................................................................. 90
Figure 8-4 The maximum horizontal stress versus the depth in the eastern
United States................................................................................ 92
Figure 8-5 The strain from the maximum horizontal stress versus the depth
for the eastern United States........................................................ 94

xiii
LIST OF TABLES
Page
Table 4-1 Summary of horizontal stresses by site in the central
Appalachian region......................................................................... 13
Table 4-2 Summary of stresses by site in the northern Appalachian region .. 17
Table 4-3 Horizontal stresses in the Loyalhanna formation, Fayette
County, PA ..................................................................................... 18
Table 4-4 Summary of stresses by site in the eastern Mid-Continent region . 21
Table 5-1 Average horizontal strains from the maximum and minimum
horizontal stresses by site in the Beckley coal seam ...................... 28
Table 5-2 Comparison of the regression parameters and statistics based on
individual or average site stresses, Beckley coal seam .................. 38
Table 5-3 Constants and correlations from a regression fit for the maximum
horizontal stress from individual sites in the Beckley coal seam... 39
Table 5-4 Constants and correlations from a regression fit for the maximum
horizontal stresses from each mine in the Beckley coal seam........ 40
Table 6-1 Average applied horizontal strain in the eastern United States by
site and by region............................................................................ 45
Table 6-2 Applied horizontal strain by region for the eastern United States.. 50
Table 6-3 Statistical comparison of selected regional average maximum
applied horizontal strains................................................................ 58
Table 7-1 Regional regression models for the maximum horizontal stresses
versus the elastic modulus .............................................................. 64
Table 7-2 Regional regression models for the minimum horizontal stress
versus the elastic modulus based on the site average stresses........ 68
Table 7-3 Variation of the maximum horizontal stress with depth by region 72
Table 7-4 Variation of the maximum horizontal stress with depth and the
elastic modulus by region............................................................... 75
Table 7-5 Regression models for the strain from the maximum horizontal
stress versus depth for each region................................................. 78

xiv
Page
Table 7-6 Regression models for the maximum excess horizontal stress
versus the elastic modulus by region with a zero intercept ............ 79
Table 7-7 Regression models for the minimum excess horizontal
stress versus the elastic modulus by region with a zero intercept .. 80
Table 8-1 Coefficients and statistic for the maximum and minimum
excess horizontal stress models for the eastern United States
with a zero intercept ....................................................................... 87
Table 8-2 Summary of the average parameters including the depth,
maximum horizontal strain and the elastic modulus for each
region.............................................................................................. 93
Table 9-1 Regression models for the excess maximum and maximum
horizontal stress versus the elastic modulus developed in study.... 98

xv
ABBREVIATIONS OF UNITS
ft-feet psi- pounds per square inch

1
CHAPTER 1: INTRODUCTION
The objective of this study is to analyze the variation of the horizontal stress and
strain with respect to the elastic modulus of the rock and the depth of the measurement
from the surface of the earth based on stress measurements made in mines in bedded
deposits in the eastern and Midwestern United States. At the mining depths in coal and
limestone deposits, the maximum horizontal stress, generally, exceeds the vertical stress
often by several times. Further, the horizontal stress has been linked to ground control
problems in a number of mines in both coal and limestone. Therefore, the magnitude of
the horizontal stress is an important ground control issue as are the factors that may affect
the magnitude of the horizontal stress. Two primary factors that in general influence the
magnitude of the horizontal stress are the elastic modulus of the rock and the depth.
Therefore, horizontal stresses measured in the eastern and Midwestern United
States are examined to determine if there is any general relationship between the elastic
modulus and horizontal stress magnitude. Elastic theory specifies the relationship
between the stress and the strain at a point, as the elastic modulus. This study will
investigate if there is a relationship between the elastic modulus and the horizontal stress
magnitude across larger geographic areas. If such relationships are developed, the
implication is that those sets of stress measurements are under a similar or uniform strain
field.
Besides the stresses, the horizontal strains are also evaluated. Essentially, this
removes the elastic properties of the rock as a factor in a given analysis. Therefore, other
factors such as depth can be examined without the influence of the rock properties. The
horizontal strains can also be examined for geographic variation and to determine how
consistent or variable the strain field is across the eastern and Midwestern United States.
The strain field in combination with the elastic properties will determine the magnitude
of the horizontal stress.
The effects of depth on the magnitude of the horizontal stress are considered to
determine if a general depth factor for the horizontal stress exists and if it does, the
magnitude of that depth factor. Essentially, does the magnitude of the horizontal stress
increase with depth, and to what degree.

2
This study uses the available horizontal stress measurement and elastic property
data from mines in sedimentary deposits in the eastern and Midwestern United States.
However, such an analysis requires data from the individual stress measurements and the
elastic properties of the rock associated with those measurements. This data criterion
limits the amount of published stress data that can be used. Initially, the measurements
made in the Beckley coalfield are evaluated where an extensive stress measurement
program was conducted with the elastic properties of the individual stress measurements
and site depths available. Further, an analysis is then conducted based on other stress
measurements in the northern and central Appalachian regions and the eastern Mid-
Continent region that includes the Illinois basin.

3
CHAPTER 2: REVIEW OF LITERATURE
In the United Kingdom, the variation in the magnitude of the maximum horizontal
stress measured in coal mines can be explained to a high degree by the elastic modulus of
the rock and the Poisson’s ratio effect from the vertical stress due to gravity (Cartwright
1997). A general model using a multiple correlation analysis was developed for the coal
measure rocks in both England and the United Kingdom that shows a strong relationship
between the maximum horizontal stress magnitude and the elastic modulus and Poisson’s
effect from gravity. The multiple correlation coefficient for the United Kingdom as a
whole was 0.94 and for England only, 0.95. The high correlation in these models
indicates that the coalfields in England are subjected to essentially the same uniform
horizontal strain field. Further, the increase in the maximum horizontal stress with depth
can be explained by the vertical stress from gravity and Poisson’s effect. However, the
correlation between the elastic modulus and the minimum horizontal stress was much
weaker (Bigby et al., 1995). The multiple correlation coefficient was for the United
Kingdom 0.55 and for England 0.41. The relationships were weak enough not to be used
to estimate the minimum stress. In the United Kingdom study, the depths of the
measurements ranged from 300 to 3,500 ft. Therefore, the analysis covers a range in
depth applicable to mining. In the English model, the maximum horizontal stress has a
tectonic strain component above the gravity affects that ranges between 700 and 800
micro strains. The minimum horizontal stress has a tectonic strain component without
gravity that ranges between 30 and 100 micro strains. These tectonic strains are the
coefficients for the elastic modulus in the models.
Further, evidence of a relationship between the magnitude of the maximum
horizontal stress and the elastic properties at specific sites in the United States have been
reported (Hanna et al., 1991, Aggson and Mouyard, 1988A and 1988B). In evaluating
horizontal stresses measured in the roof of a coal mine in the Illinois basin, Hanna et al.,
(1991) stated that “the magnitude of the major principal stress is related linearly to the
elastic modulus of the roof rock.” Aggson and Mouyard (1988A and 1988B) reported a
linear relationship between the elastic modulus and the maximum horizontal stress
magnitude for a mine in West Virginia. A relationship between the maximum stress and

4
the elastic modulus of the rock has also been shown to exist in China (Guangyu et al.,
1986). The explanation given was that a rock mass with a higher elastic modulus
accumulates higher elastic strain energy when subjected to the same strain field. This
implies the strain field was uniform where the measurements were made. Therefore,
there is evidence that the elastic modulus of the rock is an important factor in the
variation of the magnitude of at least the maximum horizontal stress.
A theoretical model has also been developed that provides an estimate of the mean
horizontal stress based on gravity and Poisson’s effect and a thermal gradient component
that also involves the elastic constants (Sheorey et al., 2002). There appears to be a
reasonable good fit between this model and stress data for North America though the
analysis is based on measurements made prior to 1980. It is also stated that the equation
shows the horizontal stress has a definite dependence on the elastic modulus. Based on
the thermal coefficient and gradient provided in the report, the coefficient for the elastic
modulus is 240 micro strains at the surface, 313 micro strains at 1,000 ft and 386 micro
strains at 2,500 ft. However, the model is not adequate where there is a strong influence
of topography, major geologic features or tectonics.
The increase in horizontal stress with depth in North America has been evaluated by
a number of authors (Brown and Hoek, 1978; Herget, 1986; Mark and Mucho, 1994).
The studies by Herget (1986) and Brown and Hoek (1978) were conducted based on
measurements primarily from igneous and metamorphic rocks while the measurements
presented by Mark and Mucho (1994) were from coal measure rocks. Herget (1986)
found the magnitude of the average horizontal stress increased by about 2.56 psi/ft for the
depth range from 0 to 2,600 ft while from Brown and Hoek’s (1978) analysis the increase
ranged from 0.35 to 0.61 psi/ft of depth. The study by Mark and Mucho (1994) indicates
that the maximum horizontal stress increases with depth in coal measure rocks. Although
no analysis was conducted on the data, from the graphical presentation, the maximum
horizontal stress magnitude appears to be increasing faster than the vertical stress. More
recently, Mark et al. (2001), has given the increase in depth for coal mines in the eastern
United States in the form of regression equations, one linear and the other logarithmic.
The linear increase in the maximum horizontal stress with depth is 1.23 psi/ft while the
logarithmic equation gives a similar increase between 500 and 1,500 ft.

5
Except for the data presented by Herget (1986) from the Canadian Shield, the
correlation between depth and the horizontal stress for these models is in general poor.
Further, based on stress measurements in the United Kingdom, the following statement
was made “Unlike the vertical stress, the horizontal stress component is not related to
depth but to the rock stiffness” (Hayes et al., 1995). Therefore, the effects of depth on
the maximum horizontal stress are reexamined not only based on the stress but the elastic
strain. For the depth, the strain data needs to be evaluated because of potential effects of
the elastic properties on the stress magnitude.
There is a theoretical basis for the increase of the horizontal stress with depth that
develops from the gravity load and Poisson’s ratio (Obert and Duvall, 1967; Jaeger and
Cook, 1969). Both Sheorey et al. (2002), and Cartwright (1997) include this as a depth
factor in their models for estimating the horizontal stress. The increase with gravity is
also indicated in the calculation of what is termed the excess or tectonic horizontal stress,
the horizontal stress in excess of the expected gravity load (Aggson, 1979A; Bickel,
1993).

6
CHAPTER 3: MODEL TYPES AND STRESS MEASUREMENTS USED IN THE
STUDY
3.1 MODELS USED TO ANALYZE THE STRESS VARIATION
To analyze the variation of the horizontal stress magnitude with respect to the
elastic modulus and the depth, several models are used. A regression analysis on the data
is conducted to develop the models and to examine how well the models explain the data
variation.
For the relationship between the horizontal stress magnitude and the elastic
modulus, the following type of equation is used
P, Q = K1 E + K2 (3.1)
where P = maximum horizontal stress, psi,
Q = minimum horizontal stress, psi,
K1 = strain coefficient for either the maximum or minimum horizontal stress,
micro strain,
E = elastic modulus, 106 psi,
and K2 = constant for either the maximum or minimum horizontal stress, psi.
The coefficient K1 is directly related to the strains while the K2 constant is related to
other factors that cause an offset in the stress-strain relationship such as the depth or
thermally induced strains (Cartwright, 1997; Herget, 1988). A large constant can also
result from measurements obtained from a non-uniform strain field where there can also
be a different distribution of the elastic modulus that was sampled within those strain
fields.
In general, as previously noted, the horizontal stress magnitude does appear to
increase with depth. There are at least two aspects to this increase, the change from an
increase in the vertical stress, and the change in the excess or tectonic component of the
horizontal stress. There are also other potential factors that may cause an increase in the
horizontal stress magnitude that may be related to depth such as increases due to thermal

7
effects (Sheorey, 1994). In theory, based on plane strain conditions, the horizontal stress
from depth and gravity is given by the following equation (Jaeger and Cook, 1969)
Pv= 1.1 [ν/(1-ν)] D (3.2)
where Pv = horizontal stress due to depth, psi,
ν = Poisson’s ratio,
and D = depth, ft.
Based on the average rock density for sedimentary rock, the vertical stress is assumed to
increase by about 1.1 psi/ft of depth.
Equation 3.2 can be used to estimate the contribution of the vertical stress or depth
to the measured horizontal stress. Subtracting the gravity effects from the measured
horizontal stress will result in the excess stress. The following equations give the excess
horizontal stress (Aggson, 1979A; Bickel, 1993)
Pe = P-1.1 [ν/(1-ν)] D (3.3a)
and
Qe = Q -1.1 [ν/(1-ν)] D (3.3b)
where Pe = maximum excess horizontal stress, psi,
and Qe = minimum excess horizontal stress, psi.
Essentially, the excess stress is the component of the horizontal stress that exceeds that
due to gravity.
The following equation is used to examine the relationship between the elastic
modulus and the excess stress
Pe, Qe = K1E + K2. (3.4)

8
As previously discussed, the constant K2 in equation 3.4 can be related to possible
thermally induced strains or other unknown factors that may systematically influence the
horizontal stresses. This constant can also result from non-uniform strain fields where
the stress does not vary linearly with the elastic modulus. If the constant K2 is
sufficiently small, the following equation can be used
Pe, Qe = K1E. (3.5)
A part or most of the excess stress may be tectonic in origin. The tectonic stresses
being related or developed from the forces that generate plate tectonics (Zoback and
Zoback, 1989; Zoback, 1992; Mark and Mucho, 1994). Because a large component of
the excess horizontal stress is probably due to tectonics, this component is often referred
to as the tectonic stress (Mark and Mucho, 1994; Cartwright, 1997). The portion of the
stress field that is influenced by the elastic modulus has been taken to be the tectonic
portion of the stress field (Cartwright, 1997). This implies that the tectonic stresses are
the result of the coefficient K1 in equations 3.4 and 3.5 where this coefficient can be
considered related to the tectonic strain. However, in discussions in this paper such
stresses and strains above the gravity load will be in general referred to as excess rather
than tectonic.
Strains from the maximum and minimum measured and excess horizontal stresses
can also be evaluated. These strains are calculated from the following type of equations
gp, gq = P,Q/E (3.6a)
and
gpe, gqe = Pe,Qe/E (3.6b)
where gp = strain from the maximum horizontal stress, micro strain,
gq = strain from the minimum horizontal stress, micro strain,
gpe = strain from the maximum excess horizontal stress, micro strain,
and gqe = strain from the minimum excess horizontal stress, micro strain.

9
These calculated strains are referred to as the strains resulting from the maximum or
minimum horizontal or excess stress. These are not the actual strains that would be
measured at a point since those strains involve the complete stress field and not just a
stress component. The excess or tectonic strain calculated in equation 3.6 is related to the
K1 coefficient of equation 3.5. With equation 3.6, the strains from the maximum
horizontal stress for individual measurements are calculated while for equation 3.5, the
coefficient is the average strain from the maximum horizontal stress based on a
regression analysis from several measurements. Further, the strains developed from these
equations can also be referred to as maximum and minimum horizontal stresses
normalized by the elastic modulus of the rock.
The depth factor can be evaluated through an equation of the following type
P = KD D + Ps (3.7)
where KD = depth factor, psi/ft,
and Ps = maximum horizontal stress at the surface, psi.
The maximum horizontal stress at the surface is the excess or tectonic stress.
Equations that combined both depth and the elastic properties can be developed
through a multiple regression analysis. These equations have the following form
P, Q = KD D+K1 E + K3 (3.8)
where K3 = constant, psi.
Finally, the following type of equation is used to evaluate the effects of depth on the
strain
gp = KND D + gs (3.9)
where KND = normalized depth factor, micro strain/ft,
10
and gs = strain from the maximum horizontal stress at the surface, micro strain.
Essentially, this equation eliminates the variation of the elastic properties between
measurements thus allowing for a comparison between the horizontal stress or strain and
depth that is not masked by the elastic properties.
3.2 STRESS MEASUREMENTS USED IN ANALYSIS
Stress measurements used in this analysis were determined by two techniques, these
were overcoring of either the USBM (United States Bureau of Mines) borehole
deformation gage or the CSIRO (Commonwealth Scientific and Industrial Organization
of Australia) Hollow Inclusion (HI) cell and hydraulic fracturing stress measurements.
The general criteria for using stress data were that both the depth of the site and the
elastic properties of the rock were required before a measurement could be used in the
analysis. With the USBM borehole deformation gage and hydraulic fracturing, the
horizontal stresses can be determined in vertically drilled holes either in the roof or floor
of the mine. With the CSIRO HI-cell, the complete 3-dimensional stress is determined
and the cell can be placed in any hole orientation to obtain the horizontal stress. All the
measurements used in this analysis were obtained from underground test sites.
The technique to measure the stresses with the USBM borehole deformation gage
and overcoring are well documented (Bickel, 1985, 1993). The result of an overcoring
measurement is the determination of the two dimensional stress in the plane of the
measurement. The elastic properties for the overcore are usually determined using a
biaxial test of the core and are normally determined for each stress measurement. Several
measurements are usually obtained from one hole at a site with the measurements being
averaged to determine a site stress (Duval and Aggson, 1980). In general, for the
analysis, if the elastic properties for a given overcoring measurement were not
determined the measurement was not used though there are some exceptions. All except
two of the site stresses were determined using this method.
The CSIRO HI-cell is also overcored and will result in the determination of the 3-
dimensional stress field. Again, the installation and use of the cell are well reported
(International Society of Rock Mechanics, 1987; Wortrucki and Walton, 1976). From the

11
three-dimensional stress, the principal stresses in the horizontal plane can be calculated.
The elastic properties are obtained by testing the individual overcores.
The hydraulic fracturing technique is also well documented though in this case the
underground data was obtained using specially designed equipment (Oyler, 2001).
Again, information on the elastic properties was required. However, the elastic
properties are not necessary to calculate stresses with this method and must be
determined by other methods such as from laboratory testing of core obtained from the
tested formation. Measured stresses may be reported from individual tests, as an average
stress for several tests or as a range of values from all the tests.

12
CHAPTER 4: HORIZONTAL STRESS MEASUREMENTS FROM SITES IN
THE EASTERN UNITED STATES
Figure 4-1 shows the site locations of the stress measurements used in this analysis
from the eastern and Midwestern United States. The measurements from forty sites are
grouped into three main regions. These are the northern and central Appalachian regions
and the eastern Mid-Continent region. In this section, the stress measurements, site depth
and elastic modulus of the rock as well as the horizontal strains from the maximum and
minimum stresses that will be used in the analysis are presented.
4.1 CENTRAL APPALACHIAN REGION
This region encompasses sites from southern West Virginia and eastern Kentucky.
Stress measurements were available from 15 sites in the Beckley seam, one site in the
Sewell seam, two sites in the Pocahontas #4 seam and one site in the Eagle seam in
southern West Virginia as well as one site in the Elkhorn #3 seam in eastern Kentucky.
Figure 4-1. Location of stress measurement sites used in study. Numbers in parentheses indicates multiple sites in close proximity.

13
Measurements at these sites were made using the USBM borehole deformation gage
and overcoring technique. The results of the individual stress measurements including:
the maximum and minimum measured and excess horizontal stress, the elastic modulus
and the resulting strains are given in Appendix A, table A-1 and A-2 for the Beckley
coalfield and in Appendix B, table B-1 for other sites in the central Appalachian region.
Table 4-1 shows a summary of the horizontal stress, stress direction, elastic modulus and
depth for each site.
Table 4-1. Summary of horizontal stresses by site in the central Appalachian region.
Horizontal stress Excess stress, psi Site Seam Maximum,
psi Minimum,
psi Direction of maximum Maximum Minimum
Elastic modulus, 106 psi
Depth, ft
Beckley #4, hole 1 Sewell 1484 1141 N 25 °W 1183 840 1.77 820
Beckley#1, hole 2 Beckley 3172 1890 N 75 °E 2758 1476 6.77 1130
Beckley #2, hole 3 Beckley 2308 1677 N 52 °W 1905 1274 2.26 1100
Bonny, hole 4 Beckley 3180 3038 N 54 °E 2763 2621 3.59 1136
Bonny, hole 5 Beckley 6109 3326 N 57 °E 5688 2905 6 1148
Maple Meadows, hole 6 Beckley 2730 2656 N 46 °W 2470 2396 6.32 708
Maple Meadows, hole 7 Beckley 4476 3240 N 63 °E 4207 2971 4.44 735
Maple Meadows, hole 8 Beckley 4258 2362 N 69 °E 3882 1986 7.09 1025
Maple Meadows, hole 9 Beckley 3188 2354 N 71 °E 2890 2056 2.46 814
Maple Meadows, hole 10 Beckley 3326 1657 N 54 °E 3030 1361 6.92 807
Beckley Mining, hole 11 Beckley 3095 2508 N 54 °E 2860 2273 2.95 640
Beckley Mining, hole 12 Beckley 3703 2902 N 71 °E 3384 2583 2.94 870
Beckley Mining, hole 13 Beckley 3124 2331 N 59 °E 2831 2038 2.7 800
Beckley Mining, hole 14 Beckley 3765 2280 N 55 °E 3384 1899 3.5 1040
Beckley #1, hole 15 Beckley 3199 1768 N 69 °E 2942 1511 7.32 700
Beckley #2, hole 16 Beckley 1800 1346 N 42 °W 1672 1218 1.72 350
Eagle seam mine Eagle 1760 1370 N 49 °E 1430 1040 2.95 900
Hendrix mine Elkhorn #3 2254 1802 N 65 °E 2052 1600 5.24 550
Olga mine, site 1 Pocahontas #4 3300 2400 N 62 °E 2713 1813 3.59 1600
Olga mine, site 2 Pocahontas #4 3000 1900 N 61 °E 2542 1442 3.25 1250

14
4.1.1 Beckley Coalfield
The Beckley coalfield is located about 10 miles west-northwest of Beckley, West
Virginia. Mines in the area have had considerable ground control problems related to the
horizontal stress (Aggson, 1978, 1979A; Dolinar et al., 1982; Agaptio et al., 1980;
Agapito and Gilbride, 2002). As a result of the stress related ground control problems, an
extensive horizontal stress measurement program was conducted in the Beckley coalfield
in the late 1970’s and early 1980’s (Aggson, 1978; Agapito et al., 1980). Stress
measurements were made at a total of 16 sites in 6 mines. The data set contains 61
individual stress measurements obtained in sixteen holes drilled in the mine roofs.
Fifteen sites were in the Beckley coal seam and one site in the overlying Sewell seam.
Figure 4-2 shows a map of the mines in the Beckley seam and the average
horizontal stresses measured in each mine. The average for the district is also shown
Figure 4-2. Average mine and district horizontal stresses measured in the Beckley seam (modified from Agapito et al., 1980A).

15
(Agapito, et al., 1980A). The measurements extend for a distance of about 25 miles with
the depth of the sites ranging from 350 to 1,148 ft. In general, the Beckley coalfield is
subjected to a horizontal stress that is substantially higher than the expected vertical
stress at these depths where the maximum horizontal stress by site varies from 1,484 to
6,109 psi. The direction of the maximum horizontal stress is from the northeast except in
the Beckley #2 Mine, and in the Beckley #4 Mine in the Sewell seam where the
directions are from the northwest. One site in the Maple Meadows Mine also has a
maximum horizontal stress from the northwest, however, the stresses at the site are nearly
hydrostatic. In general, from the Beckley #1 Mine to the Bonny Mine, both the
maximum and minimum horizontal stress magnitudes increase in the northeast direction.
Across the coalfield based on the site measurements, the elastic modulus ranges
from 1.77 to 7.32 million psi. The strain from the maximum horizontal stress ranges
from 432 to 1,296 micro strains and from the minimum horizontal stress from 242 to 987
micro strains. Clearly, there is a substantial range in both the elastic modulus and in the
strains.
4.1.2 Olga Mine, Pocahontas #4 Seam
The mine is located in McDowell county West Virginia in the Pocahontas #4 seam
about 25 miles southwest of the Beckley seam study area (Campoli et al., 1990).
Measurements were made at two sites in the mine with the overburden depths of 1,250
and 1,600 ft. However, for the analysis, the measurements at 5.8 ft at the 1,600 ft site and
from 2.3 to 6.6 ft at the 1,250 ft site were not used because the measurements were
relatively close to the opening and deeper measurements were available. At the two sites,
for the measurements used in the analysis, the site strains from the maximum horizontal
stress are 919 and 923 micro strains and from the minimum horizontal stress 585 and
668 micro strains. The site elastic modulus is 3.25 million psi for the 1,250 ft site and
3.59 million psi for the 1,600 ft site.
4.1.3 Mine, Eagle Seam
The mine is located in Raleigh county West Virginia about 10 miles northwest of
the Beckley seam study area. The measurements were made in the Eagle seam with a site

16
depth of 900 ft. The site strain from the maximum horizontal stress is 597 micro strains
and from the minimum horizontal stress, 464 micro strains. The site elastic modulus is
2.95 million psi.
4.1.4 Hendrix Mine, Elkhorn #3 Seam
The mine is located in Letcher County in southeastern Kentucky in the Elkhorn #3
seam. The measurements were made in shale in the mine roof (Wright et al., 1979;
Unrug et al., 1984). The deepest three measurements ranging from 13.7 to 23.4 feet in
the mine roof were used to calculate the horizontal stress. Because of delamination of the
large diameter overcores, elastic properties had to be determined from small diameter
core drilled from the larger cores. The elastic properties used were those determined in
the direction parallel to the bedding. One elastic modulus, 5.24 million psi was used to
determine the stresses from the three measurements. The maximum and minimum
horizontal strains from those stress components are 430 and 343 micro strains. The site
depth was 550 ft.
4.1.5 Summary of Central Appalachian Region
The central Appalachian region includes measurements from southern West
Virginia, and eastern Kentucky. Stress measurements used in the analysis were obtained
from the Beckley, Sewell, Pocahontas #4, Eagle and Elkhorn #3 seams. In general, the
Beckley seam dominates the data because of the number of sites. There is a substantial
range of strains over the region with the average site strains from the maximum
horizontal stress varying from 432 to 1,296 micro strains and the strains from the
minimum horizontal stress varying from 242 to 987 micro strains. The sites are located
in mountainous topography with the depth ranging from 350 to 1,600 ft. The site elastic
modulus varies from 1.77 to 7.32 million psi.
4.2 NORTHERN APPALACHIAN REGION
For this study, the northern Appalachian region encompasses parts of eastern Ohio,
northern West Virginia and western Pennsylvania. Table 4-2 shows the horizontal
stresses for each site. A summary of the individual measurements used in the analysis

17
including the maximum and minimum horizontal stress, the maximum and minimum
excess horizontal stress, the elastic modulus and the resulting strains are given in
Appendix C, table C-1.
Table 4-2. Summary of horizontal stresses by site for the northern Appalachian region.
Horizontal stress Excess stress, psi Site Seam/
formation Maximum, psi
Minimum, psi
Direction of maximum Maximum Minimum
Elastic Modulus,
106 psi
Depth, ft
Tanoma, PA Lower Kittanning 3335 2787 N 87 °E 3071 2523 5.8 720
Phillippi WV Lower Kittanning 3014 2265 N 75 °E 2812 2063 4.29 550
Fayette County, PA Loyalhanna 6910 3975 N 71 °E 6763 3828 11.2 400
Barberton, OH Columbus 5500 4000 E 4657 3157 9 2300Southwest, PA, site 1 Pittsburgh 1324 1024 N 32 °E 1177 877 1.8 400
Southwest, PA, site 2 Pittsburgh 2370 2260 N 78 °E 2113 2003 4.4 700
Southwest, PA, site3 Pittsburgh 3080 2180 N 70 °E 2787 1887 7.65 800
4.2.1 Loyalhanna Limestone Formation
Horizontal stress measurements were made in a limestone mine in the Loyalhanna
Limestone in Fayette County, Pennsylvania. This mine has had a history of roof falls
many of which are related to the horizontal stress (Iannacchione et al., 1997, 2002). The
stress measurements were made in the roof and floor using the hydraulic fracturing
technique (Oyler, 2001). The depth of the site was 400 ft.
Table 4-3 shows the horizontal stress measured at a given depth in the roof and
floor. An average horizontal stress is also given for the site. Based on a Poisson’s ratio
of 0.25 and the average horizontal stress at the site, the excess stresses were calculated as
Pe = 6,765 psi and Qe = 3,830 psi.
An elastic modulus for the site was determined from testing of vertically drilled
core from another nearby limestone mine in the same formation. The range in the elastic
modulus was 8.5 to 14.2 million psi with an average of 11.2 million psi. This average is
based on 12 specimens obtained from through out the Loyalhanna formation. Using the

18
average elastic modulus of 11.2 million psi, the strains from the average maximum and
minimum horizontal stresses are 617 and 355 micro strains.
Table 4-3. Horizontal stresses in the Loyalhanna formation, Fayette County, PA
Horizontal stress Location Depth of
measurement, ft Maximum, psi Minimum, psi Direction of maximum
Roof 10.5 7200 4456 N 76 °E Roof 11.5 6117 3145 N 76 °E Average 6659 3800 N 76 °E Floor 10 5800 3319 N 66 °E Floor 11 8524 4993 N 66 °E Average 7162 4150 N 66 °E Average 6910 3975 N 71 °E
4.2.2 Columbus Limestone
Stress measurements were made at a limestone mine near Barberton, Ohio using the
USBM borehole deformation gage and overcoring technique (Obert, 1962). The site was
in the Columbus Limestone at a depth of 2,300 ft. The measured horizontal stresses at
the site were P = 5,500 psi and Q = 4,000 psi. Using a Poisson’s ratio of 0.25, the excess
stresses are Pe = 4,665 psi and Qe = 3,165 psi.
The elastic modulus was not available for the individual measurements but the
range of the elastic modulus for the limestone was 8.0 to 9.7 million psi. The strains are
calculated using an elastic modulus of 9 million psi. The strains from the maximum and
minimum horizontal stresses are 611 and 444 micro strains.
4.2.3 Pittsburgh Coal Seam
The Pittsburgh coal seam is located in southwestern Pennsylvania, southeastern
Ohio and northern West Virginia. There was information available on the horizontal
stress from three different sites in three different mines. Site one was in the Bethlehem
Steel Mine # 60 located about 10 miles east of Washington, PA (Agarwal and Mayer,
1979). Sites 2 and 3 were located about 3 miles apart and about 20 miles southwest of
site one. The stresses were measured using the USBM borehole deformation gage and
overcoring technique.

19
The horizontal stresses at site one were calculated from a three-dimensional stress
determination (Agarwal and Mayer, 1979). The three holes used to determine the stress
field were drilled into the roof but none were vertical holes. Therefore, the horizontal
stress determined from the three-dimensional analysis must be used for the site and not
the stresses from the individual measurements. All the measurements at the site were
made in a sandstone unit. Based on the tests conducted on rock from the site, the elastic
modulus in the horizontal plane ranged from 1.5 to 2.0 million psi and averaged
1.8 million psi. This average elastic modulus and the calculated horizontal stresses from
the three-dimensional stress determination were used to calculate the elastic strains for
the site.
At sites 2 and 3, the stresses were determined in vertical holes drilled in the roof.
Therefore, the individual stress measurements as well as the average horizontal stress at
each site were used in the analysis.
For the Pittsburgh seam measurements, the site elastic modulus ranges from 1.8 to
7.65 million psi and the depth from 400 to 800 ft. The average site strain from the
maximum horizontal stress varies from 403 to 736 micro strains and the strains from the
minimum horizontal stress from 285 to 569 micro strains.
4.2.4 Lower Kittanning Seam
The lower Kittanning Seam is mined in northern West Virginia and central and
southwestern Pennsylvania. Stress data was available from 2 mines, the Tanoma Mine
near Indiana, Pennsylvania and a mine near Philippi, West Virginia. The mines are
approximately 100 miles apart. Both mines have experienced sufficiently severe ground
control problems related to the horizontal stress that the mines have either experimented
with or used stress relief mining techniques (Dolinar et al., 2000; Aggson and Mouyard,
1988A, 1988B). The USBM borehole deformation gage and overcoring technique was
used to determine the stresses at both mines.
The average site strains from the maximum horizontal stress are 575 and 703 micro
strains and the strains from the minimum horizontal stress are 481 and 528 micro strains.
In general, the levels of strain appear to be about 20 pct higher in the mine in West

20
Virginia. The site elastic modulus and depths are for the Tanoma site 4.29 million psi
and 720 ft and for the Philippi site 5.8 million psi and 720 ft.
4.2.5 Summary of Northern Appalachian Region
This region includes stress measurements made in the coal and limestone mines of
southwestern Pennsylvania, northern West Virginia and eastern Ohio. The data indicates
that there is a substantial range of the maximum horizontal stress magnitude as well as a
large range in the site depths. The maximum site stresses range from 1,324 to 6,910 psi.
Over the region the site depth varies from 400 to 2,300 feet and the site elastic modulus
from 1.8 to 11.2 million psi. The strains from the maximum horizontal stress for this
region range from 403 to 736 micro strains and the strain from the minimum horizontal
stress from 285 to 569 micro strains.
4.3 EASTERN MID-CONTINENT REGION
This region encompasses sites west of the Appalachian Mountains located in the
Illinois basin, Alabama, Tennessee and northern Kentucky. In the Illinois basin, stress
measurements from 8 sites in six mines were examined with the measurements being
made in both the Springfield # 5 and the Herrin # 6 seams. These measurements were
made using the USBM borehole deformation gage and overcoring technique. Some
mines within the Illinois basin have experienced ground control problems related to the
horizontal stress (Blevins, 1982; Blevins and Dopp, 1985; Hanna et al, 1986; Miller
1998). Core disking, another indication of a substantial horizontal stress in comparison
to the rock strength has also been observed at some locations (Hanna et al., 1986). There
is one site in a limestone mine in northern Kentucky, two sites from the Pratt coal seam in
Alabama and one site from a zinc mine in the dolomite formations of eastern Tennessee.
The measurements from these mines were also obtained using the USBM borehole gage
and overcoring technique. The CSIRO HI-cell was used to determine the horizontal
stresses at a site in the Blue Creek/Mary Lee seams in Alabama.
A summary of the individual stress measurement data from each site including the
maximum and minimum horizontal stresses, excess horizontal stresses, elastic modulus

21
and calculated strains are given in Appendix D, table D-1. Table 4-4 gives a summary of
the horizontal stresses for each site.
Table 4-4. Summary of horizontal stresses by site in the eastern Mid-Continent region.
Horizontal stress Excess stress, psi
Mine Maximum, psi
Minimum, psi
Direction of
maximumMaximum Minimum
Elastic modulus,106 psi
Depth, ft
Wabash, site 1 1245 963 East-West 889 607 3.11 970 Wabash, site 2 1429 823 N 80 °E 1117 511 2.9 850 Wabash, site 3 1459 589 N 75 °W 1144 274 2.85 860 Monterey 888 573 N 64 °E 782 467 1.67 290 Galatia 1767 531 N 73 °E 1558 322 2.96 570 Peabody #2 969 896 N 81 °E 859 786 2.2 300 Peabody #10 1800 750 N 69 °E 1668 618 2.84 360 Turris 1986 1010 N 49 °E 1885 909 8.57 275 Campbell County, KY 3784 1320 N 78 °E 3516 1052 9.32 730
Immel Mine, TN 3294 1281 N 61 °E 2954 942 7.96 925
North River Mine, site 1, AL
2123 297 N 57 °E 1940 114 5.42 500
North River Mine, site 2, AL
1042 385 N 69 °E 870 213 4.72 470
Jim Walters #7, AL 3050 1520 N 71 °E 2364 834 5.4 1870
4.3.1 Wabash Mine
The mine is in the Springfield # 5 seam located near Keansburg, Illinois. There
were three measurement sites within the mine (Ingram and Molinda, 1988). For the more
general analysis and for calculation of the elastic strains for each site, all measurements
are used from hole 1, only the deepest three measurements from hole 2 and only the four
deepest measurements from hole 3. This resulted in measurements that were 9.9 ft or
deeper into the roof being used in the analysis. The deeper measurements reduced the
potential influence of the opening on the results. The average strains from the maximum
horizontal stress are for hole 1, 400 micro strains, for hole 2, 493 micro strains, and for

22
hole 3, 512 micro strains. From the minimum horizontal stress, the average strains are
for hole one, 310 micro strains, for hole two, 284 micro strains and for hole three,
207 micro strains. The range of the individual elastic modulus from 2.63 to 3.39 million
psi and the variation of the site depths from 860 to 950 ft are both limited. Hole 1 was
about 1,500 ft from a large normal fault with the site possibly influenced to some degree
by that feature.
4.3.2 Monterey Mine
The mine is located near Carlinville, Illinois in the Herrin # 6 seam. Because, the
two shallower measurements at 4.33 and 6.33 ft show less strain from the maximum
horizontal stress than the other measurements, these measurements may be under the
influence of the opening. Therefore, only the two deeper measurements are used in the
analysis. Based on the deepest two measurements, the average strain due to the
maximum horizontal stress is 532 micro strains while the average strain from the
minimum horizontal stress is 343 micro strains. The range of the individual elastic
modulus is from 1.44 to 1.9 million psi while the site depth is 290 ft (Beerkircher, 1994).
4.3.3 Galatia Mine
The mine is located near Galatia, Illinois in the Springfield # 5 seam. Although
measurements were obtained at three sites in the mine, elastic properties were available
from only one hole (Ingram and Molinda, 1988). Only the three deepest measurements
from 10.1 to 13.1 ft are used in the analysis. The average strain from the maximum
horizontal stress is 579 micro strains while the strain from the minimum horizontal stress
is 179 micro strains. The range of the elastic modulus for the last three measurements is
only from 2.81 to 3.17 million psi. The site depth is 570 ft.
4.3.4 Turris Mine
The mine is located near Elkhart, Illinois in the Springfield #5 seam. The
measurements are at a relatively shallow depth in the roof at 5.8 and 6.2 ft and may be
under the influence of the opening. The range in the elastic modulus is only from 8.08 to
9.05 million psi. The average strain from the maximum horizontal stress is 232 micro

23
strains while the average strain from the minimum horizontal stress is 118 micro strains.
The site is at a depth of 275 ft and is near a bedrock valley.
4.3.5 Peabody # 10 Mine
The mine is located near Pawnee, Illinois in the Herrin # 6 seam. The depth of the
site is 360 ft. For the general analysis only the last three measurements obtained at
depths from 9 to 11 feet from the opening are used (Hanna et al., 1991). For these last
three measurements there is a large range in the elastic modulus from 1.28 to 5.7 million
psi. The average strain from the maximum horizontal stress based on these last three
measurements is 634 micro strains while the average strain from the minimum horizontal
stress is 264 micro strains.
4.3.6 Peabody #2 Mine
The mine is located near Henderson, Kentucky in the Springfield # 5 seam. Only
the deeper three measurements are used in the more general analysis (Wright et al., 1980;
Unrug et al., 1984). At this site, for the last three measurements only one elastic modulus
was obtained, an elastic modulus of 2.2 million psi, therefore the stresses and strains are
averaged from the last three measurements. Based on these last three measurements, the
strain from the maximum horizontal stress is 440 micro strains while the strain from the
minimum horizontal stress is 407 micro strains. The depth of the site is 300 ft.
4.3.7 Ft. Campbell Limestone
The mine is located in the Ft. Campbell Limestone in Campbell County, KY at a
depth of 730 ft. A complete three-dimensional stress determination was made using the
USBM borehole deformation gage and overcoring technique.
The horizontal stresses were calculated from the three-dimensional stress
determination. The elastic modulus for the measurements used in the calculations ranged
from 8.1 to 11.0 million psi where the average elastic modulus was 9.32 million psi. The
resulting average strains from the maximum and minimum horizontal stresses are 406
and 142 micro strains.

24
4.3.8 North River Mine
This mine is located near Tuscaloosa, Alabama in the Pratt seam with stress
measurements made at two sites. The depth of site one was 500 feet. At site one, there
were 5 measurements made at depths ranging from 7 to 11 ft in the mine roof, however,
the elastic modulus was determined for only 4 of the measurements. The elastic modulus
ranges from 5.11 to 5.91 million psi. At site one, the strains from the maximum and
minimum site stresses are 392 and 55 micro strains.
Site 2 was at a depth of 470 ft and about 2.3 miles from site one. The site was 600
ft from a large normal fault. Only the deepest 3 measurements from 8 to 10 ft are used in
the analysis. The elastic modulus ranges from 4.45 to 5.12 million psi. The average site
strains from the maximum and minimum stress are 221 and 87 micro strains.
4.3.9 Jim Walters # 7 Mine
The mine is located near Brookwood, Alabama in the Blue Creek/Mary Lee seams.
The stresses were determined using the CSIRO HI-Cell and overcoring technique
(Brasfield and Hendon, 1994; Hendon et al., 1995). The site depth was 1,870 ft. The
specific elastic modulus used in the calculations is not given but the average elastic
modulus of the main roof where the measurements appear to have been obtained is
reported. The elastic modulus based on physical properties determined on vertically
oriented core is 5.4 million psi with a standard deviation 1.1 million psi. Using this
elastic modulus, the average site strain from the maximum horizontal stress is 565 micro
strains and from the minimum horizontal stress 281 micro strains.
4.3.10 Immel Mine
The mine is located about 10 miles east of Knoxville, Tennessee in the dolomite
and limestone formations that contain zinc mineralization (Crawford and Hoagland,
1968). The depth of the site was 925 ft. Measurements were made in a vertical down
hole, hole 3 and a vertical up hole, hole 4. The elastic modulus varied from 4.86 to
11.94 million psi while the average site elastic modulus was 7.96 million psi. Much of
the variation in the elastic modulus may be due to mineralization. The average site

25
strains are from the maximum horizontal stress, 414 micro strains and from the minimum
horizontal stress, 161 micro strains.
4.3.11 Summary of Eastern Mid-Continent Region
The region includes sites in Illinois and western Kentucky in both the Springfield
#5 and Herrin # 6 seams of the Illinois basin, a site in limestone in northern Kentucky,
two sites in the Pratt seam and one site in the Blue Creek/Mary Lee seams in Alabama
and a site in dolomite formations in eastern Tennessee. Over this region the site elastic
modulus varies from 1.67 to 9.32 million psi and the depth ranges from 275 to 1,870 ft.
The average site strains from the maximum horizontal stress range from 221 to 634 micro
strains while the average site strains from the minimum horizontal stress ranges from 55
to 407 micro strains. In general, most sites in this region have very biaxial horizontal
stresses and strains.

26
CHAPTER 5: BECKLEY COAL SEAM
Information regarding the depth of the sites and the elastic modulus for the
individual stress measurements was available from 15 sites within the Beckley coal seam.
Therefore, this geographically concentrated set of data is analyzed with respect to the
elastic modulus and the depth. In this part of the analysis, the site data from the
Beckley #4 mine in the Sewell seam is not included. The developed regression models
are based on the data found in Appendix A, tables A1 and A2.
In the analysis throughout most of this section, the individual measurements are
used rather than site averages. This is done to evaluate more completely the variation
that may occur between the stress and the elastic modulus since the elastic modulus will
change between each measurement. However, local variation between measurements
may occur beyond that caused by the elastic modulus, therefore to eliminate the local
variation in one section an analysis is done using the average site stresses and elastic
properties. Further, several measurements from a site are usually combined to produce
an average site stress that is then used in mine design evaluation.
5.1 VARIATION OF THE HORIZONTAL STRESS WITH THE ELASTIC
MODULUS
To evaluate the variation of the horizontal stress with respect to the elastic modulus,
a regression line is fit through all 60 individual stress measurements from the Beckley
seam. Figure 5-1 shows a graph of the maximum horizontal stress versus the elastic
modulus along with the resulting regression line. The regression equation is
P = 180 E + 2666. (5.1)
The coefficient of determination is only 0.12. There is little correlation between the
elastic modulus and the maximum horizontal stress. This indicates that the strain field is
not very uniform across the Beckley coal seam.

27
Table 5-1 shows the average strain resulting from the maximum and minimum
horizontal stress for each hole. The average strain is calculated based on the strains
determined from the individual stress measurements at each site. Essentially, in the
Beckley seam/coalfield there are two different strain conditions, a high strain and a low
strain field. The high strain field has average site strains above 885 micro strains while
the low strain field has average site strains below 602 micro strains. Further, the two
strain conditions are geographically distinct. The low strain area includes the sites from
the Beckley #1 Mine and the adjacent southwest section of the Maple Meadows Mine
(Figure 5-2). The high strain area includes the sites from the northeast section of the
Maple Meadows Mine and the adjoining Beckley and Bonny Mines as well as the
Beckley #2 Mine.
Because of the two distinct strain fields, each strain field is analyzed separately to
determine if the horizontal stress varies with the elastic modulus. Figure 5-3 shows a
graph of the maximum horizontal stress versus the elastic modulus from the individual
Figure 5-1. The maximum horizontal stress versus the elastic modulus, Beckley coal seam (combined strain zones).
y = 180x + 2666R2 = 0.12
0
1000
2000
3000
4000
5000
6000
7000
8000
9000
0 1 2 3 4 5 6 7 8 9
Elastic Modulus, 106 psi
Stre
ss, p
si

28
stress measurements for the high strain area. A regression line is fit through the data with
the resulting equation of
P = 878 E + 703. (5.2)
Table 5-1. Average horizontal strains from the maximum and minimum horizontal stresses by site in the Beckley coal seam1.
Mine Hole Average
maximum micro strain
Standard deviation
Pct ofstrain
Average minimum
micro strain
Standarddeviation
Pct ofstrain
Elastic modulus 106 psi
Standarddeviation
Depth, ft
Low Strain Beckley 1 2 469 36 7.7 279 25 9.0 6.77 0.55 1130
Maple Meadows 6 432 41 9.5 420 53 12.6 6.32 0.2 708
Maple Meadows 8 601 104 17.3 333 41 12.3 7.09 1.02 1025
Maple Meadows 10 481 66 13.7 239 30 12.6 6.92 0.24 807 Beckley 1 15 437 86 19.7 242 54 22.3 7.32 0.5 700 Average 484 69 14.3 303 78 25.7 6.88 874
High Strain Beckley #2 3 1021 2 0.2 742 12 1.6 2.26 0.07 1100
Bonny 4 886 192 21.7 846 185 21.9 3.59 0.24 1136 Bonny 5 1018 114 11.2 554 137 24.7 6 0.96 1148 Maple
Meadows 7 1008 423 42.0 730 344 47.1 4.44 1.31 735 Maple
Meadows 9 1296 147 11.3 957 201 21.0 2.46 0.08 814 Beckley Mining 11 1049 215 20.5 850 282 33.2 2.95 0.58 640 Beckley Mining 12 1260 53 4.2 987 32 3.2 2.94 0.29 870 Beckley Mining 13 1157 128 11.1 863 134 15.5 2.7 0.24 800 Beckley Mining 14 1076 104 9.7 651 82 12.6 3.5 0.41 1040
Beckley #2 16 1047 61 5.8 783 10 1.3 1.72 0.09 350 Average 1082 123 11.4 796 133 16.7 3.26 1.23 863
1Each hole is a separate site location. The individual measurements used to develop the average values are given in Appendix A.

29
Figure 5-3. The maximum horizontal stress versus the elastic modulus,
Beckley coal seam (high strain zone).
y = 878x + 703R2 = 0.73
0
1000
2000
3000
4000
5000
6000
7000
8000
9000
0 1 2 3 4 5 6 7 8
Elastic Modulus, 106 psi
Stre
ss, p
si
North
Bonny Mine 3815 psi, N 57
oE
3101 psi, N 33oW
Beckley Mining Co. Mine 3339 psi, N 59
oE
2515 psi, N 31oW
Maple Meadows Mine 3380 psi N 68
oE
2459 psi, N 22oW
Beckley No. 1 Mine3172 psi, N 75
oE
1890 psi, N 15oW
Beckley No. 2 Mine2305 psi, N 52
oW
1677 psi, N 38oE
Low Strain
High Strain
0 6
Scale, Miles
Figure 5-2. Low and high strain zones in the Beckley Seam (modified from Agapito et al., 1980A).

30
The coefficient of determination is 0.73. There is a fairly strong correlation between the
maximum horizontal stress and the elastic modulus. However, there is still sufficient
variation in the strain field to result in a coefficient of determination that is somewhat less
than one. Some of this variation is the result of the strains varying horizontally across the
zone as seen by the difference in average between holes (table 5-1). However, some of
the variation is also the result of the strain field varying vertically or between
measurements in the same hole as can be seen by the standard deviation for each hole in
table 5-1. Further, any difference in the strain field resulting from the variation in depth
between sites has not been taken into account.
Figure 5-4 shows a graph of the maximum horizontal stress versus the elastic
modulus for the low strain region. Again, a linear regression is fit through the data with
the resulting equation of
P = 267 E + 1439. (5.3)
Figure 5-4. The maximum horizontal stress versus the elastic modulus, Beckley coal seam (low strain zone).
y = 267x + 1439R2 = 0.08
0
500
1000
1500
2000
2500
3000
3500
4000
4500
5000
0 1 2 3 4 5 6 7 8 9
Elastic Modulus, 106 psi
Stre
ss, p
si

31
The coefficient of determination is only 0.08. Although the trend is for increasing
horizontal stress with the elastic modulus, the correlation is very poor even though it
appears the measurements are taken from essentially the same strain field. Further, the
increase in stress with the elastic modulus is much less than for the high strain field as
indicated by the coefficients for the elastic modulus for each equation. With the lower
strain field, the affects on the increase in the horizontal stress are proportionally less than
for a higher strain field and in this case, the changes are not sufficient to overcome the
local or mine wide variations in the strain field. Further, the range of the elastic modulus
is limited with this set of measurements, ranging only from 6.1 to 8.34 million psi. This
limited range results in a less reliable model.
The relationship between the minimum horizontal stress and the elastic modulus is
also examined. Again, the minimum horizontal stress is segmented into two distinct
Figure 5-5. The minimum horizontal stress versus the elastic modulus, Beckley coal seam (high strain zone).
y = 393x + 1185R2 = 0.35
0
1000
2000
3000
4000
5000
6000
0 1 2 3 4 5 6 7 8
Elastic Modulus, 106 psi
Stre
ss, p
si

32
strain fields. Figure 5-5 shows the minimum horizontal stress versus the elastic modulus
for the high strain zone. The resulting regression equation is
Q = 393 E + 1185. (5.4)
The coefficient of determination is 0.35. Although there is trend of increasing horizontal
stress with the elastic modulus, the correlation is much less than for the maximum
horizontal stress. The larger constant, the relatively higher standard deviation of the
strain and the greater site strain range indicates that the strain field from the minimum
horizontal stress across the Beckley seam is not as uniform as the strain from the
maximum horizontal stress. Further, the lowest strain site has the highest elastic modulus
(table 5-1).
Figure 5-6 shows the minimum horizontal stress versus the elastic modulus for the
low strain zone. Again a regression line is fit through the data. The coefficient of
determination is only 0.03. Essentially, there is no correlation between the minimum
horizontal stress and the elastic modulus for the low strain zone.
Figure 5-6. The minimum horizontal stress versus the elastic modulus, Beckley coal seam (low strain zone).
y = -114x + 2828R2 = 0.03
0
500
1000
1500
2000
2500
3000
3500
0 1 2 3 4 5 6 7 8 9
Elastic Modulus, 106 psi
Stre
ss, p
si

33
There is only a very weak relationship between the minimum horizontal stress and
the elastic modulus. This in part is due to the strain fields from the minimum horizontal
stress being less uniform. This can be seen with the standard deviation of the minimum
strain being a much higher percent of the average than for the maximum strain
(table 5-1). Further, these strains are much lower than the maximum strains and,
therefore, there will be less increase in stress with the elastic modulus. There does appear
to be a difference between the two stress components with the minimum component not
being as strongly influenced by the elastic modulus.
5.2 VARIATION OF HORIZONTAL STRESS WITH DEPTH
Since there is a range of depths for the sites in the Beckley seam, the influence of
depth on the measurements is evaluated. When examining the Beckley data for depth
effects, all the data is combined where the data is not separated based on the two distinct
strain fields. Further, only the site average maximum horizontal stress is used in the
analysis. The average is used to give equal weight to all sites. Figure 5-7 shows a graph
of the average maximum horizontal stress from each site versus the depth with a
regression line fit through the data. The resulting equation is
P = 2.08 D + 1629. (5.5)
However, the coefficient of determination is only 0.22. The correlation is low but there is
a general trend of increasing maximum horizontal stress with depth. In fact, the
horizontal stress is increasing at a rate of 2.1 psi/ft. This is twice the rate for the expected
increase of the vertical stress. However, when the depth coefficient is compared to zero,
the t statistic of 1.94 indicates that the coefficient is not significantly greater than zero at
a 0.05 significance level.
Further, one data point controls to a large extent the increase of the maximum
horizontal stress with depth, the Bonny Mine, hole 5, with a maximum horizontal stress
of 6,109 psi at a depth of 1,148 ft. Without this data point, the depth factor drops to
1.1 psi/ft of depth while the coefficient of determination is only 0.12. However, it may
not be the depth that is causing such a high horizontal stress at this site but the relatively

34
high elastic modulus of 6 million psi in the high strain zone. Therefore, no apparent
significant increase in the maximum horizontal stress with depth over the Beckley seam
is observed. However, the topography in the Beckley area is mountainous and therefore
variable and complex.
Figure 5-8 shows the strain from the maximum horizontal stress versus the depth.
These strains can be considered as the stress normalized by the elastic modulus. The
strain actually decreases slightly with depth though the coefficient of determination of
only 0.001 indicates that there is no relationship between the depth and the strain.
Essentially, when the effects of the elastic modulus are removed from the stress data,
there is no depth factor. Further, the difference in the two strain fields (low and high) is
not the result of depth otherwise there should be a strong relationship between depth and
the strain.
Figure 5-7. The maximum horizontal stress versus the depth, Beckley coal seam.
y = 2.08x + 1629R2 = 0.22
0
1000
2000
3000
4000
5000
6000
7000
0 200 400 600 800 1000 1200 1400
Depth, ft
Stre
ss, p
si

35
5.3 VARIATION OF HORIZONTAL STRESS WITH BOTH THE ELASTIC
MODULUS AND DEPTH
A multiple regression analysis with the horizontal stress as the dependent variable
and the elastic modulus and depth as the independent variables is also conducted. In this
case, the individual stress measurements are used. However, with the inclusion of the
elastic modulus, the analysis must be separated into the low and high strain zones. From
a regression analysis on the data from the low strain zone, the following equation results
P = 1.53 D + 169 E + 797. (5.6)
The multiple correlation coefficient squared is 0.24. This is certainly an improvement
over the coefficient of determination for just the elastic modulus. The maximum
horizontal stress is increasing at 1.5 psi/ft but the t statistic of 1.67 indicates that the
coefficient is not significantly greater than zero at a 0.05 significance level. The strain
coefficient is low at 169 micro strains.
Figure 5-8. The strain from the maximum horizontal stress versus the depth, Beckley coal seam (combined strain zones).
y = -0.05x + 991R2 = 0.001
0
200
400
600
800
1000
1200
1400
1600
1800
0 200 400 600 800 1000 1200 1400
Depth, ft
Stra
in, m
irco
stra
in

36
For the high strain zone, the multiple regression analysis results in the following
equation
P = 0.73 D + 797 E + 343. (5.7)
The multiple correlation coefficient is 0.75. There is little improvement over the
regression analysis with only the elastic modulus. Further, the t statistic for the depth
coefficient is only 1.55 where the coefficient is not significantly greater than zero at a
0.05 significance level.
The multiple linear regression analysis provides little or no additional information
to explain the variation of the maximum horizontal stress in the high strain zone. This is
to a large measure due to the weak influence of the depth on the maximum horizontal
stress. For the low strain zone, although the inclusion of depth has improved the model,
the depth factor is not significantly greater than zero. Therefore, the depth does not
appear to be a major factor in the change in magnitude of the maximum horizontal stress
in the Beckley seam.
5.4 EXCESS HORIZONTAL STRESS
To establish the relationship between the elastic modulus and excess horizontal
stress, a linear regression is fit through both the high and low strain data sets. For the
maximum excess horizontal stress from the high strain zone, the resulting equation is
Pe = 824 E + 578. (5.8)
The coefficient of determination is 0.72. There is fairly good correlation between the
elastic modulus and the maximum excess horizontal stress where the model can explain
about 72 percent of the variation in the maximum excess horizontal stress. Fitting the
linear regression through zero results in the relationship between the elastic modulus and
the maximum excess horizontal stress without a constant. The resulting equation is
Pe = 988 E. (5.9)

37
The coefficient of determination is 0.69. The model fit is only slightly reduced by
constraining the fit through zero. From the coefficient of the equation, the excess or
tectonic strain component producing the maximum excess stress is 988 micro strains.
The equation for the minimum excess horizontal stress for the high strain zone is
Qe = 339 E + 1061. (5.10)
The coefficient of determination is 0.30. The correlation is poor and the model can only
explain 30 percent of the variation of the minimum excess horizontal stress. Fitting the
regression line through zero results in a negative coefficient of determination. The
variation of the minimum excess horizontal stress is much less dependent on the elastic
modulus than the maximum excess horizontal stress.
For the low strain region, the coefficient of determination from fitting a regression
through the data is for the maximum excess horizontal stress only 0.07 and for the
minimum excess horizontal stress only 0.04. Essentially, for the low strain zone, there is
little or no relationship between the excess horizontal stress and the elastic modulus.
Regression line fits are so poor that the model coefficients are meaningless.
5.5 VARIATION OF THE HORIZONTAL STRESS WITH THE ELASTIC
MODULUS BASED ON SITE AVERAGE STRESSES
The relationship between the horizontal stress and the elastic modulus is evaluated
using the site average stresses and not the individual stress measurements. This should
reduce the effects of local variations in the stress and strain fields. Further, individual
measurements are normally combined to develop the average stress field at a site.
Table 5-2 shows the regression equations for the maximum horizontal stress versus the
elastic modulus based on both the individual measurements and the site averages.

38
Table 5-2. Comparison of the regression parameters and statistics based on individual or average site stresses, Beckley coal seam.
Analysis Stress component
Elastic modulus coefficient, K1, micro strain
Constant, K2
Coefficient of determination,
R2 Measured stress-high strain zone
Individual Maximum 878 703 0.73 Average Maximum 926 459 0.92
Individual Minimum 393 1185 0.35 Average Minimum 437 1077 0.69
Measured stress-low strain zone Individual Maximum 268 1439 0.08 Average Maximum 867 -2637 0.33
Individual Minimum -114 2828 0.03 Average Minimum -702 6897 0.38
For the high strain zone, the regression coefficients and constants are similar.
However, the correlations are much better when the site averages are used. For the
maximum stress, the coefficient of determination went from 0.73 to 0.92 while for the
minimum stress the coefficient of determination went from 0.35 to 0.69. This difference
reflects the local variations in the strain field between individual measurements at a site.
For the low strain zone, the coefficient of determination certainly improves when
the averages are used. However, the regression coefficients and constants for the
equations are quite different. This reflects the narrowing of an already small range of the
elastic modulus. For the individual stress measurements, the elastic modulus ranges from
6.1 to 8.34 million psi while for the site averages, the elastic modulus ranges from only
6.32 to 7.32 million psi.
5.6 VARIATION OF THE HORIZONTAL STRESS WITH THE ELASTIC
MODULUS AT INDIVIDUAL SITES AND MINES
By looking at the individual sites and mines, there should be less variation in the
strain field and potentially better correlation between the horizontal stress magnitude and
the elastic modulus. Therefore, the relationship between the elastic modulus and the
horizontal stress for individual sites and mines is evaluated.

39
Equation 3.1 is used as the regression model to fit to the maximum horizontal stress
and elastic property data for each of the individual sites. Table 5-3 shows the resulting
coefficients, constants and the coefficients of determination from the equations for each
site.
Table 5-3. Constants and correlations from a regression fit for the maximum horizontal stress from individual sites in Beckley coal seam.
Site/hole Number of measurements
CoefficientK1
ConstantK2
Coefficient of determination
R2
Elastic modulus range, 106 psi
Elastic modulus span, 106
psi Low Strain
Beckley#1, hole 2 3 52 2868 0.40 6.22-8.34 2.12 Maple Meadows, hole 6 3 1262 -5357 0.97 6.1-6.47 0.37 Maple Meadows, hole 8 3 -55 4559 0.02 6.47-8.26 1.79 Maple Meadows, hole 10 4 328 976 0.02 6.76-7.24 0.48 Beckley #1, hole 15 3 1386 -7148 0.78 6.76-7.69 0.93
High Strain Beckley #2, hole 3 2 -1050 4888 1.00 2.21-231 0.1 Bonny, hole 4 4 -220 4243 0.01 3.27-3.78 0.51 Bonny, hole 5 3 1706 -4045 1.00 5.31-7.03 1.72 Maple Meadows, hole 7 3 -206 5132 0.52 3-5.56 2.56 Maple Meadows, hole 9 6 1976 -1735 0.19 2.34-2.57 0.23 Beckley Mining, hole 11 6 224 2338 0.15 2.32-3.78 1.46 Beckley Mining, hole 12 5 878 1045 0.83 2.59-3.28 0.69 Beckley Mining, hole 13 6 122 2582 0.01 2.33-2.94 0.61 Beckley Mining, hole 14 5 446 2188 0.31 3.09-4.17 1.08 Beckley # 2, hole 16 4 211 1453 0.06 1.65-1.85 0.2
There is a wide range of coefficients of determination with several sites showing
poor or little or no correlation. The poor correlations result to a large degree from the
very narrow range of the elastic modulus measured at each site. The span for the elastic
modulus ranged from 0.1 to 2.56 million psi. In general, the regression analysis with the
wider ranges of the elastic modulus gives a better correlation. Therefore, a sufficient
range of the elastic modulus is usually required to overcome the local variations in the
strain field and to establish a reliable model. However, there are some exceptions where
a narrow range has resulted in a higher correlation. There is also at least one site with a

40
wider range of elastic modulus yet with almost no correlation. This reflects the
significant variation of the strain field between measurements.
There is also a wide range of coefficients and constants that were determined even
in essentially the same strain field with some of the coefficients being negative. Again
this reflects the narrow range of the elastic properties used in the regression analysis.
With such a narrow range of the elastic modulus, the values of the coefficients and
constants can vary significantly.
To develop a broader range of the elastic modulus, the data from each mine is
considered. Table 5-4 shows the coefficients, constants and the coefficients of
determination from a regression analysis for each mine. However, the Maple Meadows
Mine sites are separated into high and low strain groups for the analysis.
Table 5-4. Constants and correlations from a regression fit for the maximum horizontal stresses from each mine in the Beckley coal seam.
Elastic modulus, 106 psi
Mine Number of measurements
Coefficient K1
ConstantK2
Coefficient of determination
R2 Range Span
Beckley #1 6 309 845 0.2 6.22-8.34 2.12 Beckley # 2 6 968 161 0.93 1.65-2.31 0.66 Beckley 22 545 1780 0.31 2.51-4.17 1.66 Bonny 7 1267 -1132 0.9 3.27-7.03 3.7 Maple Meadows (Low) 10 502 18 0.18 6.1-8.26 2.66
Maple Meadows (High) 9 354 2474 0.36 2.34-5.56 3.22
At the Bonny Mine, the span of the elastic modulus is sufficient to result in a very
good correlation between the maximum horizontal stress and the elastic modulus.
Figure 5-9 shows the maximum horizontal stress versus the elastic modulus for the mine.
At the Bonny Mine, the strain field is sufficiently uniform with a large enough range of
the elastic modulus for an adequate model to be developed. Further, fitting a regression
line through the maximum excess horizontal stress data and zero results in the following
equation
Pe = 933 E. (5.11)

41
The resulting coefficient of determination is 0.85. The mine is being subjected to a strain
from the maximum excess horizontal stress of 933 micro strains.
5.7 BECKLEY SEAM ANALYSIS-CONCLUSIONS
A sufficiently uniform strain field is required to develop adequate regression
models. When all the Beckley seam data was combined there was little correlation
between the maximum horizontal stress and the elastic modulus because of the large
range in site maximum horizontal strains.
The sites in the Beckley seam can be separated into high and low strain zones that
are geographically distinct. The high strain group contains those sites with strains from
the maximum horizontal stress above 885 micro strains and the low strain group contains
sites with strains from the maximum horizontal stress below 602 micro strains.
The elastic modulus explains much of the variation of the maximum horizontal
stress in the high strain zone. For the high strain zone models, the coefficient of
determination is 0.73 when individual stress measurements are used and 0.92 when the
site averages are used.
Figure 5-9. The maximum horizontal stress versus the elastic modulus, Bonny mine.
y = 1016xR2 = 0.88
0
1000
2000
3000
4000
5000
6000
7000
8000
9000
0 1 2 3 4 5 6 7 8Elastic modulus, 106 psi
Stre
ss, p
si

42
A sufficient range of the elastic modulus is required to establish adequate
relationships between the maximum horizontal stress and the elastic modulus. For the
low strain zone there was little correlation between the maximum horizontal stress and
the elastic modulus in part because of the limited elastic modulus range.
The minimum horizontal stress variation is less dependent on the elastic modulus
than the maximum horizontal stress variation. For the minimum horizontal stress in the
high strain zone, the coefficient of determination is only 0.35 for the individual
measurements.
Depth did not cause a significant increase in the maximum horizontal stress across
the seam even though the depth factor is 2.1 psi/ft. Further, the maximum horizontal
stress normalized by the elastic modulus actually decreases with depth though not
significantly. Essentially, the variation of the maximum horizontal stress that might be
attributed to the depth can be explained by the elastic modulus.

43
CHAPTER 6.0: VARIATION OF STRAINS IN THE EASTERN UNITED
STATES
If general or more general models are to be developed between the horizontal stress
and the elastic modulus, the distribution of strains across the eastern United States needs
to be examined. Based on the previous Beckley seam analysis, geographic regions where
the strain fields are sufficiently uniform must be identified. Essentially, strains can be
used to delineate what zones any stress models can be applied across and whether
regional groupings can be used in the evaluation of the variation of the horizontal stress
magnitude. If geographic regions with sufficiently uniform strains are established, the
variation in the magnitude of the horizontal stress should be to a large degree dependent
on the elastic modulus.
The analysis of regional site variation is developed by evaluation of the average site
strains. However, the local site variations to the strain field are also examined.
Essentially, this establishes the reliability of the average site strains. Besides the elastic
properties, the variation of the strain field both locally and regionally will directly affect
the magnitude and the variation in the magnitude of the horizontal stress.
In this section, the actual applied horizontal strains are calculated and used to
evaluate the strain variation both locally and regionally. There are two horizontal strain
components, the maximum and minimum applied horizontal strains that produce a
horizontal stress. Further, to determine the strains locally, the average strain based on
each measurement from a site is calculated and to develop strains regionally, the average
strain from each site is combined with the average strains from other sites within a
region.
6.1 DETERMINATION OF THE APPLIED HORIZONTAL STRAINS
The relationship between the maximum horizontal stress and the applied maximum
and minimum horizontal strain is given by the following equation (Amadi, 1996)
P = E (εpA + νεqA ) / (1- ν2 ) + 1.1 [ν/(1-ν)] D (6.1)

44
where εpA = applied maximum horizontal strain, micro strain,
and εqA = applied minimum horizontal strain, micro strain.
Rewriting the equation results in the maximum excess horizontal stress
Pe = P - 1.1 [ν/(1-ν)] D = E (εpA+ νεqA ) /(1- ν2 ). (6.2)
A similar equation can be developed for the minimum excess horizontal stress
Qe = Q - 1.1 [ν/(1-ν)] D = E (εqA + ν εpA) / (1- ν2 ). (6.3)
Solving equations 6.2 and 6.3 for the strains results in the following equations
εpA = (Pe - ν x Qe)/E (6.4)
and
εqA = (Qe - ν Pe)/E. (6.5)
The applied strains are then calculated using equations 6.4 and 6.5 with a Poisson’s
ratio of 0.25. These strain components are the actual strains that are being applied.
6.2 LOCAL STRAIN VARIATIONS
In examining the local strain fields, both the average applied strain for a given site
and the standard deviation are determined. The site average strains are calculated from
the average excess stresses at each site. The standard deviations are calculated from
strains from the individual stress measurements. This standard deviation provides a
measure of the variation of the strain field locally. The average and the standard
deviations for both the maximum and minimum applied horizontal strains for each site
across the eastern United States are given in table 6-1.

45
Table 6-1. Average applied horizontal strain in the eastern United States by site and by region.
Maximum Minimum
Site Average applied strain, micro strain
Standarddeviation
Percentof
strain
Average applied strain, micro strain
Standarddeviation
Percentof
strain
Elastic modulus, 106 psi
Standard deviation
Depth, ft
Central Appalachian Region Low Strain
Beckley #1, hole 2 353 37 10 117 36 31 6.77 0.55 1130
Maple Meadows, hole 6 296 29 10 282 44 16 6.32 0.2 708
Maple Meadows, hole 8 478 90 19 144 14 10 7.09 1.02 1025
Maple Meadows, hole 10
389 65 17 88 29 33 6.92 0.24 807
Beckley #1, hole 15 351 74 21 106 34 32 7.32 0.5 700
Eagle 397 30 8 232 74 32 2.95 0.12 900 Elkhorn #3 316 - 208 - 5.24 - 550 Average 369 61 168 73 6.08 831
Intermediate Strain Beckley #4, hole 1 551 - 309 - 1.77 - 820
Pocahontas #4, site 1 631 - - 317 - - 3.59 - 1600
Pocahontas #4, site 2 672 66 10 249 83 33 3.25 1.09 1250
Bonny, hole 4 588 151 26 539 139 26 3.59 0.24 1136 Average 611 52 - 354 127 - 2.87 - 1223
High Strain Beckley #2, hole 3 703 6 1 354 8 2 2.26 0.07 1100
Bonny, hole 5 827 88 11 248 117 47 6 0.96 1148 Maple Meadows, hole 7 781 322 41 433 222 51 4.44 1.31 735
Maple Meadows, hole 9 967 109 11 543 173 32 2.46 0.08 814
Beckley Mining, hole 11 778 157 20 529 234 44 2.95 0.58 640
Beckley Mining, hole 12 932 43 5 592 70 12 2.94 0.29 870
Beckley Mining, hole 13 861 95 11 494 105 21 2.7 0.24 800
Beckley Mining, hole 14 832 80 10 302 54 18 3.5 0.41 1040
Beckley #2, hole 16 851 63 7 521 23 4 1.72 0.09 350
Average 836 80 - 446 119 - 3.21 1.3 833

46
Table 6-1. Average applied horizontal strain in the eastern United States by site and by region (Cont.).
Maximum Minimum
Site Average applied strain, micro strain
Standard deviation
Percentof
strain
Average applied strain,
micro strain
Standard deviation
Percentof
strain
Elastic modulus, 106 psi
Standard deviation
Depth, ft
Northern Appalachian Region Tanoma, PA 421 - 303 - 5.8 720 Phillippi WV 536 58 11 317 65 21 4.29 2.57 550 Fayette County, PA 519 - - 191 - - 11.2 - 400
Barberton, OH 430 - - 222 - - 9 - 2300 Southwest, PA, site 1 533 - - 325 - - 1.8 - 400
Southwest, PA, site 2 367 30 8 336 25 7 4.4 0.45 700
Southwest, PA, site3 303 67 22 156 19 12 7.65 0.98 800
Average 444 90 264 73 6.31 3.19 838 Eastern Mid-Continent Region
Wabash, site 1 237 36 15 124 28 22 3.11 0.19 970 Wabash, site 2 341 19 6 80 26 32 2.9 0.25 850 Wabash, site 31 377 28 7 0 1 100 2.85 0.09 860 Monterey 398 107 27 163 50 32 1.67 0.32 290 Galatia2 499 36 5 0 0 - 2.96 0.19 570 Peabody #10 533 44 8 71 205 289 2.84 2.47 360 Peabody #2 301 - - 260 - - 2.2 - 300 St. Genevieve Limestone 349 - - 19 - - 9.32 730
North River, site 1, AL3 353 26 7 0 18 - 5.42 0.35 500
Immel, TN 342 130 38 26 42 162 7.96 1.06 925 Jim Walters #7, AL 399 - - 45 - - 5.4 1.1 1870
Average 375 87 23 72 85 115 4.24 2.49 748 North River, site 2, AL 173 38 24 0 27 - 4.72 0.35 470
Turris 193 8 4 51 15 29 8.57 0.69 275 1The calculated minimum site strain is a -4 micro strains but the minimum site strain is assumed to be zero. 2The calculated minimum site strain is a -23 micro strains but the minimum site strain is assumed to be zero.
3The calculated minimum site strain is a -68 micro strains but the minimum site strain is assumed to be zero.
For the maximum strain, the standard deviation given in percent of the average
strain ranges from 1 to 41 pct of the average while for the minimum strain, the standard

47
deviation given in percent of the average strain ranges from 2 to 289 pct. There is a wide
range in the standard deviations for both components but especially for the minimum
strain.
Figure 6-1 shows a histogram of the standard deviation as a percentage of the
average strain for the maximum horizontal strain. Although a few sites have a fairly high
standard deviation, in general, the standard deviations are less than 24 percent of the
average strain. The average standard deviation given in percent of the average strain is
only 14 percent while the mode is between 8 and 12 percent.
Figure 6-2 shows a histogram of the percent of standard deviation of the minimum
horizontal strain. In general, the standard deviations are less than 56 percent of the
average strain. The average standard deviation given in percent of the average strain is
44 percent with the mode between 24 and 32 percent. However, the outliers increase the
average significantly.
Figure 6-1. Distribution of the standard deviation of the maximum applied horizontal strain given in percent.
0
1
2
3
4
5
6
7
8
9
10
0-4 4-8 8-12 12-16 16-20 20-24 24-28 28-32 32-36 36-40 40-44
Standard Deviation, percent
Num
ber o
f Site
s

48
In general, the variation in strain is not as large for the maximum horizontal strain
as indicated by both the mode and the average standard deviation. The outliers do not
have a large effect on the average for the maximum horizontal strain while the majority
of the sites have a standard deviation less than 12 percent of the average maximum strain.
However, there is a larger range in the standard deviation of the minimum strain while
the outliers have a larger effect on the average. The outliers are caused by a combination
of low minimum strains and in part higher standard deviations at those sites. The mode
for the standard deviations though is clearly higher for the minimum strain. Locally, the
maximum horizontal strain is more uniform than the minimum horizontal strain.
The standard deviation reflects the natural variation in the strain field as well as
errors in measurements and determination of the elastic properties. Some of the variation
could also be due to the influence of mining. These local variations can mask the
variations of the stresses due the elastic modulus. Therefore, the range in elastic modulus
must be sufficient to overcome these local variations.
Figure 6-2. Distribution of the standard deviation of the minimum applied horizontal strain given in percent.
0
1
2
3
4
5
6
7
8
9
0-8 8-1616
-2424
-3232
-4040
-4848
-5656
-6464
-7272
-8080
-8888
-96
96-10
4
104-1
12
112-1
20
120-1
28
128-1
36
136-1
44
144-1
52
152-1
60
160-1
68
168-1
76
176-1
84
184-1
92
192-2
00
200-2
08
208-2
16
216-2
24
224-2
32
232-2
40
240-2
48
248-2
56
256-2
64
264-2
72
272-2
80
280-2
88
288-2
96
Standard Deviation, percent
Num
ber o
f Site
s

49
Another factor that could influence the results is the distance of the measurements
from the opening. The measurements used in the analysis range in depth from 5.2 to
24.8 ft into the roof though only 13 percent of the measurements are less than 10 ft. To
determine if there is a significant effect on the individual measurements of the distance
from the opening, the applied maximum strains versus the distance from the opening are
examined for the eastern United States. Figure 6-3 shows a graph of this data with the
measurements separated into high and low strain groups. A linear regression analysis is
performed on each data set. The coefficients for the distance are for the low strain group
2.4 micro strains/ft and for the high strain group 7.7 micro strains/ft indicating that the
strain does appear to increase by a small amount with distance from the opening.
However, the coefficients of determination of 0.01 and 0.05 indicate there is no
correlation between the distance from the opening and the maximum applied strain while
the coefficients for the distance developed from the regression analysis are not
significantly greater than zero. Therefore, the strains do not appear to increase
significantly with distance from the opening indicating that the distance from the opening
appears to have a minimal influence on the measurements and should have minimal
affect on the results from the analysis of this data set.
y = 7.3x + 703R2 = 0.05
y = 2.4x + 353R2 = 0.01
0
200
400
600
800
1000
1200
1400
0 5 10 15 20 25 30Distance, ft
Stra
in, m
icro
stra
in
Low Strain
High Strain
Figure 6-3. Maximum applied horizontal strain versus distance of the measurement from the opening, eastern United States.

50
6.3 REGIONAL STRAIN VARIATIONS To evaluate the regional strain variations, the applied horizontal strains are
examined with the analysis of the strains based on three regions, the eastern Mid-
Continent region, and the northern and central Appalachian regions. The approximate
regional boundaries based on site groupings is given in figure 6-4. Table 6-2 shows the
average maximum and minimum applied horizontal strain and the standard deviation for
each region. The following analysis for each region is based on the average strains
determined at each site (table 6-1).
Table 6-2. Applied horizontal strain by region for the eastern United States.
Zone Maximum
strain, micro strain
Standard deviation
Range of site maximum
strain, micro strain
Minimum strain, micro
strain
Standard deviation
Strain ratio max/min
Northern Appalachian 444 90 303-536 264 73 1.68
Central Appalachian Low 368 60 296-478 168 73 2.2 Intermediate 611 52 551-672 354 127 1.73 High 836 81 703-967 439 116 1.89
Eastern Mid-Continent 375 80 156-533 72 81 5.29
Figure 6-4. Approximate regional boundaries based on site groupings.
INIL OH
PA
NY
VAWV
NCKY
TN
MS ALGA
SC
FL
x x
x
x
x
x(3) x o(16)(2)o
oo
x
x
+(3)++
+
+
o-Central Appalachian+-Northern Appalachianx-Eastern Mid-Continent
MI
x(2)
Northern Appalachian Region
Central Appalachian Region
Eastern Mid-ContinentRegion

51
6.3.1 Eastern Mid-Continent Region
The maximum applied horizontal strain by site ranges from 173 to 533 micro strains
with a standard deviation that is 21 percent of the average strain. Figure 6-5A shows a
histogram of the average maximum horizontal strain from each site. The mode is
between 300 and 400 micro strains with 8 of the 13 sites within this range.
The average regional maximum strain of 375 micro strains also falls within this
range. The low strain Turris and North River site 2 sites however, are not included in the
average strain calculations though the sites are included on the histogram. The Turris
measurements are not very deep into the roof and are probably under the influence of the
opening. Further, the Turris Mine is also the shallowest site and may be influenced by
near surface stress relief effects from glacial filled bedrock valleys. At the North River
Mine in Alabama, site 2 appears to be influenced by the normal fault located 600 ft from
the site. The average site strain is only 173 micro strains. These sites are also excluded
from the general analysis. Without the Turris and the North River site 2, the site strains
range from 238 to 533 micro strains. Further, the Wabash site one, has an average strain
of 238 micro strains. However, this site is near a fault that appears to have reduced the
strain level locally. The other two sites in the Wabash mine have maximum strains of
341 and 377 micro strains. Excluding the Wabash site one, the average maximum
regional strain is 388 micro strains.
Figure 6-5B shows a histogram of the minimum horizontal strain. The minimum
strain ranges from 0 to 260 micro strains with an average strain of 72 micro strains.
However, the standard deviation is 118 pct of the average minimum strain. The
minimum strain for the Turris and North River site 2 are not outliers in this case. Most of
the sites have a minimum applied strain that is less than 100 micro strains.
6.3.2 Northern Appalachian Region
In this region, the maximum horizontal strain by site ranges from 303 to 536 micro
strains with a standard deviation that is 20 percent of the average strain. Figure 6-6A
shows a histogram of the maximum horizontal strain for each site. The strains are
distributed fairly evenly across the range.

52
Figure 6-5A. Distribution of the applied horizontal strain in the eastern Mid-Continent region, maximum.
0
1
2
3
4
5
6
7
8
9
0-100 100-200 200-300 300-400 400-500 500-600 600-700 700-800 800-900 900-1000
Strain, micro strain
Num
ber o
f Site
s
A.
Figure 6-5B. Distribution of the applied horizontal strain in the eastern Mid-Continent region, minimum.
0
2
4
6
8
10
12
0-100 100-200 200-300 300-400 400-500 500-600 600-700 700-800 800-900 900-1000
Strain, micro strain
Num
ber o
f Site
s
B.

53
0
1
2
3
4
0-100 100-200 200-300 300-400 400-500 500-600 600-700 700-800 800-900 900-1000
Strain, micro strain
Num
ber o
f Site
s
A.
Figure 6-6A. Distribution of the applied horizontal strain in the northern Appalachian region, maximum.
Figure 6-6B. Distribution of the applied horizontal strain in the northern Appalachian region, minimum.
0
0.5
1
1.5
2
2.5
3
3.5
4
4.5
0-100 100-200 200-300 300-400 400-500 500-600 600-700 700-800 800-900 900-1000
Strain, micro strain
Num
ber o
f Site
s
B.

54
The minimum strain ranges from 156 to 336 micro strains with a standard deviation
that is 28 percent of the average strain. Figure 6-6B shows a histogram of the minimum
strain distribution across the region. The histogram indicates that for the majority of the
sites, the minimum strains are between 300 to 400 micro strains.
6.3.3 Central Appalachian Region
In the central Appalachian region, the maximum horizontal strain ranges from 296
to 967 micro strains. This reflects the low and high strain zones that have been identified
in the region. Figure 6-7A shows a histogram of the average maximum horizontal strain
from each site. The distribution is bimodal indicating the existence of both low and high
strain zones within the region. The lower strain region includes the low strain sites in the
Beckley, Elkhorn #3 and Eagle seams with strains below 500 micro strains and the high
strain region includes the high strain sites in the Beckley seam with strains above
700 micro strains. There also appears to be a third intermediate strain zone that includes
the Sewell, Pocahontas #4 seam sites and one Beckley seam site (table 6-1). The third or
intermediate zone of strain can be designated between 550 to 700 micro strains.
Although there is a substantial variation of strains across the region, the strain
variation within each strain zone is much less. For the high strain zone, the maximum
strain ranges from 703 to 967 micro strains with a standard deviation that is 10 percent of
the average strain. The distribution indicates that the largest number of sites have an
average strain of between 827 to 967 micro strains. For the low strain zone, the strain
ranges from 296 to 478 micro strains with a standard deviation that is 17 percent of the
average strain. Most of the strains fall between 316 to 397 micro strains. For the
intermediate strain zone, the strains range from 551 to 672 micro strains with a standard
deviation that is 9 percent of the average strain
. The minimum applied horizontal strain ranges from 88 to 592 micro strains.
Figure 6-7B shows a histogram of the average minimum strain. The distribution is not as
clear as the maximum strain distribution in indicating two or possibly three strain zones.
Further, there is some overlap between the low, intermediate and high strain zones as
designated by the maximum strain. For the high strain region, the strain ranges between
248 to 592 micro strains with a standard deviation that is 28 percent of the average. For

55
the low strain zone, the average strain ranges from 88 to 282 micro strains with a
standard deviation that is 43 percent of the average strain. For the intermediate zone, the
average strains range from 249 to 539 micro strains with a standard deviation that is 36
percent of the average minimum strain.
Figure 6-7A. Distribution of the applied horizontal strain in the central Appalachian region, maximum.
0
1
2
3
4
5
6
0-100 100-200 200-300 300-400 400-500 500-600 600-700 700-800 800-900 900-1000
Strain, micro strain
Num
ber o
f Site
s
Intermidiate StrainHigh StrainLow Strain
A.
Figure 6-7B. Distribution of the applied horizontal strain in the central Appalachian region, minimum.
0
1
2
3
4
5
6
0-100 100-200 200-300 300-400 400-500 500-600 600-700 700-800 800-900 900-1000
Strain, micro strain
Num
ber o
f Site
s
Intermidiate StrainHigh StrainLow Strain
B.

56
There are high and low strain sites in the central Appalachian region and except for
the Beckley seam the geographic distribution is not clear. The high strain sites include
sections of the Beckley seam and possibly sites in the Sewell and Pocahontas #4 seams.
In the Beckley seam, all but two of the high strain sites are in a coterminous area of
several hundred square miles. All the low strain sites in the Beckley seam are in an
adjacent area encompassing tens of square miles. The other low strain sites in the region
are somewhat isolated from the Beckley seam. To develop a clearer outline of the
geographic distribution of the strain field across the region will require more stress
measurements. However, if a reason for the existence of the high and low strain fields
can be deduced, a better understanding of the strain patterns for the region could be
developed.
A possible cause of the two or three strain fields could be the strength of the rock
mass or faults. Essentially, the magnitude of the maximum horizontal stress is limited by
the rock mass or fault strength (Zoback et al., 2003). An important parameter in this
concept is the confinement or minimum stress. With increasing confinement, the rock
mass or fault strength also increases thus being able to withstand higher maximum
horizontal stresses.
The possible affects of the strength limiting the stress magnitude can be seen with
the Beckley seam data where the high and low strain sites group into distinct geographic
zones. For the high strain zone in the Beckley seam excluding the Beckley #2 sites, the
average maximum horizontal stress is 3,800 psi. For the five sites in the low strain zone,
the average maximum horizontal stress is 3,300 psi. Further, in the Beckley seam, the
minimum or confining stress is the vertical stress. For the 8 high strain sites used in this
analysis, the average site depth is 900 ft while for the 5 low strain sites, the average site
depth is 875 ft. Essentially, both zones have approximately the same vertical or
confinement stress that could result in similar rock mass or fault strengths and therefore
result in about the same maximum horizontal stress magnitude. The average maximum
horizontal stresses for the two zones are within 15 percent.
The average elastic modulus for the low strain zone sites is 6.9 million psi and for
the high strain zone sites, 3.6 million psi. Based on the average elastic modulus and
maximum horizontal stress for each zone, the average horizontal strain from the

57
maximum horizontal stress for the high strain zone is 1060 micro strains and for the low
strain zone 480 micro strains. Essentially, strength limits the maximum horizontal stress
in both zones to approximately the same magnitude while the much higher elastic
modulus in the low strain zone results in the much lower strain field.
6.3.4 Summary of Regional Strain Fields
The regional average maximum applied horizontal strain ranges from 369 to
836 micro strains with the lowest and highest regional strains found in the central
Appalachian region. The minimum average strain ranges from 72 to 440 micro strains.
The lowest is found in the eastern Mid-Continent region and the highest in the high strain
zone of the central Appalachian region.
As with the local strain fields, the regional strain fields are not completely uniform.
However, the regional strain fields appear to be sufficiently uniform except for the central
Appalachian region to allow for the development of adequate regression models between
the maximum horizontal stress and the elastic modulus of the rock. Regionally, for the
maximum applied strain, the standard deviation in percent of the average strain varies
from only 10 to 21 percent. Further, the range of the site averages for a region or zone is
less than 270 micro strains. Therefore, the regional average strains, standard deviations
and range of strains can be used to determine or estimate the horizontal strains and
stresses that may occur elsewhere within the region. Essentially, the measurements are a
sampling of the stress and strain field across a region. The exception is the central
Appalachian region where the geographic demarcation of the zones is not clear.
The minimum strain shows more variation as indicated by equal or higher standard
deviations than those for the maximum strain. This results in the standard deviation
being a much higher percent of the minimum average strain.
6.3.5 Comparison of Regional Strain Fields
Clearly, the central Appalachian region has areas with substantially higher
maximum applied strains than the other regions. Except for the central Appalachian
region, the other regions appear to have similar maximum horizontal strain fields. For
two of the regions, the northern Appalachian region and the eastern Mid-Continent

58
region, the average maximum applied regional strains are within 70 micro strains. Even
the low strain zone of the central Appalachian region has an average maximum strain that
is only 8 micro strains below that of the eastern Mid-Continent region. However, for the
low strain zones, the average regional strain in the northern Appalachian region is about
20 percent higher than the other two regions.
Table 6-3. Statistical comparison of selected regional average maximum applied horizontal strains.
Regional comparison t-statistic Degrees of freedom
Significant difference
Northern Appalachian vs. Eastern Mid-Continent 1.64 16 No
Northern Appalachian vs. Central Appalachian (low strain zone) 1.85 10 No
Northern Appalachian vs. Central Appalachian (high strain zone) 8.9 12 Yes
Central Appalachian (high strain zone) vs. Central Appalachian (low strain zone) 13.1 14 Yes
Table 6-3 gives a statistical comparison between the regional maximum strain
averages. Even though the northern Appalachian region has a higher strain, statistically
there is no significant difference between the northern Appalachian, eastern Mid-
Continent and central Appalachian low strain zone regional maximum strain. The
maximum strain in the central Appalachian high strain zone is significantly higher than
any of the low strain zones. Essentially, the central Appalachian high strain zone does
have a significantly higher maximum applied strain than any other region.
There is a somewhat larger difference in the minimum average strains between the
low strain zones. The eastern Mid-Continent region has a lower minimum strain and a
more biaxial strain field than the northern and central Appalachian regions while the
northern Appalachian region has minimum strains that are higher than those in the central
Appalachian low strain zone. The highest minimum strains are found in the intermediate
and high strain zones of the central Appalachian region followed by the northern
Appalachian region. However, there is less difference between the minimum strain in the
central Appalachian region for all three zones and the northern Appalachian region than

59
for the maximum strain. The strain fields in these regions are less biaxial than the eastern
Mid-Continent region.
The eastern Mid-Continent region encompasses a very large area of the eastern
United States and has a fairly uniform applied maximum strain, however, the strain field
is very biaxial with a maximum to minimum strain ratio of 5.3. In the northern
Appalachian region the maximum strain is about 20 percent higher though the strain field
is less biaxial with a ratio of only 1.68. The northern Appalachian strain region is smaller
than the eastern Mid-Continent region but still fairly large. Clearly, the intermediate and
high strain zones of the central Appalachian region have the highest maximum applied
strains. However, the distribution of the strain fields in this region is much more
complex though this distribution appears to still be geographic. Geographically, the high
and low strain zones in the Beckley seam appear to only cover tens or hundred of square
miles.
6.4 STRAIN VARIATION ACROSS THE EASTERN UNITED STATES
Figure 6-8A shows a histogram of the maximum applied horizontal strain by site
across the eastern United States. Twenty-four of the 38 sites have a maximum strain
between 300 and 550 micro strains with 26 sites between 300 and 600 micro strains.
These sites are spread across all the main geographic regions. Therefore, the typical
maximum strain field across the eastern United States appears to have a magnitude
between 300 to 600 micro strains. This range is somewhat broadened because of the
strains in the northern Appalachian region being about 20 percent higher than those in the
other low strain regions. Further, for both the eastern Mid-Continent and low strain
central Appalachian regions, the maximum strains are concentrated at the mode between
300 to 400 micro strains with only one or two sites for each region between 400 and
550 micro strains. The strains between 550 to 700 micro strains are all in the central
Appalachian region.
From the histogram, the maximum strain field is skewed with only three sites well
below 300 micro strains. Since the mode is between 300 and 400 micro strains with
these strains from all the regions as well as from a range in depths that are not subject to
near surface strain relief, those strains in the eastern United States that fall below about

60
300 micro strains may have been to some degree subject to strain relief. Two sites, both
in the eastern Mid-Continent region are below 200 micro strains, the Turris Mine and
North River site 2. The Wabash mine, site one is also below 300 micro strains. The
Wabash and North River site 2 were near faults that could have resulted in some strain
relief. The Turris Mine is the shallowest site at 275 ft in a region with bedrock valleys
that are filled with unconsolidated material. Essentially, the distribution is skewed
because the strains cannot realistically fall below zero and the location of the mode
indicates that those strains below about 300 micro strains are possibly in partial strain
relief.
From the histogram, the distribution is spread out toward the right because of the
high strain zone in the Beckley seam and the other intermediate sites in the central
Appalachian region. The number of sites in the high strain zone is due to increased
sampling in this zone and therefore the distribution does not represent the true geographic
extent of the high strain zone that appears to be geographically limited. Because of
ground control problems, there was a concentration of stress measurements made in the
seam. What this distribution indicates is that there is a high strain zone but not the extent
of that zone.
Figure 6-8B shows a histogram of the minimum applied horizontal strains across
the eastern United States. Most of the sites (22) have strains between 100 to 400 micro
strains. Eleven of the sites have strains that are below 100 micro strains with ten of the
sites found in the eastern Mid-Continent region. This reflects the low minimum
horizontal stresses found in the region. All the sites with strains above 400 micro strains
are again found in the Beckley seam and central Appalachian region. However, although
the distribution is again skewed, it is not as well defined as that for the maximum
horizontal strain.

61
0
2
4
6
8
10
12
14
16
18
0-100 100-200 200-300 300-400 400-500 500-600 600-700 700-800 800-900 900-1000
Strain, micro strain
Num
ber o
f Site
sCentral Appalachian-HSCentral Appalachian-LSNorthern AppalachianEastern Mid-Continent
A.
Figure 6-8A. Distribution of the applied horizontal strain across the eastern United States, maximum.
0
2
4
6
8
10
12
0-100 100-200 200-300 300-400 400-500 500-600 600-700 700-800 800-900 900-1000
Strain, micro strain
Num
ber o
f Site
s
Central Appalachian-HSCentral Appalachian-LSNorthern Appalachian Eastern Mid-Continent
B.
Figure 6-8B. Distribution of the applied horizontal strain across the eastern United States, minimum.

62
6.5 REGIONAL STRAIN VARIATION-CONCLUSIONS
Locally, the maximum applied horizontal strains are fairly uniform with an average
standard deviation that is 14 percent of the average site strain. The minimum applied
horizontal strains are much more variable with an average standard deviation that is
44 percent of the average site strain.
Distance of a measurement from the opening is not a significant factor in the
variation of the applied maximum horizontal strain. Therefore, the distance of the
measurement from the opening appears to have minimal influence on the results.
Based on the maximum applied horizontal strains, the eastern United States can be
separated into three regions that include the eastern Mid-Continent region, the northern
Appalachian region and the central Appalachian region. The central Appalachian region
is further divided into high and low strain zones. The regional or zonal maximum applied
strains are fairly uniform with standard deviations that are between 9 and 21 percent of
the regional average.
The regional averages for the maximum applied horizontal strains are not
significantly different for the northern Appalachian region, eastern Mid-Continent region
and the central Appalachian low strain zone though the north Appalachian region has
strains that are about 20 percent higher.
There is a high strain zone in the central Appalachian region with maximum applied
horizontal strains that are significantly higher than any other region.
The applied horizontal minimum strains are lowest in the eastern Mid-Continent
region. This results in much more directional or biaxial horizontal strain and stress fields
in this region as compared to the other regions.
The typical average maximum applied horizontal site strain in the eastern United
States is between 300 and 600 micro strains.

63
CHAPTER 7: REGIONAL AND LOCAL STRESS AND STRAIN MODELS
In general, the linear relationship between the stress and the elastic modulus should
be strongest locally or at a specific site where the strains would show more uniformity
with the stresses then varying with the elastic modulus. However, the limitation of the
local or site analysis is that the range in the elastic modulus may not be sufficient to
establish a reliable model. For the individual mines and seam analysis, the individual
measurements are used.
A more general horizontal stress model that encompasses larger geographic regions
that examines the relationship between the horizontal stress, the elastic properties and
depth can also be developed. Over the larger regions, the variation of the elastic modulus
may be sufficient to establish a regional model. However, any larger geographic region
must have a sufficiently uniform strain field where the relationship that exists between
stress, strain and the elastic modulus is not masked by the variation in the strain field.
Three larger areas are examined that include the northern and central Appalachian
regions and the eastern Mid-Continent region. Based on the previous strain analysis,
both the northern Appalachian and eastern Mid-Continent regions appear to have
sufficiently uniform strain fields. The strain field is more complex in the central
Appalachian region so the analysis is separated into high and low strain zones. For the
regional analysis, the average site stresses are used.
7.1 REGIONAL STRESS AND STRAIN MODELS
Regional models are developed for the northern Appalachian and eastern Mid-
Continent regions as well as the high and low strain zones for the central Appalachian
region. Regression models are presented for the horizontal stresses with respect to the
elastic modulus and depth for each region while the excess stresses and strains from the
maximum horizontal are also considered.
7.1.1 Variation of the Horizontal Stress with the Elastic Modulus
To evaluate the variation of the horizontal stress with the elastic modulus, a
regression analysis using equation 3.1 is conducted on the data for each region.

64
Figure 7-1 shows graphs of the maximum horizontal stress versus the elastic modulus for
each region. Table 7-1 shows the resulting regression coefficients, constants and
coefficients of determination from the regression analysis.
Table 7-1. Regional regression models for the maximum horizontal stress versus
the elastic modulus.
Model Number of sites Coefficient, K1 Constant, K2 Coefficient of
determination, R2 Central Appalachian Region
Low strain 7 444 252 0.72 High strain 13 965 215 0.9
Northern Appalachian Region General 7 576 0 0.89 General 7 564 94 0.89
Eastern Mid-Continent Region General1 11 445 0 0.87 General1 11 375 393 0.91 General2 13 292 564 0.65 1Regression analysis without the Turris Mine, Illinois and the North River mine site 2. 2Regression analysis with all the site data.
y = 564x + 94R2 = 0.89
0
1000
2000
3000
4000
5000
6000
7000
8000
0 2 4 6 8 10 12
Elastic modulus, 106 psi
Stre
ss, p
si
A
Figure 7-1A. The maximum horizontal stress versus the elastic modulus, northern Appalachian region.

65
y = 292x + 564R2 = 0.65
0
500
1000
1500
2000
2500
3000
3500
4000
0 2 4 6 8 10
Elastic modulus, 106 psi
Stre
ss, p
si
B.
Figure 7-1B. The maximum horizontal stress versus the elastic modulus, eastern Mid-Continent region (with the Turris and North River sites).
y = 375x + 393R2 = 0.91
0
500
1000
1500
2000
2500
3000
3500
4000
4500
0 2 4 6 8 10
Elastic modulus, 106 psi
Stre
ss, p
si
C.
Figure 7-1C. The maximum horizontal stress versus the elastic modulus, eastern Mid-Continent region (without the Turris and North River sites).

66
y = 965x + 215R2 = 0.90
0
1000
2000
3000
4000
5000
6000
7000
0 1 2 3 4 5 6 7
Elastic modulus, 106 psi
Stre
ss, p
siD.
Figure 7-1D. The maximum horizontal stress versus the elastic modulus, central Appalachian region (high strain zone).
y = 444x + 252R2 = 0.72
0
500
1000
1500
2000
2500
3000
3500
4000
4500
0 1 2 3 4 5 6 7 8
Elastic modulus, 106 psi
Stre
ss, p
si
E.
Figure 7-1E. The maximum horizontal stress versus the elastic modulus, central Appalachian region (low strain zone).

67
The coefficients of determination identifies how much of the variation of the
maximum horizontal stress can be explained by the elastic modulus. The models can
explain from 72 to 91 percent of the variation. The highest correlation is found in the
eastern Mid-Continent region with the lowest in the central Appalachian region low strain
zone. The lower correlation in the central Appalachian low strain zone results from the
grouping and limited distribution of the elastic modulus where only one site elastic
modulus was below 5 million psi. Again, this reflects what was observed with the
Beckley seam analysis. In the case of the eastern Mid-Continent and northern
Appalachian regions, the regression fit is also forced through zero with little reduction in
the fit.
For the eastern Mid-Continent region, with all the sites, the coefficient of
determination is only 0.65. Examining the strain data reveals that two sites, the Turris
Mine and North River site 2 have strains that are much lower than the other sites. Based
on previous discussions, the sites may be partially strained relieved. The average strain
from the maximum horizontal stress at Turris is only 232 micro strains and at the North
River site 2, only 221 micro strains. Without these sites, the range of strain from the
maximum horizontal stress is from 400 to 633 micro strains.
Without the Turris Mine and North River site 2, the coefficient of determination is
0.91 for the eastern Mid-Continent region. The coefficient of determination has
increased substantially without the two low strain sites. It is not only the low strains for
these sites but also the high elastic modulus for the Turris Mine that affects the results of
the regression analysis for the maximum horizontal stress. Therefore, because of
substantially lower strains, these two sites are excluded from all further analysis of the
eastern Mid-Continent region.
For the high strain zone of the central Appalachian region, the equation and
coefficient of determination are close to that obtained for the Beckley seam. However,
for the low strain zone, the coefficient of determination of 0.72 is much higher than for
just the Beckley seam and reflects the increased range of the elastic modulus.
Figure 7-2 shows graphs of the minimum horizontal stress versus the elastic
modulus for each region. For the minimum horizontal stress in each region, equation 3.1

68
is used for the regression analysis. Table 7-2 shows the resulting regression coefficients,
constants and coefficient of determination for the minimum horizontal stress.
The coefficient of determination ranges form 0.25 to 0.81 and is in general much
less than for the maximum horizontal stress. However, the northern Appalachian region
and central Appalachian high strain zone have correlations that are fairly good. For these
regions, the variation of both the maximum and minimum horizontal stress can be
explained to a large extent by the elastic modulus of the rock. The poor fit in the eastern
Mid-Continent region is due to the low average minimum strain and the relatively high
standard deviation of the strain that is larger than the average strain. In the central
Appalachian low strain zone, the poor fit is due to the limited range of the elastic
modulus, the lower average minimum strain and the relatively high standard deviation.
Table 7-2. Regional regression models for the minimum horizontal stress versus the elastic modulus based on site average stresses.
Model Number of sites
CoefficientK1
ConstantK2
Coefficient of determination
R2
Stress ratio,
max/min
Standard deviation of ratio
Range ofratio
Central Appalachian Region Low strain 7 141 1072 0.25 1.55 0.36 1.03-2.01High strain 13 490 789 0.67 1.39 0.2 1.05-1.84
Northern Appalachian Region General 7 298 762 0.81 1.34 0.21 1.05-1.74General 7 397 0 0.7 1.34 0.21 1.05-1.74
Eastern Mid-Continent Region General1 11 90 480 0.35 2.59 1.66 1.08-7.151Without the Turris Mine, Illinois and the North River site 2, Alabama

69
y = 298x + 762R2 = 0.81
0
500
1000
1500
2000
2500
3000
3500
4000
4500
0 2 4 6 8 10 12
Elastic modulus, 106 psi
Stre
ss, p
si
A.
Figure 7-2A. The minimum horizontal stress versus the elastic modulus, northern Appalachian region.
Figure 7-2B. The minimum horizontal stress versus the elastic modulus, eastern Mid-Continent region.
y = 90x + 486R2 = 0.35
0
200
400
600
800
1000
1200
1400
1600
0 2 4 6 8 10
Elastic modulus, 106 psi
Stre
ss, p
si
B.

70
Figure 7-2C. The minimum horizontal stress versus the elastic modulus, central Appalachian region (low strain zone).
y = 141x + 1072R2 = 0.25
0
500
1000
1500
2000
2500
3000
0 1 2 3 4 5 6 7 8
Elastic modulus, 106 psi
Stre
ss, p
siC.
Figure 7-2D. The minimum horizontal stress versus the elastic modulus, central Appalachian region (high strain zone).
y = 490 + 789R2 = 0.67
0
500
1000
1500
2000
2500
3000
3500
4000
0 1 2 3 4 5 6 7
Elastic modulus, 106 psi
Stre
ss, p
si
D.

71
Table 7-2 also gives the average ratio between the maximum and minimum
horizontal stress for each region. Because of the regional variation of the ratio as
indicated by the standard deviations, the minimum stress is not as strongly dependent on
the elastic modulus as the maximum horizontal stress. This is especially true for the
eastern Mid-Continent region with a standard deviation of the ratio that is about
65 percent of the regional ratio, a ratio that is the highest of any of the regions. Further,
the overall lower strains with equal or larger strain variations are another reason why the
minimum stress is not as dependent on the elastic modulus.
7.1.2 Variation of Horizontal Stress with Depth
The variation of the horizontal stress with depth is evaluated for each region using
the average maximum horizontal stress measured at each site. Site averages are used to
give each site the same weight. For the central Appalachian region, the analysis is
conducted on the separate data sets for the high and low strain zones as well as for a
combined data set. For the regression analysis, equation 3.7 is used. Figure 7-3 shows
graphs of the maximum horizontal stress versus depth for each region.
Table 7-3 shows the resulting coefficients, constants and statistics for each region.
The depth factor varies from 1.03 to 1.71 psi/ft. However, the correlations are so poor
that the depth can only explain between 9 and 24 percent of the variation of the maximum
horizontal stress even though the depth range appears to be sufficient. Also, the
t statistics for the depth factor indicates that at a 0.05 significance level, none of the depth
factors are significantly greater than zero. Essentially, there is no significant increase in
the maximum horizontal stress with depth in any of the regions.

72
Table 7-3. Variation of the maximum horizontal stress with depth by region.
Zone Number of sites
Depth factor,
KD, psi/ft
Maximum stress at surface, PS, psi
Coefficient of determination,
R2
t statistic for depth
factor
Significant depth factor1
Range of depth, ft
Northern Appalachian 7 1.03 2784 0.13 0.85 No 400-2,300
Central Appalachian Low strain 7 1.71 1527 0.18 1.06 No 550-1130 High strain 13 1.09 2238 0.09 1.02 No 350-1,600 Combined 20 1.26 2018 0.11 1.52 No 350-1,600
Eastern Mid-Continent 11 1.07 1186 0.24 1.68 No 290-1,870 1Significant at a 0.05 significance level.
Figure 7-3A. The maximum horizontal stress versus the depth, northern Appalachian region.
y = 1.03x + 2785R2 = 0.13
0
1000
2000
3000
4000
5000
6000
7000
8000
0 500 1000 1500 2000 2500
Depth, ft
Stre
ss, p
si
A.

73
y = 1.72x + 1527R2 = 0.18
0
500
1000
1500
2000
2500
3000
3500
4000
4500
0 200 400 600 800 1000 1200
Depth, Ft
Stre
ss, p
siB.
Figure 7-3B. The maximum horizontal stress versus the depth, central Appalachian region (low strain zone).
y = 1.09x + 2239R2 = 0.09
0
1000
2000
3000
4000
5000
6000
7000
0 500 1000 1500 2000
Depth, ft
Stre
ss, p
si
C.
Figure 7-3C. The maximum horizontal stress versus the depth, central Appalachian region (high strain zone).

74
y = 1.26x + 2019R2 = 0.11
0
1000
2000
3000
4000
5000
6000
7000
0 200 400 600 800 1000 1200 1400 1600 1800
Depth, ft
Stre
ss, p
si
D.
Figure 7-3D. The maximum horizontal stress versus the depth, central Appalachian region.
Figure 7-3E. The maximum horizontal stress versus the depth, eastern Mid-Continent region.
y = 1.07x + 1186R2 = 0.24
0
500
1000
1500
2000
2500
3000
3500
4000
0 500 1000 1500 2000
Depth, ft
Stre
ss, p
si
E.

75
7.1.3 Variation of the Horizontal Stress with the Elastic Modulus and Depth
A multiple linear regression model is fit to the data for each region where the
dependent variable is the maximum horizontal stress and the independent variables, the
site depth and the elastic modulus. For this analysis, the average site stress and elastic
modulus are used. The regression analysis is conducted using equation 3.8.
Table 7-4 gives the resulting depth and elastic modulus coefficients, the constants
and relevant statistics. In general, the coefficients of determination are fairly high
indicating that the models can explain between 83 to 94 percent of the variation of the
maximum horizontal stress. For the elastic modulus, the coefficients range from 350 to
1,027 micro strains. In all cases, the coefficient for the elastic modulus is significant at a
0.05 significance level.
Table 7-4. Variation of maximum horizontal stress with depth and the elastic modulus by region.
Zone Number of measurements
Depth factor, psi/ft
Elastic modulus
coefficient, micro strain
Con-stant
Coefficient of determination,
R2
t Statistic for depth
factor
Significant depth factor1
t statistic for elastic modulus
factor
Significant elastic
modulus factor1
Northern Appalachian 7 0.05 560 76 0.89 0.09 No 5.21 Yes
Central Appalachian Low strain 7 1.35 424 -752 0.83 1.65 No 3.97 Yes High strain 13 -0.52 1027 515 0.92 -1.39 No 9.93 Yes
Eastern Mid-Continent 11 0.39 350 207 0.94 1.87 No 9.35 Yes 1Evaluated at a 0.05 significance level.
The depth factor though is more variable. One of the depth factors is negative, two
others are positive while one has a rate of nearly zero. However, none of the depth
factors are significantly greater than zero at a 0.05 significance level. This analysis
shows that the elastic modulus is a significant factor while the depth is not a significant
factor in the variation of the maximum horizontal stress for each region.

76
y = -0.023x + 617R2 = 0.02
0
100
200
300
400
500
600
700
800
0 500 1000 1500 2000 2500
Depth, ft
Stra
in, m
icro
stra
in
A.
Figure 7-4A. Strain from the maximum horizontal stress versus the depth for the northern Appalachian region.
y = 0.0037x + 487R2 = 0.0004
0
100
200
300
400
500
600
700
0 500 1000 1500 2000
Depth, ft
Stra
in, m
icro
stra
in
B.
Figure 7-4B. Strain from the maximum horizontal stress versus the depth for the eastern Mid-Continent region.

77
y = 0.22x + 310R2 = 0.35
0
100
200
300
400
500
600
700
0 200 400 600 800 1000 1200
Depth, ft
Stra
in, m
icro
stra
in
C.
Figure 7-4C. Strain from the maximum horizontal stress versus the depth for the central Appalachian region (low strain zone).
y = -0.161x + 1190R2 = 0.14
0
200
400
600
800
1000
1200
1400
0 200 400 600 800 1000 1200 1400 1600 1800
Depth, ft
Stra
in, m
icro
stra
in
D.
Figure 7-4D. Strain from the maximum horizontal stress versus the depth for the central Appalachian region (high strain zone).

78
7.1.4 Variation of the Strain from the Maximum Horizontal Stress with Depth
Using the strains from the maximum horizontal stress, the affects of depth are
considered without the influence of the elastic properties. These strains are calculated
using equation 3.6. The maximum strains calculated by equation 3.6 can also be
considered the maximum stress normalized by the elastic modulus. Essentially, the
affects of the elastic modulus are removed from the data with all sites and measurements
having an elastic modulus of one million psi.
Figure 7-4 shows the strain from the maximum horizontal stress versus depth for
each region. A regression analysis using equation 3.9 is used to fit to the data. Table 7-5
gives the depth coefficients, strain constants and relevant statistics from the regression
analysis for each region. In general, the coefficients of determination are very low where
the depth can explain only between 0 to 35 percent of the variation. For two of the
regions, the strain actually decreases with depth. However, none of the regional depth
factors are significantly greater than zero at a 0.05 significance level. In general, it does
not appear the strains are increasing with depth in any of the regions.
Table 7-5. Regression models for the strain from the maximum horizontal stress versus depth for each region.
Zone Number of sites
Depth coefficient
micro strain/ft
Constant, micro strain
Coefficient of determination,
R2
Significance of strain
coefficient Northern Appalachian
7 -0.02 617 0.02 No Central Appalachian
Low strain 7 0.22 310 0.35 No High Strain 13 -0.16 1190 0.14 No
Eastern Mid-Continent 11 0.0037 487 0.0004 No
7.1.5 Excess Horizontal Stresses
To calculate the excess horizontal stress, a Poisson’s ratio of 0.25 and the average
site stresses are used. A linear regression is fit through the data with a zero intercept
using equation 3.5. Table 7-6 shows the resulting coefficients and coefficients of

79
determination for each region. The coefficient of the equation represents the excess or
tectonic strain components related to the maximum excess horizontal stress.
Table 7-6. Regression models for the maximum excess horizontal stress versus the elastic modulus by region with a zero intercept.
Site Number of sites Coefficient, K1 Coefficient of
determination, R2 Central Appalachian Region
Low strain 7 436 0.76 High strain 13 923 0.86
Northern Appalachian Region General 7 530 0.87
Eastern Mid-Continent General 11 391 0.91
Theoretically, there is a basis for some increase in the horizontal stress with depth,
the increase due to gravity from Poisson’s effect. However, this effect appears to be
masked in the depth models, possibly by the variation in the strain fields. To have a
model that includes this depth factor and the elastic modulus requires building a model
utilizing the excess horizontal stress. Combining equation 3.5 with the expected increase
of the horizontal stress with depth results in the following type of equation
P = 1.1 [ν/(1-ν)] D + K1 E. (7.1)
The coefficient of the elastic modulus, K1, is a strain coefficient. This model can be used
to estimate the maximum horizontal stress magnitude within a region.
A similar type of analysis using equation 3.5 is conducted for the minimum excess
horizontal stress. Table 7-7 shows the resulting coefficients for the elastic modulus and
the coefficients of determination for each region. Except for the northern Appalachian
region and possibly the central Appalachian high strain zone, the coefficient of
determination is so poor as to make the results of the regression analysis meaningless.

80
Table 7-7. Regression models for the minimum excess horizontal stress versus the elastic modulus by region with a zero intercept.
Zone Number of sites
Coefficient, K1
Coefficient of determination, R2
Stress ratio max/min
Standard deviation of ratio
Northern Appalachian 7 350 0.73 1.38 0.22
Central Appalachian Low strain 7 260 0.02 1.67 0.44 High strain 13 610 0.49 1.47 0.24
Eastern Mid-Continent 11 123 0.03 4 4.37
For the northern Appalachian region, the coefficient of determination is 0.73.
Adding in the depth factor, the equation for the minimum horizontal stress for the
northern Appalachian region is
Q = 1.1 [ν/(1-ν)] D + 350 E. (7.2)
Clearly, the minimum excess horizontal stress variation is not as dependent on the
elastic modulus as is the maximum excess horizontal stress variation. Table 7-7 shows
the stress ratio and the standard deviations. These ratios are based on the average for all
the measurements within the region. The regional average ratios vary from 1.38 to 4.0
and are slightly different than those for the measured stresses because the depth factor is
removed from the excess horizontal stresses. However, the standard deviations
especially in the eastern Mid-Continent region results in the minimum excess horizontal
stress not being as dependent on the elastic modulus as the maximum excess horizontal
stress.
7.2 VARIATION OF THE HORIZONTAL STRESSES WITH THE ELASTIC
MODULUS FOR SPECIFIC SEAMS AND MINES
In general, the more local the analysis of the horizontal stress and the elastic
modulus, the more consistent and uniform the horizontal strain field should be. A more
uniform strain field should result in a better correlation between the horizontal stress and

81
the elastic modulus. However, as is seen in the evaluation of the individual sites and
mines in the Beckley seam, the limitation of a more local analysis is a potential lack of a
sufficient elastic modulus range. In the Beckley seam, only for the Bonny Mine, is there
a sufficient range of the elastic properties and uniform strain field to result in a strong
correlation. Therefore, only the analysis from those locations that have a sufficient range
in the elastic modulus are presented in this section. Further, the individual stress
measurements are used in this section and not the site averages.
7.2.1 Pittsburgh Seam
Figure 7-5 shows a graph of the maximum horizontal stress versus the elastic
modulus for the three sites in the Pittsburgh seam. A linear regression fit through the
data results in the following equation
P = 370 E + 728. (7.3)
The coefficient of determination is 0.87 and represents a fairly strong correlation between
the elastic modulus and the maximum horizontal stress.
y = 370x + 728R2 = 0.87
0
500
1000
1500
2000
2500
3000
3500
4000
4500
0 2 4 6 8 10
Elastic Modulus, 106 psi
Stre
ss, p
si
Figure 7-5. The maximum horizontal stress versus the elastic modulus for the Pittsburgh seam.

82
For the 3 sites in the Pittsburgh seam, the elastic modulus ranges from 1.8 to
8.58 million psi. The average site strains from the maximum horizontal stress are for site
1, 461 micro strains, site 2, 557 micro strains and site 3, 736 micro strains. However,
even with some difference in the strain fields, there is still a strong correlation between
the elastic modulus and the horizontal stress because of the large difference in the elastic
modulus between the sites.
The elastic modulus versus the maximum excess horizontal stress can also be
examined. A linear regression fit through the data with a zero intercept results in the
following equation
Pe = 440 E. (7.4)
The coefficient of determination is 0.79. The coefficient for the elastic modulus results in
an excess strain from the maximum horizontal stress for the Pittsburgh seam of 440 micro
strains.
For the minimum horizontal stress, the resulting regression equation is
Q = 171 E + 1122. (7.5)
The coefficient of determination is 0.65. The correlation is weaker than for the maximum
horizontal stress but still fairly strong.
7.2.2 Lower Kittanning Seam
From the West Virginia site data, Aggson (1985) noted a relationship between the
maximum horizontal stress and the elastic modulus. A linear regression fit through all
the data produced the relationship
P = 600 E - 69. (7.6)
The resulting coefficient of determination was 0.83.

83
Figure 7-6 shows a graph of the elastic modulus versus the maximum horizontal
stress for both mines. In the present analysis, only those measurements beyond 15 feet in
depth are used from the West Virginia site. A linear regression is fit through the data
with the resulting equation
P = 665 E + 57. (7.7)
The coefficient of determination is 0.95. There is a very strong correlation between the
elastic modulus and the maximum horizontal stress. Further, the equation is very similar
to the equation developed by Aggson (1985). For both mines, the range in the elastic
modulus is from 1.6 to 6.95 million psi. The average site strain from the maximum
horizontal stress is for the Tanoma Mine, 575 micro strains and for the Philippi, WV
mine, 721 micro strains. A strong correlation is still developed even with some
difference in the strain fields.
y = 665x + 57R2 = 0.95
0
1000
2000
3000
4000
5000
6000
0 1 2 3 4 5 6 7 8
Elastic Modulus, 106 psi
Stre
ss, p
si
Figure 7-6. The maximum horizontal stress versus the elastic modulus for the lower Kittanning seam.

84
The relationship between the elastic modulus and the maximum excess horizontal
stress is also developed. For the maximum excess horizontal stress with the regression
forced through zero, the equation is
Pe = 637 E. (7.8)
The coefficient of determination is 0.95. Essentially, the strain from the maximum
excess horizontal stress in the lower Kittanning seam is 637 micro strains.
For the minimum horizontal stress versus the elastic modulus, the following
equation is developed
Q = 497 E. (7.9)
The coefficient of determination is 0.96. This is a very high correlation especially for the
minimum horizontal stress.
The relationship between the minimum excess horizontal stress and the elastic
modulus is
Qe = 462 E. (7.10)
This implies the strain from the minimum excess horizontal stress is 462 micro strains.
7.2.3 Peabody #10 Mine, Eastern Mid-Continent Region
For the Peabody #10 Mine, a strong relationship between the horizontal stress and
the elastic modulus has been noted previously (Hanna et al., 1991). The range in the
elastic modulus from 1.28 to 5.7 million psi appears to be sufficient to establish an
adequate relationship between the elastic modulus and the maximum horizontal stress.
Figure 7-7 shows a graph of the elastic modulus versus the maximum horizontal stress
from the mine. In this analysis, only the three deepest measurements are used. The
resulting regression equation is

85
P = 608 E. (7.11)
The coefficient of determination is 0.97. However, there is little or no relationship
between the minimum horizontal stress and the elastic modulus at the mine.
7.3 REGIONAL AND LOCAL MODELS-CONCLUSIONS
Regional models can explain a high percent of the variation of the maximum
horizontal stress with the elastic modulus. The coefficients of determination for these
models range from 0.72 to 0.91.
Regional models indicate that the minimum horizontal stress variation is less
dependent on the elastic modulus than the variation of the maximum horizontal stress.
This is especially true in the eastern Mid-Continent region and results from the very low
minimum applied horizontal strains and the high standard deviation of those strains
relative to the average.
Figure 7-7. The maximum horizontal stress versus the elastic modulus for the Peabody #10 Mine.
y = 608xR2 = 0.98
0
500
1000
1500
2000
2500
3000
3500
4000
0 1 2 3 4 5 6
Elastic Modulus, 106 psi
Stre
ss, p
si

86
None of the regional depth factors are significant. Further, in the models, depth can
only explain between 9 and 24 percent of the variation of the maximum horizontal stress.
The maximum horizontal stress normalized by the elastic modulus does not increase with
depth. Essentially, the elastic modulus can be used to explain the variation that might be
attributed to depth, suggesting that the depth is not a significant independent factor.
Regression models for individual mines or groups of sites were developed with the
elastic modulus explaining a high degree of the maximum horizontal stress variation.
However, a sufficient range of the elastic modulus is usually required to develop
adequate models.

87
CHAPTER 8. HORIZONTAL STRESS AND DEPTH MODELS FOR THE
EASTERN UNITED STATES
An examination is made of the variation of the horizontal stress with respect to the
elastic modulus and the depth for the eastern United States.
8.1 VARIATION OF THE HORIZONTAL STRESS WITH THE ELASTIC
MODULUS
For the elastic modulus, a separate analysis is conducted for both the low and high
strain sites. The high strain sites are all from the central Appalachian region and include
the sites with an intermediate strain level. Therefore, the high strain model is restricted to
the central Appalachian region. However, the low strain model is in general applicable for
much of the eastern United States except the intermediate and high strain zones of the
central Appalachian region. To eliminate the effects of depth the excess horizontal stresses
are used.
Table 8-1. Coefficients and statistics for the maximum and minimum excess horizontal stress models for the eastern United States with a zero intercept.
Maximum stress Minimum stress
Region Number of sites/measurements Coefficient
KP
Correlationcoefficient
squared
Coefficient KQ
Correlationcoefficient
squared Low Strain Model-Individual Site Measurements
Northern Appalachian/ Central Appalachian/ Eastern Mid-Continent
67 430 0.71 212 0.24
Low Strain Models-Average Site Stresses and Elastic Modulus Northern Appalachian/ Central Appalachian/ Eastern Mid-Continent
25 459 0.83 255 0.47
Eastern Mid-Continent/ Central Appalachian 18 414 0.88 193 0.32
Northern Appalachian 7 530 0.87 350 0.73 High Strain Model-Individual Measurements
Central Appalachian 48 967 0.66 623 0.1 High Strain Model-Average Site Stresses and Elastic Modulus
Central Appalachian 13 923 0.86 610 0.49

88
To examine the variation of the maximum and minimum excess horizontal stress with
the elastic modulus, equation 3.5 is fit through the data with a zero intercept. Table 8-1
shows the coefficients for the elastic modulus and the coefficients of determination for low
and high strain models for both the maximum and minimum excess horizontal stress. For
several of the models, the site average stress and elastic modulus are used though for
comparison, models are also given based on the individual measurements. Further, several
low strain models are given based on different regional combinations. Again, the main
reason for developing separate regional models for the low strain group is the higher strains
seen in the northern Appalachian region.
Figure 8-1 shows the maximum excess horizontal stress versus the elastic modulus
when the individual measurements are used in the analysis. Regression lines are given
separately for the high strain sites and for the low strain sites. There are clearly two groups
of data with little overlap between the low and high strain groups. The elastic modulus can
explain 71 percent of the variation of the maximum excess horizontal stress in the low
strain model and 66 percent of the variation of the maximum excess horizontal stress in the
high strain model.
y = 432xR2 = 0.71
y = 967xR2 = 0.66
0
1000
2000
3000
4000
5000
6000
7000
8000
9000
0 2 4 6 8 10 12 14
Elastic modulus, 106 psi
Stre
ss, p
si
Low StrainHigh Strain
Figure 8-1. The maximum excess horizontal stress versus the elastic modulus for the eastern United States.

89
Figure 8-2 shows the maximum excess horizontal stress versus the elastic modulus
using the site average stresses and elastic modulus. Again, only two regression models are
developed one for each strain group. With this data, the elastic modulus explains in the low
strain model, 83 percent of the maximum excess horizontal stress variation and in the high
strain model, 86 percent of the maximum excess horizontal stress variation. A higher
coefficient of determination is achieved with site average stresses than when individual
measurements are used. This results from the elimination of the local variations between
the individual measurements.
Because the northern Appalachian region has strains that are about 20 percent
higher than those of the other regions in the low strain group, the low strain group can be
further separated into two groups. Again, using the site average stresses, figure 8-3
shows a graph of the maximum excess horizontal stress versus the elastic modulus with
the low strain data separated into two groups. The elastic modulus now explains
88 percent of the maximum excess horizontal stress variation in the low strain zone
Figure 8-2. The maximum average excess horizontal stress versus the site average elastic modulus for the eastern United States.
y = 460xR2 = 0.83
y = 924xR2 = 0.86
0
1000
2000
3000
4000
5000
6000
7000
8000
0 2 4 6 8 10 12Elastic Modulus, 106 psi
Stre
ss, p
si
Low Strain
High Strain

90
without the northern Appalachian region and 87 percent of the variation in the northern
Appalachian region.
These models for the maximum excess horizontal stress can be used to estimate the
maximum horizontal stress. The maximum horizontal stress can be calculated for the
eastern United States by adding the gravity affects from Poisson’s ratio to the equations.
In general, a single model for the low and high strain zones can explain a high percent of
the variation in the maximum horizontal stress with the elastic modulus. Therefore, the
low strain model can be used to estimate the maximum horizontal stress across much of
the eastern United States for the site depth range of the data set. However, the low strain
zone can be further divided into a combined eastern Mid-Continent and low strain central
Appalachian regions and a northern Appalachian region with the two models explaining
and even higher percent of the maximum horizontal stress variation with the elastic
modulus. The high strain model encompasses the intermediate and high strain zones of
the central Appalachian region. However, there are no definitive boundaries over where
the model should be applied. In general, the low strain model reflects the strain field
y = 414xR2 = 0.88
y = 531xR2 = 0.87
y = 924xR2 = 0.86
0
1000
2000
3000
4000
5000
6000
7000
8000
0 2 4 6 8 10 12
Elastic Modulus, 106 psi
Stre
ss, p
siNorthen Appalachian
Low Strain
Central Appalachian(HS)
Figure 8-3. The maximum average excess horizontal stress versus the site average elastic modulus for the eastern United States (two low strain models).

91
applied across most of the eastern United States including a portion of the central
Appalachian region while the high strain model reflects a high strain region that has only
been observed in the central Appalachian region.
Table 8-1 also shows the models for the minimum excess horizontal stress. In
general, the coefficients of determination are much lower than for the maximum excess
horizontal stress. For most of the models, the coefficients of determination are low
enough as to make the models unreliable for estimating the minimum excess horizontal
stress. Essentially, the minimum excess horizontal stress variation is not as dependent on
the elastic modulus. The exception is the northern Appalachian region.
8.2 MAXIMUM HORIZONTAL STRESS VERSUS DEPTH
The change in the maximum horizontal stress with depth across the eastern United
States is evaluated based on the average maximum horizontal stress from each site. The
site average stresses are used to give each site the same weight. Figure 8-4 shows the depth
versus the maximum horizontal stress across the eastern United States. The resulting
regression equation is
P = 1.27 D + 1836. (8.1)
The coefficient of determination is only 0.15 while the t statistic for the depth coefficient is
2.53. At a 0.05 significance level, the depth factor is significantly greater than zero.
Therefore, in general there appears to be a significant increase of about 1.27 psi/ft of depth
in the eastern United States though the depth can only explain about 15 percent of the
variation. Further, the site in the Columbus limestone in Ohio has a strong influence on the
regression analysis and the depth factor because of the large depth (2,300 ft) and high
maximum horizontal stress (though not high strain). Also, the depth cannot to a large
extent explain the maximum horizontal stresses above 5,000 psi at two other sites with one
of the sites having the highest maximum horizontal stress of 6,910 psi in the data set at a
depth of only 400 ft. All three of these sites have a relatively high elastic modulus ranging
from 6 to 11.2 million psi. These high stresses can be explained by the elastic modulus in
combination with the strain field.

92
Because there was no significant increase with depth in the regional models this
significant increase for the eastern United States may be due to the differences in certain
parameters between regions. Table 8-2 shows the various average parameters for each
region including the depth, elastic modulus and strain. The Illinois basin that includes
7 sites is shown separately from the eastern Mid-Continent region. There are differences in
the average depth, elastic modulus and maximum average strain for each region. Although
the average strain in the Illinois basin is similar to the other areas, except for the high strain
zone, the elastic modulus is much lower and results in a much lower maximum horizontal
stress. Combine these lower stresses with the lowest regional average depth and some
increase in the horizontal stress will probably be observed in this data set for the eastern
United States.
Figure 8-4. The maximum horizontal stress versus the depth in the eastern United States.
y = 1.27x + 1836R2 = 0.15
0
1000
2000
3000
4000
5000
6000
7000
8000
0 500 1000 1500 2000 2500
Depth, ft
Stre
ss, p
si

93
Table 8-2. Summary of average parameters including the depth, maximum horizontal strain and elastic modulus for each region.
Zone Number of sites Depth, ft Elastic modulus,
106 psi Maximum strain,
micro strain
Northern Appalachian 7 839 6.31 597
Central Appalachian Low strain 7 831 6.09 492 High strain 13 946 3.17 1038
Eastern Mid-Continent Region 11 747 4.24 489
Illinois Basin 7 600 2.65 515
To eliminate the effects of the elastic properties, the relationship between the strain
from the maximum horizontal stress and the depth is examined. Figure 8-5 shows the
strain from the maximum horizontal stress versus the depth for the eastern United States.
The resulting regression equation is
εp = 0.08 D + 632. (8.2)
The coefficient of determination is only 0.014 while the t statistic of 1.01 indicates that the
depth coefficient is not significantly greater than zero at a 0.05 significance level. The
strain data is the maximum horizontal stress normalized by the elastic modulus where all
sites have an elastic modulus of one million.
Once the effects of the elastic properties are removed, there is no significant increase
in stress with the depth. Further, this depth model can only explain one percent of the
variation in the strain or stress. This would suggest that there is some relationship between
the depth and the elastic modulus. The correlation between the depth and elastic modulus
is 0.24. Although this correlation is weak, it is also positive. Because, the relationship
between depth and the maximum horizontal stress is also weak, this low degree of
correlation is sufficient to cause the normalized stresses not to be significantly influenced
by depth.
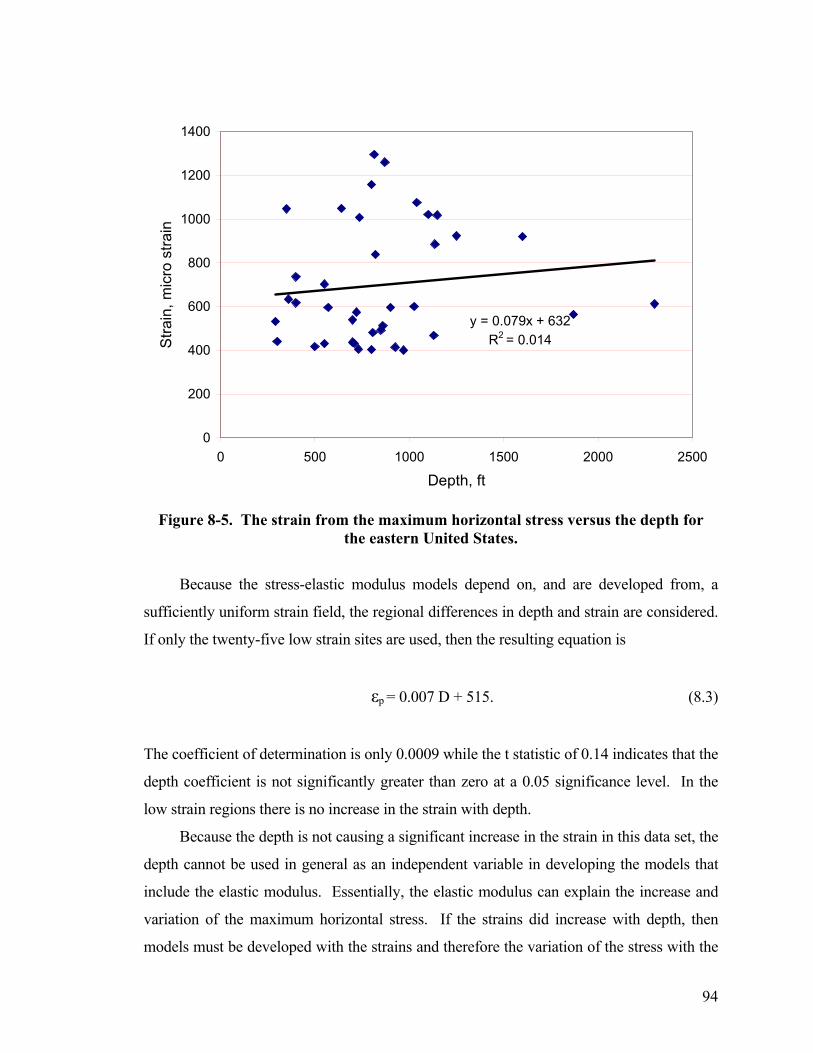
94
Because the stress-elastic modulus models depend on, and are developed from, a
sufficiently uniform strain field, the regional differences in depth and strain are considered.
If only the twenty-five low strain sites are used, then the resulting equation is
εp = 0.007 D + 515. (8.3)
The coefficient of determination is only 0.0009 while the t statistic of 0.14 indicates that the
depth coefficient is not significantly greater than zero at a 0.05 significance level. In the
low strain regions there is no increase in the strain with depth.
Because the depth is not causing a significant increase in the strain in this data set, the
depth cannot be used in general as an independent variable in developing the models that
include the elastic modulus. Essentially, the elastic modulus can explain the increase and
variation of the maximum horizontal stress. If the strains did increase with depth, then
models must be developed with the strains and therefore the variation of the stress with the
y = 0.079x + 632R2 = 0.014
0
200
400
600
800
1000
1200
1400
0 500 1000 1500 2000 2500
Depth, ft
Stra
in, m
icro
stra
in
Figure 8-5. The strain from the maximum horizontal stress versus the depth for the eastern United States.

95
elastic modulus also dependent on the depth. In such a case, the strain or the affects of the
elastic modulus would not be independent of the depth.
However, there is no significant increase in the horizontal strain with depth. The
apparent significant increase of the horizontal stress with depth across the eastern United
States appears to be due to the regional differences in the elastic modulus, strain and depth.
Essentially, the range of depth may be too limited and the stresses obtained over too wide
of a geographic area to be used to establish a depth factor for the stress or strain across the
eastern United States.
8.3 HORIZONTAL STRESS AND DEPTH MODELS FOR THE EASTERN
UNITED STATES-CONCLUSIONS
A high and low strain model developed for the eastern United States can explain 83
and 86 percent of the variation of the maximum excess horizontal stress with the elastic
modulus. This implies that large areas of the eastern United States are subjected to a
sufficiently uniform strain field from the maximum horizontal stress to allow for such
strong correlations.
In general, the models for the minimum horizontal stress and elastic modulus have a
much lower coefficient of determination than for the maximum excess horizontal stress.
Essentially, the minimum horizontal stress variation is not as dependent on the elastic
modulus.
Depth does cause a significant increase in the maximum horizontal stress across the
eastern United States though the coefficient of determination is only 0.15. Though
significant, the depth can explain little of the maximum horizontal stress variation.
Further, the maximum horizontal stress normalized by the elastic modulus does not
increase significantly with depth. This implies that the elastic modulus can explain some
of the variation attributed to depth and suggesting that depth may not be a significant
independent factor.
The minimal affects of depth may be due to the limited range of depth with stress
measurements being taken over too large of an area to establish a reliable depth factor for
the eastern United States from this data set.

96
CHAPTER 9: SUMMARY AND CONCLUSIONS
In this study, the relationship between the horizontal stress magnitude and the
elastic modulus and depth were examined based on stress measurements made at sites
related to mining in bedded deposits in the eastern United States. Relationships between
the horizontal stress and the elastic modulus and depth were evaluated by fitting linear
regressions through the stress data. The stress data set was composed of 40 sites where
the horizontal stress had been determined. Site depths ranged from 275 to 2,300 ft. This
range does encompass most of the expected depths for underground limestone and coal
mines in the eastern United States.
The stress data was divided geographically into 3 main groups that included the
northern and central Appalachian regions and the eastern Mid-Continent region. Initially,
an analysis was made of the Beckley coal seam in the central Appalachian region where
an extensive horizontal stress measurement program was conducted in the late 1970’s and
early 1980’s. Regional and more general models for the eastern United States were then
developed or evaluated for both the elastic modulus and depth. As part of the study, the
strains produced by the stress fields were also considered.
To establish a strong relationship between the maximum horizontal stress and the
elastic modulus in the Beckley coal seam, the data had to be separated into high and low
strain zones. Geographically, 13 of the sites are in two coterminous zones with 8 sites in
the high strain zone and 5 sites in the low strain zone with these zones encompassing
areas of tens to hundreds of square miles. However, the Beckley #2 Mine, with two high
strain sites is separated from the high strain zone by the intervening low strain zone. In
the Beckley seam analysis, the individual measurements were used in developing the
regression models. Regression models for the high strain zone could explain 68 percent
of the variation in the magnitude of the maximum horizontal stress with the elastic
modulus. However, for the low strain zone, only 8 percent of the maximum horizontal
stress variation could be explained by the elastic modulus. In part, in the low strain zone,
the range of the elastic modulus was not sufficient to establish a more reliable model.
For the minimum stress, the models could explain much less or little of the variation with
the elastic modulus.

97
The horizontal strain fields across the eastern United States were also examined
using the applied strains. For the eastern United States, the typical site average maximum
applied horizontal strain ranges from 300 to 600 micro strains. Sites with maximum
strains below about 300 micro strains appear to be in partial strain relief. The sites with
maximum strains above 550 micro strains are found only in the central Appalachian
region. Further, the central Appalachian region high strain zone has site strains between
700 to 970 micro strains.
Regionally, the average maximum applied horizontal strain for the eastern Mid-
Continent region was 376 micro strains and for the northern Appalachian region
444 micro strains. The northern Appalachian region has strains that are about 20 percent
higher than the other low strain regions including the low strain zone of the central
Appalachian region. For the central Appalachian region, the low strain zone has an
average maximum applied horizontal strain of 369 micro strains and the high strain zone
has an average maximum applied horizontal strain of 836 micro strains. Clearly, there
are some very high strain zones in the central Appalachian region that have not been seen
in other regions of the eastern United States.
The standard deviations of the regional maximum horizontal strains are less than
about 25 percent of the average strain. Therefore, the strain fields are sufficiently
uniform over large areas in the eastern United States to establish adequate regression
models for the maximum excess horizontal stress based on the elastic modulus. In the
case of the eastern Mid-Continent and northern Appalachian regions, these areas appear
to cover thousands or hundreds of thousand of square miles. In general, the horizontal
strain fields in the eastern United States can be separated into high and low strain groups
in large part by geographic location. These groupings form the basis for high and low
strain model development.
The minimum applied horizontal strains are for the northern Appalachian region,
264 micro strains, for the eastern Mid-Continent region 71 micro strains, for the low
strain central Appalachian zone, 168 micro strains and for the high strain central
Appalachian zone 437 micro strains. Clearly, the eastern Mid-Continent region has the
lowest minimum applied horizontal strain. The ratios of the maximum to minimum
applied horizontal strain are for the eastern Mid-Continent region 5.3, for the northern

98
Appalachian region 1.68 and for the high strain central Appalachian zone 1.91. In
general, the horizontal strain fields across the eastern United States are fairly biaxial with
almost uniaxial strain conditions across the eastern Mid-Continent region. In general, but
especially for the eastern Mid-Continent region, the standard deviation of the minimum
applied horizontal strain is relatively much higher than the maximum applied horizontal
strain when compared to the average strain. This results in the minimum horizontal stress
being much less dependent on the elastic modulus.
Table 9-1. Regression models for the excess maximum and maximum horizontal stress versus the elastic modulus developed in study.
Model Number of sites Coefficient, K1
Constant, K2
Coefficient of determination, R2
Central Appalachian Region (Maximum Horizontal Stress) Low strain 7 444 252 0.72 High strain 13 965 215 0.9
Northern Appalachian Region (Maximum Horizontal Stress) General 7 576 0 0.89 General 7 564 94 0.89
Eastern Mid-Continent Region (Maximum Horizontal Stress) General 11 445 0 0.87 General 11 375 393 0.91
Eastern United States (Excess Maximum Horizontal Stress) Low Strain1 25 460 0 0.83 Low Strain2 18 414 0 0.88 Low Strain3 7 531 0 0.87 High Strain 13 924 0 0.86 1All low strain sites from the eastern United States were used in the analysis. 2All sites from the eastern Mid-Continent and central Appalachian low strain zone are used in the analysis. 3Only sites from the northern Appalachian region are used in the analysis.
Regional models based on the three main regions were also developed for the
variation of the horizontal stress with the elastic modulus. Table 9-1 gives these regional
models. The regional models can explain between 72 to 91 percent of the variation of the
maximum horizontal stress. Like the Beckley seam, the central Appalachian region was
divided into low and high strain zones with models developed for each. However, the
geographic extent of these zones within the region is not entirely clear. These regional
99
models were established using site average values. Using individual measurements in the
analysis will decrease the coefficients of determination because of the local and site
variation in the strain field.
For specific mines or groups of sites, strong relationships between the elastic
modulus and the maximum horizontal stress were also found. In general, these are
groups of sites or mines where there is a sufficient range of the elastic modulus and also a
sufficiently uniform strain field. To establish a reliable model does in general require a
large enough range in the elastic modulus.
High and low strain models for the variation of the maximum excess horizontal
stress with the elastic modulus were also developed for the eastern United States
(table 9-1). Because the northern Appalachian region had strains that were about 20
percent higher, two low strain models were developed. One low strain model
incorporates the eastern Mid-Continent region and the central Appalachian region low
strain zone, the other, the northern Appalachian region. The high strain model
encompasses the high strain zone of the central Appalachian region. However, the exact
geographic outline of the high and low strain zones in the central Appalachian region is
not clearly defined. The models can explain between 83 to 88 percent of the variation of
the maximum excess horizontal stress with the elastic modulus. The coefficients of the
elastic modulus in the models range from between 414 to 531 micro strains for the low
strain models to 924 micro strains for the high strain model. These model coefficients
can be considered the strain produced from the tectonic or maximum excess horizontal
stress.
In general, the relationship between the elastic modulus and the minimum
horizontal stress is much weaker or almost non-existent with the minimum stress not as
dependent on the elastic modulus. This is reflected in the difference and variability of the
maximum to minimum horizontal stress and strain ratios within and between regions. To
have a minimum horizontal stress as dependent on the elastic modulus as the maximum
stress would require that the ratios be nearly constant. The minimum horizontal stress
being less dependent on the elastic modulus is in part due to the lower average strains and
the higher standard deviation of those strains relative to the average strain. This is
especially true in the eastern Mid-Continent region where the standard deviation actually

100
exceeds the minimum average applied horizontal strain. Essentially, in the eastern Mid-
Continent region the minimum applied horizontal strain variation is so large as to
preclude a sufficiently uniform strain field to develop adequate models. This results from
the low average minimum horizontal strain across the region. Where there is a higher
minimum applied horizontal strain with a lower standard deviation such as in the
northern Appalachian region, the minimum horizontal stress is almost as dependent on
the elastic modulus as the maximum horizontal stress.
From the regional analysis, no significant increase in the maximum horizontal stress
with depth was observed. The depth could explain very little of the variation in the
horizontal stress across any region. Further, the horizontal strains from the maximum
horizontal stress do not significantly increase for any of the regions. For the eastern United
States, the maximum horizontal stress does appear to increase significantly with depth
though the depth could explain only 15 percent of the variation. However, there was no
statistically significant increase in the strain from the maximum horizontal stress with depth
and no regional increase in the maximum horizontal stress with depth, thus the cause of this
statistically significant increase appears to be in part the regional differences in the other
parameters such as the elastic modulus and the strain level. Further, for this data, there is
some correlation between depth and the elastic modulus, though this correlation is weak, it
is sufficient to result in the maximum horizontal stresses normalized by the elastic modulus
not increasing significantly with depth. The depth analysis though, must be put into
context where the range of depths from the sites was from 275 to 2,300 feet. This may not
be a sufficient depth range with the sites located across such a wide geographic area to be
able to develop an adequate or appropriate depth factor. Because the strain did not increase
significantly with depth, the depth cannot in general be used as an independent variable in
the models. However, if the strain did increase with depth, then the strains and the affects
of the elastic modulus will be dependent in part on depth. Essentially, multiple regression
models cannot be developed with both the elastic modulus and depth as independent
variables. Further, none of the multiple regression analysis indicated that depth was a
significant factor.
Theoretically, there is a basis for an increase in the horizontal stress with depth based
on gravity and Poisson’s effect. This effect is not dependent on any increase in the applied

101
horizontal strains. However, if this effect does exist, the magnitude of this increase is too
small to measure within the present data set. Because of regional differences in the average
depth, elastic modulus and strain fields and because the affects of the elastic modulus over
shadow the depth effects, no adequate depth factor could be established for the eastern
United States.
The main conclusions drawn from this study are:
1. The variation of the magnitude of the maximum horizontal stress is strongly
dependent on the elastic modulus across the eastern United States.
2. The horizontal strain fields are sufficiently uniform across large geographic
sections of the eastern United States to allow for models to be developed for the
variation of the maximum horizontal stress based on the elastic modulus that can
be applied to these regions. Essentially, in this data set, the horizontal strains are
more uniform than the horizontal stresses.
3. A very high strain zone does exist in the central Appalachian region that includes
a portion of the Beckley coal seam though the exact extent of the zone is not
known.
4. The minimum horizontal stress and strain in the eastern Mid-Continent region are
much less than for the central and Northern Appalachian regions. Further, the
horizontal stresses are much more biaxial or directional in the eastern Mid-
Continent region.
5. The minimum horizontal stress variation is in general less dependent on the
elastic modulus than the maximum horizontal stress. This is due in large part to
the lower average minimum horizontal strains and the relatively higher standard
deviation of the strain. This can be seen in the eastern Mid-Continent region with
a standard deviation that is larger than the average applied horizontal strain.
6. Although the depth did cause a significant increase in the maximum horizontal
stress across the eastern United States, the depth did not cause a significant
increase in the strains from the maximum horizontal stress. Therefore, depth
cannot be used independently of the elastic modulus and strain in the development
of the regression models for this data set. Essentially, the elastic modulus can

102
explain the variations of the stress that could be attributed to depth in this data set.
However, a theoretical basis is used in this study based on Poisson’s effect and
gravity though this effect is small. Further, the development of an adequate depth
factor may require a greater depth range than found in the data set.
7. The elastic modulus of the rock utilizing the developed regression models
provides a much better estimate of the maximum horizontal stress variation than
does the depth in this data set.

103
BIBLIOGRAPHY Agapito, J. F. T., S. J. Mitchell, M. P. Hardy and W. N. Hoskins. 1980A. Determination
of In Situ Horizontal Rock Stress on Both a Mine-Wide and District-Wide Basis. Final
Technical Report, USBM Contract No. JO 285020, 174 pp.
Agapito, J. F. T., S. J. Mitchell, M. P. Hardy and J. R. Aggson. 1980B. A Study of
Ground Control Problems in Coal Mines with High Horizontal Stresses. Rock
Mechanics, A State of the Art, Proceeding: 21st Rock Mechanics Symposium, University
of Missouri-Rolla, May 28-30, pp. 820-828.
Agapito, J. F. T and L. J. Gilbride. 2002. Horizontal Stresses as Indicators of Roof
Stability. Society of Mining Engineers, Preprint no. 02-056, SME Annual Meeting,
Phoenix, AR, Feb. 25-27, 11 pp.
Aggson, J. R. 1978. Coal Mine Floor Heave in the Beckley Coalbed, An Analysis. U.S.
Bureau of Mines Report of Investigation, RI 8274, 32 pp.
Aggson, J. R. 1979A. How to Plan Ground Control. Coal Mining & Processing, Dec.
1979, pp. 70-73.
Aggson, J. R. 1979B. Stress-Induced Failures in Mine Roof. U.S. Bureau of Mines
Report of Investigation, RI 8338, 16 pp.
Aggson, J. R. 1985. In-Situ Stress Determinations in the C-15 Entries of the Kitt #1
Mine – Philippi, West Virginia. Report to the Standard Oil Company (Ohio), Agapito &
Associates, April 18, 44 pp.
Aggson, J. R. and D. P. Mouyard. 1988A. Geomechanical Evaluation of a Coal Mine
Arched Entry. International Journal of Mining and Geologic Engineering, 1988, pp. 185-
193.

104
Aggson, J. R. and D. P. Mouyard. 1988B. Geomechanical Evaluation of a Coal Mine
Arched Entry. Society of Mining Engineers, Preprint no. 88-5, SME Annual Meeting,
Phoenix, AR, Jan 25-28, 7 pp.
Agarwal, R. and S. Mayer. 1979. Longwall Subsidence Measurement using
Photogrammetric and Surface Surveying Techniques. Final Report, USBM Contract
No. J0366031, 8 pp.
Amadi, B. 1992. Importance of Anisotropy When Estimating and Measuring In Situ
Stresses in Rock. International Journal of Rock Mechanics and Mining Sciences, April,
pp. 293-325.
Beerkircher, M. 1994. Monterey Coal Company’s Longwall Project. Proceedings:
Illinois Mining Institute, Annual Meeting Collinsville, Illinois, Sept 22-23, pp. 85-94.
Bickel, D. L. 1993. Rock Stress Determinations From Overcoring-An Overview. U.S.
Bureau of Mines Bulletin, B 694, 146 pp.
Bickel, D. 1985. Overcoring Equipment and Techniques Used in Rock Stress
Determination (An Update of IC 8618). BuMines IC 8618, 27 pp.
Bigby, D., P. Cartwright and J. Cassie. 1995. Lateral Stress Relief for Longwall Access
and Trunk Roadways. Final report on Project 7220-AB/834 for European Coal and Steel
Community, June, 251 pp.
Blevins, C. T. 1982. Coping with High Lateral Stresses in an Underground Illinois Coal
Mine. Society of Mining Engineers, Preprint no. 82-156, SME Annual Meeting, Dallas,
TX, Feb. 14-18, 7 pp.

105
Blevins, C. T. and D. Dopp. 1985. Ground Control in a High Horizontal Stress Field at
Inland Steel Coal Mine No. 2. Proceedings: 4th Conference on Ground Control in
Mining. WV Univ. Morgantown, WV, July 22-24, pp. 227-233.
Brasfield, J and G. Hendon. 1994. Yield Pillar Behavior at Jim Walter No. 7 Mine
Stress and Strata Measurements of Yield and Abutment Pillars. Proceedings: 13th
International Conference on Ground Control in Mining. WV Univ. Morgantown, WV,
August 2-4, pp. 91-99.
Brown, E. T. and E. Hoek. 1978. Trends in Relationship Between Measured In-Situ
Stresses and Depth. International Journal of Rock Mechanics, Mining Science and
Geomechanical Abstracts, Vol. 15, pp. 211-215.
Campoli, A, D.C. Oyler and F. E. Chase. 1990. Performance of a Novel Bump Control
Pillar Extracting Technique During Room-and Pillar Retreat Coal Mining. U. S. Bureau
of Mines Report of Investigation, RI 9240, 40 pp.
Cartwright, P. B. 1997. A review of Recent In-Situ Stress Measurements in United
Kingdom Coal Measure Strata. Proceedings: International Symposium on Rock Stress,
Kumamoto, Japan, Oct. 7-10, pp. 469-474.
Crawford, J. and A. Hoagland. 1968. The Mascot-Jefferson City Zinc District. Tennessee.
Chapter in Ore Deposits of the United States, 1933-1967, editor J. D. Ridge, The American
Institute of Mining, Metallurgical and Petroleum Engineers, Inc., pp. 240-255.
Dolinar, D. R., J. R. Aggson and V. E. Hooker. 1982. In Situ Stress Distribution and
Related Ground Control Problems. Proceedings: 2nd Conference in Room and Pillar
Mining, Society of Mining Engineers of AIME, pp. 35-40.
Dolinar, D. R., T. Mucho, D. Oyler and J. Pablic. 2000. Utilizing the “Advance and
Relieve” Method to Reduce Horizontal Stress Affects on the Mine Roof, A Case Study.

106
Proceedings: 19th International Conference on Ground Control in Mining. WV Univ.
Morgantown, WV, August 8-10, pp. 137-148.
Duvall, W. and J. R. Aggson. 1980. Least Squares Calculation of Horizontal Stresses
from More Than Three Diametral Deformations in Vertical Boreholes. U. S. Bureau of
Mines Report of Investigation, RI 8414, 12 pp.
Guangyu, L, B. Shiwei and L. Jiguang. 1986. Twenty Years of Experience on In-Situ
Stress Measurements in China. Proceedings: International Symposium on Rock Stress
and Rock Stress Measurements, Stockholm, Sweden, Sept. 1-3, pp. 79-88.
Hanna, K, K. Haramy and D. Conover. 1986. Effect of High Horizontal Stress on Coal
Mine Entry Intersection Stability. Proceedings: 5th Conference on Ground Control in
Mining. WV Univ. Morgantown, WV, June 11-13, pp. 167-182.
Hanna, K, D. Conover and K. Haramy. 1991. Coal Mine Entry Intersection Behavior
Study. U. S. Bureau of Mines Report of Investigation, RI 9337, 78 pp.
Hayes, A. W. and P. F. R. Altounyan. 1995. Strata Control-The State of the Art. Mining
Technology December 1995 vol. 77 No. 892, pp. 354-358.
Hendon, G., F. Carr, A. Lewis, and J. Cassie. 1995. A Cooperative Study of Gate Entry
Designs Welbeck Colliery and Jim Walters Resources (USA). Proceedings: 14th
International Conference on Ground Control in Mining. WV Univ. Morgantown, WV,
August 1-3, pp. 94-103.
Herget, G. 1986. Changes of Ground Stress with Depth in the Canadian Shield.
Proceedings: International Symposium on Rock Stress and Rock Stress Measurements,
Stockholm, Sweden, Sept. 1-3, pp. 61-68.
Herget, G. 1988. Stresses in Rock. A.A. Balkema, Rotterdam, Brookfield, VT, 179 pp.
107
Iannacchione, A. D. Dolinar and T. Mucho. 2002. High Stress Mining Under Shallow
Overburden in Underground Stone Mines. Australian Center for Geomechanics First
International Seminar on Deep and High Stress Mining. November 6-8, Perth, Australia.
Iannacchione, A. D. Dolinar L. Prosser T. Marshall D. Oyler and C. Compton. 1998
Controlling Roof Beam Failures from High Horizontal Stresses in Underground Stone
Mines. Proceedings: 17th International Conference on Ground Control in Mining. WV
Univ. Morgantown, WV, August 4-6, pp. 102-112.
Ingram, D. K. and G. M. Molinda. 1988. Relationship Between Horizontal Stresses and
Geologic Anomalies in Two Coal Mines in Southern Illinois. U.S. Bureau of Mines
Report of Investigation, RI 9189, 18 pp.
International Society of Rock Mechanics. 1987. Suggested Methods for Rock Stress
Determination. Inter. J. Rock Mech. and Mining Science, Vol., 24, pp 53-73.
Jaeger, J. C. and N. G. W. Cook. 1969. Fundamentals of Rock Mechanics. John Wiley
and Sons, London, 585 pp.
Mark, C., G. Molinda and D. Dolinar. 2001. Analysis of Roof Bolt Systems.
Proceedings: 21st International Conference on Ground Control in Mining. WV Univ.
Morgantown, WV, August 7-9, pp. 218-225.
Mark, C. and T. P. Mucho. 1994. Longwall Mine Design for Control of Horizontal
Stress. New Technology for Longwall Ground Control. Proceedings: U. S. Bureau of
Mines Technology Transfer Seminar, Special Publication 01-94, pp. 53-76.
Miller, D. 1998. Progression of Longwall Gateroad Support as Conditions Change at
Lodestar Energy’s Baker Mine. Proceedings: 17th International Conference on Ground
Control in Mining. WV Univ. Morgantown, WV, August 4-6, pp. 212-220.

108
Obert, L. 1962. In Situ Determination of Stress in Rock. Mining Engineering Aug.,
pp. 51-58.
Obert, L and W. Duvall. 1967. Rock Mechanics And The Design Of Structures In Rock.
John Wiley and Sons, New York, 650 pp.
Oyler, D. 2001. Development and Use of a High Pressure Packer for Measuring
Horizontal Stress Using the Hydraulic Fracturing Method. Rock Mechanics in the
National Interest, Proceedings of the 38th Rock Mechanics Symposium, DC Rocks 2001,
Washington, DC, July 7-10, pp. 227-234.
Sheorey, P. R., G. Murali Mohan and A. Sinha. 2002. Influence of Elastic Constants on
the horizontal In Situ Stress. International Journal of Rock Mechanics and Mining
Sciences, December, Vol. 38, no. 8. pp. 1211-1216.
Sheorey, P. R. 1994. A Theory for In Situ Stresses in Isotropic and Transversely
Isotropic Rock. International Journal of Rock Mechanics and Mining Sciences. February,
Vol 31, no.1, pp. 23-34.
Unrug, K., G. Herget and A. Smith. 1984. Ground Stress and Roof Failure in Coal Mine
Strata. Proceedings: 2nd International Conference on Stability in Underground Mining.
Univ. KY, Lexington, KY, pp. 377-408,
Wortnicki, G and R. Walton. 1976. Triaxial “Hollow-Inclusion” Gauges For
Determination of Rock Stresses In Situ. International Society of Rock Mechanics
Symposium, Investigation of Stress in Rock—Advances in Stress Measurement, Sidney,
Australia, National Conference Publication 76/4, Supplement, pp 1-8.
Wright, F. D., R. C. Howell and J. A. Dearinger. 1979. Rock Mechanics Study of
Shortwall Mining. Final Technical Report U. S. DOE ET-73-C-0109010, 120 pp.

109
Wright, F. D., Gesund, H. and R. C. Howell. 1980. Stresses and Safe Bolting Patterns in
Coal Mine Roof Rocks at Intersections. Final Technical Report, USBM Contract No.
HO 144108, 225 pp.
Zoback, M. L., C. Barton, M. Brudy, D. Castillo,T. Finkbeiner, B. Grollimund, D. Moss,
P. Peska, C. Ward and D. Wiprut. 2003. Determination of Stress Orientaion and
Magnitude in Deep Wells. International Journal of Rock Mechanics and Mining
Sciences, October-December, no. 40, pp. 1049-1076.
Zoback, M. L. 1992. First- and Second-Order Patterns of Stress in the Lithosphere: The
World Stress Map Project. J. Geophys Res, v 97 , No. B8, July, pp. 11703-11728.
Zoback. M. L. and M. D. Zoback. 1989. Tectonic Stress Field of the Continental United
States. Ch. In Geophysical Framework of the Continental United States. Geol. Soc. of
America Memoir 172, pp. 523-539.

110
Appendix A
Table A-1. Measured horizontal stresses in the Beckley coal field.
Mine Hole Measurement depth, ft
Maximum horizontal stress, psi
Minimum horizontal stress, psi
Maximum1
horizontal strain, micro strain
Minimum1
horizontal strain, micro strain
Elastic modulus, 106 psi
Site depth, ft
Beckley #4 1 18 1484 1141 838 645 1.77 820 Beckley #1 2 5.2 3306 1738 396 208 8.34 1130 Beckley #1 2 9.2 3152 1983 507 319 6.22 1130 Beckley #1 2 14.4 3184 1961 434 268 7.33 1130 Beckley #2 3 10.2 2317 1689 1048 764 2.21 1100 Beckley #2 3 12.3 2416 1725 1046 747 2.31 1100 Bonny 4 14.7 4390 3335 1237 939 3.55 1136 Bonny 4 16 3175 2845 971 870 3.27 1136 Bonny 4 18.4 2933 1972 776 522 3.78 1136 Bonny 4 19.6 3451 2689 920 717 3.75 1136 Bonny 5 15.8 5047 2389 950 450 5.31 1148 Bonny 5 16.8 5816 3061 1028 541 5.66 1148 Bonny 5 22.3 8264 5062 1176 720 7.03 1148 Maple Meadows 6 15.4 2383 2141 391 351 6.1 708 Maple Meadows 6 16.1 3022 2896 471 452 6.41 708 Maple Meadows 6 17.7 2862 2792 442 432 6.47 708 Maple Meadows 7 15.3 4615 2969 972 625 4.75 735 Maple Meadows 7 16.8 4594 3325 1531 1108 3 735 Maple Meadows 7 24.4 3900 2449 701 440 5.56 735 Maple Meadows 8 21 3901 2110 601 325 6.49 1025 Maple Meadows 8 22 4648 2478 714 381 6.51 1025 Maple Meadows 8 23 4177 2492 506 302 8.26 1025

111
Table A-1. Measured horizontal stresses in the Beckley coal field (Cont.).
Mine Hole Measurement depth, ft
Maximum horizontal stress, psi
Minimum horizontal stress, psi
Maximum1
horizontal strain, micro strain
Minimum1
horizontal strain, micro strain
Elastic modulus, 106 psi
Site depth, ft
Maple Meadows 9 9.1 2636 1597 1094 663 2.41 814 Maple Meadows 9 12 2893 2025 1162 813 2.49 814 Maple Meadows 9 13.5 3058 2105 1307 900 2.34 814 Maple Meadows 9 14.5 3705 2692 1506 1094 2.46 814 Maple Meadows 9 18.8 3344 3019 1348 1217 2.48 814 Maple Meadows 9 19.3 3456 2652 1345 1032 2.57 814 Maple Meadows 10 18.7 3939 1584 566 228 6.96 807 Maple Meadows 10 19.7 2860 1465 423 217 6.76 807 Maple Meadows 10 20.7 3138 1646 433 227 7.24 807 Maple Meadows 10 22.9 3356 1892 501 282 6.7 807 Beckley Mining 11 10.3 2711 2261 812 677 3.34 640 Beckley Mining 11 15.7 3385 1206 898 319 3.78 640 Beckley Mining 11 16.7 3303 3069 1032 959 3.2 640 Beckley Mining 11 22.2 3146 2362 1183 888 2.66 640 Beckley Mining 11 23.2 3287 2649 1417 1142 2.32 640 Beckley Mining 11 24.8 2596 1991 1086 833 2.39 640 Beckley Mining 12 15.1 4202 3598 1281 1097 3.28 870 Beckley Mining 12 16.5 3690 2958 1186 951 3.11 870 Beckley Mining 12 20.3 3819 2743 1265 908 3.02 870 Beckley Mining 12 21.8 3538 2630 1320 981 2.68 870 Beckley Mining 12 22.8 3391 2629 1309 1015 2.59 870 Beckley Mining 13 13.8 3416 2433 1251 891 2.73 800 Beckley Mining 13 18.2 3746 2935 1283 1005 2.92 800 Beckley Mining 13 20.7 2701 1995 1159 856 2.33 800 Beckley Mining 13 23.3 2772 1949 943 663 2.94 800

112
Table A-1. Measured horizontal stresses in the Beckley coal field (Cont.).
Mine Hole Measurement depth, ft
Maximum horizontal stress, psi
Minimum horizontal stress, psi
Maximum1
horizontal strain, micro strain
Minimum1
horizontal strain, micro strain
Elastic modulus, 106 psi
Site depth, ft
Beckley Mining 13 24.5 2927 2193 1166 874 2.51 800 Beckley Mining 13 25.5 3566 2916 1278 1045 2.79 800 Beckley Mining 14 16.3 4209 2563 1213 739 3.47 1040 Beckley Mining 14 17.4 3664 2312 1186 748 3.09 1040 Beckley Mining 14 18.4 3581 1993 1066 593 3.36 1040 Beckley Mining 14 22.6 3426 2134 999 622 3.43 1040 Beckley Mining 14 24.2 4132 2401 991 576 4.17 1040 Beckley #1 15 9.5 3221 1879 419 244 7.69 700 Beckley #1 15 10.7 3672 2170 488 289 7.52 700 Beckley #1 15 13.6 2144 1227 317 182 6.76 700 Beckley #2 16 12 1852 1447 1001 782 1.85 350 Beckley #2 16 13.1 1711 1324 1012 783 1.69 350 Beckley #2 16 14.2 1814 1297 1099 786 1.65 350 Beckley #2 16 15.25 1887 1281 1123 763 1.68 350 1The horizontal strains are from the maximum and minimum stresses.

113
Table A-2. Excess horizontal stresses and strains in the Beckley coal field.
Mine Hole Measurement depth, ft
Maximum horizontal stress, psi
Minimum horizontal stress, psi
Maximum1
horizontal strain, micro strain
Minimum1
horizontal strain, micro
strain
Elastic modulus, 106 psi
Site depth, ft
Beckley #4 1 18 1186 843 670 476 1.77 820 Beckley #1 2 5.2 2896 1328 347 159 8.34 1130 Beckley #1 2 9.2 2742 1573 441 253 6.22 1130 Beckley #1 2 14.4 2774 1551 378 212 7.33 1130 Beckley #2 3 10.2 1918 1290 868 584 2.21 1100 Beckley #2 3 12.3 2017 1326 873 574 2.31 1100 Bonny 4 14.7 3978 2923 1121 823 3.55 1136 Bonny 4 16 2763 2433 845 744 3.27 1136 Bonny 4 18.4 2521 1560 667 413 3.78 1136 Bonny 4 19.6 3039 2277 810 607 3.75 1136 Bonny 5 15.8 4630 1972 872 371 5.31 1148 Bonny 5 16.8 5399 2644 954 467 5.66 1148 Bonny 5 22.3 7847 4645 1116 661 7.03 1148 Maple Meadows 6 15.4 2126 1884 349 309 6.1 708 Maple Meadows 6 16.1 2765 2639 431 412 6.41 708 Maple Meadows 6 17.7 2605 2535 403 392 6.47 708 Maple Meadows 7 15.3 4348 2702 915 569 4.75 735 Maple Meadows 7 16.8 4327 3058 1442 1019 3 735 Maple Meadows 7 24.4 3633 2182 653 392 5.56 735 Maple Meadows 8 21 3529 1738 544 268 6.49 1025 Maple Meadows 8 22 4276 2106 657 324 6.51 1025 Maple Meadows 8 23 3805 2120 461 257 8.26 1025 Maple Meadows 9 9.1 2341 1302 971 540 2.41 814 Maple Meadows 9 12 2598 1730 1043 695 2.49 814

114
Table A-2. Excess horizontal stresses and strains in the Beckley coal field. (Cont.)
Mine Hole Measurement depth, ft
Maximum horizontal stress, psi
Minimum horizontal stress, psi
Maximum1
horizontal strain, micro strain
Minimum1
horizontal strain, micro
strain
Elastic modulus, 106 psi
Site depth, ft
Maple Meadows 9 13.5 2763 1810 1181 774 2.34 814 Maple Meadows 9 14.5 3410 2397 1386 974 2.46 814 Maple Meadows 9 18.8 3049 2724 1229 1098 2.48 814 Maple Meadows 9 19.3 3161 2357 1230 917 2.57 814 Maple Meadows 10 18.7 3646 1291 524 185 6.96 807 Maple Meadows 10 19.7 2567 1172 380 173 6.76 807 Maple Meadows 10 20.7 2845 1353 393 187 7.24 807 Maple Meadows 10 22.9 3063 1599 457 239 6.7 807 Beckley Mining 11 10.3 2479 2029 742 607 3.34 640 Beckley Mining 11 15.7 3153 974 834 258 3.78 640 Beckley Mining 11 16.7 3071 2837 960 887 3.2 640 Beckley Mining 11 22.2 2914 2130 1095 801 2.66 640 Beckley Mining 11 23.2 3055 2417 1317 1042 2.32 640 Beckley Mining 11 24.8 2364 1759 989 736 2.39 640 Beckley Mining 12 15.1 3886 3282 1185 1001 3.28 870 Beckley Mining 12 16.5 3374 2642 1085 850 3.11 870 Beckley Mining 12 20.3 3503 2427 1160 804 3.02 870 Beckley Mining 12 21.8 3222 2314 1202 863 2.68 870 Beckley Mining 12 22.8 3075 2313 1187 893 2.59 870 Beckley Mining 13 13.8 3126 2143 1145 785 2.73 800 Beckley Mining 13 18.2 3456 2645 1184 906 2.92 800 Beckley Mining 13 20.7 2411 1705 1035 732 2.33 800 Beckley Mining 13 23.3 2482 1659 844 564 2.94 800

115
Table A-2. Excess horizontal stresses and strains in the Beckley coal field. (Cont.)
Mine Hole Measurement depth, ft
Maximum horizontal stress, psi
Minimum horizontal stress, psi
Maximum1
horizontal strain, micro strain
Minimum1
horizontal strain, micro
strain
Elastic modulus, 106 psi
Site depth, ft
Beckley Mining 13 24.5 2637 1903 1051 758 2.51 800 Beckley Mining 13 25.5 3276 2626 1174 941 2.79 800 Beckley Mining 14 16.3 3831 2185 1104 630 3.47 1040 Beckley Mining 14 17.4 3286 1934 1063 626 3.09 1040 Beckley Mining 14 18.4 3203 1615 953 481 3.36 1040 Beckley Mining 14 22.6 3048 1756 889 512 3.43 1040 Beckley Mining 14 24.2 3754 2023 900 485 4.17 1040 Beckley #1 15 9.5 2967 1625 386 211 7.69 700 Beckley #1 15 10.7 3418 1916 455 255 7.52 700 Beckley #1 15 13.6 1890 973 280 144 6.76 700 Beckley #2 16 12 1724 1319 932 713 1.85 350 Beckley #2 16 13.1 1583 1196 936 706 1.69 350 Beckley #2 16 14.2 1686 1169 1022 708 1.65 350 Beckley #2 16 15.25 1759 1153 1047 686 1.68 350 1The strains are from the maximum and minimum excess horizontal stresses.

116
APPENDIX B Table B-1. Measured and excess horizontal stresses and strains in the central Appalachian region (excluding the Beckley coal field).
Site Measurement depth, ft
Maxi. horizontal stress, psi
Min. horizontal stress, psi
Direction of max. stress
Elastic modulus,106 psi
Depth, ft
Max. strain, micro strain
Min. strain, micro strain
Max. excess stress,
psi
Min. excess stress,
psi
Max. excess strain, micro strain
Min. excess strain, micro strain
Used in general analysis
Pocahontas #4-1 5.8 2800 1800 N 54 °E 3.1 1600 903 581 2219 1219 716 393 No
Pocahontas #4-1 12.9 3300 2400 N 62 °E 3.59 1600 919 669 2719 1819 757 507 Yes
Pocahontas #4-2 2.3 3100 900 N 67 °E 3.8 1250 816 237 2646 446 696 117 No
Pocahontas #4-2 3.8 2400 1300 N 78 °E 2.52 1250 952 516 1946 846 772 336 No
Pocahontas #4-2 5.2 3000 1700 N 71 °E 3.23 1250 929 526 2546 1246 788 386 No
Pocahontas #4-2 6.6 2600 1400 N 67 °E 3.59 1250 724 390 2146 946 598 264 No
Pocahontas #4-2 8 3000 1900 N 64 °E 4.01 1250 748 474 2546 1446 635 361 Yes
Pocahontas #4-2 11.8 2200 1100 N 29 °W 2.48 1250 887 444 1746 646 704 260 Yes
Eagle Seam 8.9 1781 1541 N 40 °E 2.99 900 596 515 1454 1214 486 406 Yes Eagle Seam 9.9 1832 1440 N 56 °E 2.82 900 650 511 1505 1113 534 395 Yes Eagle Seam 10.9 1678 1109 N 47 °E 3.03 900 554 366 1351 782 446 258 Yes Elkhorn #3 13.7-23.4 2269 1822 N 56 °E 5.24 550 433 348 2069 1622 395 310 Yes

117
APPENDIX C
Table C-1. Measured and excess horizontal stresses and strains in the northern Appalachian region.
Site Measurement depth, ft
Maxi. horizontal stress, psi
Min. horizontal stress, psi
Max. excess stress,
psi
Min. excess stress,
psi
Max. horizontal
strain, micro strain
Min. horizontal
strain, micro strain
Min. excess strain, micro strain
Min. excess strain, micro strain
Elastic modulus,106 psi
Depth, ft
Tanoma, PA-Kittanning Seam 16.1 3335 2787 3074 2526 575 481 530 436 5.8 720
Phillippi, WV-Kittanning Seam 15.3 4279 2861 4079 2661 718 480 684 446 5.96 550
Phillippi, WV-Kittanning Seam 18.3 1664 1344 1464 1144 633 511 557 435 2.63 550
Phillippi, WV-Kittanning Seam 18.7 1316 1151 1116 951 823 719 698 594 1.6 550
Phillippi, WV-Kittanning Seam 23.1 4959 3525 4759 3325 714 507 685 478 6.95 550
Loyalhanna Formation, PA 10-12 6910 3975 6765 3830 617 355 604 342 11.2 400
Columbus Limestone, OH - 5500 4000 4665 3165 611 444 518 352 9 2300
Pittsburgh Seam Site 1 13-20 1324 1024 1179 879 736 569 655 488 1.8 400 Pittsburgh Seam Site 2 11 2400 2190 2146 1936 588 537 526 475 4.08 700 Pittsburgh Seam Site 2 13 2480 2260 2226 2006 525 479 472 425 4.72 700 Pittsburgh Seam Site 3 17 4210 2540 3920 2250 543 327 505 290 7.76 800 Pittsburgh Seam Site 3 18.5 3590 2340 3300 2050 418 273 385 239 8.58 800 Pittsburgh Seam Site 3 19.8 2790 2110 2500 1820 421 319 378 275 6.62 800 Average - - - - 609 462 554 406 - - 1Strains from the maximum or minimum horizontal stress component.

118
APPENDIX D
Table D-1. Measured and excess horizontal stresses and strains in the Illinois Basin and eastern Mid-Continent region.
Hole Measurement depth, ft
Maxi. horizontal stress, psi
Min. horizontal stress, psi
Direction of max. stress
Elastic modulus, 106 psi
Max. strain, micro strain
Min. strain, micro strain
Depth,ft
Max. excess
stress, psi
Min. excess
stress, psi
Max. excess strain, micro strain
Min. excess strain, micro strain
Used in general analysis
Wabash Mine, IL, Springfield #5 Seam 1 10.7 1134 965 N 44 °E 3.15 360 306 970 782 613 248 195 Yes 1 12.1 1313 867 N 79 °W 3.37 390 257 970 961 515 285 153 Yes 1 13.5 1362 1030 N 89 °E 2.96 460 348 970 1010 678 341 229 Yes 1 16.5 1274 888 N 88 °W 2.97 429 299 970 922 536 310 180 Yes 2 8.4 1533 949 N 89 °E 3.39 452 280 850 1224 640 361 189 No 2 9.9 1606 981 N 81 °E 3.13 513 313 850 1297 672 415 215 Yes 2 14.1 1423 768 N 76 °E 2.94 484 261 850 1114 459 379 156 Yes 2 15.8 1263 735 N 84 °E 2.63 480 279 850 954 426 363 162 Yes 3 7.2 1451 670 N 82 °W 3.33 436 201 860 1139 358 342 107 No 3 8.4 1599 572 N 89 °W 2.94 544 195 860 1287 260 438 88 No 3 9.9 1405 589 N 72 °W 2.82 498 209 860 1093 277 388 98 Yes 3 13.1 1493 559 N 69 °W 2.78 537 201 860 1181 247 425 89 Yes 3 14.4 1356 540 N 77 °W 2.82 481 191 860 1044 228 370 81 Yes 3 15.9 1606 643 N 81 °W 2.99 537 215 860 1294 331 433 111 Yes
Monterey Mine, IL, Springfield#5 Seam 1 4.33 2277 707 N 59 °E 7.83 291 90 290 2172 602 277 77 No 1 6.33 905 238 N 66 °E 2.47 366 96 290 800 133 324 54 No 1 9.4 1148 728 N 69 °E 1.9 604 383 290 1043 623 549 328 Yes 1 11.8 636 410 N 55 °E 1.44 442 285 290 531 305 369 212 Yes
Galatia Mine, IL, Springfield #5 Seam 1 6 1448 388 N 78 °E 2.9 499 134 570 1241 181 428 62 No 1 10.1 1980 586 N 72 °E 3.17 625 185 570 1773 379 559 120 Yes 1 11.6 1674 467 N 77 °E 2.91 575 160 570 1467 260 504 89 Yes

119
Table D-1. Measured and excess horizontal stresses and strains in the Illinois Basin and eastern Mid-Continent region. (Cont.)
Hole Measurement depth, ft
Maxi. horizontal stress, psi
Min. horizontal stress, psi
Direction of max. stress
Elastic modulus,106 psi
Max. strain, micro strain
Min. strain, micro strain
Depth,ft
Max. excess
stress, psi
Min. excess
stress, psi
Max. excess strain, micro strain
Min. excess strain, micro strain
Used in general analysis
1 13.1 1654 533 N 71 °E 2.81 589 190 570 1447 326 515 116 Yes Turris Mine, IL, Springfield #5 Seam
1 6.1 2208 1122 N 38 °E 9.05 244 124 275 2108 1022 233 113 No 2 5.8 1846 814 N 61 °E 8.08 228 101 275 1746 714 216 88 No
Peabody # 10, Il, Herrin #6 Seam 1 3 1293 409 N 39 °E 5.52 234 74 360 1162 278 211 50 No 1 4 1582 -24 N 52 °E 9 176 -3 360 1451 -155 161 -17 No 1 5 2490 46 N 65 °E 5.46 456 8 360 2359 -85 432 -16 No 1 6 2435 -458 N 66 °E 6.62 368 -69 360 2304 -589 348 -89 No 1 7 3588 371 N 67 °E 7.37 487 50 360 3457 240 469 33 No 1 8 2519 -85 N 65 °E 5.64 447 -15 360 2388 -216 423 -38 No 1 9 1227 1041 East West 1.56 787 667 360 1096 910 703 584 Yes 1 10 835 518 N 79 °E 1.28 652 405 360 704 387 550 303 Yes 1 11 3379 749 N 67 °E 5.7 593 131 360 3248 618 570 108 Yes
Peabody # 2, KY , Springfield #5 Seam 1 3.5 1146 994 N 16 °E 2 573 497 300 1037 885 519 443 No 1 4.92 1251 1167 N 40 °E 2.4 521 486 300 1142 1058 476 441 No 1 6.67 1613 1575 N 82 °E 3 538 525 300 1504 1466 501 489 No 1 21 969 896 N 81 °E 2.2 440 407 300 860 787 391 358 Yes
Ft. Campbell Limestone, Campbell County, KY NA NA 3784 1320 N 78 °E 9.32 406 142 730 3519 1055 360 43 Yes
Immel Mine, TN 3 8.8 4609 1980 N 65 °E 10.75 429 184 925 4273 1644 405 161 Yes 3 14.2 4203 818 N 59 °E 11.36 370 72 925 3867 482 348 50 Yes 4 13.7 2354 1518 N 65 °E 7.28 323 208 925 2018 1182 288 174 Yes

120
Table D-1. Measured and excess horizontal stresses and strains in the Illinois Basin and eastern Mid-Continent region. (Cont.)
Hole Measurement depth, ft
Maxi. horizontal stress, psi
Min. horizontal stress, psi
Direction of max. stress
Elastic modulus, 106 psi
Max. strain, micro strain
Min. strain, micro strain
Depth,ft
Max. excess
stress, psi
Min. excess
stress, psi
Max. excess strain, micro strain
Min. excess strain, micro strain
Used in general analysis
4 15.7 3647 1543 N 42 °E 4.64 786 333 925 3311 1207 731 278 Yes 4 16.7 3248 825 N 67 °E 11.94 272 69 925 2912 489 251 48 Yes 4 18.7 3352 720 N 58 °E 7.3 459 99 925 3016 384 424 64 Yes 4 19.7 2805 1469 N 70 °E 5.58 502 263 925 2469 1133 457 218 Yes 4 20.8 2503 996 N 71 °E 4.86 515 205 925 2167 660 463 153 Yes
North River, AL, Pratt Seam 1 7.25 2404 404 N 54 °E 5.91 407 68 500 2223 223 376 38 Yes 1 8.4 2050 391 N 58 °E 5.11 401 77 500 1869 210 366 41 Yes 1 9.4 1849 117 N 54 °E 5.4 342 22 500 1668 -65 309 -12 Yes 1 11.25 2163 261 N 63 °E 5.26 411 50 500 1982 80 377 15 Yes 2 6.5 647 306 N 69 °E 4.38 148 70 470 476 135 109 31 No 2 7.6 1032 485 N 71 °E 5.12 202 95 470 861 314 168 61 No 2 8.6 1015 197 N 69 °E 4.59 221 43 470 844 26 184 6 No 2 9.6 1081 469 N 66 °E 4.45 243 105 470 910 298 205 67 No
Jim Walters #7, AL, Blue Creek/Mary Lee Seam NA NA 3050 1520 N 71 °E 5.4 565 281 1870 2364 834 439 156 Yes
1Strains from the maximum or minimum stress component.