Analysis of the US Sugar Program · PDF file3 Analysis of the US Sugar Program John C. Beghin...
20
AGRICULTURAL POLICY IN DISARRAY REFORMING THE FARM BILL AMERICAN ENTERPRISE INSTITUTE Analysis of the US Sugar Program John C. Beghin and Amani Elobeid NOVEMBER 2017
Transcript of Analysis of the US Sugar Program · PDF file3 Analysis of the US Sugar Program John C. Beghin...

AGRICULTURAL POLICY IN DISARRAYREFORMING THE FARM BILL
A M E R I C A N E N T E R P R I S E I N S T I T U T E
Analysis of the US Sugar Program
John C. Beghin and Amani Elobeid
NOVEMBER 2017

1
Executive Summary
We review the key features of the US sugar pro-gram and its welfare, trade, and world price
implications. The sugar program is a protectionist pol-icy, which increases the domestic price of sugar above the corresponding world price. It restricts imports of raw and refined sugar, depresses world sugar prices, and substantially changes the mix of sweeteners used in processed food. Domestic markets are distorted, sugar users are effectively taxed by the program, and sugar producers are subsidized by it.
The welfare transfer to sugar growers and proces-sors is quite large in the aggregate, hovering around $1.2 billion. Losses to households are diffused, about
$10 per person per year but large for the popula-tion as a whole, in the range of $2.4–$4 billion. Net welfare losses are smaller and are in the order of $0.5–$1 billion. Gains to producers are concentrated in a few hands, especially in the cane sugar industry. Labor effects from lost activity in food industries are between 17,000 and 20,000 jobs annually. The sugar program distorts trade in sugar-intensive imports, which increase to abate the high cost of sugar. The North Atlantic Free Trade Agreement has created additional entanglements as US sugar interests have recently pushed the US government to impose trade management practices on sugar imports from Mexico.


3
Analysis of the US Sugar Program
John C. Beghin and Amani Elobeid
The US sugar program is a protectionist scheme destined to transfer income to sugar growers and
processors at the cost of sugar users and consumers. The program’s nature has changed little over time, and it works by reducing the flow of sugar imports to the United States. Its existence had been threatened under the North American Free Trade Agreement (NAFTA) because of increasing imports from Mex-ico, but a recent bilateral US-Mexico agreement has removed this threat. The entrenched US sugar lobby has been effective at blocking any meaningful reform and removing threats from preferential agreements with other sugar-producing nations. Sugar interests are concentrated, whereas losses born by most con-sumers and users are more diffuse and small at the individual level. Yet collectively, the losses to consum-ers and users are large in aggregate for the country, in the order of $2.4–$4 billion. The US sugar program should be repealed.
In the following sections, we provide some back-ground and review of the US sugar program’s history; its key features; its impact on producers, consum-ers, and users; its cost to society; and its impact on trade and world prices. We also devote some atten-tion to recent market and policy developments under NAFTA. Policy implications are drawn.
Background
The United States is one of the largest sugar produc-ers in the world, surpassed only by Brazil, China, the European Union, India, and Thailand. In 2014–15, the
United States produced almost 7.9 million metric tons raw value (mtrv) of sugar and is estimated to produce 8.2 million mtrv in 2015–16.1 This accounts for 4.4 per-cent of world sugar production in 2015 and 4.9 per-cent in 2016. Table A1 provides detailed production, use, and trade information for the US sugar market.
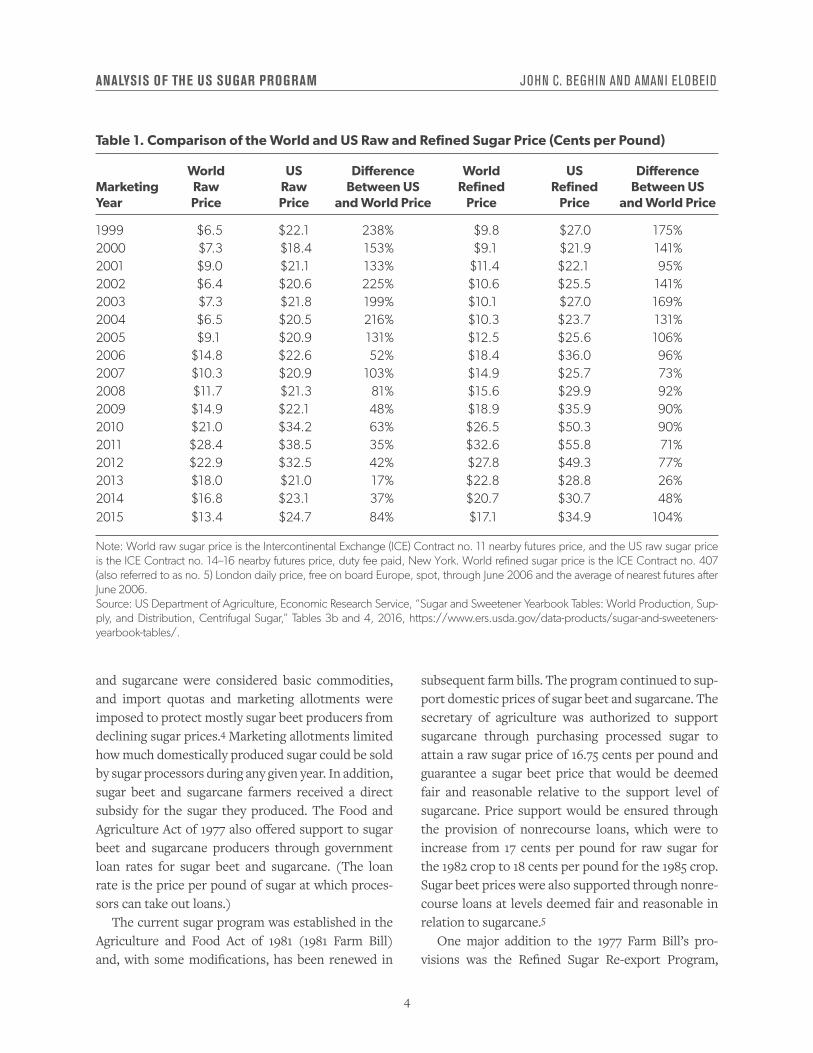
Sugar producers and processors in the United States benefit from government support in the form of price support loans, domestic marketing allot-ments, tariff-rate quotas (TRQs),2 and the diversion of excess sugar-to-ethanol production. The sugar pol-icy is part of the US farm bill and is administered by the US Department of Agriculture (USDA) ideally at no budgetary cost to the federal government, when possible, by avoiding loan forfeitures.3 Through the sugar program, sugar producers and sugar processors have enjoyed domestic raw sugar prices well above the world sugar prices, varying from 238 percent over the world price in 1999 to 17 percent over the world price in 2013 (see Table 1).
Brief History of the US Sugar Policy
The US sugar industry has enjoyed trade protec-tions since 1789 when the first import tariff against foreign-produced sugar was imposed to generate gov-ernment revenue. In 1842, protection was expanded to promote domestic sugar production and restrict trade. Since then, the US government has continued to provide support and protection for the domestic sugar industry. Under the Sugar Act of 1934, which as amended remained in force until 1974, sugar beets
4
ANALYSIS OF THE US SUGAR PROGRAM JOHN C. BEGHIN AND AMANI ELOBEID
and sugarcane were considered basic commodities, and import quotas and marketing allotments were imposed to protect mostly sugar beet producers from declining sugar prices.4 Marketing allotments limited how much domestically produced sugar could be sold by sugar processors during any given year. In addition, sugar beet and sugarcane farmers received a direct subsidy for the sugar they produced. The Food and Agriculture Act of 1977 also offered support to sugar beet and sugarcane producers through government loan rates for sugar beet and sugarcane. (The loan rate is the price per pound of sugar at which proces-sors can take out loans.)
The current sugar program was established in the Agriculture and Food Act of 1981 (1981 Farm Bill) and, with some modifications, has been renewed in
subsequent farm bills. The program continued to sup-port domestic prices of sugar beet and sugarcane. The secretary of agriculture was authorized to support sugarcane through purchasing processed sugar to attain a raw sugar price of 16.75 cents per pound and guarantee a sugar beet price that would be deemed fair and reasonable relative to the support level of sugarcane. Price support would be ensured through the provision of nonrecourse loans, which were to increase from 17 cents per pound for raw sugar for the 1982 crop to 18 cents per pound for the 1985 crop. Sugar beet prices were also supported through nonre-course loans at levels deemed fair and reasonable in relation to sugarcane.5
One major addition to the 1977 Farm Bill’s pro-visions was the Refined Sugar Re-export Program,
Table 1. Comparison of the World and US Raw and Refined Sugar Price (Cents per Pound)
World US Difference World US Difference Marketing Raw Raw Between US Refined Refined Between US Year Price Price and World Price Price Price and World Price
1999 $6.5 $22.1 238% $9.8 $27.0 175%2000 $7.3 $18.4 153% $9.1 $21.9 141%2001 $9.0 $21.1 133% $11.4 $22.1 95%2002 $6.4 $20.6 225% $10.6 $25.5 141%2003 $7.3 $21.8 199% $10.1 $27.0 169%2004 $6.5 $20.5 216% $10.3 $23.7 131%2005 $9.1 $20.9 131% $12.5 $25.6 106%2006 $14.8 $22.6 52% $18.4 $36.0 96%2007 $10.3 $20.9 103% $14.9 $25.7 73%2008 $11.7 $21.3 81% $15.6 $29.9 92%2009 $14.9 $22.1 48% $18.9 $35.9 90%2010 $21.0 $34.2 63% $26.5 $50.3 90%2011 $28.4 $38.5 35% $32.6 $55.8 71%2012 $22.9 $32.5 42% $27.8 $49.3 77%2013 $18.0 $21.0 17% $22.8 $28.8 26%2014 $16.8 $23.1 37% $20.7 $30.7 48%2015 $13.4 $24.7 84% $17.1 $34.9 104%
Note: World raw sugar price is the Intercontinental Exchange (ICE) Contract no. 11 nearby futures price, and the US raw sugar price is the ICE Contract no. 14–16 nearby futures price, duty fee paid, New York. World refined sugar price is the ICE Contract no. 407 (also referred to as no. 5) London daily price, free on board Europe, spot, through June 2006 and the average of nearest futures after June 2006.Source: US Department of Agriculture, Economic Research Service, “Sugar and Sweetener Yearbook Tables: World Production, Sup-ply, and Distribution, Centrifugal Sugar,” Tables 3b and 4, 2016, https://www.ers.usda.gov/data-products/sugar-and-sweeteners- yearbook-tables/.
ANALYSIS OF THE US SUGAR PROGRAM JOHN C. BEGHIN AND AMANI ELOBEID
5
established in 1983. The program allowed sugarcane processors to purchase raw sugar at world prices (duty free) and export a similar amount in 90 days.6 The sugar program was expected to operate at no cost to the federal government by avoiding forfeitures of sugar under the loan program. This was to be accom-plished by sufficiently restricting imports of sugar through import quotas to maintain domestic prices above the loan rates for cane and beet processed sugar.
Import quotas were retained in the 1990 Farm Bill (Food, Agriculture, Conservation, and Trade Act of 1990), which also directed the USDA to estab-lish marketing allotments on domestically produced sugar beet and sugarcane that would raise sugar imports if the amount of imported sugar was less than 1.25 million short tons raw value (strv). The secretary of agriculture had the authority to allocate marketing allotments between sugar derived from sugar beets and sugarcane and adjust or suspend those allotments depending on market conditions.7
Nonrecourse loans and import restrictions (TRQs) continued under the 2002 Farm Bill (Farm Secu-rity and Rural Investment Act of 2002). Marketing allotments, which had not been used between 1996 and 2002, were to be imposed when imports were projected to be below 1.531 million short tons. An inventory management authority allowed the secre-tary of agriculture to establish marketing allotments to balance markets, avoid forfeitures, and comply with World Trade Organization (WTO) and NAFTA import commitments.
In addition, a sugar payment-in-kind program permitted sugar beet and sugarcane producers and processors to reduce crop production in exchange for sugar in the USDA’s Commodity Credit Corpora-tion (CCC) inventory. Under the program, produc-ers could offer bids for the amount of sugar the CCC held that producers would obtain in exchange for a given reduction in harvesting planted acres. Further, under the 2002 Farm Bill, marketing assessments on all processed sugar and forfeiture penalties on sugar beet and sugarcane processors were terminated, and the interest rate on CCC sugar loans was reduced.8
The Food, Conservation, and Energy Act of 20089 required the USDA to manage the US domestic supply
of sugar and sugar imports to keep market prices above the loan rates for cane and beet sugar. The bill also introduced a sugar-for-ethanol program, which authorizes the USDA to purchase excess US sugar resulting from increased imports coming in from Mexico through NAFTA and other countries through free trade agreements. The surplus sugar is then sold to US bioenergy producers to process into ethanol.
Minimum guaranteed prices for raw sugar and refined beet sugar were also increased in 2008. The program also mandated that the overall allot-ment quantity (OAQ) be set at not less than 85 per-cent of estimated US human sugar consumption for food.10 However, this provision has not always been met, with the OAQ falling below 85 percent in many years. An additional provision allowed the USDA to increase WTO quotas for sugar beyond the minimum level if there is a shortage of sugar because of adverse weather or war.
Key Elements of the Current Sugar Program
The Agricultural Act of 2014, the current farm bill,11 retains most of the previous 2008 Farm Bill’s provi-sions relating to the protection of US sugar through mechanisms that guarantee minimum domestic prices for sugarcane and sugar beet producers and processors. In terms of price support, during the 2014–18 fiscal years, domestic sugarcane and sugar beet processors can obtain nonrecourse loans at set loan-rate levels using sugar as collateral, which can be repaid with interest after the processors sell the sugar. The loans are available at the beginning of each fiscal year (October). The processors must repay the nine-month loan by the end of the fiscal year (Sep-tember 30 of the following calendar year). To obtain the loan, the sugar must come from domestically grown sugar beets or sugarcane, grown in compliance with “cross compliance” highly erodible land and wet-lands regulations.
Processors must pay sugarcane and sugar beet farm-ers an amount proportional to the loan received by the processors. The processors can sell the sugar and repay the loan if market prices exceed the loan rate.
6
ANALYSIS OF THE US SUGAR PROGRAM JOHN C. BEGHIN AND AMANI ELOBEID
Alternatively, a processor has the choice of forfeiting the sugar under loan to the USDA’s CCC. The CCC is then responsible for disposing the forfeited sugar, which counts against the processor’s marketing allot-ments made in the year of the loan. The loan rate for raw cane sugar is 18.75 cents per pound, and the loan rate for refined beet sugar is 24.09 cents per pound.12
The sugar program distorts trade in sugar- intensive imports, which increase to abate the high cost of sugar at home.
For each marketing year, the USDA determines the amount of domestically produced sugar from sugar beets and sugarcane that each processor is allowed to sell through sugar marketing allotments, which are adjusted based on harvest conditions. However, the production and processing of sugarcane and sugar beet are not restricted. The OAQ is set with the goal of avoiding forfeitures of sugar to the CCC by restrict-ing total supply so that the volume of domestic plus imported sugar does not reduce prices below the loan forfeiture levels for both raw cane sugar and refined beet sugar. The OAQ is split between cane sugar and beet sugar with the cane sugar allotment fulfilling 45.65 percent and the beet sugar allotment fulfilling 54.35 percent of the OAQ. The program also allocates the allotment among states and among processors in each state.
As in the 2008 Farm Bill, the OAQ is set at 85 per-cent of projected US human sugar consumption for food. A deficit resulting from a processor being unable to meet its allotment can be offset by reassigning the OAQ to other processors in that state, to other states by using CCC inventories, or through imports.13 Sugar produced in excess of a processor’s allotment must be stored at the processor’s expense until it is
given permission to sell the sugar in the future. Excess sugar can also be exported or used by another proces-sor to meet its allocation.14
The USDA also administers the Feedstock Flexibil-ity Program, known as the sugar-to-ethanol program, through which excess sugar is sold to ethanol produc-ers by the CCC to avoid accumulating stocks asso-ciated with sugar loan forfeitures. The CCC sugar is processed into fuel-grade ethanol and other biofuels. Forfeited sugar can also be sold for human food use in the event of an emergency sugar shortage.15 In a con-tinued effort to limit sugar supplies and keep domes-tic prices high, the USDA is authorized to take bids from refiners and sugar brokers for surplus sugar pur-chased by the USDA under loan forfeitures in return for surrendering import rights.16
The sugar program also includes trade protection in the form of TRQs that limit the amount of sugar imported into the United States. Imports under the TRQs have low or zero duty and must meet US WTO quota commitments.17 The USDA establishes the vol-ume of the raw cane sugar TRQs, which is then allo-cated among sugar-exporting countries (currently 40 countries) by the US trade representative. The TRQs are based on each country’s export share during the period 1975–81 when trade was relatively unre-stricted. Annual TRQs may be increased if a short-age is expected. Any imports that exceed a country’s quota are subject to high over-quota tariffs.
The in-quota tariff for sugar is 0.625 cents per pound, and the out-of-quota tariffs are 15.36 cents per pound for raw sugar and 16.21 cents per pound for refined sugar. Imported sugar also enters the US domestic market under various trade agreements, including the Dominican Republic-Central Amer-ican Free Trade Agreement (DR-CAFTA) and free trade bilateral agreements with Colombia, Panama, and Peru.18 Additionally, until December 2014, sugar imports from Mexico were allowed unrestricted, duty-free access into the United States under NAFTA. However, in December 2014, the US and Mexican gov-ernments agreed to limit the quantity of sugar from Mexico and fix the price received for the Mexican sugar imported into the United States. (See below for more details on Mexico and NAFTA.)19

ANALYSIS OF THE US SUGAR PROGRAM JOHN C. BEGHIN AND AMANI ELOBEID
7
Welfare, Trade, and Price Effects of the Sugar Program
The US sugar program has been analyzed and reviewed numerous times, especially in the context of the American Enterprise Institute’s initiatives on US farm bills.20 The typical way to assess the sugar program’s cost is to look at the welfare consequences and gains from removing the program.21 The removal includes opening trade to sugar imports and remov-ing impediments, price support, and interventions in domestic supply.
The sugar program has been costly to consumers and users of sugar. Table 2 summarizes estimates of the welfare effects of the sugar program from some investigation of the program. Fully removing the program would dramatically reduce domestic prices of sugar and induce substantial gains to sugar users (consumers and food processors) in the order of $2.4–$4 billion (2009 dollars).22 The lion’s share of these gains come from ending transfers to the US sugar industry and subsequent gains in efficiency from the reduced misallocation of resources the sugar pro-gram imposes on consumers and food processors. Net welfare gains would be smaller, in the order of $1.2 bil-lion (ranging between $0.437 and $2.565 billion), as transfers to the US sugar industry are an important part of the consumer loss.
Some moderate net employment effects (an increase of 17,000 to 20,000 jobs) would ensue in US food processing sectors that are sugar intensive. Some moderate adverse employment effects occur in the sugar-crop and sugar-processing industries. These are much smaller than the increase in employment in food processing sectors. The net employment gains would occur because imports of sugar-containing products would decline substantially if free trade in sugar itself were permitted. Such processed product imports would no longer compete with domestically produced sugar-intensive processed foods. Hence the sugar program distorts trade in sugar-intensive imports, which increase to abate the high cost of sugar at home. Imports of raw sugar would expand, resulting in a modest increase in world prices of raw and refined sugar.
The sugar program has substantially affected international trade of sugar. Recent estimates indi-cate that US imports of sugar would increase by a range of 1.6–2.7 million metric tons (mmt).23 The US sugar program is also estimated to have depressed world sugar prices by constraining imports of raw and refined sugar through the complex TRQ system. This effect has penalized sugar (cane) exporters and lowered the cost of imports for other net import-ers of sugar. However, estimated effects on world prices have been relatively moderate in the order of 1–2 cents per pound (c/lb).24
Alternative Sugar Program Reforms
Short of full termination of the sugar program, less extensive reforms have been proposed.25 These pro-posals evaluate the potential welfare impacts of transforming the sugar program into a conventional commodity program, similar to those provided for commodities such as corn and wheat. This change would be costly for taxpayers, and welfare gains to consumers are moderate.
The study by David Abler et al.26 replaces the exist-ing US sugar program with what the authors describe as a “standard” program similar to the program already in place for other US crops. The new pro-gram would reduce the loan rates for sugar beet and sugarcane and include a fixed direct payment paid to producers (paid at the time). It is important to note that fixed payments are no longer available to farmers for any commodity under the current farm bill. The authors look at two scenarios, one with low (mod-erate) imports from Mexico and the other with sig-nificantly higher imports from Mexico. Under both scenarios domestic US prices fall and US sugar pro-duction increases because of the direct payments, which are assumed not to be fully decoupled in pro-duction decisions in the Abler et al. analysis.27 US sugar consumption increases in response to the lower prices. Direct payments, which average $463 million, increase the total cost of the sugar program under the low-import scenario.28 In addition to direct payments, small loan deficiency payments and countercyclical

8
ANALYSIS OF THE US SUGAR PROGRAM JOHN C. BEGHIN AND AMANI ELOBEID
payments are a negligible addition to the cost under the high-import scenario.
In terms of welfare implications, deadweight losses are small.29 Crop producers and sweetener users gain while sweetener processors and taxpayers lose. The surplus of beet and cane growers increases by $158 million and $122 million, respectively, while beet-refining and cane-processing profits decline by $106 million and $28 million, respectively, in the low-import scenario compared to the baseline.30 High fructose corn syrup (HFCS) processors also lose. The added cost to taxpayers of the change to a regular program totals $471 million in the low-import scenario (from a baseline cost of $229 million) and $362 million in the high-import scenario relative to
the baseline cost of $408 million. The analysis also concludes that a “standard” program would allow for easier accommodations of trade liberalization either to meet WTO commitments or through bilateral or multilateral trade agreements.
The cost of a buyout for sugar beet and cane grow-ers and processors, as estimated by David Orden,31 is relatively expensive as compared to the other two buyouts for tobacco and peanuts. Orden provides estimates in the range of $2–$3 billion annually for a 10-year period and corresponding to 25 years of lost protection of $1.1–$1.7 billion. Even partial buyouts to retire the most inefficient segments of the US sugar industry, as estimated by Stephen Haley, Owen Wag-ner, and Orden, are quite expensive.32
Table 2. Welfare Effects of the Sugar Program (All in 2009 Billion Dollars)
Study
Modeling Approach
Gains to Users
Losses to Producers
Net Welfare Gains
John Beghin and Amani Elobeid (2015)*
Calibrated model of sugar- intensive industries coupled with FAPRI models, modeling of sugar-containing product imports*****
$3.13 to $4.036
–$2.637 to –$3.512*
$0.437 to $0.642*
US Government Accountability Office (2000) and John Beghin et al. (2003)**
Calibrated model with sugar- intensive industries and FAPRI models
$2.562 –$1.383 $1.179
Gwo-Jiun Leu, Andrew Schmitz, and Ronald Knutson (1987)***
Partial equilibrium model $3.810 –$1.245 $2.565
Michael Wohlgenant (2011)**** Econometric model and partial equilibrium model
$2.441 –$1.433 $1.008
Notes: *Original figures updated to 2009 dollars. Sugar producer welfare changes are in terms of gross margin changes. They overstate the loss of profit of the sugar industry and understate net welfare gains. **Original numbers in 1999 dollars updated to 2009 dollars. ***Updated figures to 2009 dollars. ****Computation of losses and gains does not account for loss in tariff revenues. *****FAPRI is the Food and Agricultural Policy Research Institute at Iowa State University.Source: John C. Beghin and Amani Elobeid, “The Impact of the U.S. Sugar Program Redux,” Applied Economic Perspectives and Pol-icy 37, no. 1 (March 2015): 1–33, https://academic.oup.com/aepp/article-abstract/37/1/1/2731967/The-Impact-of-the-U-S-Sugar- Program-Redux1?redirectedFrom=fulltext; US Government Accountability Office, “Sugar Program: Supporting Sugar Prices Has Increased Users’ Cost While Benefiting Producers,” June 9, 2000, http://www.gao.gov/products/RCED-00-126; John C. Beghin et al., “The Cost of the U.S. Sugar Program Revisited,” Contemporary Economic Policy 21 (2003): 106–16; Gwo-Jiun M. Leu, Andrew Schmitz, and Ronald D. Knutson, “Gains and Losses of Sugar Program Policy Options,” American Journal of Agricultural Economics 69 (August 1987): 591–602; and Michael K. Wohlgenant, Sweets for the Sweet: The Costly Benefits of the US Sugar Program, American Enterprise Institute, July 12, 2011, http://www.aei.org/publication/sweets-for-the-sweet-the-costly-benefits-of-the-us-sugar-program/.

ANALYSIS OF THE US SUGAR PROGRAM JOHN C. BEGHIN AND AMANI ELOBEID
9
The Mexico-NAFTA Interface with the Sugar Program
Although the protectionist nature of the sugar pro-gram has remained unchanged, changes in its environ-ment have led to new and interesting developments. In particular, NAFTA and sweetener trade with Mex-ico have been controversial and somewhat disruptive to the US sugar industry despite the slow and pro-gressive nature of the reforms in these sectors. This section devotes special attention to NAFTA and its implications for the US sugar industry.
NAFTA was implemented in January 1994. The implementation of the NAFTA sugar provisions was gradual and allowed for a 14-year adjustment period before sugar imports from Mexico would be free of tariffs and quantitative restrictions. After 2008, imports from Mexico increased quite rapidly in part because of ample Mexican sugar supplies, high prices in the US market following a worldwide short crop, and a progressive substitution of HFCS for sugar in Mexican food processing, which reduced domestic use of sugar.33 These conditions led to forfeitures in the US market in the 2012–13 crop year and led to the US sugar industry petitioning the US Trade Commis-sion and US Department of Commerce to investigate alleged dumping by Mexico.34
The impact on the US sugar industry of free trade in sugar under NAFTA has been analyzed by Abler et al.; Gary Brester; Haley, Wagner, and Orden; Knutson, Westhoff, and Pablo Sherwell; and more recently, in an ex post fashion, after full implementation by Karen Lewis and Troy Schmitz and Lewis.35 The analyses of Brester; Haley, Wagner, and Orden; and Schmitz and Lewis identify the pro-competitive effects of NAFTA on the US sugar market.36 Knutson, Westhoff, and Sherwell did not consider this issue.37
Brester38 examines the pro-competitive effects of NAFTA on the US sugar market and how these effects have compromised the sugar program before the recent US-Mexico agreements to manage sugar trade. The impacts occur through increasing sup-ply in the US market and depressing prices below sugar loan rates, especially when world prices are low (lower than loan rates), inducing higher TRQ fill rates
because the US market appears attractive relative to other export markets.
The provision of “no cost” to taxpayers is com-promised when forfeitures take place in this situa-tion. The USDA has to sell forfeited sugar at a loss to ethanol plants. Brester concludes that the US sugar industry will have to reduce output by 5–10 percent to remain within it imports commitments and meet the no-cost provision.39 Brester did not consider the consequences of the two suspension agreements (dis-cussed in the next section) being negotiated at the time and eventually adopted.40
Since 2013, NAFTA has had important effects on the US domestic sugar market and domestic sugar prices as Schmitz and Lewis show.41 According to the authors, under NAFTA, sugar imports from Mex-ico undermine the sugar program in its current form by driving sugar prices below their loan rates and leading to loan forfeitures by sugar processors. As a result, in FY2014, the USDA had to sell sugar-to- ethanol processors at a net loss to the federal govern-ment. Net government outlays for the sugar program reached $259 million.42 Schmitz and Lewis’ assess-ment abstracts from the effects of the recent agree-ments between the United States and Mexico to limit Mexico’s exports of sugar to the United States, under the United States’ threat to implement countervail-ing (CVD) and antidumping (AD) punitive duties if ever the suspension agreements are removed.43 Wel-fare gains arising from the full implementation of the NAFTA sugar agreement in sugar markets are poten-tially substantial.
Schmitz and Lewis argue that sugar users bene-fit substantially from NAFTA based on a counterfac-tual in which the TRQ constraining Mexican sugar exports is binding at 250,000 mtrv—that is, its pre-2008 constrained maximum level.44 US consum-ers and sugar users gain $1.7 billion (2008–13 average of consumer surplus45 gains) under price-inelastic (less responsiveness of demand to price) market assumptions and $0.6 billion under the assumption that the demand for sugar by US consumers is more responsive to price. Net welfare gains are $362 mil-lion, on average, for the same period (price-inelastic case) and $168 million (higher price response case).
10
ANALYSIS OF THE US SUGAR PROGRAM JOHN C. BEGHIN AND AMANI ELOBEID
Over the same period, annual producer losses are estimated to average $1.338 billion (if demand is price insensitive) and $474 million (if demand is more price responsive).
However, trade diversion46 is substantially in favor of Mexican exporters and at the cost of lower-cost exporters. Mexican sugar exports have benefited from the bilateral trade opening even though they are rel-atively high cost. The Mexican sugar industry is also distorted and subsidized but to a lesser extent than its US counterpart.47 The Organisation for Economic Co-operation and Development reports a 2011–15 average protection ratio of 1.60 and 1.19 for US and Mexican sugar, respectively. A ratio of one indicates no distortion. The US and Mexican ratios indicate implicit tariff equivalents of 60 percent and 19 per-cent in the two countries, respectively. The trade diversion in sugar under NAFTA has been at the cost of low-cost sugar exporters such as Brazil and Thai-land. The latter countries are constrained by histori-cal allocations of TRQs (export volume).
Welfare gains arising from the full implementation of the NAFTA sugar agreement in sugar markets are potentially substantial.
Beyond diverting trade from lower- to higher-cost sources of imports, there is a key difference between the pro-competitive effects of NAFTA on the US sugar market and those obtained under full liberal-ization. US-Mexico bilateral trade is subject to more shocks than US trade with the rest of the world. The latter is deeper and less volatile. As shown in Schmitz and Lewis,48 NAFTA’s pro-competitive effects are highly variable from one year to the next because they
depend on US and Mexican local market conditions and world market conditions.
Other preferential trade agreements (US-Australia, DR-CAFTA, and US-Colombia Trade Promotion Agreement, among others) would have the potential to be comparably disruptive but were mollified by the effective US sugar lobby and have not had the negative effects that NAFTA has had on the US sugar market. These other preferential trade agreements included limited expansions of US sugar imports under tight TRQs. Similarly, the Trans-Pacific Part-nership negotiations have mostly spared the US sugar industry from further competitive pressures.49 The stalled Transatlantic Trade and Investment Partnership (TTIP) negotiations would, if success-ful, lead to further pressure on the US sugar indus-try. TTIP has the potential to compromise the US sugar industry as the EU sugar industry has emerged from a deep restructuration with renewed produc-tivity and lower-cost structure than its US coun-terpart.50 The stalled negotiations have muted this potential disruption for now.
Suspension Agreements. Mexican sugar exports to the United States have been so extensive that the US sugar lobby pushed for and obtained trade restric-tion on sugar imports sourced from Mexico. They did so via two agreements signed in December 2014 (the Countervailing Duty Investigation Suspension Agree-ment and the Antidumping Investigation Suspension Agreement). These agreements put in place a policy program equivalent to an export restraint program combined with a minimum export price floor to min-imize the displacement of US sugar production by Mexican imports. These constraints on sugar exports from Mexico to the United States compromise the rationalization effects of NAFTA and prevent the lowering of the cost of sugar for US sweetener users. These two agreements induce welfare losses in the United States for sugar users compared to the 2008–14 period.
The Key Elements of the CVD and AD Suspension Agree-ments. The provisions of the sugar program remain in place (allotments, trade barriers, TRQs, and

ANALYSIS OF THE US SUGAR PROGRAM JOHN C. BEGHIN AND AMANI ELOBEID
11
nonrecourse loan deficiency payments). The suspen-sion agreements suspend CVD and AD duties that the US government would have imposed on Mexican sugar exports entering the US market.
Following legal challenges to the suspension agreements by the US raw sugar refiners, a CVD and AD investigation was completed. The final determinations concluded that the US industry had been materially injured and large CVD and AD duties were established. The CVD and AD duties would be imposed without the suspension agree-ment, and their values would match these implicit dumping and subsidy rates. Hence, they would be nearly prohibitive or at least would have substantial adverse effects on Mexican exports to the United States (i.e., no or almost no sugar imports would be sourced from Mexico). The CVD and AD duties are explained below.
First, the CVD agreement is a comprehensive export restraint agreement51 with an annual export limit based on an estimate of US sugar needs that the USDA determines. The maximum export level is set equal to 100 percent of US annual needs as estimated by the USDA and takes into account expected use, production, and imports under existing TRQs. The formula is:
Maximum Export Level = (Total use x 1.135) – Beginning Stocks – Production – TRQ Imports – Other Program Imports – (“Other High Tier” + “Other”)
The CVD agreement as amended in June 2017 also spreads these exports to the United States over the year and precludes concentration at specific times of the year. It also limits the quantity of refined sugar sourced from Mexico, which can enter the US market at 30 percent of the total exports from Mexico. The maximum purity standard for raw sugar is lowered to reduce the flow of high-quality raw sugar going directly into food processing. Note that historically the USDA has a mixed track record managing the flow of sugar imports and allegedly has induced unneces-sary price increases by restricting imports to ensure that no sugar forfeitures take place under the loan deficiency payment program.52
Second, the AD agreement sets a minimum price level to prevent Mexican exports from landing “too cheaply” in the US market. The minimum prices are set at 28 c/lb for refined sugar, the dry weight, (as amended from 26 c/lb in June 2017), and 23 c/lb for other sugars (as amended from 22.25 c/lb in June 2017). These prices are well above world prices and transfer surplus from sugar buyers to the exporters and US sugar producers by reducing the competi-tion they would face without these two agreements and without punitive CVD and AD taxes. The refer-ence prices constitute a new price floor in US sugar markets.
According to the US Department of Commerce and US International Trade Commission (USITC) find-ings, dumping margins are: Fondo de Empresas Expro-piadas del Sector Azucarero (FEESA), 40.48 percent; Ingenio Tala S.A. de C.V. and certain affiliated compa-nies of Grupo Azucarero Mexico S.A. de C.V. (collec-tively, the GAM Group), 42.14 percent; and all others, 40.74 percent. The USITC determined countervailing subsidy rates as follows: FEESA, 43.93 percent; Ingenio Tala S.A. de C.V. and certain other cross-owned com-panies of Grupo Azucarero Mexico S.A. de C.V. (col-lectively, the GAM Group), 5.78 percent; and all others, 38.11 percent. These final values are shown with their preliminary values in Table 3.
Not surprisingly, sugar users find that the suspen-sion agreements are second-best outcomes preferable to removing them and moving into a world of CVD and AD duties. The latter would increase sugar prices even more by restricting imports from Mexico. The Sweetener Users Association is advocating a reform of the suspension agreements to allow for larger imports of raw sugar from Mexico and alleviating the shortage of raw sugar for coastal sugar refiners.53
The impact of the suspension agreement has been analyzed by Jarret Whistance, Andrick Payen, and Wyatt Thompson54 using the FAPRI-MU models55 and by Wilson Sinclair and Amanda Countryman.56 The former authors consider the impact of the agree-ments relative to two baselines, one without prelim-inary CVD and AD duties and an alternative baseline with these punitive duties in place. In their baseline, prices are maintained above the minimum sugar

12
ANALYSIS OF THE US SUGAR PROGRAM JOHN C. BEGHIN AND AMANI ELOBEID
prices of 26 c/lb. Hence, the price floor under the sus-pension agreement will not be binding in this envi-ronment. Under the suspension agreement, Mexican exports fall sharply and further increase US prices. Effects are small when the baseline does not contain the CVD and AD duties. Using alternative assump-tions, Sinclair and Countryman57 estimate that the agreements increase US sugar prices, translating to an average annual increase in producer surplus of approximately $620 million and decrease in con-sumer surplus of $1.48 billion.
Alternatively, the effects of the suspension agree-ment relative to a baseline with punitive duties are quite large. Sugar exports from Mexico to the United States fall, and US prices increase. In Mexico, the restric-tion on exports to the United States reduces Mexican prices and increases domestic use. The authors also investigate the implications of noncompetitive behav-ior in the Mexican sugar industry and price discrimi-nation between the price-inelastic domestic Mexican market and the more price responsive US export mar-ket. Exports are larger in that context.
With price discrimination, the impact of the sus-pension agreement is also more pronounced since the export restraint is substantially binding in this environment. US prices fall below the loan rate, and forfeitures occur in the early years of the projections (relative to a baseline without CVD and AD duties). Price discrimination incentives offset some of the duties’ trade-restricting impact when the suspension agreements are removed.
Still, according to these authors, the suspension agreements increase prices in the US market by about 1.6 c/lb for raw sugar and 2.2 c/lb for refined sugar (averaged over 10 years) above baseline levels. One can derive a back-of-the-envelope estimate of consumers’ loss from the suspension agreements—change in price x (deliveries + change in deliver-ies/2)—implied by their investigation, which is about $400 million for the scenario assuming no suspen-sion, no CVD or AD tariffs, and strategic pricing by the Mexican sugar industry. The Mexican export expan-sion under this alternative scenario is about 700,000 strv, from a baseline level of 1.8 million strv. Their scenario provides an upper-bound value of the trade effect of the suspension scenarios. The analysis does not explain where the extra sugar goes. (The change in imports exceeds the change in deliveries, and there is no change in production or stocks.)
Steven Zahniser, Getachew Nigatu, and Michael McConnell58 also provide some back-of-the-envelope estimates of the impact of suspension agreements’ quantitative restriction by using the voluntary export restraint formula specified in the agreements. They show that, under recent market conditions (FY2016), the quantitative restrictions have constrained the flow of imports during some periods of the year and are lower than they were before the agreement (not a strict comparison as in Whistance, Payen, and Thomp-son).59 They also show that the minimum reference prices established by the suspension agreements are likely to be binding, especially for raw sugar. They do
Table 3. CVD and AD Duties
Margins in Preliminary and Final Determinations in AD and CVD Cases Concerning Sugar Imports from Mexico
CVD AD
Producer/Exporter Preliminary Final Preliminary Final
Percentage
FEESA 17.01% 43.93% 39.54% 40.48%Grupo GAM 2.99% 5.78% 47.26% 42.14%All Others 14.87% 38.11% 40.76% 40.74%
Source: US Department of Agriculture, Economic Research Service.

ANALYSIS OF THE US SUGAR PROGRAM JOHN C. BEGHIN AND AMANI ELOBEID
13
so by comparing historical import unit values and the reference prices.
The December 2016 World Agricultural Supply and Demand Estimates (WASDE) forecast is that US imports of Mexican sugar will reach 0.972 million strv in 2016–17 under the suspension agreement. Hence, imports in the baseline of Whistance, Payen, and Thompson,60 inclusive of the suspension agreements, appear high relative to the recent historical import levels (1.532 million strv in 2014–15 and 1.309 mil-lion strv in 2015–16). The same remark holds for the latest USDA forecast figures (0.972 million strv). In any case, these levels are much higher than pre-2008 levels when Mexican sugar exports to the United States were constrained by TRQs. In 2007, Mexican exports to the United States were set below 0.250 mil-lion mtrv and actually fell short of that amount (see Table A1 for historical data).
NAFTA definitively has expanded US sugar imports, lowered US domestic prices, and provided some integration of Mexican and US markets. The minimum reference prices the suspension agreements set compromise gains in efficiency and establish price floors above US loan rates (28 c/lb and 23 c/lb mini-mum prices for refined beet sugar and raw cane sugar, respectively, in the suspension agreements, versus 24.09 c/lb and 18.75 c/lb for loan rates of refined beet sugar and raw cane sugar, respectively). The policy developments under the CVD and AD investigations and the suspension agreements are dismaying.
The New Suspension Agreement of June 2017. In practice, the two suspension agreements have led to an increased direct use of unrefined sugar in food pro-cessing, a relative shortage of raw sugar for refiners, and elevated prices for sugar users. The quality of raw sugar imported from Mexico has been refined enough to be used directly for human consumption, when it is delivered in liquid form.
A significant share of raw sugar imports under the suspension agreements have been of high qual-ity and were used directly in US food processing in liquid form. These raw sugar imports have been bypassing US refiners but did not violate the sus-pension agreements. US cane refiners had been in a
more competitive market environment with reduced availabilities of raw sugar to refine and with a close substitute for their output in the form of the liquid raw sugar coming from Mexico. These refiners were behind the recent push and successful renegotia-tion of the suspension agreements.61 Note that the refined-raw spread in minimum prices increased to 5 c/lb under the amended suspension agreements.
NAFTA has provided some welfare gains to US sugar users by integrating sweetener markets between Mexico and the United States, but at the cost of substantial trade diversion.
Policy Recommendations
The major recommendation, as in recent previ-ous AEI assessments of the US sugar program,62 is the total removal of the sugar program’s main com-ponents (TRQs, allotments, and sugar loan rates). This major reform would induce gains to sugar users (consumers and food processors) in the order of $2.4–$4 billion (2009 dollars). The lion’s share of these gains would come from ending transfers to the US sugar industry. Net welfare gains would be smaller, in the order of $1 billion (range of $0.437–$2.565 bil-lion), as transfers from sugar users to the US sugar industry are the largest part of the consumer loss associated with the current program.
14
ANALYSIS OF THE US SUGAR PROGRAM JOHN C. BEGHIN AND AMANI ELOBEID
Some moderate employment effects (17,000 to 20,000 jobs) would ensue in US food processing sectors, which are sugar intensive. The latter would occur once imports of sugar-containing products con-tract drastically. These imports would no longer be needed to abate the high cost of domestic sugar under the sugar program.
NAFTA has provided some welfare gains to US sugar users by integrating sweetener markets between Mexico and the United States, but at the cost of substantial trade diversion. Mexican sugar exports have benefited from the bilateral trade open-ing, although they are relatively high cost. The trade diversion under NAFTA has been at the expense of low-cost exporters (e.g., Brazil and Thailand), which are constrained by historical allocations of TRQs.
The suspension agreements have partially com-promised the welfare gains achieved under the NAFTA sweetener market integration by limiting pro- competitive effects of Mexican exports of sugar to the United States. The suspension agreements and the AD and CVD duties should be removed to further pressure a reform of the US sugar program.
Short of a full removal of the sugar program, milder reforms of the program have been proposed.63 These policies consider the transformation of the sugar pro-gram into a conventional commodity program. This potential transformation is quite costly to taxpayers but lowers the cost to sugar users.
The cost of a hypothetical buyout is expensive; in the range of $2–$3 billion annually for a 10-year period and corresponding to 25 years of lost protec-tion of $1.1–$1.7 billion. Even partial buyouts to retire the most inefficient segments of the US sugar indus-try are expensive.
The most recent agreement with Mexico reached in June 2017 is an adverse development. It compro-mises the pro-competitive effect of NAFTA in the US sugar market by limiting the flow of sugar exports from Mexico. In addition, this agreement could serve as an example of successful “managed trade” for other sensitive products with Mexico and other countries and further undermine market integration and inter-dependence of countries based on respective compar-ative advantages.
About the Authors
John C. Beghin is professor and head of the depart-ment of agricultural and resource economics at North Carolina State University. His research interest and expertise are in the economics of international agricul-ture and food markets. Amani Elobeid is an adjunct assistant professor in the economics department at Iowa State University. Before this appointment, she was the international sugar and ethanol analyst with the Food and Agricultural Policy Research Institute at Iowa State University.
© 2017 by the American Enterprise Institute. All rights reserved.
The American Enterprise Institute (AEI) is a nonpartisan, nonprofit, 501(c)(3) educational organization and does not take institutional positions on any issues. The views expressed here are those of the author(s).

ANALYSIS OF THE US SUGAR PROGRAM JOHN C. BEGHIN AND AMANI ELOBEID
15
Notes
1. US Department of Agriculture, Economic Research Service, “Sugar and Sweetener Yearbook Tables: World Production, Supply, and Distribution, Centrifugal Sugar,” Tables 3b and 4, 2016, https://www.ers.usda.gov/data-products/sugar-and-sweeteners-yearbook- tables/. 2. A TRQ is a two-tier tariff system. For imports below the designated quota, imports are taxed at a low tariff, called the in-quota tariff. For imports beyond the quota level, a much higher tariff rate, called the out-of-quota tariff, is imposed, often precluding imports beyond the quota level. 3. Mark A. McMinimy, “Revisiting U.S.-Mexico Sugar Agreements,” CRS Insight, August 12, 2016, https://fas.org/sgp/crs/row/IN10552.pdf. 4. Donald Mitchell, “Sugar Policies: Opportunity for Change,” in Global Agricultural Trade and Developing Countries, ed. M. Ata-man Aksoy and John C. Beghin (Washington, DC: World Bank Publications, 2006), 141–59; and Coalition for Sugar Reform, “History of the Sugar Program: America & Sugar: A Salty Tale,” http://sugarreform.org/why-reform/history-of-the-sugar-program/. 5. James Johnson et al., “Provisions of the Agricultural and Food Act of 1981,” United States Department of Agriculture, Economic Research Service, January 1982, https://www.ers.usda.gov/publications/pub-details/?pubid=41763; and National Agricultural Law Center, “Farm Bills: Agricultural and Food Act of 1981: Pub. L. No. 97-98, 95 Stat. 1213,” accessed January 25, 2017, http:// nationalaglawcenter.org/wp-content/uploads/assets/farmbills/1981-1.pdf. 6. Mitchell, “Sugar Policies,” 141–59. 7. Ibid. 8. Ibid; and Brandon Willis and Doug O’Brien, “Summary and Evolution of U.S. Farm Bill Commodity Titles—Expanded Discus-sions,” National Agricultural Law Center, http://nationalaglawcenter.org/farmbills/commodity/expanded-discussion/#sugar-90. 9. The Food, Conservation, and Energy Act of 2008, Pub. L. No. 110-246. 10. Remy Jurenas, Sugar Policy and the 2008 Farm Bill, Congressional Research Service, January 30, 2009, http:// nationalaglawcenter.org/wp-content/uploads/assets/crs/RL34103.pdf; and McMinimy, “Revisiting U.S.-Mexico Sugar Agreements.” 11. The Agricultural Act of 2014, Pub. L. No. 113-79. 12. Ibid. 13. Cane sugar allotments can be filled only with sugar processed from sugarcane and beet sugar only from sugar processed from sugar beet grown in the state covered by the allotment for each crop. 14. Jurenas, Sugar Policy and the 2008 Farm Bill. 15. Renée Johnson and Jim Monke, What Is the Farm Bill?, Congressional Research Service Report, November 2016, https://fas.org/sgp/crs/misc/RS22131.pdf. 16. McMinimy, “Revisiting U.S.-Mexico Sugar Agreements.” 17. This is currently 1.139 million mtrv and 22,000 tons of refined sugar. 18. The TRQ under CAFTA totaled 140,580 mtrv in 2016 and 53,000 metric tons, 7,325 metric tons, and 2,000 metric tons for Colom-bia, Panama, and Peru, respectively. 19. McMinimy, “Revisiting U.S.-Mexico Sugar Agreements.” 20. John Beghin, “U.S. Sugar Policy: Analysis and Options,” in The 2007 Farm Bill and Beyond, ed. Bruce L Gardner and Daniel A. Sumner (Washington, DC: AEI Press, 2007), 47–51; Michael K. Wohlgenant, Sweets for the Sweet: The Costly Benefits of the US Sugar Program, American Enterprise Institute, July 12, 2011, http://www.aei.org/publication/sweets-for-the-sweet-the-costly-benefits-of-the-us-sugar-program/; and Mark A. McMinimy, U.S. Sugar Program Fundamentals, Congressional Research Service, April 6, 2016, https://

16
ANALYSIS OF THE US SUGAR PROGRAM JOHN C. BEGHIN AND AMANI ELOBEID
fas.org/sgp/crs/misc/R43998.pdf. 21. Welfare effects of a policy pertain to the efficiency in the allocation of resources under the policy and its distributional effects (winners and losers). Policies reducing exchanges in markets presumably distort the allocation of resources and reduce welfare by inducing an inefficient allocation of resources. 22. Variations in results across studies estimating the sugar programs’ impacts derive mainly from variations in the difference between world and US sugar prices over time (as shown in Table 1). The growing size of the US sugar market with its increasing popu-lation is another element. Modeling assumptions and different ways of measuring producer and consumer welfare also play a role in the different estimates of the program’s welfare effects. However, the direction and magnitudes of the estimates of the welfare effects and costs of the sugar program remain remarkably consistent across studies and over time. 23. Wohlgenant estimates an increase from 2.1 mmt to 3.9 mmt of sugar after the removal of the program. Michael K. Wohlgenant, Sweets for the Sweet: The Costly Benefits of the US Sugar Program, American Enterprise Institute, July 12, 2011, http://www.aei.org/ publication/sweets-for-the-sweet-the-costly-benefits-of-the-us-sugar-program/. The results presented by Beghin et al. indicate an increase in imports from 1.7 mmt to 3.3 mmt after reform. John C. Beghin et al., “The Cost of the U.S. Sugar Program Revisited,” Con-temporary Economic Policy 21 (2003): 106–16. Beghin and Elobeid estimate that ending the sugar programs increases sugar imports from 52 percent to 84 percent over the projected years of their analysis from a baseline level of imports of 3.5 million short tons of raw sugar equivalent. John C. Beghin and Amani Elobeid, “The Impact of the U.S. Sugar Program Redux,” Applied Economic Perspectives and Policy 37, no. 1 (March 2015): 1–33, https://academic.oup.com/aepp/article-abstract/37/1/1/2731967/The-Impact-of-the-U-S-Sugar- Program-Redux1?redirectedFrom=fulltext. 24. Beghin et al. find that world prices would have increased by 1 to 2 cents per pound (c/lb) in 1996 and 1998 (from a base of 10 to 12 c/lb), or roughly by 10 percent to 13 percent. John C. Beghin et al., “The Cost of the U.S. Sugar Program Revisited.” Wohlgenant esti-mates an 8.5 percent price increase from an unknown base. Michael K. Wohlgenant, Sweets for the Sweet. Beghin and Elobeid estimate a world price effect of about 1 c/lb for world raw sugar price, or a 2–5 percent increase. John C. Beghin and Amani Elobeid, “The Impact of the U.S. Sugar Program Redux,” Applied Economic Perspectives and Policy 37, no. 1 (March 2015): 1–33, https://academic.oup.com/aepp/article-abstract/37/1/1/2731967/The-Impact-of-the-U-S-Sugar-Program-Redux1?redirectedFrom=fulltext. As a reference, simulations of global trade liberalization in sugar markets give estimates of price effects of 3–5 c/lb. Amani Elobeid and John Beghin, “Multilateral Trade and Agricultural Policy Reforms in Sugar Markets,” Journal of Agricultural Economics 57, no. 1 (2006): 23–48. 25. David J. Abler et al., “Changing the U.S. Sugar Program into a Standard Crop Program: Consequences Under the North American Free Trade Agreement and Doha,” Applied Economic Perspectives and Policy 30, no. 1 (Spring 2008): 82–102, https://www.jstor.org/ stable/30224835; and Stephen Haley, Owen Wagner, and David Orden, “The U.S. Sugar Program: Reform Pressures and Options,” in The Future of Global Sugar Markets, ed. David Orden (Washington, DC: International Food Policy Research Institute, 2008): 41. 26. Ibid. 27. Decoupling refers to not having an incentive effect on production decisions. 28. Payment limits would reduce expenditures on direct payments from $463 million to $224 million. 29. Deadweight losses refer to the net welfare losses associated with a market intervention. It is computed by comparing estimated gains by winners and losses by losers to obtain the net welfare cost to society from the distortion (i.e., policy). 30. Results for the high-import scenario are as follows: beet and cane producer surpluses increase by $215 million and $147 million, respectively, and beet refiners and cane processors’ profits decline by $86 million and $40 million, respectively, relative to the baseline. 31. David Orden, “Feasibility of Farm Program Buyouts,” Louisiana State University, January 23, 2007, http://farmpolicy.typepad.com/farmpolicy/files/orden_buyouts.pdf. 32. Stephen Haley, Owen Wagner, and David Orden, “The U.S. Sugar Program: Reform Pressures and Options,” in The Future of Global Sugar Markets, ed. David Orden (Washington, DC: International Food Policy Research Institute, 2008): 41. 33. Gary W. Brester, “20 Years in, NAFTA Finally Sours the U.S. Sugar Program,” American Enterprise Institute, September 4, 2014, http://www.aei.org/publication/20-years-in-nafta-finally-sours-the-us-sugar-program/. 34. Steven Zahniser, Getachew Nigatu, and Michael McConnell, “A New Outlook for the U.S.-Mexico Sugar and Sweetener Market,”

ANALYSIS OF THE US SUGAR PROGRAM JOHN C. BEGHIN AND AMANI ELOBEID
17
US Department of Agriculture, August 2016, https://www.ers.usda.gov/publications/pub-details/?pubid=74634. 35. Abler et al., “Changing the U.S. Sugar Program into a Standard Crop Program”; Haley, Wagner, and Orden, “The U.S. Sugar Pro-gram”; Ronald D. Knutson, Patrick Westhoff, and Pablo Sherwell, “Trade Liberalizing Impacts of NAFTA in Sugar: Global Implica-tions,” International Food and Agribusiness Management Review 13, no. 4 (2010): 16, https://ageconsearch.umn.edu/bitstream/ 96338/2/20100014_Formatted.pdf; Karen Elizabeth Lewis, “Analysis of the United States’ Sugar Industry,” Arizona State University, May 2014, https://repository.asu.edu/attachments/134812/content/Lewis_asu_0010E_13593.pdf; and Troy G. Schmitz and Karen Eliza-beth Lewis, “Impact of NAFTA on U.S. and Mexican Sugar Markets,” Journal of Agricultural and Resource Economics 40, no. 3 (2015): 387–404, http://www.waeaonline.org/UserFiles/file/JARESeptember20153Schmitzpp387-404.pdf. 36. Brester, “20 Years in, NAFTA Finally Sours the U.S. Sugar Program”; Haley, Wagner, and Orden, “The U.S. Sugar Program”; and Schmitz and Lewis, “Impact of NAFTA on U.S. and Mexican Sugar Markets.” 37. Knutson, Westhoff, and Sherwell, “Trade Liberalizing Impacts of NAFTA in Sugar.” 38. Brester, “20 Years in, NAFTA Finally Sours the U.S. Sugar Program.” 39. Ibid. 40. Ibid. 41. Schmitz and Lewis, “Impact of NAFTA on U.S. and Mexican Sugar Markets.” 42. McMinimy, “Revisiting U.S.-Mexico Sugar Agreements.” 43. Schmitz and Lewis, “Impact of NAFTA on U.S. and Mexican Sugar Markets.” 44. Ibid. 45. Consumer surplus refers to monetary valuation of the well-being of consumers derived from consuming a good. 46. Trade diversion occurs when a country sources its imports from an exporter, which is not the lowest-cost source of exports, because of policy distortions creating incentives to do so. 47. Organisation for Economic Co-operation and Development, “Producer and Consumer Support Estimates Database,” 2016, http://www.oecd.org/tad/agricultural-policies/producerandconsumersupportestimatesdatabase.htm; and Zahniser, Nigatu, and McConnell, “A New Outlook for the U.S.-Mexico Sugar and Sweetener Market.” 48. Schmitz and Lewis, “Impact of NAFTA on U.S. and Mexican Sugar Markets.” 49. Thomas Earley, “Oral Statement by Thomas Earley on Behalf of the Sweetener Users Association to the U.S. International Trade Commission,” January 14, 2016, https://www.usitc.gov/press_room/documents/testimony/105_001_004d2.pdf. 50. John C. Beghin, Jean-Christophe Bureau, and Alexandre Gohin, “The Impact of a U.S.-EU Free Trade Agreement on Biofuel and Feedstock Markets,” Journal of Agricultural Economics 68, no. 2 (2014): 321–44, http://www.card.iastate.edu/products/publications/synopsis/?p=1231. 51. A voluntary export restraint scheme operates when exporters agree to limit their exports in exchange for receiving higher prices than would prevail under competitive markets. Consumers bear the cost of such a scheme by facing higher prices and consuming fewer units. 52. John C. Beghin and Amani Elobeid, “The Impact of the U.S. Sugar Program Redux,” Applied Economic Perspectives and Policy 37, no. 1 (March 2015): 1–33, https://academic.oup.com/aepp/article-abstract/37/1/1/2731967/The-Impact-of-the-U-S-Sugar-Program- Redux1?redirectedFrom=fulltext. 53. Sweetener Users Association to Commerce Secretary Penny Pritzker, September 19, 2016, Washington, DC, http:// d31hzlhk6di2h5.cloudfront.net/20160920/e8/ba/95/7a/5d3f6b099cf944a79f0b2238/SUA_Ltr_to_Secretary_Pritzker__U.S.-Mexico_Sugar_Suspension_Agreements__9-19-2016.pdf. 54. Jarret Whistance, Andrick Payen, and Wyatt Thompson, “Suspension Agreements and Antidumping/Countervailing Duties: U.S.-Mexico Sugar Markets and the Effects of Alternative Trade Policies,” Agricultural and Applied Economics Association & Western Agricultural Economics Association, July 2015, http://ageconsearch.umn.edu/record/205550/files/SuspensionAgreementEffects_AAEA_2015.pdf. 55. FAPRI-MU is the Food and Agricultural Policy Research Institute at University of Missouri-Columbia. 56. Wilson Sinclair and Amanda Countryman, “Not So Sweet: Economic Implications of Restricting U.S. Sugar Imports from Mex-

18
ANALYSIS OF THE US SUGAR PROGRAM JOHN C. BEGHIN AND AMANI ELOBEID
ico,” Colorado State University, 2017. 57. Ibid. 58. Zahniser, Nigatu, and McConnell, “A New Outlook for the U.S.-Mexico Sugar and Sweetener Market.” 59. Whistance, Payen, and Thompson, “Suspension Agreements and Antidumping/Countervailing Duties.” 60. Ibid. 61. McMinimy, “Revisiting U.S.-Mexico Sugar Agreements”; and US Department of Commerce, “Draft Amendments to the Mexican Sugar Suspension Agreements,” press release, June 6, 2017, https://www.commerce.gov/news/fact-sheets/2017/06/draft-amendments- mexican-sugar-suspension-agreements. 62. Beghin, “U.S. Sugar Policy”; and Wohlgenant, Sweets for the Sweet. 63. Abler et al., “Changing the U.S. Sugar Program into a Standard Crop Program”; and Haley, Wagner, and Orden, “The U.S. Sugar Program.”

ANALYSIS OF THE US SUGAR PROGRAM JOHN C. BEGHIN AND AMANI ELOBEID
19
Ap
pen
dix
: Tab
le A
1. H
isto
rica
l Dat
a o
n th
e U
S Su
gar
Su
pp
ly, U
se, a
nd
Tra
de*
Fisc
al Y
ear
2000
– 0120
01– 02
2002
– 0320
03– 04
2004
– 0520
05– 06
2006
– 0720
07– 08
2008
– 0920
09– 10
2010
– 1120
11– 12
2012
– 1320
13– 14
2014
– 1520
15– 16
2016
– 17
1,00
0 m
trv
Begi
nnin
g St
ocks
2,
010
1,97
71,
386
1,51
51,
721
1,20
81,
540
1,63
21,
510
1,39
21,
359
1,25
01,
796
1,95
81,
642
1,64
71,
863
Tota
l Pro
duct
ion
7,95
57,
167
7,64
47,
846
7,14
56,
712
7,66
27,
396
6,83
27,
224
7,10
47,
700
8,14
87,
676
7,85
38,
155
8,44
9
Bee
t Sug
ar4,
245
3,55
24,
048
4,25
74,
183
4,03
24,
543
4,28
33,
822
4,15
14,
227
4,44
64,
605
4,34
94,
439
4,64
44,
872
Can
e Su
gar
3,71
03,
615
3,59
63,
590
2,96
22,
681
3,11
93,
113
3,00
93,
073
2,87
73,
255
3,54
33,
327
3,41
43,
511
3,57
6
Tota
l Im
ports
1,44
31,
393
1,57
01,
588
1,90
53,
124
1,88
72,
377
2,79
63,
012
3,39
13,
295
2,92
53,
394
3,22
33,
031
2,44
4
Tar
iff-R
ate
Quot
a Im
ports
**
1,15
81,
051
1,09
81,
113
1,27
72,
348
1,47
31,
228
1,24
31,
682
1,56
11,
709
868
1,18
11,
393
1,46
91,
390
Oth
er P
rogr
am
Impo
rts21
626
944
342
145
431
735
451
327
940
726
460
212
427
742
735
915
9
Non
prog
ram
Impo
rts69
7329
5417
445
960
636
1,27
492
31,
566
984
1,93
31,
937
1,40
31,
202
896
Mex
ico
00
00
00
5463
01,
272
732
1,54
997
21,
927
1,93
21,
389
1,18
788
2
Tota
l Sup
ply
11,4
0810
,537
10,5
9910
,949
10,7
7111
,044
11,0
8811
,404
11,1
3811
,627
11,8
5412
,245
12,8
6913
,029
12,7
1812
,832
12,7
56
Tota
l Exp
orts
12
812
512
926
123
518
438
318
412
319
122
524
424
927
816
867
23
Mis
cella
neou
s an
d St
atis
tical
Adj
ustm
ent
112
–22
146
2085
–61
–120
00
–41
17–5
8–2
10
0–3
00
Deliv
erie
s fo
r Do
mes
tic U
se9,
191
9,04
88,
810
8,94
69,
243
9,38
19,
194
9,71
09,
623
10,1
1710
,362
10,2
6310
,683
11,1
0910
,903
10,9
3211
,027
Rea
lized
(Pro
duct
ion/
Hum
an C
ons)
Sha
re
for E
xpor
ts U
nder
Re
-exp
ort P
rogr
am89
141
166
129
110
9615
312
810
918
317
812
773
7493
134
109
Tra
nsfe
r to
Polyh
y-dr
ic A
lcoh
ol, F
eed
3030
2238
4446
4856
4231
3030
168
313
2520
32
Dom
estic
Foo
d an
d Be
vera
ge U
se**
* 9,
072
8,87
78,
622
8,78
09,
089
9,23
98,
993
9,52
79,
472
9,90
310
,154
10,1
0710
,442
10,7
2210
,785
10,7
7810
,886
Tota
l Use
9,43
19,
151
9,08
49,
228
9,56
39,
504
9,45
79,
895
9,74
610
,268
10,6
0410
,450
10,9
1011
,387
11,0
7110
,969
11,0
50
Endi
ng S
tock
s 1,
977
1,38
61,
515
1,72
11,
208
1,54
01,
632
1,51
01,
392
1,35
91,
250
1,79
61,
958
1,64
21,
647
1,86
31,
706
CCC
71
119
20
00
00
00
00
028
70
00
0
Stoc
ks-t
o-Us
e Ra
tio20
.97
15.1
516
.68
18.6
512
.63
16.2
117
.25
15.2
614
.28
13.2
411
.79
17.1
817
.95
14.4
214
.87
16.9
915
.44
Not
es: *
Incl
udes
Pue
rto R
ico.
**I
nclu
des M
exic
o pr
e-20
08. *
**Fo
r FY2
008–
09, c
ombi
nes s
wee
tene
r mar
ket d
ata
(SM
D) d
eliv
erie
s for
dom
estic
hum
an u
se, S
MD
misc
ella
neou
s use
s,
and
the
diffe
renc
e be
twee
n SM
D im
ports
and
WA
SDE
impo
rts.
Sour
ce: U
S D
epar
tmen
t of A
gric
ultu
re, E
cono
mic
Res
earc
h Se
rvic
e, “
Suga
r and
Sw
eete
ners
Out
look
,” u
pdat
ed Ja
nuar
y 17
, 201
6.