
ANALYSIS OF THE SHIELDING GAS DEPENDENT L-PBF PROCESS...
14
ANALYSIS OF THE SHIELDING GAS DEPENDENT L-PBF PROCESS STABILITY BY MEANS OF SCHLIEREN AND SHADOWGRAPH TECHNIQUES B. Hoppe 1 , S. Enk 2 , J. H. Schleifenbaum 2,3 1 SLM Solutions Group AG, 23560 Lübeck, Germany 2 Fraunhofer Institute for Laser Technology, 52074 Aachen, Germany 3 Chair for Digital Additive Production DAP, RWTH Aachen University, 52074 Aachen, Germany Abstract Ensuring a robust and reproducible Laser Powder Bed Fusion (L-PBF) process depends on the design of the shielding gas flow in the corresponding manufacturing system. The gas flow assures the removal of particles from the process zone that emerge from the interaction with the laser irradiation. Minor disturbances may influence the stability of the L-PBF-Process and cause defects in final parts produced. The objective of this work comprises visualizing the convection processes and particle dynamics to analyze their influence on process stability. Therefore, a high speed camera based Schlieren and Shadowgraph setup is used to visualize convection flows as well as trajectories of metallic condensate and particles with up to 10,568 fps. This arrangement allowed investigating the influence of shielding gas flow conditions on single melt tracks. Corresponding results and studies on the interaction between laser irradiation and particles in varying shielding gas flow conditions are contents of this work. Keywords: Laser Powder Bed Fusion; Schlieren; Shadowgraph; Process Development; Shielding gas flow; Process stability; 316L stainless steel Introduction The shielding gas flow becomes ever more important in modern L-PBF machines with increasing build volumes and numbers of simultaneously working laser sources. Therefore, it is critical to understand how the shielding gas flow influences the stability of the Laser Powder Bed Fusion process. It is known that material defects resulting from an insufficiently adjusted process gas flow might affect the tensile strength of parts produced as shown by Ferrar et al. [1]. Their work suggests, that differing shielding gas flow conditions cause the defects. New imaging approaches can help to characterize different shielding gas flow mechanisms like the gas convection that might lead to an unstable process. A high speed Schlieren and Shadowgraph system is suitable for visualizing convection of hot gas and particle movement during the exposure of the metal powder bed. The Schlieren as well as the Shadowgraph method enables the visualization of convection processes in transparent media. With the Schlieren method, the local fluctuation of the refractive index is exploited by inhomogeneities of density in the medium under consideration. Parts of the refracted light can be prevented from reaching a screen by means of a cutoff. The shape that emerges on the screen is called a Schliere (german for "smear"). The shadow method uses the shadow cast by objects. Since this method does not require a cutoff, the luminous efficacy is much higher than with the Schlieren method. The high temporal resolution of the high speed camera enables researchers to see small changes in the range of microseconds that would otherwise be overseen. 1523 Solid Freeform Fabrication 2019: Proceedings of the 30th Annual International Solid Freeform Fabrication Symposium – An Additive Manufacturing Conference Reviewed Paper
Transcript of ANALYSIS OF THE SHIELDING GAS DEPENDENT L-PBF PROCESS...
ANALYSIS OF THE SHIELDING GAS DEPENDENT L-PBF PROCESS STABILITY BY MEANS OF SCHLIEREN AND SHADOWGRAPH TECHNIQUES
B. Hoppe1, S. Enk2, J. H. Schleifenbaum2,3
1SLM Solutions Group AG, 23560 Lübeck, Germany
2Fraunhofer Institute for Laser Technology, 52074 Aachen, Germany 3Chair for Digital Additive Production DAP, RWTH Aachen University, 52074 Aachen,
Germany
Abstract
Ensuring a robust and reproducible Laser Powder Bed Fusion (L-PBF) process depends on the design of the shielding gas flow in the corresponding manufacturing system. The gas flow assures the removal of particles from the process zone that emerge from the interaction with the laser irradiation. Minor disturbances may influence the stability of the L-PBF-Process and cause defects in final parts produced. The objective of this work comprises visualizing the convection processes and particle dynamics to analyze their influence on process stability. Therefore, a high speed camera based Schlieren and Shadowgraph setup is used to visualize convection flows as well as trajectories of metallic condensate and particles with up to 10,568 fps. This arrangement allowed investigating the influence of shielding gas flow conditions on single melt tracks. Corresponding results and studies on the interaction between laser irradiation and particles in varying shielding gas flow conditions are contents of this work. Keywords: Laser Powder Bed Fusion; Schlieren; Shadowgraph; Process Development; Shielding gas flow; Process stability; 316L stainless steel
Introduction The shielding gas flow becomes ever more important in modern L-PBF machines with increasing build volumes and numbers of simultaneously working laser sources. Therefore, it is critical to understand how the shielding gas flow influences the stability of the Laser Powder Bed Fusion process. It is known that material defects resulting from an insufficiently adjusted process gas flow might affect the tensile strength of parts produced as shown by Ferrar et al. [1]. Their work suggests, that differing shielding gas flow conditions cause the defects. New imaging approaches can help to characterize different shielding gas flow mechanisms like the gas convection that might lead to an unstable process. A high speed Schlieren and Shadowgraph system is suitable for visualizing convection of hot gas and particle movement during the exposure of the metal powder bed. The Schlieren as well as the Shadowgraph method enables the visualization of convection processes in transparent media. With the Schlieren method, the local fluctuation of the refractive index is exploited by inhomogeneities of density in the medium under consideration. Parts of the refracted light can be prevented from reaching a screen by means of a cutoff. The shape that emerges on the screen is called a Schliere (german for "smear"). The shadow method uses the shadow cast by objects. Since this method does not require a cutoff, the luminous efficacy is much higher than with the Schlieren method. The high temporal resolution of the high speed camera enables researchers to see small changes in the range of microseconds that would otherwise be overseen.
1523
Solid Freeform Fabrication 2019: Proceedings of the 30th Annual InternationalSolid Freeform Fabrication Symposium – An Additive Manufacturing Conference
Reviewed Paper
Bidare et al. [2,3] have shown that it is possible to visualize the convection of argon gas entraining metal vapor while being ejected from the melt pool. This was enabled through a custom Schlieren setup and a high speed camera. They have shown that the melt pool geometry is decisive for the particle ejection behavior. Different variations of laser power PL and scanning speed vscan lead to changing ejection behaviors. Hoppe et al. were able to verify these findings with a similar setup and widened the scope of analyzed parameters [4]. Metal condensate is generally entrained in the convection flow of heated shielding gas. The appliance of Shadowgraph imagery in addition to the Schlieren images allowed for clearly linking the condensate movement to the convection flow. This holds true when applying a forced shielding gas flow to the process. Interaction between the metal condensate and laser beam was observed. Furthermore, single melt tracks were analyzed via particle tracking to measure the particle ejection behavior at varying laser power PL and scanning speed vscan. The ejection angle of particles changes according to the convection flow of the heated shielding gas. Increasing PL or decreasing vscan lead to a higher ejection angle. The effect of adjusting parameter values for PL is observed to be more dominant than similar modifications for vscan. However, it was not analyzed in detail how this influences part quality. Hoppe et al. focused solely on the observations made by Schlieren and Shadowgraph. This work will therefore focus on further analyzing the interaction of laser beam and ejected particles from the melt pool as well as the resulting part topology. Varying shielding gas flow conditions and their influence on the L-PBF process stability will be looked at in more detail.
Experimental Setup and Methodology Exposing two scanning patterns with a laser beam allows analyzing the influence of the shielding gas flow on the process stability. A high speed camera captures Schlieren and Shadowgraph images during the exposure process for visualizing the convection flows of the shielding gas and the particle ejection behavior. The surface topology and melt track geometry are evaluated by means of reflected light microscopy and SEM images. Correlating these results to the Schlieren and Shadowgraph images should than provide explanations on the mechanisms leading to an unstable melting process. The employed experimental setup and analyzing methods are described in the following. The experimental setup is based on a modified AconityMINI machine from Aconity3D GmbH for having the opportunity of controlling and creating a desired process gas atmosphere. The system has openings at the opposing ends of the process chamber with 4 mm thick glass windows installed therein. This enables the light to pass unhindered through the chamber during the L-PBF process in order to run the Schlieren system. Additionally, the powder coater has an aperture so that it can remain in the process chamber during the process and allow measurements to be made. The setup corresponds to the setup used and described by Hoppe et al. in [4] The z arrangement described by Settles [5] is used for the mirror Schlieren system in this work, but has been customized so that it is compatible with the described machine type. The Schlieren system consists of an illumination side and an imaging side, which are arranged point-symmetrically to the process chamber center. A mounted LED MCWHL5 from Thorlabs produces the cold white (6500 K) light required for the Schlieren imagery at a minimum light output of 800 mW. This light is focused by a condenser lens onto a variable slit diaphragm and then reflected via a deflecting mirror onto a first
1524
off-axis parabolic mirror (OAP). The reflection at the OAP leads to a collimation of the light, which enters the process chamber through the first glass window. The light illuminates the observation plane which is approx. 230 mm away from the second glass window. The light leaves the process chamber through the second glass window and is refocused by a second OAP onto a cutoff (consisting of a standard razor blade) via a second deflecting mirror. The cutoff is positioned in the focal point of the OAP and set to reflect 75% of the focused light. The cutoff allows adjusting the contrast of the Schlieren image recorded by a high-speed camera (HS camera) with a resolution of 51.8 μm/pixel and a mounted Nikon zoom lens (70 - 210 mm focal length, f/4). The OAP of Thorlabs have a fixed reflection angle of 15°, a focal length of 381 mm and a diameter of 50,8 mm. They are made out of a silver-coated aluminum substrate and reflect a wavelength range from 450 nm to 20 m. The deflecting mirrors have a flat square reflection surface with an edge length of 50.8 mm. All components are mounted onto breadboards with a surface area of 300 x 300 mm² and firmly connected to the test chamber using aluminum profiles. A VEO640L HS camera from Vision Research generates the high-speed videos. The monochrome sensor enables a maximum image acquisition frequency of 1,600 Hz at full resolution of 2,560 x 1,600 pixels. The Schlieren images are captured at a resolution of 1024 x 500 pixels, an image acquisition frequency of 9,656 Hz and an exposure time of 14.64 μs. For the Shadowgraph shots a resolution of 896 x 500 pixels, an image acquisition frequency of 10,568 Hz and an exposure time of 5.13 μs are set. The laser modulation signal is used as a trigger signal. The laser radiation with a wavelength of 1070 nm and a nominal laser power of 400 W is generated by an ytterbium single-mode fiber laser beam source from IPG Photonics GmbH. A HurryScan 20 scanner system with an RTC-5 control card enables the deflection of the laser beam. An F-Theta lens with a focal length of 254 mm focuses the laser beam to a beam diameter dB of approx. 80 μm in the working plane. This corresponds to the surface of the powder bed. Gas atomized stainless steel powder 316L with a particle size distribution of 22 - 63 μm and an average particle diameter of x50 = 36.86 μm represents the raw material of the process. The powder is applied with a layer thickness DL = 60 μm by means of a silicone lip. The round substrate plates with a diameter of 100 mm also consist of 316L and the corresponding surfaces are roughened with sandpaper and then cleaned with ethanol. Additionally, a 5 mm thick detachable metal sheet manufactured out of 316L is used on top of the substrate plate to facilitate the generation of cross sections. The experiments were carried out directly on the substrate plate without a pre-melted, shrunk layer. The noble gas argon is used to create a shielding gas atmosphere by flooding the process chamber until the measured residual oxygen value drops below 200 ppm. By manually controlling the argon supply, the residual oxygen value can be kept below 200 ppm during the L-PBF process. The investigations are performed at an overpressure of 80 mbar relative to the ambient pressure. The changing weather-dependent ambient pressure is not measured. The flow velocity across the substrate plate is set to approx. 2 m/s. This value corresponds to the maximum flow velocity in the test setup considered here, at which the metal powder is not removed by the shielding gas flow. To recreate process conditions comparable to industrial parts two scanning patterns are defined. These are rectangular shaped with edge lengths of 35 mm x 6 mm and are schematically depicted in Figure 1. The side view scanning pattern contains 8 stripes with fill vectors aligned
1525
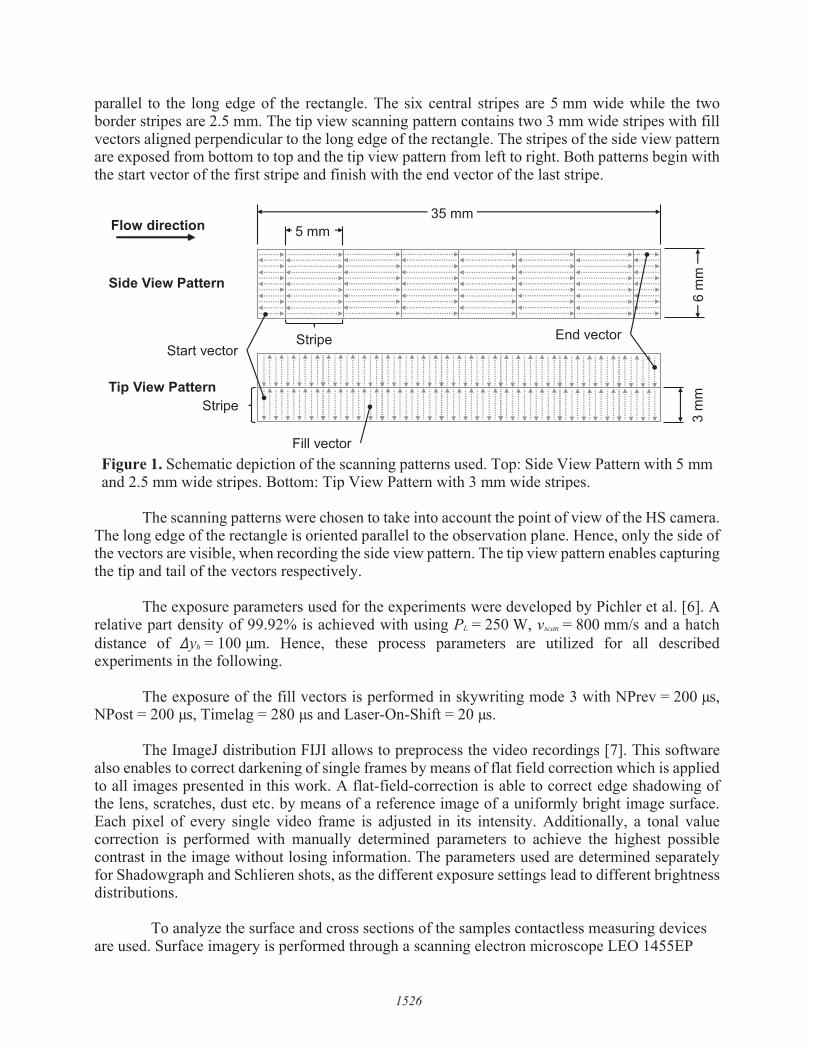
parallel to the long edge of the rectangle. The six central stripes are 5 mm wide while the two border stripes are 2.5 mm. The tip view scanning pattern contains two 3 mm wide stripes with fill vectors aligned perpendicular to the long edge of the rectangle. The stripes of the side view pattern are exposed from bottom to top and the tip view pattern from left to right. Both patterns begin with the start vector of the first stripe and finish with the end vector of the last stripe.
Figure 1. Schematic depiction of the scanning patterns used. Top: Side View Pattern with 5 mm and 2.5 mm wide stripes. Bottom: Tip View Pattern with 3 mm wide stripes.
The scanning patterns were chosen to take into account the point of view of the HS camera. The long edge of the rectangle is oriented parallel to the observation plane. Hence, only the side of the vectors are visible, when recording the side view pattern. The tip view pattern enables capturing the tip and tail of the vectors respectively. The exposure parameters used for the experiments were developed by Pichler et al. [6]. A relative part density of 99.92% is achieved with using PL = 250 W, vscan = 800 mm/s and a hatch distance of Δyh = 100 μm. Hence, these process parameters are utilized for all described experiments in the following. The exposure of the fill vectors is performed in skywriting mode 3 with NPrev = 200 μs, NPost = 200 μs, Timelag = 280 μs and Laser-On-Shift = 20 μs. The ImageJ distribution FIJI allows to preprocess the video recordings [7]. This software also enables to correct darkening of single frames by means of flat field correction which is applied to all images presented in this work. A flat-field-correction is able to correct edge shadowing of the lens, scratches, dust etc. by means of a reference image of a uniformly bright image surface. Each pixel of every single video frame is adjusted in its intensity. Additionally, a tonal value correction is performed with manually determined parameters to achieve the highest possible contrast in the image without losing information. The parameters used are determined separately for Shadowgraph and Schlieren shots, as the different exposure settings lead to different brightness distributions. To analyze the surface and cross sections of the samples contactless measuring devices are used. Surface imagery is performed through a scanning electron microscope LEO 1455EP
35 mm
Side View Pattern
Tip View Pattern
6 m
m
Fill vector
Stripe
Stripe
Start vectorEnd vector
3 m
m
5 mmFlow directionFlow direction
1526
with a magnification of up to 4000x. Colored imagery and analysis of the cross sections are enabled by means of a reflected light microscope from Olympus Deutschland GmbH.
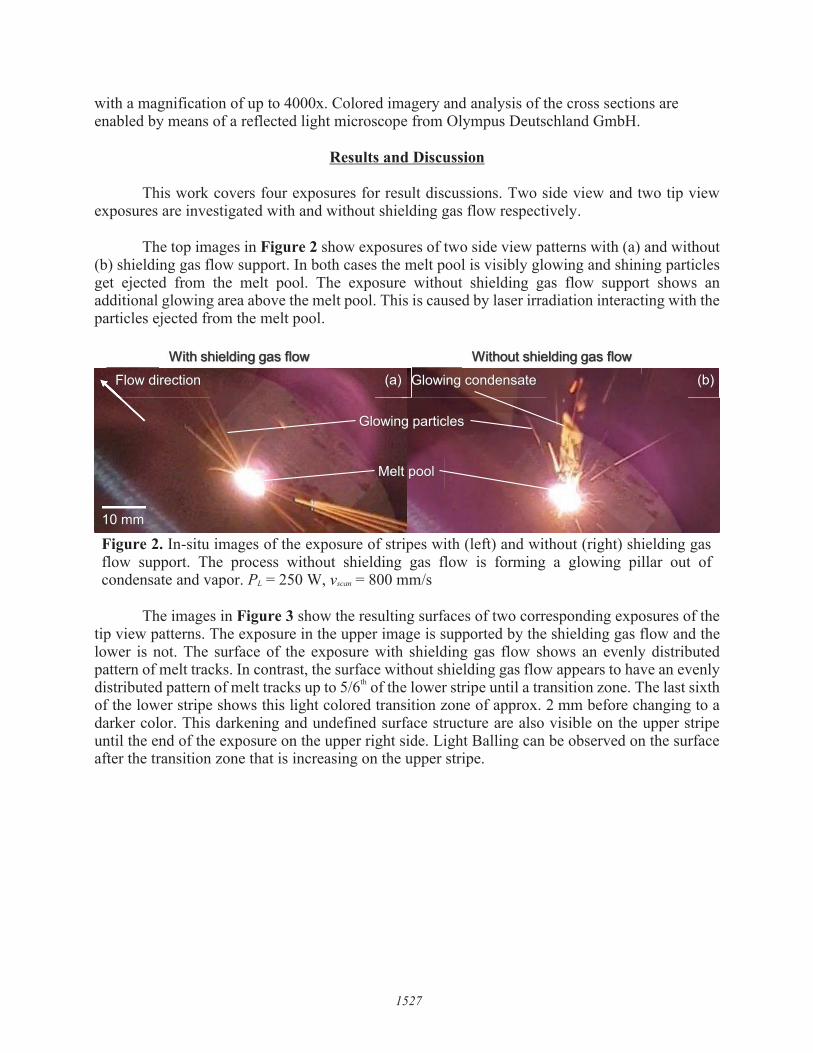
Results and Discussion This work covers four exposures for result discussions. Two side view and two tip view exposures are investigated with and without shielding gas flow respectively. The top images in Figure 2 show exposures of two side view patterns with (a) and without (b) shielding gas flow support. In both cases the melt pool is visibly glowing and shining particles get ejected from the melt pool. The exposure without shielding gas flow support shows an additional glowing area above the melt pool. This is caused by laser irradiation interacting with the particles ejected from the melt pool.
Figure 2. In-situ images of the exposure of stripes with (left) and without (right) shielding gas flow support. The process without shielding gas flow is forming a glowing pillar out of condensate and vapor. PL = 250 W, vscan = 800 mm/s
The images in Figure 3 show the resulting surfaces of two corresponding exposures of the tip view patterns. The exposure in the upper image is supported by the shielding gas flow and the lower is not. The surface of the exposure with shielding gas flow shows an evenly distributed pattern of melt tracks. In contrast, the surface without shielding gas flow appears to have an evenly distributed pattern of melt tracks up to 5/6th of the lower stripe until a transition zone. The last sixth of the lower stripe shows this light colored transition zone of approx. 2 mm before changing to a darker color. This darkening and undefined surface structure are also visible on the upper stripe until the end of the exposure on the upper right side. Light Balling can be observed on the surface after the transition zone that is increasing on the upper stripe.
Without shielding gas flowWith shielding gas flowGlowing condensate
Glowing particles
Flow direction
10 mm
Melt pool
(a) (b)
1527
With shielding gas flow Without shielding gas flow
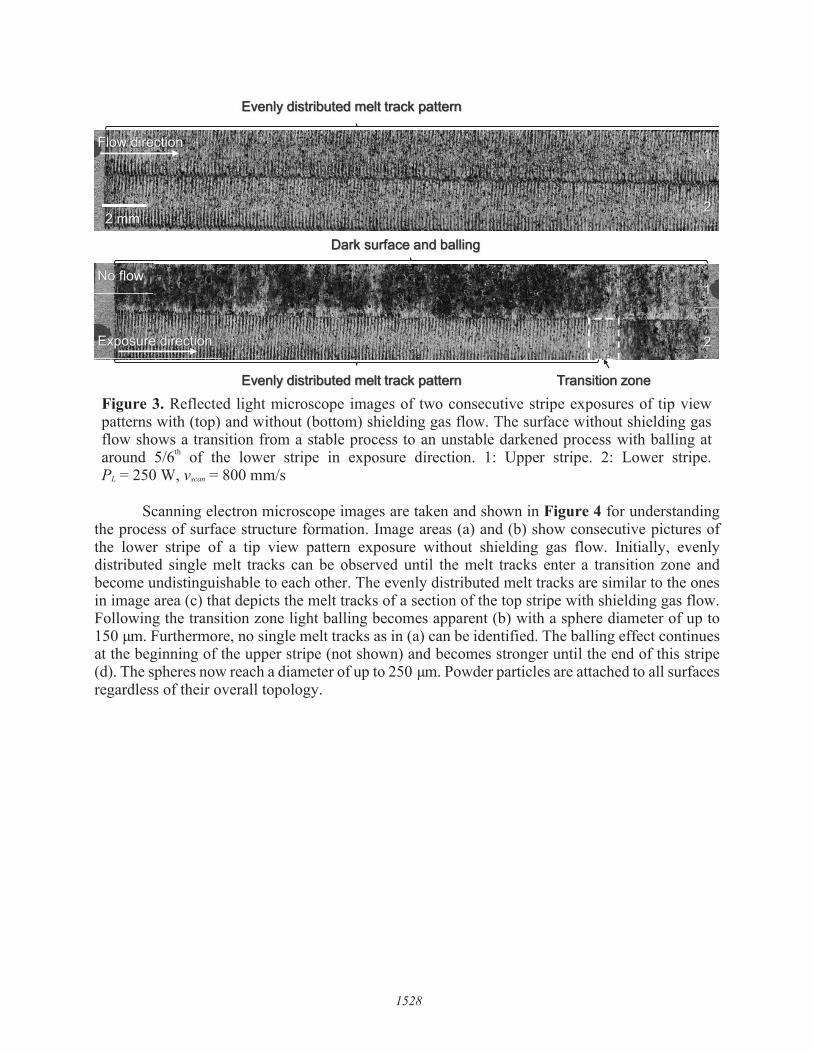
Figure 3. Reflected light microscope images of two consecutive stripe exposures of tip view patterns with (top) and without (bottom) shielding gas flow. The surface without shielding gas flow shows a transition from a stable process to an unstable darkened process with balling at around 5/6th of the lower stripe in exposure direction. 1: Upper stripe. 2: Lower stripe. PL = 250 W, vscan = 800 mm/s
Scanning electron microscope images are taken and shown in Figure 4 for understanding the process of surface structure formation. Image areas (a) and (b) show consecutive pictures of the lower stripe of a tip view pattern exposure without shielding gas flow. Initially, evenly distributed single melt tracks can be observed until the melt tracks enter a transition zone and become undistinguishable to each other. The evenly distributed melt tracks are similar to the ones in image area (c) that depicts the melt tracks of a section of the top stripe with shielding gas flow. Following the transition zone light balling becomes apparent (b) with a sphere diameter of up to 150 μm. Furthermore, no single melt tracks as in (a) can be identified. The balling effect continues at the beginning of the upper stripe (not shown) and becomes stronger until the end of this stripe (d). The spheres now reach a diameter of up to 250 μm. Powder particles are attached to all surfaces regardless of their overall topology.
Evenly distributed melt track pattern Transition zone
Dark surface and balling
No flow
Exposure direction
Evenly distributed melt track pattern
2 mm
Flow direction1
2
1
2
1528
Evenly distributed melt track pattern
Dark surface and balling
Evenly distributed melt track pattern Transition zone
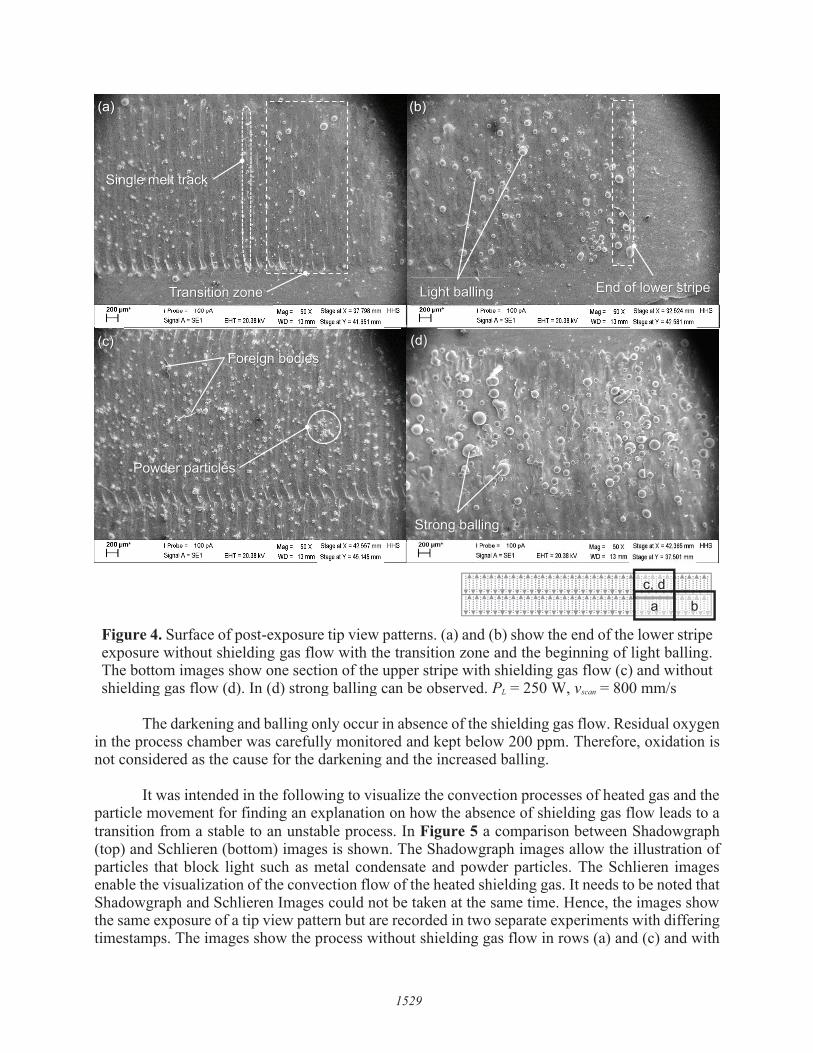
Figure 4. Surface of post-exposure tip view patterns. (a) and (b) show the end of the lower stripe exposure without shielding gas flow with the transition zone and the beginning of light balling. The bottom images show one section of the upper stripe with shielding gas flow (c) and without shielding gas flow (d). In (d) strong balling can be observed. PL = 250 W, vscan = 800 mm/s
The darkening and balling only occur in absence of the shielding gas flow. Residual oxygen in the process chamber was carefully monitored and kept below 200 ppm. Therefore, oxidation is not considered as the cause for the darkening and the increased balling. It was intended in the following to visualize the convection processes of heated gas and the particle movement for finding an explanation on how the absence of shielding gas flow leads to a transition from a stable to an unstable process. In Figure 5 a comparison between Shadowgraph (top) and Schlieren (bottom) images is shown. The Shadowgraph images allow the illustration of particles that block light such as metal condensate and powder particles. The Schlieren images enable the visualization of the convection flow of the heated shielding gas. It needs to be noted that Shadowgraph and Schlieren Images could not be taken at the same time. Hence, the images show the same exposure of a tip view pattern but are recorded in two separate experiments with differing timestamps. The images show the process without shielding gas flow in rows (a) and (c) and with
Transition zone
(a)
(c)
c, d
(d)
a b
Light balling
(b)
Strong balling
End of lower stripe
Foreign bodies
Single melt track
Powder particles
1529
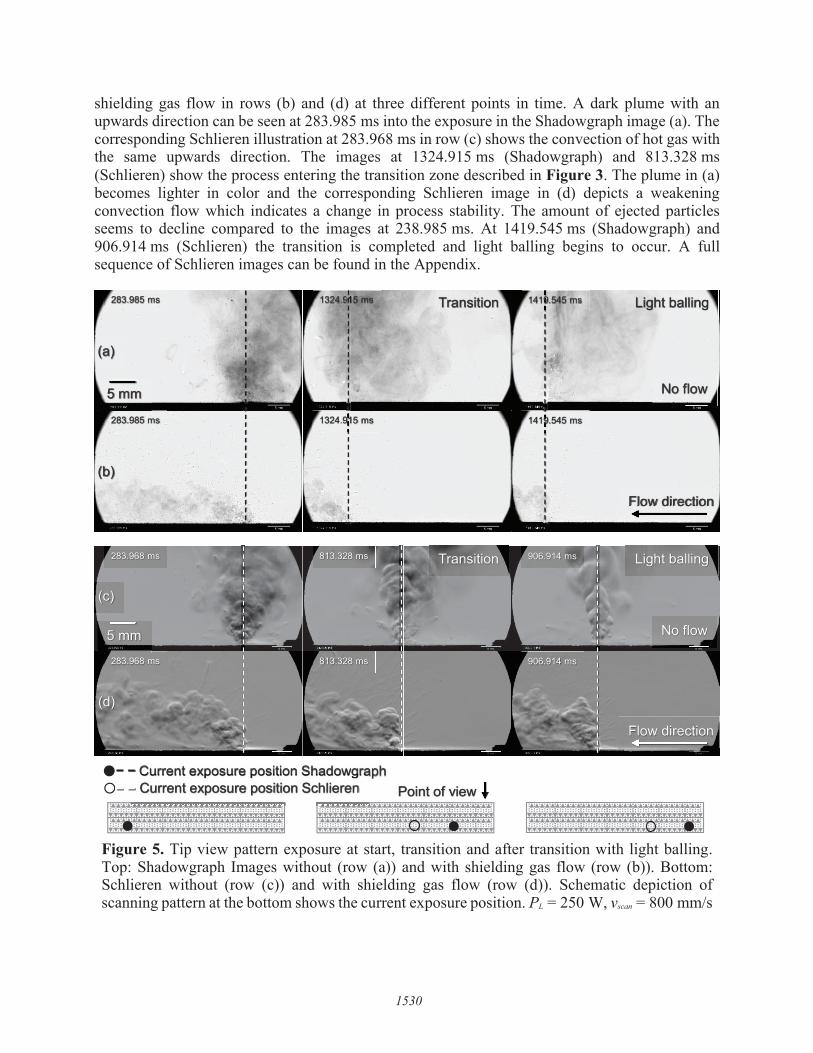
shielding gas flow in rows (b) and (d) at three different points in time. A dark plume with an upwards direction can be seen at 283.985 ms into the exposure in the Shadowgraph image (a). The corresponding Schlieren illustration at 283.968 ms in row (c) shows the convection of hot gas with the same upwards direction. The images at 1324.915 ms (Shadowgraph) and 813.328 ms (Schlieren) show the process entering the transition zone described in Figure 3. The plume in (a) becomes lighter in color and the corresponding Schlieren image in (d) depicts a weakening convection flow which indicates a change in process stability. The amount of ejected particles seems to decline compared to the images at 238.985 ms. At 1419.545 ms (Shadowgraph) and 906.914 ms (Schlieren) the transition is completed and light balling begins to occur. A full sequence of Schlieren images can be found in the Appendix.
Figure 5. Tip view pattern exposure at start, transition and after transition with light balling. Top: Shadowgraph Images without (row (a)) and with shielding gas flow (row (b)). Bottom: Schlieren without (row (c)) and with shielding gas flow (row (d)). Schematic depiction of scanning pattern at the bottom shows the current exposure position. PL = 250 W, vscan = 800 mm/s
Transition Light balling283.985 ms 1324.915 ms
283.985 ms 1419.545 ms
Flow direction
No flow5 mm
Point of viewCurrent exposure position Shadowgraph
Transition Light balling283.968 ms 813.328 ms 906.914 ms
283.968 ms 813.328 ms 906.914 ms
Flow direction
No flow5 mm
(a)
(b)
(c)
(d)
Current exposure position ShadowgraCurrent exposure position Schlieren
9111111 1419.545 ms
1324.915 ms
1530
283.985 ms Transition 5 ms Light balling
(a)
No flow
283.985 ms 5ms
(b)
Flow direction
Flow direction
•- - Current exposure position Shadowgraph 0 - - Current exposure position Schlieren Point of view !
::::::::.:::. ::::::.:::.:::::::::.::::::::::::::::::::::::.:.:·:::::::: ::.
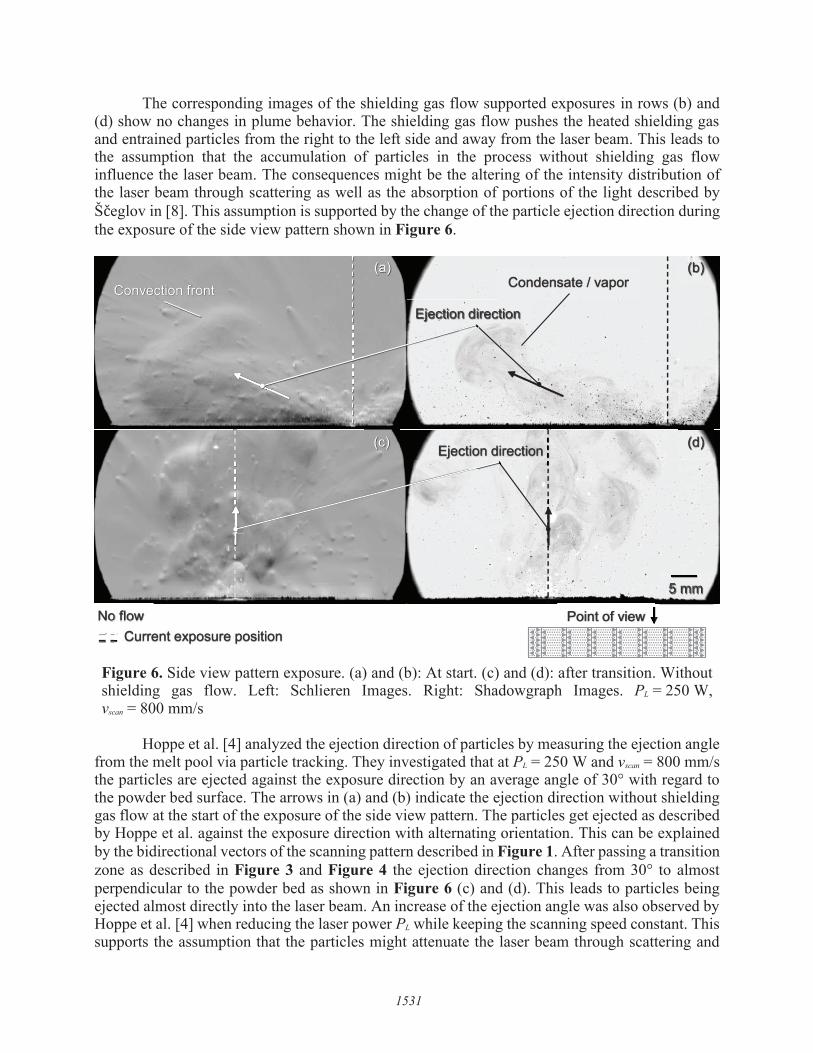
The corresponding images of the shielding gas flow supported exposures in rows (b) and (d) show no changes in plume behavior. The shielding gas flow pushes the heated shielding gas and entrained particles from the right to the left side and away from the laser beam. This leads to the assumption that the accumulation of particles in the process without shielding gas flow influence the laser beam. The consequences might be the altering of the intensity distribution of the laser beam through scattering as well as the absorption of portions of the light described by Š eglov in [8]. This assumption is supported by the change of the particle ejection direction during the exposure of the side view pattern shown in Figure 6.
Figure 6. Side view pattern exposure. (a) and (b): At start. (c) and (d): after transition. Without shielding gas flow. Left: Schlieren Images. Right: Shadowgraph Images. PL = 250 W, vscan = 800 mm/s
Hoppe et al. [4] analyzed the ejection direction of particles by measuring the ejection angle from the melt pool via particle tracking. They investigated that at PL = 250 W and vscan = 800 mm/s the particles are ejected against the exposure direction by an average angle of 30° with regard to the powder bed surface. The arrows in (a) and (b) indicate the ejection direction without shielding gas flow at the start of the exposure of the side view pattern. The particles get ejected as described by Hoppe et al. against the exposure direction with alternating orientation. This can be explained by the bidirectional vectors of the scanning pattern described in Figure 1. After passing a transition zone as described in Figure 3 and Figure 4 the ejection direction changes from 30° to almost perpendicular to the powder bed as shown in Figure 6 (c) and (d). This leads to particles being ejected almost directly into the laser beam. An increase of the ejection angle was also observed by Hoppe et al. [4] when reducing the laser power PL while keeping the scanning speed constant. This supports the assumption that the particles might attenuate the laser beam through scattering and
No flow
Convection front Condensate / vapor
5 mm
Point of view
Ejection direction
Ejection direction
(a)
(c)
(b)
(d)
Current exposure position
1531
(b)
Convection front
5mm
No flow Point of view ! ;; ;; Current exposure position
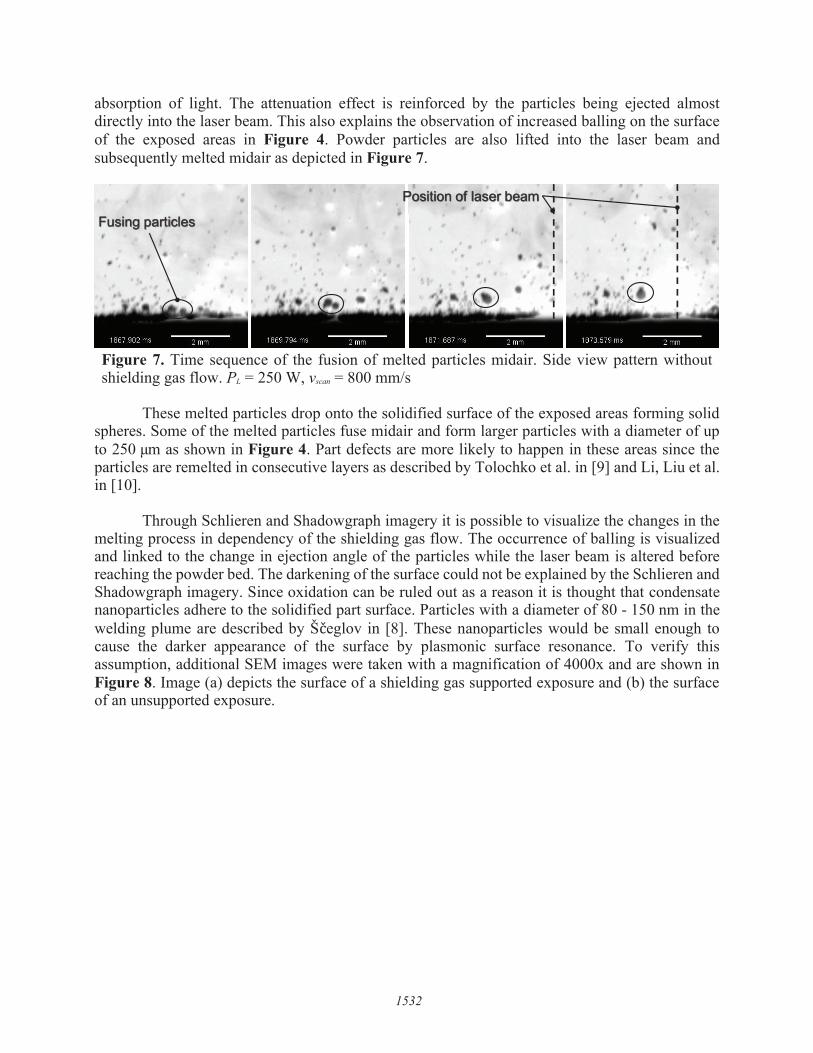
absorption of light. The attenuation effect is reinforced by the particles being ejected almost directly into the laser beam. This also explains the observation of increased balling on the surface of the exposed areas in Figure 4. Powder particles are also lifted into the laser beam and subsequently melted midair as depicted in Figure 7.
Figure 7. Time sequence of the fusion of melted particles midair. Side view pattern without shielding gas flow. PL = 250 W, vscan = 800 mm/s
These melted particles drop onto the solidified surface of the exposed areas forming solid spheres. Some of the melted particles fuse midair and form larger particles with a diameter of up to 250 μm as shown in Figure 4. Part defects are more likely to happen in these areas since the particles are remelted in consecutive layers as described by Tolochko et al. in [9] and Li, Liu et al. in [10]. Through Schlieren and Shadowgraph imagery it is possible to visualize the changes in the melting process in dependency of the shielding gas flow. The occurrence of balling is visualized and linked to the change in ejection angle of the particles while the laser beam is altered before reaching the powder bed. The darkening of the surface could not be explained by the Schlieren and Shadowgraph imagery. Since oxidation can be ruled out as a reason it is thought that condensate nanoparticles adhere to the solidified part surface. Particles with a diameter of 80 - 150 nm in the welding plume are described by Š eglov in [8]. These nanoparticles would be small enough to cause the darker appearance of the surface by plasmonic surface resonance. To verify this assumption, additional SEM images were taken with a magnification of 4000x and are shown in Figure 8. Image (a) depicts the surface of a shielding gas supported exposure and (b) the surface of an unsupported exposure.
Fusing particles
Position of laser beam
1532
Fusing particles
Position of laser beam .... ~ .... •-
1 I I
-•
1--- 5-q me -~ - mm
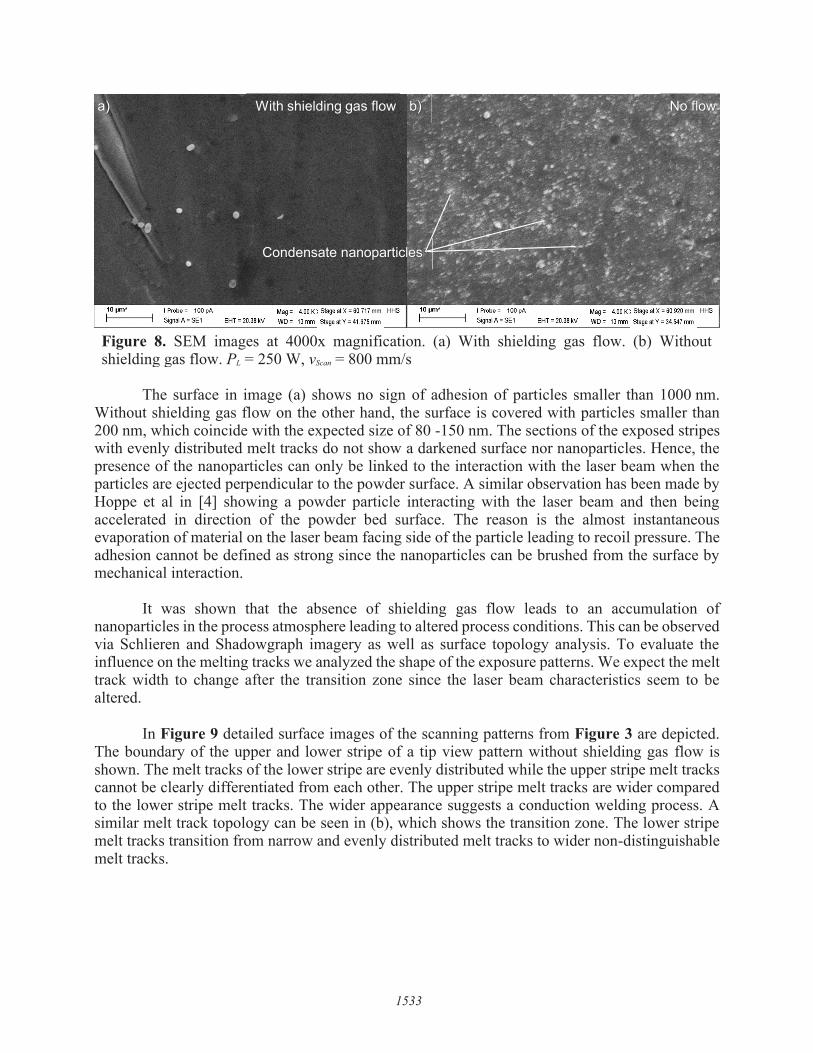
Figure 8. SEM images at 4000x magnification. (a) With shielding gas flow. (b) Without shielding gas flow. PL = 250 W, vScan = 800 mm/s
The surface in image (a) shows no sign of adhesion of particles smaller than 1000 nm. Without shielding gas flow on the other hand, the surface is covered with particles smaller than 200 nm, which coincide with the expected size of 80 -150 nm. The sections of the exposed stripes with evenly distributed melt tracks do not show a darkened surface nor nanoparticles. Hence, the presence of the nanoparticles can only be linked to the interaction with the laser beam when the particles are ejected perpendicular to the powder surface. A similar observation has been made by Hoppe et al in [4] showing a powder particle interacting with the laser beam and then being accelerated in direction of the powder bed surface. The reason is the almost instantaneous evaporation of material on the laser beam facing side of the particle leading to recoil pressure. The adhesion cannot be defined as strong since the nanoparticles can be brushed from the surface by mechanical interaction. It was shown that the absence of shielding gas flow leads to an accumulation of nanoparticles in the process atmosphere leading to altered process conditions. This can be observed via Schlieren and Shadowgraph imagery as well as surface topology analysis. To evaluate the influence on the melting tracks we analyzed the shape of the exposure patterns. We expect the melt track width to change after the transition zone since the laser beam characteristics seem to be altered. In Figure 9 detailed surface images of the scanning patterns from Figure 3 are depicted. The boundary of the upper and lower stripe of a tip view pattern without shielding gas flow is shown. The melt tracks of the lower stripe are evenly distributed while the upper stripe melt tracks cannot be clearly differentiated from each other. The upper stripe melt tracks are wider compared to the lower stripe melt tracks. The wider appearance suggests a conduction welding process. A similar melt track topology can be seen in (b), which shows the transition zone. The lower stripe melt tracks transition from narrow and evenly distributed melt tracks to wider non-distinguishable melt tracks.
a) b)
Condensate nanoparticles
With shielding gas flow No flow
1533
EHT = 20.38 kV 13 mm Stage at Y = 41.675 mm EHT =20.38kV 13 mm Stage at Y = 34.547 mm
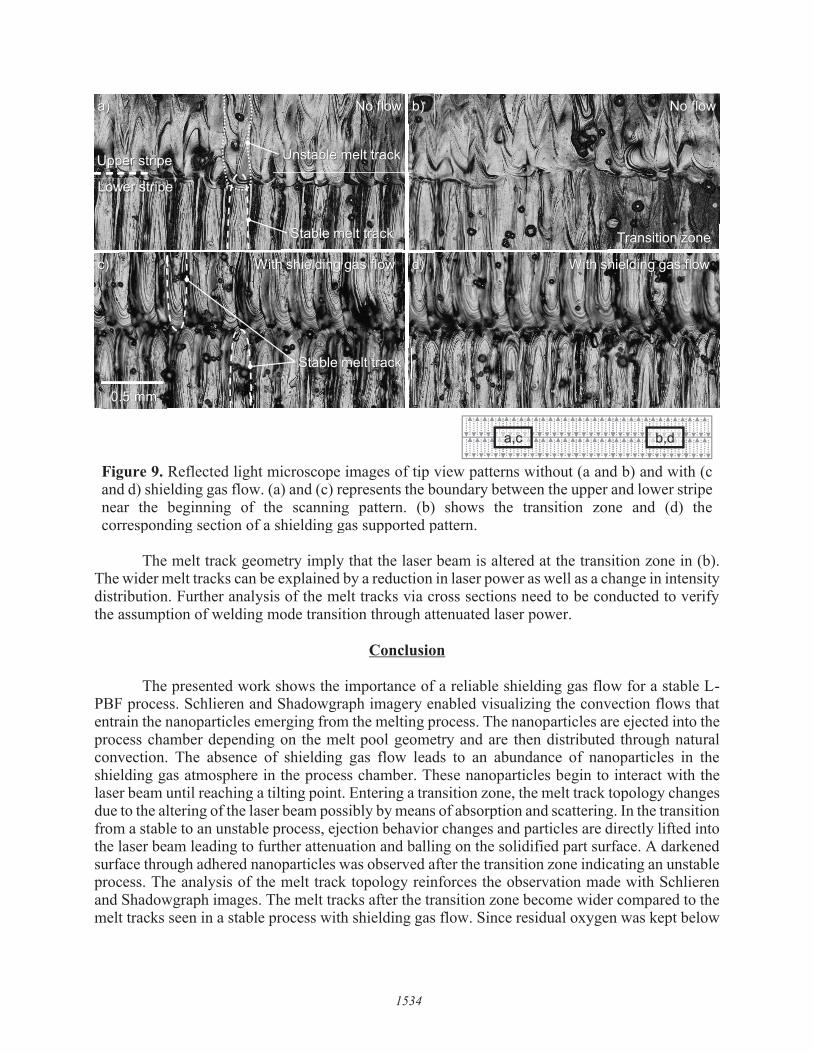
Figure 9. Reflected light microscope images of tip view patterns without (a and b) and with (c and d) shielding gas flow. (a) and (c) represents the boundary between the upper and lower stripe near the beginning of the scanning pattern. (b) shows the transition zone and (d) the corresponding section of a shielding gas supported pattern.
The melt track geometry imply that the laser beam is altered at the transition zone in (b). The wider melt tracks can be explained by a reduction in laser power as well as a change in intensity distribution. Further analysis of the melt tracks via cross sections need to be conducted to verify the assumption of welding mode transition through attenuated laser power.
Conclusion The presented work shows the importance of a reliable shielding gas flow for a stable L-PBF process. Schlieren and Shadowgraph imagery enabled visualizing the convection flows that entrain the nanoparticles emerging from the melting process. The nanoparticles are ejected into the process chamber depending on the melt pool geometry and are then distributed through natural convection. The absence of shielding gas flow leads to an abundance of nanoparticles in the shielding gas atmosphere in the process chamber. These nanoparticles begin to interact with the laser beam until reaching a tilting point. Entering a transition zone, the melt track topology changes due to the altering of the laser beam possibly by means of absorption and scattering. In the transition from a stable to an unstable process, ejection behavior changes and particles are directly lifted into the laser beam leading to further attenuation and balling on the solidified part surface. A darkened surface through adhered nanoparticles was observed after the transition zone indicating an unstable process. The analysis of the melt track topology reinforces the observation made with Schlieren and Shadowgraph images. The melt tracks after the transition zone become wider compared to the melt tracks seen in a stable process with shielding gas flow. Since residual oxygen was kept below
a,c b,d
a) b)
c) d)With shielding gas flow
No flow
Transition zone
With shielding gas flow
No flow
Upper stripe
Lower stripe
0.5 mm
Stable melt track
Unstable melt track
Stable melt track
1534
200 ppm, the most reasonably explanation for this behavior is the reduction of the effective laser power reaching the powder bed and a change of the beam profile. Following this work, further investigations on the altering of the beam profile and effective laser power reaching the powder bed need to be conducted. The concentration of nanoparticles leading to an unstable process are of special interest in a multi laser setup. Cross sectional analysis of the melt tracks would prove the transition into a conduction welding regime and explain the changes in particle ejection behavior.
Funding Information This work was supported by the "Research Campus - Public-Private Partnership for Innovation" funding initiative of the Federal Ministry of Education and Research (BMBF) of Germany.
References [1] B. Ferrar, L. Mullen, E. Jones, R. Stamp, C.J. Sutcliffe, Gas flow effects on selective laser
melting (SLM) manufacturing performance, Journal of Materials Processing Technology 212 (2012) 355–364.
[2] P. Bidare, I. Bitharas, R.M. Ward, M.M. Attallah, A.J. Moore, Fluid and particle dynamics in laser powder bed fusion, Acta Materialia 142 (2018) 107–120.
[3] P. Bidare, I. Bitharas, R.M. Ward, M.M. Attallah, A.J. Moore, Laser powder bed fusion in high-pressure atmospheres, Int J Adv Manuf Technol 99 (2018) 543–555.
[4] B. Hoppe, S. Enk, Schlieren and Shadowgraphy for Visualization of the Shielding Gas Dynamics in Laser Powder Bed Fusion (L-PBF), in: Proceedings of the 16th Rapid.Tech Conference Erfurt, Germany, 25 – 27 June 2019.
[5] G.S. Settles, Schlieren and Shadowgraph Techniques: Visualizing Phenomena in Transparent Media, Springer Berlin Heidelberg, Berlin, Heidelberg, 2001.
[6] T. Pichler, J. Schrage, J.H. Schleifenbaum, Increasing Productivity of Laser Powder Bed Fusion (L-PBF) by Qualifying and Processing Different Powder Qualities and Application of Intelligent Processing Strategies, in: Fraunhofer Direct Digital Manufacturing Conference DDMC 2018.
[7] J. Schindelin, I. Arganda-Carreras, E. Frise, V. Kaynig, M. Longair, T. Pietzsch, S. Preibisch et al., Fiji, Nature methods 9 (2012) 676–682.
[8] P. Š eglov, Study of vapour-plasma plume during high power fiber laser beam influence on metals. Zugl.: Moskau, Univ., Diss., 2012, Bundesanstalt für Materialforschung und -prüfung (BAM), Berlin, 2012.
[9] N.K. Tolochko, S.E. Mozzharov, I.A. Yadroitsev, T. Laoui, L. Froyen, V.I. Titov, M.B. Ignatiev, Balling processes during selective laser treatment of powders, Rapid Prototyping Journal 10 (2004) 78–87.
[10] R. Li, J. Liu, Y. Shi, L. Wang, W. Jiang, Balling behavior of stainless steel and nickel powder during selective laser melting process, Int J Adv Manuf Technol 59 (2012) 1025–1035.
1535
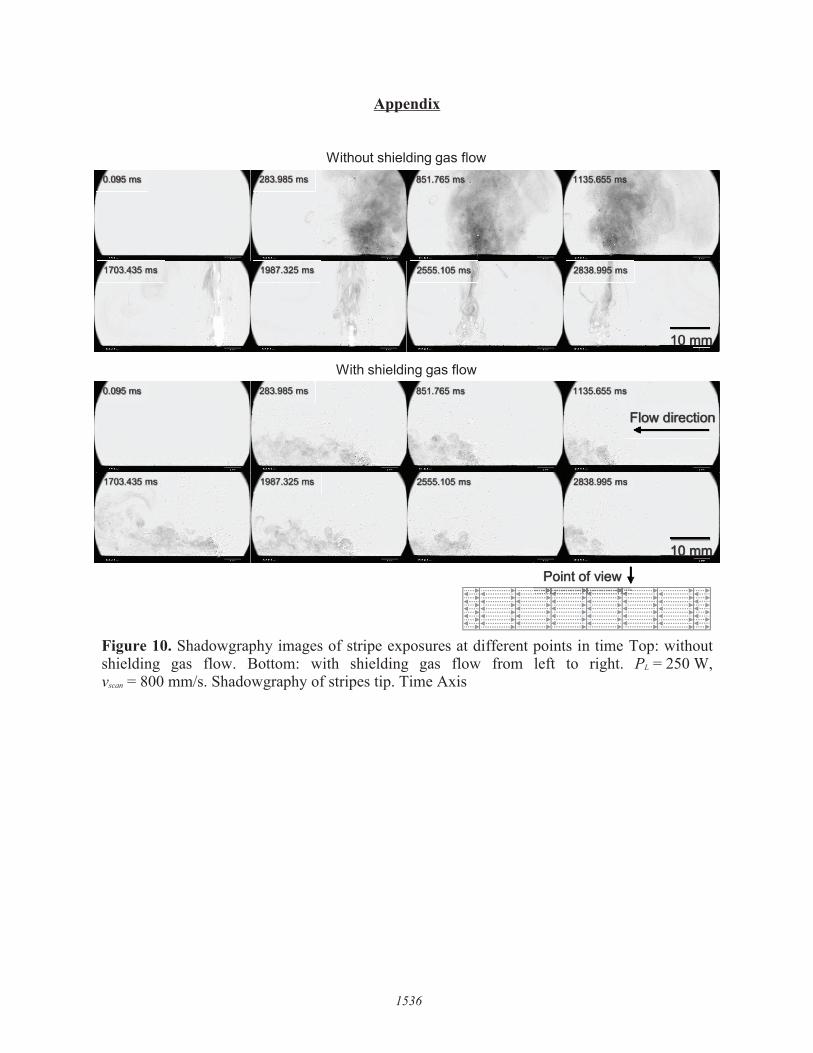
Appendix
Figure 10. Shadowgraphy images of stripe exposures at different points in time Top: without shielding gas flow. Bottom: with shielding gas flow from left to right. PL = 250 W, vscan = 800 mm/s. Shadowgraphy of stripes tip. Time Axis
Without shielding gas flow
With shielding gas flow
Flow direction
1703.435 ms
0.095 ms
1987.325 ms
283.985 ms
2555.105 ms
851.765 ms
2838.995 ms
1135.655 ms
1703.435 ms
0.095 ms
1987.325 ms
283.985 ms
2555.105 ms
851.765 ms
2838.995 ms
1135.655 ms
10 mm
10 mm
Point of view
1536
0.095 ms 283 985 ms 1135.655 ms
Flow direction
1703.435 ms 1987.325 ms 2838.995 ms
Point of view ! n 1·1·1 ·1 ;- · II ............................. , ............ , ............ , ............ , ................ . ..... ............. .. ........... ............. ............. ............. .. ........... ... . .... ............. ............ , ............ , ............ , ............ , ................ . ..... ............. ............. ............. ............. ............. .. ........... ... . .... ............. ............ , ............ , ............ , ............ , ................ . ..... ............. ............. ............. ............. ............. , ............ ... . .... ............. ............. ............. ............ , ............ , ................ . ..... ............. , ............ , ................................................... ... . .... ............ , .......................... ............ , ............ , ............. ... . ..... ............. ............. , ............ ....................................... ... .