Analysis of the Determinants of Financial Inclusion in Central and … · 2016-08-12 · 1 Analysis...
44
Analysis of the Determinants of Financial Inclusion in Central and West Africa* † Issouf SOUMARÉ, ISE, Ph.D., PRM, FRM, ASC Université Laval, Quebec, Canada Email: [email protected] Fulbert TCHANA TCHANA, ISE, Ph.D. The World Bank, Washington D.C., USA Email: [email protected] Thierry Martial KENGNE, ISE Université Toulouse 1 Capitole, Toulouse, France Email: [email protected] Version: March 2015 * Thierry Martial Kengne expresses his gratitude to the ENSEA (Abidjan, Côte d’Ivoire) community for their commitment and kindness during his studies. We thank Djilo Emmanuelle R. Tchatchouang for his valuable research assistance at the earlier stage of this project. All errors and omissions are the authors’ sole responsibility. We thank participants at the 11 th Annual Entrepreneurship Conference in Kampala, Uganda. † The views expressed in this paper are not necessary those of the World Bank Group. Fulbert Tchana Tchana would like to thank Saniya Ansar and Leora Klapper for their help with some estimates.
Transcript of Analysis of the Determinants of Financial Inclusion in Central and … · 2016-08-12 · 1 Analysis...

Analysis of the Determinants of Financial Inclusion in Central and
West Africa*†
Issouf SOUMARÉ, ISE, Ph.D., PRM, FRM, ASC Université Laval, Quebec, Canada
Email: [email protected]
Fulbert TCHANA TCHANA, ISE, Ph.D.
The World Bank, Washington D.C., USA
Email: [email protected]
Thierry Martial KENGNE, ISE
Université Toulouse 1 Capitole, Toulouse, France
Email: [email protected]
Version: March 2015
* Thierry Martial Kengne expresses his gratitude to the ENSEA (Abidjan, Côte d’Ivoire) community for their
commitment and kindness during his studies. We thank Djilo Emmanuelle R. Tchatchouang for his valuable research
assistance at the earlier stage of this project. All errors and omissions are the authors’ sole responsibility. We thank
participants at the 11th Annual Entrepreneurship Conference in Kampala, Uganda. † The views expressed in this paper are not necessary those of the World Bank Group. Fulbert Tchana Tchana would
like to thank Saniya Ansar and Leora Klapper for their help with some estimates.

1
Analysis of the Determinants of Financial Inclusion in Central and West
Africa
ABSTRACT
Using data from the Global Financial Inclusion database (Global Findex) of the World Bank, this
study attempts to identify and analyze the determinants of financial inclusion in Central and West
Africa, two of the least financial inclusive regions of the Africa continent. The findings indicate
that access to formal finance in the two regions is mainly driven by individual characteristics
such as gender, education, age, income, residence area, employment status, marital status,
household size and degree of trust in financial institutions. However, Central Africa and West
Africa differ with the entire Africa region on a number of important determinants of access to
finance. Specifically, educated, working-age, urban resident and full-time employed are
significant individual characteristics of access to formal account in both regions and in Africa.
However, being male and/or married are positive determinants of financial inclusion for Central
Africa and Africa, whereas income is significant in West Africa and Africa. In addition,
household size has a negative impact on account ownership in West African and not in Central
Africa. When we use the other financial inclusion indicators (saving, borrowing or frequency of
use), the above determinants remain all significant for Africa, but not necessarily for Central
Africa or West Africa, where they have different degree of significance. As policy
recommendations, governments and their partners in these regions should adopt or strengthen
regulatory laws to better protect financial services consumers, enlarge population access to
education, ease access to finance for the vulnerable groups (women, youth, poor, etc), and
continue their effort to increase the number of permanent and stable jobs created with special
focus on gender and marital status in Central Africa and income and household size in West
Africa.
Keywords: Access to finance; Financial inclusion; Global Findex; Central Africa; West
Africa.
JEL: G20, R1

2
I. INTRODUCTION
Finance, by allowing optimal allocation of resources in the economy, contributes to
economic growth (e.g., Bekaert et al. (2005); Henry (2000); Klein and Olivei (2008); Levine
(1997); Levine et al. (2000); Pagano (1993); among many others). Financial institutions play
crucial financial intermediary role between funds providers and funds seekers by the financial
services they provided; therefore, it is capital to put in place an enabling environment for the
furniture of efficient financial services.
During the last decades, the African financial system has grown rapidly, e.g., Allen et al.
(2013), Allen, Otchere and Senbet (2011), Beck and Cull (2013), Beck, Fuchs and Uy (2009).
From state owned banks in the 1980s subjected to very restrictive regulation, financial
liberalisation and globalisation lead to major changes in the financial systems of many countries
throughout the continent. According to Beck and Cull (2013), many financial markets indicators
have improved from 2000 to 2011. For instance, the median value of the liquid liabilities of the
economy as a percentage of GDP grew from 20% to 31%, domestic credits over GDP from 11%
to 18%, and total deposits as a percentage of GDP from 12% to 22%. These improvements
coincide with a high economic growth rate on the continent during the same period, the highest
economic growth rate in the World after Asia: Africa has recorded annual economic growth rate
of more than 5% over that period.
Despite this steady economic growth, a large part of the population remains marginalised
(excluded from the financial system) and do not have access to formal financial services,
especially the poor, the young and women. Demirguc-Kunt and Klapper (2012a) in their
descriptive analyses of the survey database « Global Financial Inclusion » (so called Global
Findex) show that less than a quarter (23%) of adults over age 15 years living in Africa have a
bank account at a formal financial institution, the percentage is 50% for the whole sample and
41% for the developing world. To tackle the lack of access to basic financial services, the concept
of « financial inclusion » or « inclusive finance » has been introduced recently. It refers to
creating an enabling environment and developing innovative financial solutions to facilitate
access to financial services to a bigger part of the population, by lifting the barriers. Without an
inclusive financial system, the poor will continue to use their own limited savings to finance their
livings and businesses, and hence, increase inequality and impair economic growth. The lack of

3
data on access to finance was one main obstacle to conduct thorough and deep analyses on
financial inclusion across countries or regions. Since 2011, the Global Findex database available
at the World Bank, which surveyed populations in 148 economies around the world, is closing
the gap. However, given the high rate of poor peoples in Sub Saharan Africa, it makes sense to
pay more attention to this part of the World.
The objective of this study is to identify and analyse the determinants of access to financial
services in the Economic Community of the West African States (ECOWAS) and the Economic
Community of Central African States (ECCAS). Two main reasons justify our focus on these two
regional economic communities (RECs). Firstly, these regions are the least inclusive regions in
Sub-Saharan Africa (only 11% and 23% of adults have access to finance in Central and West
Africa, respectively). Secondly, these two RECs contain two of the most advanced monetary and
custom unions of the continent, namely CEMAC and UEMOA.1 More specifically, the study
aims to: (i) identify and analyse the determinants of access to formal financial services in Central
and West Africa; (ii) conduct comparative analyses between the two regions, and between them
and Africa; and finally (iii) formulate policy recommendations for policy makers of the two
regions for more financial inclusion.
The (theoretical and empirical) literature is rich on evidences that financial inclusion
contributes to the improvement of the living conditions of the poor and other marginalised or
vulnerable groups of the society by enabling them to access to finance. In particular, there are
more evidences on the proven significant benefits of financial inclusion for households and
businesses (see for instance: Aportela (1999); Ashraf et al. (2010); Banerjee et al. (2010); Collard
et al. (2003); Dabla-Norris et al. (2014); Dupas and Robinson (2009); Karlan and Zinman (2010);
Kempson and Whyley (1999); Marshall (2004); among many others). Our paper complements the
few recent studies conducted on financial inclusion using the World Bank Global Findex
database, e.g., Allen, Carletti, et al. (2013); Allen, Demirguc-Kunt, et al. (2012); Anson et al.
(2013); Demirguc-Kunt and Klapper (2012a, 2012b); Demirguc-Kunt et al. (2013); Klapper and
Singer (2013). In the next section on the literature review, we provide more details on these
previous studies.
1 CEMAC is the French acronym of Central African Economic and Monetary Community (in French: Communauté
Économique et Monétaire de l’Afrique Centrale). UEMOA is the French acronym of West African Economic and
Monetary Union (in French: Union Économique et Monétaire Ouest Africaine).
4
We, however, focus on Central and West Africa regions in order to bring a value added to
the existing findings and make more specific policy recommendations. As we argued above,
these two regions are the least financially inclusive in Africa. They also contain the two most
advanced monetary and custom unions of the continent. Hence, we will conduct a global analysis
over the entire Central Africa and West Africa regions, and carry comparative analyses between
the two regions, to have more practical policy recommendations for the decision makers of these
regions. The database that we use covers ten (10) countries of the ECOWAS region and eight (8)
countries of the ECCAS region.2 We use the following four financial inclusion variables: (1)
“owned an account at a formal financial institution”; and for those who have an account, (2)
“have saved in a formal account over the past 12 months”; (3) “have borrowed from a formal
financial institution over the past 12 months”; and finally, (4) “have used frequently the account
for cash withdrawals or payments during a month”.
We find that, like in the rest of the African continent, the main barriers to access formal
financial services in Central and West Africa are: “not enough money”, “lack of necessary
documentation”, “high costs of financial services”, “distance to formal financial institutions” and
“lack of confidence in financial institutions”. The proportion of adult population (more than 15
years old) who owns a formal account is 23% in West Africa and 11% in Central Africa. These
proportions are relatively low compared to other regions of the continent, namely South Africa
(51%) and East Africa (28%). Moreover, our analysis shows that financial inclusion in the two
regions is positively influenced by the following individual characteristics: secondary or higher
education level, working age group, high income quintiles, urban resident, full-time employed,
married, smaller household size and trust in the financial institutions. Nonetheless, their impacts
are different from region to region and depending on the financial inclusion indicator used. In
addition, our findings reveal significant differences on the characteristics of those who have
access to financial services in the two regions and in Africa taken as aggregate. More specifically,
using the account ownership at a formal financial institution as the indicator of access to finance,
2 The sample for ECOWAS is composed of 10 countries: 6 (out of 8) UEMOA countries (Benin, Burkina Faso, Mali,
Niger, Senegal, Togo) and 4 (out of 6) WAMZ countries (Ghana, Guinea, Nigeria, Sierra Leone). Note that we do
not have data for 2 UEMOA countries (Côte d’Ivoire, Bissau Guinea) and 2 WAMZ countries (Gambia, Liberia).
The sample for ECCAS is composed of 8 countries (out of 10): 5 (out of 6) from CEMAC – Cameroon, Congo,
Gabon, Central African Republic and Chad; and 3 outside CEMAC – Angola, Burundi and Democratic Republic of
Congo. We do not have data for the following countries: Equatorial Guinea (CEMAC member) and Sao Tome &
Principe.
5
we find that, unlike in Africa (see Klapper and Singer (2013)), gender is a very strong
determinant of access to finance in ECCAS region, while gender and marital status are not
significant determinants of account ownership in ECOWAS. In addition, household size is a
significant determinant of access to finance in West Africa, but not in Central Africa. These
results confirm that the leading forces driven low access to finance in these two regions are not
always the same as in the entire Africa region, thus a need to focus on specific issues in each of
these regions.
In addition, the differences in results using the three other indicators of access to finance
related to the use of the account (saving, borrowing, frequency of use) prove a sharper contrast
with results for Africa found in Klapper and Singer (2013). In fact, only few potential
determinants are strongly significant for ECCAS and ECOWAS, while there are almost all
significant in Africa. Specifically, when we focus on the “saving” indicator, only income and
employment status become significant determinants in ECCAS, while in ECOWAS, only
education level, age and the degree of trust in the financial institutions are significant. When we
focus on the “borrowing” indicator, only education and marital status have strong significant
impacts in ECCAS, whereas in ECOWAS, education, age, income and household size are the
most significant determinants. Similar trends are observed with the frequency of use indicator.
However, the result on these last three financial inclusion indicators data might be less robust
since less than 25% of the sample provide a valid answer to questions related to these indicators.
Based on these findings, we formulate the following recommendations for decision makers
in the two regions. First, more incentive programmes should be put in place to facilitate access to
financial services for youths, women and other vulnerable groups. This can be done, for instance
by: promoting the benefits of using formal financial services in schools and local communities
and associations; encouraging these targeted population to open accounts at formal banks by
depositing their bursary and other governmental family allocations in their bank accounts;
alleviating conditions to open an account for this vulnerable group of population, for instance, by
simplifying the documentation requirements and reducing the financial services fees. Nowadays,
with the increasing number of mobile phones users among the population in these countries,
financial services providers have a good opportunity to create accessible financial products and
services which better respond to the specific needs of different groups. Second, governments and
their development partners should encourage and facilitate access to education. Finally, countries

6
in the two regions should adopt more aggressive stable jobs creation policies; this will certainly
increase the income level of households and then facilitate access to financial services. More
specifically, ECOWAS countries should engage in reforms that could provide incentive to
household of large size as well actions that could improve the population trust into the financial
sector. This could be done by building awareness on financial products, bringing financial service
providers closer to potential clients, and taking actions to increase the integrity of actors in the
financial sector. Besides, for ECCAS countries, actions that could help women to access to
finance should be the main focus. Policy makers should consider carrying more studies to find
out what are the main constraints for women in this region and take appropriate actions.
The remainder of the paper is structured as follows. In section 2, we present the literature
review on the more recent works on financial inclusion. In section 3, we present the methodology
and describe the variables and the data. In sections 4 and 5, we present and analyse the empirical
results. We first provide an overview and descriptive analyses of financial inclusion in the two
regions, and next, conduct further econometric regression analyses. Finally, we conclude in the
last section 6 and formulate policy recommendations.

7
II. LITERATURE REVIEW
This section reviews the most recent works on financial inclusion relevant for our research
questions and done mainly using the survey data of the Global Findex database.
Demirguc-Kunt and Klapper (2012a) provide the first descriptive analysis of the Global
Findex database, a new set of indicators to measure access to finance (account ownership,
savings, borrowing, use of accounts…) by adults in 148 economies around the World. From the
survey, fifty percent (50%) of adults of age 15 years and more in the world have an account at a
formal financial institution. This percentage drops to 41% for the developing world and 23% for
Africa. The most cited barriers to access to finance are the lack of money, the high costs of
financial services, the physical distance to formal financial institutions, the lack of documentation
and the lack of confidence in the financial institutions. In a parallel paper, Demirguc-Kunt and
Klapper (2012b) provide a detailed description of financial inclusion in Africa. Their study show
that Africa lags behind other developing world regions in terms of financial inclusion; they
pointed the high cost, the physical distance and the lack of documentation to be the main
obstacles to financial inclusion in Africa. These obstacles tend to dissipate as the per capita GDP
increases, and are observed less in countries with a better competitive environment, opened, more
market friendly, and with better regulated financial system with more transparent and developed
information infrastructure. Allen et al. (2012) found more or less similar results. Indeed, these
authors studied the individual and country characteristics associated to the use of formal financial
accounts and the efficient policies for people more likely to be excluded from the formal financial
system such as the poor and the people living in rural areas. Using a Probit model, they found
that owning an account and frequent usage of accounts are associated to an environment more
favorable to access to financial services, characterised by low account management costs,
geographical accessibility of financial intermediaries, and less documentations requirements to
open an account.
Beck and Cull (2013) studied the current state of Africa’s banking system, particularly
those in Sub-Saharan Africa, and discussed recent financial innovations that can improve
traditional models used in Africa. They showed that Africa banking system has low depth but is
stable. African banks are well capitalised and liquid, but lend less to private sector compared to
banks in other developing regions. Moreover, households and enterprises are less likely to use

8
financial services in Africa than their pairs in other developing countries. In sum, Africa banking
system has low depth compared to the rest of the world, and is less inclusive: in Africa there exist
only 15 bank accounts per 100 adults, whereas it is 42 in the rest of the world. Moreover, only
21% of enterprises indicated to have used a credit line or have received a loan from a formal
bank, this proportion is 43% out of Africa. Similarly, a median 16.5% of adults in Africa have
indicated to own an account at a formal bank, this number is 21% elsewhere. According to the
authors, the main reasons for the low development of Africa banking system are: (i) the small
size of many economies, which doesn’t allow financial service suppliers to gain economies of
scale; (ii) also most enterprises operated in the informal sector, they do not have the legal
documentation, which increases the costs and disqualifies many of them to access financial
services; finally, (iii) the volatility due to unstable income and informality, but also the
dependence of many African countries to exports, increases the cost and risk of management.
Governance issues have also been mentioned.
Hence, less than a quarter of adults in Africa have an account at a formal financial
institution. This low penetration rate of formal accounts in Africa calls for more attention on the
alternative informal methods used by the populations for borrowing and savings. Exploring this
idea, Klapper and Singer (2013) used the Global Findex database to study the informal methods
used by the population to save and borrow. They found that the majority of adults in Africa used
informal methods to save and borrow. According to them, close to 100 million adults in Sub-
Saharan Africa use community-based savings methods such as rotating savings and credit
associations, 38% of adults declared to have borrowed money from friends or family over the last
12 months. Using a Logit multinomial and Probit models, the authors showed that women, the
poorest, the less educated, those living in rural areas and middle age adults are less likely to have
a formal account. The results also showed that the employment status is a key determinant of
owning an account. Adults employed by an employer are more likely to hold an account than
those self-employed. At the same time, unemployed workers are less likely to own an account
than independent workers.
One must therefore find optimal strategies to help the vulnerable groups excluded from the
more secured formal financial system to access it progressively. One strategy can be the
promotion of post offices. In that respect, Anson et al. (2013) studied the central role that can be
played by post offices in the promotion of financial inclusion because of their accessibility and

9
widespread geographical location in rural and poor areas. Indeed, the Global Findex database
showed that 12% of adults in developing countries have an account in post offices, the majority
of these post office account holders are Africans (24%). Using a Logistic multinomial regression,
Anson et al. (2013) showed that post offices are more likely than traditional financial institutions
to provide an account to individuals from vulnerable groups such as the poorest, the less educated
as well as the disabled.
Moreover, Allen et al. (2013) explored whether innovations in financial services, such as
mobile banking services, can reduce the gap observed with regards to access to financial services
in Africa. Indeed, the development of mobile banking in Africa started in Kenya with M-Pesa,
which constitutes an easy and accessible way to transfer and receive money using mobile phones,
especially for the poor and those living in remote areas. According to the Global Findex database,
in 2011, 67% and 60% of adults in Kenya were using mobile phones to, respectively, receive and
transfer money. This service has expanded throughout many other countries like Angola, the
Democratic Republic of the Congo, Nigeria, Soudan and Uganda. To study the effect of mobile
banking in the African financial sector, the authors conducted regressions using the Ordinary
Least Squares (OLS) method using three dependent variables. These variables are essentially: the
percentage of adults using a mobile phone to send money, to receive money, and to pay bills. In
addition, they added dummy variables to control for the regions (in Asia and Africa). The results
suggested that the penetration has been more pronounced in Sub-Saharan Africa than in other
regions. Mobile banking has proven successful in receiving and sending money. Therefore, an
important financial inclusion requires taking steps toward new approaches in terms of service
delivery, such as mobile banking.
Despite these very interesting and up-to-date studies, to our knowledge no paper has
studied the specific case of Central and West Africa, and conduct comparative analysis within
these regions, in order to draw sound policy recommendations for the countries of the regions.
Our study is filling that vacuum.

10
III. METHODOLOGY AND DATA
In this section, we present the methodology and the data used to conduct this study.
III.1. Methodology
Most papers in the literature, (see e.g. Allen et al. (2012)), use either a Probit or Logit
model where the dependent variable is a combination of the following binary variables: “owning
a formal account” (Account); “having saved in past 12 months” (Saving); “having borrowed in
past 12 months” (Borrowing); and the frequency of account usage in a month (Frequency). For
our analysis, we will use a modified version of this model: the « cluster specific fixed
effect model », so called CSFE, a method that is well fitted for data with countries. In our model
countries are defined as « clusters » (see e.g. Cameron and Trivedi, 2005).
The econometric model is presented as follows:
, ; , (1)
where i is for individuals and j is for countries (« clusters »). Our database contains 10 countries
in the ECOWAS region and 8 countries in the ECCAS region, with each having 1000 surveyed
individuals. We assume that the country characteristics ( ) are fixed and constants.
represents the vector of individual characteristics.
To better measure access to finance in our set of countries, we use four dependent
variables to estimate the regression model (1); these four variables are:
1. Account (Own a formal account): which takes the value of 1 if individual i in country j
owns a bank account at a formal financial institution, and 0 otherwise.
2. Saving (Have saved in the past 12 months): for individuals owning an account, it takes the
value of 1 if individual i of country j has saved in the past 12 months, and 0 otherwise.
3. Borrowing (Have borrowed over the past 12 months): for individuals owning an account,
it takes the value of 1 if individual i of country j has borrowed at his bank in the past 12
months, and 0 otherwise.
4. Frequency (The frequency of usage of the account in a month): for individuals owning an
account, it takes the value of 1 if individual i of country j has performed at least three (3)

11
withdrawal operations3 in his account in a given month, and 0 otherwise. These operations
included cash withdrawal, electronic payments or purchases, checks, or any time money
has been withdrawn from the account by the individual himself or others.
For each dependent variable, we define if
otherwise , where
is the latent variable
associated to . The estimation for the dependent variable “Account” is done using the entire
population of the sample. For the other three dependent variables (“Saving”, “Borrowing”, and
“Frequency”), the estimations are restricted to the population of individuals owning an account at
a formal financial institution.
III.2. Variables and sources of data
We use mainly the survey data from the “Global Financial Inclusion”, so called Global
Findex, conducted in 2011 in 148 economies around the world and available at the World Bank.4
Our sample will be restricted to eighteen (18) countries of Central and West Africa included in
the database. Thus, the sample comprises ten (10) countries from the Economic Community of
West African States (ECOWAS) region and eight (8) countries from the Economic Community
of Central African States (ECCAS) (i.e. 18 000 observations with 1000 observations per
country). The ECOWAS countries included in the sample are six (6) from UEMOA (Benin,
Burkina Faso, Mali, Niger, Senegal and Togo) and four (4) from WAMZ (Ghana, Guinea,
Nigeria and Sierra Leone).5 The ECCAS sample is composed of five (5) CEMAC countries
(Chad, Cameroon, Central African Republic, Congo and Gabon) and three (3) countries outside
CEMAC (Angola, Burundi and the Democratic Republic of Congo).6
As in Allen et al. (2012) and Klapper and Singer (2013), we introduce socio-economic
characteristics of the individuals, by assuming that they may be significant factors to explain
3 This concerns only withdrawal operations, savings and borrowing have already being captured by the other
variables above.
4 See Demirguc-Kunt and Klapper (2012a) for a detailed description of the Global Findex database or visit the
following website for more recent works on financial inclusion using this database:
http://econ.worldbank.org/WBSITE/EXTERNAL/EXTDEC/EXTRESEARCH/EXTPROGRAMS/EXTFINRES/EX
TGLOBALFIN/0,,contentMDK:23147627~pagePK:64168176~piPK:64168140~theSitePK:8519639,00.html.
5 Our database does not contain data for two countries in UEMOA (Côte d’Ivoire, Bissau Guinea) and two countries
in WAMZ (Gambia, Liberia).
6 We do not have data for the following ECCAS countries: Equatorial Guinea (CEMAC member) and Sao Tome &
Principe.

12
access to financial services or financial inclusion in the two regions. These variables obtained
from the Global Findex database are:
- Female (0/1): indicates whether the respondent is a female or not, assuming that in Africa
it is more difficult for women than men to own an account and to access financial
services.
- Education: defines the education level with three modalities: primary or less education,
secondary education, and tertiary and more education. We expect the education level to
have a positive impact on the likelihood of using the financial services. Indeed, the more
educated the individual is, more ability he has to understand most of the complexity of
financial products.
- Age: refers to the age of the individual. Indeed, in many past studies, the young have been
identified as a vulnerable group more exposed to poverty.
- Age^2: is the age squared. We assume that the use of financial services increases with age,
but decreases at some age threshold. The age-squared captures this non-linear effect.
- Income: income quintiles are used to capture income level. We assume that the
probability of owning an account increases with the income level. We consider five
categories of income quintiles: Poorest (20%), Second poorest (20%), Third poorest
(20%), Fourth poorest (20%) and Fifth poorest (20%).
- Rural (0/1): dummy that takes the value of 1 if the respondent lives in a rural area and 0
otherwise. A rural area is defined as a town or rural village with less than 50,000
inhabitants. If this information is unavailable, a rural area is based on the interviewer’s
perception of whether a respondent lives in a rural area, on a farm, in a small town, or in a
village. From the existing literature, access to financial services seems to be more difficult
for people living in rural areas in Africa.
- Employment Status: indicates if the respondent is employed, unemployed or out of the
workforce. Individuals who are employed are expected to have more easy access to
financial services than those unemployed.
- Marital Status: indicates if the respondent is married, divorced, widowed or single.
- Confidence in Financial Institutions (0/1): dummy that takes the value of 1 if the
respondent indicated to have confidence in the financial institutions or banks and 0
otherwise.

13
- Log of Household Size: the Logarithm of the household size. As argued by Allen et al.
(2012), adults who live in larger households (including a spouse) are more likely to use
someone else’s account, and less likely to own their own account.
Table 1 below summarizes the variables descriptions and data sources.

14
Table 1 : Variables descriptions and sources of data
Variable Description Source of data
Account The respondent owns (or not), alone or with someone, an account in a formal financial institution. It takes 1 if the individual owns an account,
and 0 otherwise.
Global Findex
Saving
The respondent has (or not) saved in a formal account in the past 12
months. It takes 1 if the individual has saved in the past 12 months, and 0 otherwise.
Global Findex
Borrowing
The respondent has (or not) borrowed from a formal financial institution.
It takes 1 if the individual has borrowed in the past 12 months, and 0 otherwise.
Global Findex
Frequency
The respondent has (or not) withdrawn money from his account at least 3
times in a typical month. It includes cash withdrawal, electronic payments
or purchases, checks, or whenever money has been withdrawn from the holder account by him or others. It takes 1 if the individual has used the
account as specified above, and 0 otherwise.
Global Findex
Female Dummy that takes 1 if the respondent is a female, and 0 otherwise. Global Findex
Education Instruction level of the respondent: Primary education or less; Secondary
education; and Tertiary and more. Global Findex
Age Age of the respondent in years. Global Findex
Age^2 Age in years of the respondent squared. Global Findex
Income Quintile Income quintiles of the respondent: Poorest (20%), Second poorest (20%),
Third poorest (20%), Fourth poorest (20%) and Fifth poorest (20%). Global Findex
Rural Dummy that takes the value of 1 if the respondent lives in a rural area and 0 otherwise.
Global Findex
Employment Status The respondent is employed full-time or part-time (self-employed or by an
employer), unemployed, or out of the workforce. Global Findex
Marital status The respondent is married, divorced, widowed or single. Global Findex
Confidence in
Financial Institutions
Dummy that takes the value of 1 if the respondent indicated to have
confidence in the financial institutions or banks and 0 otherwise. Global Findex
Log of Household Size Logarithm of household size. Global Findex
15
IV. OVERVIEW OF FINANCIAL INCLUSION IN CENTRAL AND
WEST AFRICA
In this section, we provide an overview of the barriers to formal finance and financial
inclusion in Central and West Africa and provide descriptive analysis of potential individual
characteristics of financial inclusion. We also analyse the correlations between potential
determinants of financial inclusion and the variables capturing access to financial services using
the Khi-squared statistical test. In the next section, we will perform an econometric analysis to
deepen our understanding of financial inclusion in these two regions.
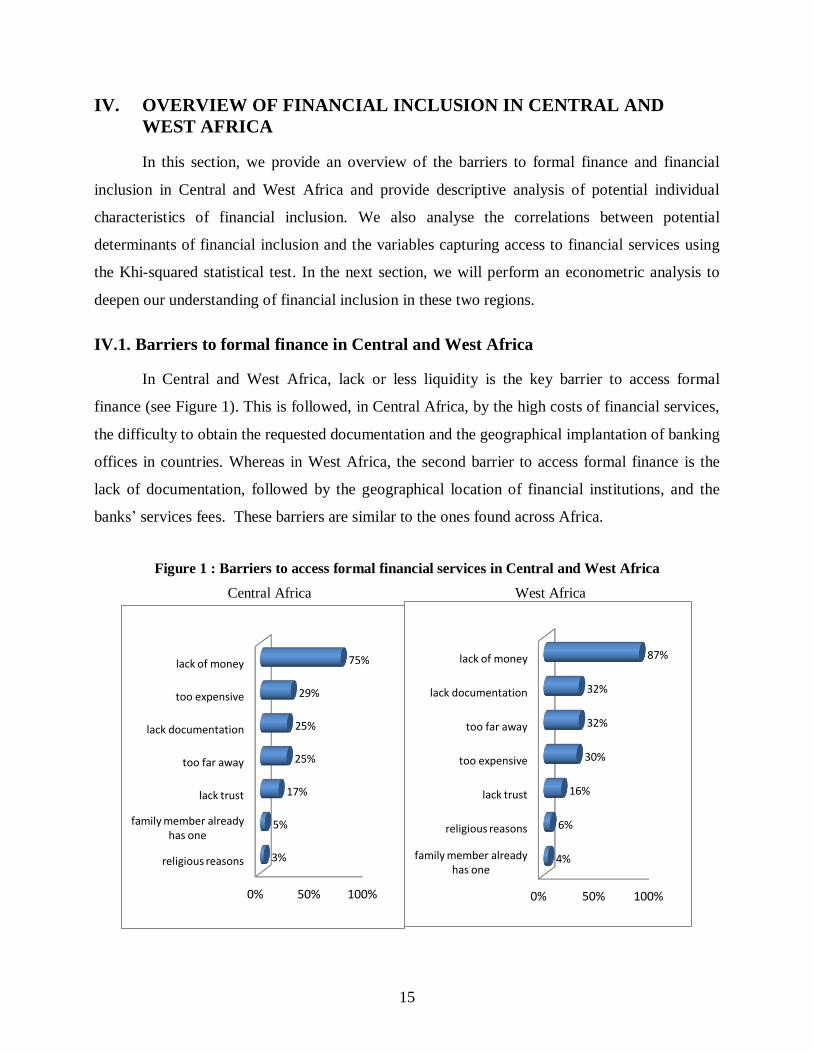
IV.1. Barriers to formal finance in Central and West Africa
In Central and West Africa, lack or less liquidity is the key barrier to access formal
finance (see Figure 1). This is followed, in Central Africa, by the high costs of financial services,
the difficulty to obtain the requested documentation and the geographical implantation of banking
offices in countries. Whereas in West Africa, the second barrier to access formal finance is the
lack of documentation, followed by the geographical location of financial institutions, and the
banks’ services fees. These barriers are similar to the ones found across Africa.
Figure 1 : Barriers to access formal financial services in Central and West Africa
Central Africa West Africa
0% 50% 100%
religious reasons
family member already has one
lack trust
too far away
lack documentation
too expensive
lack of money
3%
5%
17%
25%
25%
29%
75%
0% 50% 100%
family member already has one
religious reasons
lack trust
too expensive
too far away
lack documentation
lack of money
4%
6%
16%
30%
32%
32%
87%

16
Comparison within each sub-regions of the two RECs reveals that barriers to access to
formal finance are more or less in the same order within the two sub-zones of each region as
shown in Table 2. However, in Central Africa, not enough money, lack of necessary
documentation and too far away from financial institutions are more pronounced in CEMAC
countries than in non-CEMAC zone; whereas in West Africa, not enough money, too far away
from formal financial institutions and the lack of trust in financial institutions are more
pronounced in UEMOA than in WAMZ. Note that CEMAC and UEMOA are two monetary
zones.
Tableau 2 : Barriers to financial inclusion in Central and West Africa
ECCAS ECOWAS
Barriers CEMAC Non CEMAC UEMOA WAMZ
Family member already has an account 5% 4% 3% 6%
Not enough money 77% 72% 89% 84%
Lack of trust in financial institutions 17% 17% 17% 14%
Lack of necessary documentation 28% 20% 33% 32%
Financial services too expensive 27% 31% 30% 29%
Too far away from financial institutions 26% 23% 34% 29%
Religious reasons 3% 3% 6% 5%
IV.2. Access to finance in Central and West Africa
Figure 2 shows the proportion of adults with a formal account at a financial institution
across Africa regions. The proportion of population owning an account at a formal financial
institution is approximately 11% in Central Africa and 23% in West Africa. These proportion are
relatively low when compared to South Africa (51%) and East Africa (28%) as shown in Figure
2. As mentioned above, Central and West Africa have some of the lowest financial inclusion rates
in Sub-Saharan Africa.

17
Figure 2: Account penetration across Africa regions7
Source: Demirguc-Kunt and Klapper (2012b).
An analysis by country within each region shows that account penetration varies widely
from country to country. We observe a big disparity in terms of account ownership within each
region. In Central Africa for example, the rate varies from 4% in Central African Republic to
41% in Angola. In West Africa, it varies from 3% in Niger to almost 40% in Ghana and Nigeria
as illustrated in Figure 3, with a predominance in the sub-region WAMZ.
7 These are adults with an account at a formal financial institution, including postal offices and microfinance
institutions.
0%
10%
20%
30%
40%
50%
60%
West Africa North Africa Central Africa
South Africa East Africa Africa
23% 20%
11%
51%
28% 23%

18
Figure 3 : Account penetration by country in Central and West Africa
Central Africa
West Africa
IV.3. Individual characteristics of financial inclusion
Here we provide a descriptive analysis of the potential determinants of financial inclusion
in the two regions. For that purpose, we compare the distribution with respect to individual
characteristics for account holders versus the alternative group of no account holders.
Angola Burundi Cameroon Central African
Republic
Chad Congo, Dem. Rep.
Congo, Rep.
Gabon
41%
10%
19%
4%
16%
5%
16%
26%
Percentage of adults with an account at a formal financial institution
Benin Burkina Faso
Ghana Guinea Mali Niger Nigeria Senegal Sierra Leone
Togo
14%
21%
40%
6%
11%
3%
39%
10%
25%
14%
Percentage of adults with an account at a formal financial institution (%)

19
Potential determinants of “owning a formal bank account”
Figure 4 below shows the distribution of account ownership by individual characteristics:
gender, education level, age, income quintile, residence area, employment status, marital status,
and trust in financial institutions. The graphs of panel A (resp. panel B) are for Central Africa
(resp. West Africa), with the distribution of individual characteristics provided for respondents
with a formal account (left hand size graph) versus respondents with no bank account (right hand
size graph). We observe that among adults with a formal account, the proportion of men is 56%
in ECCAS versus 61% in ECOWAS. These proportions drop to 51% in ECCAS and 52% in
ECOWAS for the group of respondents with no account. The percentage of respondents with an
account who have attained at least the secondary or higher education level is nearly 75% in both
regions. These percentages drop to only 47% in ECCAS and 27% in ECOWAS for the group of
respondents with no account.
Respondents with an account are concentrated in the working age group (25-64 years
old): it represents 73% of the population of account owners in ECCAS (resp. 78% in ECOWAS)
versus 56% for the group without formal account in ECCAS (resp. 58% in ECOWAS). The
young (15-24 years old) have less access to finance. The percentage of young respondents
without an account is almost the double of that of young account holders (i.e. 40% versus 25% in
ECCAS and 37% versus 19% in ECOWAS). The majority of respondents with a formal account
(60% in ECCAS and 65% in ECOWAS) are in the two highest income quintiles versus only 36%
in the group of respondents without a formal account. The percentage of respondents with a
formal account living in urban areas (52% in ECCAS and 35% in ECOWAS) is almost double
that of respondents without an account (27% in ECCAS and 16% in ECOWAS).
In ECOWAS, more than 61% of respondents with an account are full time employed,
while this percentage is only 35% for the group of respondents with no account. In ECCAS, the
percentage of full time employed among the account holders is 41%, this rate drops to 29%
among no account holders. The majority of respondents with no account are out of the workforce
(36% in ECCAS and 31% in ECOWAS). For the marital status, the distribution is more or less
the same for no account holders and account holders. Finally, although the majority of
respondents have confidence in the financial institutions, this percentage is higher for account

20
holders (66% in ECCAS and 78% in ECOWAS) than for no account holders (61% in ECCAS
and 67% in ECOWAS).
From the above descriptive analysis, the respondent’s sex, education level, age, income,
residence area, employment status and degree of trust in the financial system seem to be
important determinants of financial inclusion. We will conduct further analysis later by way of
econometric regressions.

21
Figure 4: Account ownership by individual characteristics in Central and West Africa
A. Account ownership by individual characteristics in Central Africa
male
female
completed primary or less
secondary
completed tertiary or more
15-24
25-64
65 et +
poorest 20%
second 20%
middle 20%
fourth 20%
richest 20%
urban
rural
Employed full time for employer
Employed full time for self
employed part time do not want full time
unemployed
employed part time want full time
out of workforce
married
divorced
widowed
single
No
Yes
Res
po
nd
ent
is
fem
ale
Res
po
nd
en
t ed
uca
tio
n
leve
l R
esp
on
de
nt
age
Wit
hin
-ec
on
on
my
inco
me
qu
inti
le
Ru
ral
Em
plo
ymen
t st
atu
s m
arit
al s
tatu
s
Co
nfi
den
ce
in
fin
anci
al
inst
itu
tio
ns
56%
44%
25%
65%
10%
25%
73%
2%
10%
12%
18%
21%
38%
51%
49%
29%
12%
20%
8%
10%
21%
39%
4%
2%
55%
34%
66%
Respondents with a formal bank account
male
female
completed primary or less
secondary
completed tertiary or more
15-24
25-64
65 et +
poorest 20%
second 20%
middle 20%
fourth 20%
richest 20%
urban
rural
Employed full time for employer
Employed full time for self
employed part time do not want full time
unemployed
employed part time want full time
out of workforce
married
divorced
widowed
single
No
Yes
Res
po
nd
ent
is
fem
ale
Res
po
nd
ent
edu
cati
on
leve
l R
esp
on
den
t ag
e
Wit
hin
-ec
on
on
my
inco
me
qu
inti
le
Ru
ral
Em
plo
ymen
t st
atu
s m
arit
al
stat
us
Co
nfi
den
ce
in
fin
anc
ial
inst
itu
tio
ns
51%
49%
53%
44%
3%
40%
56%
4%
24%
19%
20%
20%
16%
27%
73%
9%
20%
12%
12%
11%
36%
35%
4%
6%
56%
40%
60%
Respondents with no bank account

22
B. Account ownership by individual characteristics in West Africa
male
female
completed primary or less
secondary
completed tertiary or more
15-24
25-64
65 et +
poorest 20%
second 20%
middle 20%
fourth 20%
richest 20%
urban
rural
Employed ft for employer
Employed ft for self
employed pt do not want ft
unemployed
employed pt want ft
out of workforce
married
divorced
widowed
single
No
Yes
Sex
Edu
cati
on
le
vel
Age
In
com
e q
uin
tile
Res
ide
nce
ar
ea
Em
plo
ymen
t st
atu
s M
arit
al s
tatu
s
Co
nfi
den
ce in
FI
61%
39%
26%
63%
11%
19%
78%
3%
8%
11%
16%
27%
38%
35%
65%
31%
30%
9%
6%
11%
12%
57%
4%
3%
36%
22%
78%
Respondents with a formal bank account
male
female
completed primary or less
secondary
completed tertiary or more
15-24
25-64
65 et +
poorest 20%
second 20%
middle 20%
fourth 20%
richest 20%
urban
rural
Employed ft for employer
Employed ft for self
employed pt do not want ft
unemployed
employed pt want ft
out of workforce
married
divorced
widowed
single
No
Yes
Sex
Edu
cati
on
le
vel
Age
In
com
e q
uin
tile
Res
ide
nce
ar
ea
Em
plo
ymen
t st
atu
s M
arit
al s
tatu
s
Co
nfi
den
ce in
FI
52%
48%
73%
26%
1%
37%
58%
5%
23%
22%
18%
20%
16%
16%
84%
9%
27%
10%
10%
14%
31%
55%
3%
6%
36%
33%
67%
Respondents with no bank account

23
Tables 3 provides the distribution of individual characteristics for the two regions and for
the four indicators of financial inclusion. From the table, although we observe differences in the
characteristics of respondents who have access to finance in Central and West Africa, the
determinants of financial inclusion are more or less similar for the four financial inclusion
indicators for each region, i.e. men, more educated, high income, working age, full-time
employed and high degree of confidence in financial institutions are the main determinants of
financial inclusion. Residence area and marital status also seem to be important determinants for
financial inclusion.
Potential determinants of “having saved in past 12 months”
Now let’s focus on the usage behaviour of those who own an account at a formal financial
institution. The first usage indicator is saving in the account. Globally, 82% of respondents in
West Africa, who own an account at a formal financial institution, have saved in the past 12
months preceding the survey. This proportion is only 69% in Central Africa and 79% in Sub-
Saharan Africa as shown in Figure 5.
Also, as shown in Table 3, with regards to age, those who saved the most are aged
between 25 and 64 years: 76.3% in Central Africa and 80.6% in West Africa of them owning an
account have saved in the past 12 months. However, few elderly (65 years and more) do save:
only 2.5% in Central Africa and 2.1% in West Africa of them have saved in the past 12 months
using their formal account. These findings are not surprising, as the population in the age bracket
25-64 years is the working-age population. With regards to income quintile, saving increases with
the respondent’s income level. In both regions, 41% of account owners in the highest income
quintile have saved in the past 12 months, and this percentage increases to 62.4% in Central
Africa and 69.6% in West Africa for the two highest income brackets. For the gender of the
respondent, men owning an account seem to save more than women (60.9% vs. 39.1% in Central
Africa and 64.1% vs. 35.9% in West Africa).
Moreover, respondents who saved in the past 12 months are predominantly those who
have attained the secondary education (67.9% in ECCAS and 63.5% in ECOWAS), only 21.5%
in ECCAS and 24.6% in ECOWAS have the primary or no education and 10.6% in ECCAS and
11.9% in ECOWAS have attained the tertiary or more education level. Additionally, among the

24
respondents who saved in the past 12 months, 46.9% in ECCAS and 66.4% in ECOWAS lived in
rural areas, 46.5% in ECCAS and 64.6% in ECOWAS are employed full time, 41% in ECCAS
and 57.6% in ECOWAS are married. And finally, 70.1% in ECCAS and 79.5% in ECOWAS
trust the financial system.
Overall the fundamental difference between the two regions is observed mainly with
respect to the following three individual characteristics: residence area, employment and marital
status, where the proportion of savers who are married, full-employed and/or lived in rural area is
bigger for ECOWAS than ECCAS.
Potential determinants of “having borrowed in past 12 months”
We now analyse the behavior of respondents who have borrowed in the past 12 months.
As shown by Figure 5, in Central Africa, 24% of respondents in our sample who own an account
at a formal financial institution have borrowed from their institution in the past 12 months
preceding the survey. This proportion reaches 25% of respondents in our sample for West Africa
and 21% for Sub-Saharan Africa.
From Table 3, we observe that 77.3% in ECCAS and 83.6% in ECOWAS of those who
have requested a credit during the past 12 months are aged between 25 and 64 years. The
majority of them are among the richest in terms of income, 42.6% in ECCAS and 40.3% in
ECOWAS are in the highest income quintile and 62.2% in ECCAS and 61.3% in ECOWAS are
in the two highest income quintiles. Moreover, the statistics show that men have borrowed more
than women (59.8 vs. 40.2 in ECCAS and 59.5% vs. 40.5% in ECOWAS); 61.5% in ECCAS and
48.1% in ECOWAS of borrowers have reached the secondary education level, 7.7% in ECCAS
and 9.6% in ECOWAS have attained the tertiary education level and 30.8% in ECCAS and
42.2% in ECOWAS have primary or no education; 52% in ECCAS and 70.2% in ECOWAS
lived in rural area; 43.4% in ECCAS and 59.5% in ECOWAS are employed full time; 48.2% in
ECCAS and 69.1% in ECOWAS are married; and finally, 64.4% in ECCAS and 78.6% in
ECOWAS have confidence in the financial system.
Therefore, those who have borrowed in the past 12 months are mainly men with
secondary education level or more, from the working-age group 25-64, and with high income
level. Likewise, they are, for the most, married, lived in rural areas and employed and trust the
financial system. The proportion of population in the age group 25-64 years represents, in many

25
African countries, the most active population on the job market, hence more likely to obtain loans
from financial institutions if they can prove that they have a job. Also, in Central and West
African tradition, men are considered to be the head of the family; to accomplish this role, he
may need to borrow from time to time to satisfy the basic needs of his family. At the same time,
the education level increases the likelihood of owning an account, although, one may argue that
the population with secondary education level may be more in the need for a credit than the
population with tertiary or higher education level, given their income level which usually
increases with the education level.
Again here also, there are some fundamental differences between the two regions with
respect to the borrowing behaviour in terms of education level, residence area, employment
status, marital status and level of confidence in the financial institutions. Indeed, more percent of
borrowers in ECOWAS lived in rural areas, are full time employed, are married and have
confidence in the financial institutions, whereas the proportion of educated borrowers in ECCAS
is bigger than in ECOWAS.
Potential determinants of “the frequency of use of the account”
We now examine the frequency of usage of the account by respondents who have an
account at a formal financial institution. Recall, here an individual is said to use frequently his
account if he performs at least three (3) withdrawal/payments operations in his account in a
typical month. These withdrawal/payments activities are: cash withdrawal, electronic payments
and purchases, checks, or any other time money is withdrawn from his account by him or others.
From Figure 5, it appears that 23% of respondents in ECCAS versus 20% in ECOWAS owning a
formal account have used it frequently for withdrawal or payments operations. The proportion is
31% in Sub-Saharan Africa.
Generally speaking, we observe the same trend as the one observed for the other financial
inclusion indicators, ownership of account, saving and borrowing as shown in Table 3; i.e. the
active population (i.e. age range of 25-64 years) uses more frequently their account (69.6% in
ECCAS versus 80.3% in ECOWAS). Also, the frequency of use of the account increases with the
income level of the respondent; where 36.8% in ECCAS and 49.2% in ECOWAS of respondents
in the highest income quintile use their account more frequently. This proportion increases to

26
57.9% in ECCAS and 77.6% in ECOWAS when the two highest income quintiles are considered.
Moreover, men use their account more frequently than women (53.2% vs. 46.8% in ECCAS and
66.9% vs. 33.1% in ECOWAS); 76.4% in ECCAS and 85.7% in ECOWAS of account holders
who use their account more frequently have attained the secondary or more education level.
Finally, most account users are in rural areas in ECOWAS (53.4%) versus urban areas in
ECCAS (51.5%), are full-time employed (66.6% in ECOWAS versus 33% in ECCAS), are
married in ECOWAS (55.3% in ECOWAS versus 36.3% in ECCAS) and have confidence in the
financial system (55.9% in ECCAS versus 79.2% in ECOWAS). However, the percentage in
each category seems to be predominant in ECOWAS than in ECCAS.

27
Tableau 3 : Financial inclusion by individual characteristics in Central and West Africa
Own an account at a formal
financial institution
Saved at a financial
institution in past 12 months
Borrowed money from financial
institution in past 12 months
Frequency of use of
account in a month
ECCAS ECOWAS ECCAS ECOWAS ECCAS ECOWAS ECCAS ECOWAS
Respondent is female
male 55.9% 61.3% 60.9% 64.1% 59.8% 59.5% 53.2% 66.9%
female 44.1% 38.7% 39.1% 35.9% 40.2% 40.5% 46.8% 33.1%
Respondent education level
completed primary or less 25.0% 26.5% 21.5% 24.6% 30.8% 42.2% 23.5% 14.4%
secondary 65.4% 62.7% 67.9% 63.5% 61.5% 48.1% 64.8% 71.3%
completed tertiary or more 9.50% 10.8% 10.60% 11.9% 7,70% 9.6% 11,60% 14.4%
Respondent age 15-24 24.60% 19.2% 21.20% 17.4% 19,90% 13.6% 29,10% 17.1%
25-64 72.90% 78.3% 76.30% 80.6% 77,30% 83.6% 69,60% 80.3%
65 et + 2.50% 2.6% 2.50% 2.1% 2,70% 2.8% 1,30% 2.5%
Within-
econonmy income quintile
poorest 20% 10.00% 7.8% 8.30% 5.4% 12,70% 9.6% 14,00% 5.9%
second 20% 11.60% 11.4% 10.20% 9.5% 9,10% 13.1% 10,40% 6.2%
middle 20% 18.40% 15.6% 19.10% 15.5% 16,00% 15.8% 17,70% 10.4%
fourth 20% 21.50% 26.8% 21.20% 28.7% 19,60% 21.2% 21,10% 28.4%
richest 20% 38.50% 38.5% 41.20% 40.9% 42,60% 40.3% 36,80% 49.2%
Rural urban 51.50% 35.0% 53.10% 33.6% 48,00% 29.8% 51,50% 46.6%
rural 48.50% 65.0% 46.90% 66.4% 52,00% 70.2% 48,50% 53.4%
Employment
status
employed FT for employer 28.50% 31.4% 31.30% 33.1% 28,80% 27.6% 23,60% 35.7%
employed FT for self 12.4% 30.0% 15.2% 31.5% 14.6% 31.9% 9.4% 30.9%
employed PT don’t want
FT
20.5% 9.2% 23.6% 10.2% 20.9% 10.3% 25.6% 9.0%
unemployed 7.6% 6.2% 7.2% 5.4% 4.6% 4.4% 7.1% 5.3%
employed PT want FT 10.4% 11.3% 10.1% 10.6% 13.6% 15.3% 9.4% 7.9%
out of workforce 20.6% 12.0% 12.6% 9.1% 17.5% 10.5% 24.8% 11.2%
Marital status married 39.5% 57.4% 41.0% 57.6% 48.2% 69.1% 36.3% 55.3%
divorced 3.8% 3.9% 3.3% 4.4% 3.3% 5.5% 2.7% 5.1%
widowed 2.1% 3.2% 2.2% 2.4% 2.6% 3.1% 0.0% 2.5%
single 54.6% 35.6% 53.5% 35.6% 46.0% 22.3% 61.0% 37.1%
Confidence in FI
No 33.8% 21.6% 29.9% 20.5% 35.6% 21.4% 44.1% 20.8% Yes 66.2% 78.4% 70.1% 79.5% 64.4% 78.6% 55.9% 79.2%

28

29
Figure 5: Use of account in Central and West Africa
IV.4. Independence tests between the individual characteristics and the financial
inclusion indicators
Here we compute the independence “Khi-squared” statistics to see if there is a
statistical relationship between the financial inclusion indicators and the individual
characteristics variables considered separately. From the results of the statistical tests
presented in Table 4, we cannot reject the existence of non-zero correlation between the
financial inclusion indicators and the individual characteristics such as the respondent’s sex,
education level, age, income quintile, residence area, employment status, marital status, and
degree of confidence in financial institutions. We therefore conduct further investigation
below by way of multivariate regressions.
0%
10%
20%
30%
40%
50%
60%
70%
80%
90%
Saved at a financial institution in past 12
months
Borrowed money from financial institution in past
12 months
Frequency of use of account
69%
24% 23%
82%
25% 20%
79%
21%
31%
Central Africa
West Africa
Sub-Saharan Africa

30
Table 4 : Pearson Khi-squared test of independence between financial inclusion indicators and
individual characteristics in Central and West Africa
Central Africa West Africa
Account Saving Borrowing Frequency
Account Saving Borrowing Frequency
Individual
characteristics Khi^2 Khi^2 Khi^2 Khi^2
Khi^2 Khi^2 Khi^2 Khi^2
Female 12.393*** 16.756*** 2.744* 1.729
47.635*** 11.92*** 0.83 5. 09**
(0.000) (0.000) (0.098) -0.189
(0.000) (0.000) (0.362) (0.024)
Education 428.451*** 11.116*** 8.12** 1.867
1572.23*** 8.56** 79.1*** 32.38***
(0.000) (0.004) (0.017) -0.393
(0.000) (0.013) (0.000) (0.000)
Age 130.01*** 7.623** 5.16* 5.84**
255.96*** 12.56*** 12.32*** 1.19
(0.000) (0.022) (0.076) -0.016
(0.000) (0.002) (0.002) (0.552)
Income 426.084*** 11.474** 9.558** 7.689
689.65*** 48.529*** 11.873** 33.5***
(0.000) (0.022) (0.048) -0.104
(0.000) (0.000) (0.018) (0.000)
Rural 306.78*** 1.875 2.03 0.04
329.72*** 3.084* 7.348*** 28.04***
(0.000) (0.171) (0.15) (0.842)
(0.000) (0.079) (0.008) (0.000)
Employment
status 427.58*** 60.686*** 12.31** 15.14**
827.07*** 40.495*** 17.68*** 7.764
(0.000) (0.000) (0.03) (0.01)
(0.000) (0.000) (0.003) (0.17)
Marital status
31.28*** 1.947 12.01*** 11.21***
21.57*** 9.167** 49.11*** 2.48
(0.000) (0.583) (0.007) (0.004)
(0.000) (0.027) (0.000) (0.479)
Confidence in FI
15.67*** 11.455*** 0.653 19.743***
92.605*** 2.478 0.006 0.066
(0.000) (0.000) (0.419) (0.000)
(0.000) (0.115) (0.936) (0.798)
The signs ***, ** and * indicate the significance level at 1%, 5% and 10%, respectively. The p-values
are given in parenthesis.

31
V. ECONOMETRIC ANALYSIS OF FINANCIAL INCLUSION IN
CENTRAL AND WEST AFRICA
In this section, we conduct further analysis on the determinants of financial inclusion
by way of econometric regressions. We use the variables described above along with the four
financial inclusion indicators used as dependent variables. Table 5 below presents the
regression results for the four indicators of financial inclusion for Central Africa and West
Africa. In each regression, we control for the countries fixed effects. The model is estimated
using either the Probit or the Logit estimation technique depending on the outcome of the
Hausman test. For each column, the estimation technique is indicated.
Regression results with « Account » as dependent variable
With the financial inclusion indicator Account (« owning a formal account »), we find
that, in Central Africa, all the individual characteristics are significant determinants of
financial inclusion, the exception being the household size. Hence, the gender, the education
level, the age, the income quintile, the residence area, the employment status, the marital
status and the level of confidence in the financial institutions are all significant at least at the
5% confidence level. In West Africa, however, gender and marital status are not significant
determinants of account ownership. These results confirm more or less the results obtained
above in the descriptive analysis.
Clearly, the estimations show that female respondents are less likely to have an
account than male respondents in Central Africa. The variable is not significant in West
Africa. The likelihood of owning an account increases with the respondent’s education level
in both regions. Indeed, we observe that individuals having attained the secondary education
level are two (2) times more likely to own a formal account in Central Africa than those with
primary or no education. This probability increases to five (5) times in West Africa.
Moreover, the attainment of a tertiary or more education level multiplies by almost seventeen
(17) times in West Africa and by six (6) times in Central Africa the likelihood of owning an
account compared to having only primary education or less. It is then more likely for people
with higher education level to own a formal bank account. Age has a positive effect on the
likelihood of account ownership, while age-squared coefficient is negative, confirming the
existence of a threshold effect for the age variable. When the regression is re-run with the age

32
variable split by ranges,10
we observe that being in the age range 25-64 years multiplies by
almost two (2) times the likelihood of owning an account compare to respondents belonging
to the age range of 15-24 years.
In addition, being in the highest income quintiles and living in urban areas increase the
probability of owning an account. For example, being in the “fifth poorest” income quintile,
multiplies by two (2) in Central Africa and by four (4) in West Africa the likelihood of
owning a formal account. Adults living in rural areas have two (2) times less chance to own
an account than those living in urban areas. Respondents unemployed or out of the workforce
are less likely to own an account compared to full-time employed. Indeed, when compared to
full-time employed by an employer, respondents have their probabilities of owning an account
divided by nearly four (4) for those out of the workforce or unemployed.
In Central Africa, widowed or single persons are less likely to own an account
compared to married individuals. The marital status variable has no significant impact on
account ownership in West Africa. Adults having confidence in the financial system are most
likely to own an account (odds-ratio of 1.39 in Central Africa and 1.66 in West Africa).
Finally, the household size has a negative significant impact on the probability of having a
formal account only in West Africa, not in Central Africa.
Thus, for the variable Account, the likelihood of owning a formal account in both
regions is high for respondents with the following characteristics: more educated,11
age range
25-64 years, high income level, living in urban areas, full-time employed and having
confidence in the financial institutions. These individual characteristics, however, have
different degree of impact on the likelihood of owning a formal account as indicated by their
odds-ratios. In addition to that, the two regions have some main differences, in the sense that
in Central Africa, being married and being a male seem to have positive impacts on the
likelihood of owning an account, whereas it is not the case in West Africa. In West Africa,
however, the income level and the size of the household seem to matter more.
Since previous studies such as Klapper and Singer (2013) have conducted this type of
analysis for Africa using the same Global Findex database, in Table 6 we compare our results
to theirs. We thus provide the signs and significance levels of the coefficients we obtained for
both Central Africa and West Africa to their results for Africa as aggregate. We observe that
10 For simplicity, we did not report the results with the age split, these results are available from the authors upon
request. 11 From our analyses, there is no perfect correlation between income quintiles and education level. Hence, we
assume the two variables to be exogenous to each other in our analysis.

33
all the considered determinants of formal account ownership have the expected signs as the
one obtained for Africa by Klapper and Singer (2013), except the gender and the marital
status. These latter two variables do not seem to be significant determinants of formal account
ownership in West Africa, whereas they are in Central Africa and Africa.
For the other financial inclusion variables used as dependent variables (i.e. those
related to the usage of the formal account), we observe many differences between Central
Africa and West Africa, and between these two regions and Africa taken as aggregate. Below
we discussed those findings.
Regression results with « Saving » as dependent variable
With respect to the second financial inclusion indicator Saving (« have saved at a
formal financial institution in past 12 months »), in Central Africa, the significant individual
characteristics obtained from the estimated logit model are: income quintile (“second
poorest”) and employment status (“employed part time don’t want full time” and “out of the
workforce”). Indeed, as in the account ownership case, individuals out of the workforce are
less likely to save. In West Africa, the significant individual characteristics are: education
level, age, marital status (“divorced”) and level of confidence in financial institutions.
Similar to the account ownership determinants, the results show that, in West Africa,
respondents having attained at least the secondary education and aged between 25 and 64
years are more likely to save at a formal financial institution. For instance, having attained the
tertiary and more education level multiplies by almost two (2) the likelihood of saving
compared to those with primary or no education. Again, age-squared has a negative impact on
the Saving variable, which confirms our hypothesis of non-linear relationship between age
and the likelihood of financial inclusion. Divorced individuals are more likely to save than
married ones in West Africa, although the significance level is weak at only 10%.
The comparison Table 6 shows that for the financial inclusion indicator Saving, while
education level and age are significant individual characteristics for saving in West Africa and
Africa, they are not in Central Africa. Income level is not a positive determinant of saving in
neither regions, whereas it positively affects the likelihood of saving in Africa. The residence
area is not significant in both regions for the Saving variable, even though, being a urban
resident has been found to increase the probability of saving in Africa. Finally, while in Africa
taken as aggregate, married respondents are more likely to save, this is not the case for the
two regions under study.

34
Regression results with « Borrowing » as dependent variable
Concerning the third dependent financial inclusion variable Borrowing (« having
borrowed at a formal financial institution in past 12 months »), from the Probit model
estimations, in Central Africa, the individual characteristics which are significant are:
education level, income quintile, employment status and marital status. In West Africa, the
significant determinants are: education level, age, income quintile (“second poorest”), marital
status (“single”) and household size.
There are some common individual characteristics in the two regions with different
degree of impact. These common determinants are: education level, income level and marital
status. In both regions, we observe that respondents with higher education level and higher
income quintiles are less likely to borrow. One can argue that respondents with higher
education or in higher income quintiles are less in need of credit than those less educated or in
the lowest income quintiles. Concerning the marital status, widowed respondents in Central
Africa and singles in West Africa are less likely to borrow than married respondents.
Each region, however, has additional significant determinants which are not
necessarily significant in the other region. For instance, in Central Africa, we observe that
part-time employed are more likely to borrow than full-time employed. In West Africa, the
demand for credit increases with the age and the household size, with a threshold effect for
age. Hence, Adults in the active age range 25-64 years are more likely to demand credit than
those in the age range 15-24 years.
The comparative analysis presented in Table 6 shows that education and income level
have negative impacts on the likelihood of borrowing in Central Africa and West Africa,
whereas these two variables impact positively the likelihood of borrowing in Africa as
aggregate. Age is a significant determinant for borrowing in West Africa and Africa, but not
in Central Africa.
Regression results with « Frequency » as dependent variable
Finally, for the last dependent variable Frequency (“frequency of use of account in a
typical month”), in Central Africa, the following individual characteristics appear as
significant determinants: education level, marital status, level of confidence in financial
institutions and household size. In West Africa, instead, the significant determinants are:
gender, education level, residence area, income quintile, employment status and marital

35
status. For this financial inclusion indicator, the two regions have two significant individual
characteristics in common: education level and marital status. On the one hand, respondents
with high education are more likely to use more frequently their account for money
withdrawal and payments in both regions. Indeed, improving the education level from
primary to secondary education increases considerably the frequency of use of the account
with an odds-ratio of 1.6 for the two regions, and from primary to tertiary education level the
odds ratio becomes 3.5 for Central Africa and 1.83 for West Africa. On the other hand,
respondents who are divorced or single are less likely to use their account more frequently
than married individuals.
In addition, in Central Africa, those who have more trust in the financial system and
those living in bigger household are less likely to use their account more frequently. In West
Africa, moving from the « first poorest » income quintile to the « fifth poorest » multiplies by
almost two (2) the chance of using more frequently the account. Moreover, full-time self-
employed in this region are more likely to use their account more frequently for cash
withdrawal and payments than full-time employed by an employer (the odds-ratio is 1.45).
Finally, women (versus men) and those living in rural areas (versus urban areas) are less
likely to use their accounts more frequently.
For this last indicator of financial inclusion Frequency, we do not have the results for
Africa, as this variable have not been used by Klapper and Singer (2013). We therefore
compare only results for Central Africa and West Africa in Table 6. As we have mentioned,
the gender is a significant determinant of the use of the account in West Africa, with the
likelihood of using more frequently the account higher with men than women. Education has
a positive significant impact on the frequency of account usage in both regions. Income is
positively significant only at 10% in West Africa, but not in Central Africa. Individuals living
in urban areas are more likely to use their account more frequently, and the coefficient is
significant at the 5% level in West Africa, but it is not significant in Central Africa. Full-time
self-employed has a significant positive impact on the frequency of use of the account in West
Africa, but not in Central Africa. Being divorced in Central Africa or being single in West
Africa decreases significantly the likelihood of using the account more frequently. Finally, the
level of confidence and the size of the household have significant negative impacts on the
frequency of use of the account in Central Africa, but have no significant impacts in West
Africa.

36
In sum, all the individual characteristics identified in the previous section, have being
found to be significant determinants of at least one of the financial inclusion indicators, with
the most dominant one being: education, age, income, residence area, employment status,
level of confidence in financial institutions, marital status and household size. These
determinants have significant coefficients in the first regression with the dependent variable
Account and in at least one of the other three regressions involving one usage of the account
(saving, borrowing or frequency of use). Nonetheless, their impacts are different from region
to region and depending on the financial inclusion indicator used.

37
Tableau 5: Individual determinants of financial inclusion in Central Africa and West Africa
Central Africa West Africa
Account Saving Borrowing Frequency Account Saving Borrowing Frequency
Individual characteristics Model = Logit Model = Logit Model = Probit Model = Logit Model = Logit Model = Logit Model = Probit Model = Logit
Female -0.133*** -0.00329 0.0324 0.145
0.0766 -0.00226 0.0681 -0.302***
(0.0497) (0.467) (0.113) (0.186)
(0.0808) (0.252) (0.104) (0.0881)
Education: “Secondary” 0.677*** 0.122 -0.123 0.482***
1.655*** 0.404* -0.160** 0.486**
(0.263) (0.197) (0.142) (0.169)
(0.0666) (0.209) (0.0787) (0.246)
Education: “Tertiary and more” 1.854*** 0.165 -0.753*** 1.259**
2.827*** 0.663** -0.238* 0.606***
(0.360) (0.520) (0.178) (0.492)
(0.327) (0.270) (0.138) (0.128)
Age 0.0638*** 0.0157 0.00544 -0.00919
0.122*** 0.0556* 0.0484** 0.0294
(0.0127) (0.0223) (0.0153) (0.0286)
(0.0130) (0.0306) (0.0212) (0.0412)
Age^2 -0.000619*** 8.96e-05 0.000129 -0.000259
-0.00121*** -0.000706** -0.000624*** -0.000416
(0.000119) (0.000285) (0.000177) (0.000245)
(0.000121) (0.000335) (0.000234) (0.000466)
Income: “2nd poorest” 0.0282 -0.453*** -0.429* -0.293
0.152 -0.0585 -0.298*** -0.154
(0.272) (0.169) (0.242) (0.194)
(0.164) (0.456) (0.0868) (0.350)
Income: “3rd poorest” 0.156 0.0802 -0.292* -0.128
0.532*** 0.183 -0.155 -0.202
(0.125) (0.649) (0.159) (0.331)
(0.0686) (0.226) (0.147) (0.236)
Income: “4th poorest” 0.0604 0.293 -0.468* -0.631
0.848*** 0.0970 -0.324 0.175
(0.0965) (0.343) (0.247) (0.425)
(0.127) (0.367) (0.223) (0.232)
Income: “5th poorest” 0.825** 0.127 -0.237 0.114
1.322*** 0.696 -0.137 0.630*
(0.401) (0.585) (0.252) (0.313)
(0.0943) (0.448) (0.127) (0.332)
Rural -0.863*** -0.00178 -0.0864 -0.461
-0.755*** 0.139 0.0350 -0.570**
(0.267) (0.300) (0.124) (0.306)
(0.134) (0.195) (0.120) (0.237)
Employment Status: “Employed
FT for Self Employed”
-0.411 0.170 0.0115 0.504
-0.594*** 0.250 -0.0866 0.370**
(0.295) (0.384) (0.313) (0.663)
(0.140) (0.253) (0.188) (0.146)
Employment Status: “Employed
PT don’t want FT”
-0.255 0.998*** 0.286 0.223
-0.727*** 0.245 0.0707 -0.0296
(0.291) (0.264) (0.203) (0.203)
(0.194) (0.292) (0.160) (0.273)
Employment Status:
“Unemployed”
-1.684*** -0.446 -0.555 -0.0228
-1.436*** -0.274 -0.0546 -0.282
(0.197) (0.348) (0.406) (0.257)
(0.242) (0.359) (0.357) (0.373)

38
Employment Status: “Employed
PT want FT”
-0.208 -0.441 0.218*** 0.327
-0.698*** -0.216 0.164 -0.268
(0.285) (0.509) (0.0637) (0.689)
(0.190) (0.347) (0.161) (0.330)
Employment Status: “Out of
workforce”
-1.368*** -0.794** -0.120 0.0507
-1.609*** 0.117 -0.183 0.330
(0.186) (0.338) (0.297) (0.337)
(0.208) (0.339) (0.190) (0.251)
Marital Status: “Divorced” -0.562 -0.615 -0.130 -0.887**
-0.195 1.130* 0.330 0.365
(0.373) (0.833) (0.397) (0.365)
(0.393) (0.662) (0.307) (0.344)
Marital Status: “Widowed” -0.567*** -0.685 -1.133*** _
-0.251 -0.615 -0.260 0.117
(0.152) (0.924) (0.332)
(0.200) (0.474) (0.234) (0.216)
Marital Status: “Single” -0.289** 0.463 0.101 -0.507
-0.221 0.161 -0.254** -0.391***
(0.147) (0.287) (0.308) (0.327)
(0.201) (0.211) (0.121) (0.124)
Confidence in Financial
Institutions
0.332*** 0.493 -0.152 -0.521**
0.507*** -0.468*** 0.0895 -0.0197
(0.103) (0.422) (0.217) (0.214)
(0.142) (0.166) (0.127) (0.188)
Log of Household Size -0.0960 -0.240 -0.0869 -0.429***
-0.147** 0.0377 0.232*** -0.223
(0.217) (0.165) (0.153) (0.141)
(0.0665) (0.247) (0.0427) (0.175)
Constant -0.336 -0.874 -0.875 1.565**
-4.308*** 0.127 -1.686*** -1.364*
(0.590) (0.558) (0.589) (0.624)
(0.323) (0.722) (0.536) (0.703)
Country fixed effects Yes Yes Yes Yes
Yes Yes Yes Yes
No. of observations 5 914 676 932 864
9 961 1 414 1 803 1 769
r2_p 0.265 0.157 0.116 0.192 0.305 0.103 0.130 0.106
Note: The signs ***, ** and * indicate the significance level at 1%, 5% and 10%, respectively. The standard errors are in parenthesis. The estimations are done using the
countries as « clusters ».

39
Tableau 6: Comparative analyses between Central Africa, West Africa and Africa
Individual characteristics
Account Saving Borrowing Frequency
ECCAS ECOWAS Africa ECCAS ECOWAS Africa ECCAS ECOWAS Africa ECCAS ECOWAS
Female -*** + -* - - - + + + + -***
Education: “Secondary” +*** +*** +*** + +* +*** - -** +*** +*** +**
Education: “Tertiary and more” +*** +*** +*** + +** +*** -*** -* +*** +** +***
Age +*** +*** +*** + +* +*** + +** +*** - +
Age^2 -*** -*** - *** + -** -*** + -*** -*** - -
Income: “2nd poorest” + + + -*** - +*** -* -*** + - -
Income: “3rd poorest” + +*** +*** + + +*** -* - +*** - -
Income: “4th poorest” + +*** +*** + + +*** -* - +*** - +
Income: “5th poorest” +** +*** +*** + + +*** - - +*** + +*
Rural -*** -*** -*** - + -*** - + + - -**
Employment Status: “Employed FT for Self Employed” - -*** -*** + + -*** + - -*** + +**
Employment Status: “Employed PT don’t want FT” - -*** -*** +*** + -*** + + -*** + -
Employment Status: “Unemployed” -*** -*** -*** - - -*** - - -*** + -
Employment Status: “Employed PT want FT” - -*** -*** - - -*** +* + -*** - -
Employment Status: “Out of workforce” -*** -*** -*** -** + -*** - - -*** + +
Marital Status: “Divorced” - - -*** - +* -*** - + + -** +
Marital Status: “Widowed” -*** - -*** - - -*** -*** - -*** +
Marital Status: “Single” -** - -*** + + -*** + -** -*** - -***
Confidence in Financial Institutions +*** +*** + -*** - + -** -
Log of Household Size - -** - + - +*** -** -
Note: The signs ***, ** and * indicate the significance level at 1%, 5% and 10%, respectively. Results for Africa are from Klapper and Singer (2013).

40
VI. CONCLUSION AND RECOMMANDATIONS
Inclusive finance is important to achieve inclusive growth in Africa in general, and in
Central and West Africa in particular. These two regions have the lowest bank penetration
rates in Sub-Saharan Africa. In this paper, we identify and analyse the determinants of
financial inclusion in Central Africa and West Africa. We find that access to formal finance in
the two regions is mainly determined by individual characteristics such as: the gender, the
education level, the age, the income level, the residence area, the employment status, the
marital status, the size of the household and the degree of confidence in financial institutions.
Conducting a comparative analysis on the coefficients associated to the individual
characteristics, we were able to highlight the differential impacts of these variables for Central
Africa, West Africa and Africa. We also find that depending on the financial inclusion
indicator being used, the individual characteristics have different degree of impacts for each
region. These contrasting findings are very helpful for decision makers in order to design
tailored made policies.
Based on these findings, we strongly recommend to policy makers, especially in the
ECCAS region, to ease access to finance for women, the youths and the other vulnerable
groups of the society. This can be done by promoting the benefits of using the formal
financial services in schools and local communities and associations. For example, the
government can encourage the youths and women to open accounts at formal banks by
depositing their bursary and governmental family allocations in their bank accounts. There is
also a need to alleviate conditions to open an account for these vulnerable groups of
population, for instance, by simplifying the documentation requirements and reducing the
financial services fees. Nowadays, with the increasing number of mobile phones users among
the population in these countries, financial services providers have a good opportunity to
create accessible financial products and services which better respond to the specific needs of
these different groups.
Secondly, governments and their development partners should encourage and facilitate
access to education, by reducing or even abolishing school registration and other schooling
fees, and also creating conducing environment for the youth to continue their studies at higher
education level. Finally, countries in the two regions should adopt more aggressive stable jobs

41
creation policies; this will certainly increase the income level of households and then facilitate
access to formal financial services.

42
REFERENCES
Allen, F., E. Carletti, R. Cull, J. Qian, L. Senbet, and P. Valenzuela, 2013, “The African
Financial Development and Financial Inclusion Gaps,” Working Paper, Wharton Financial
Institutions Center, University of Pennsylvania.
Allen, F., A. Demirguc-Kunt, L. Klapper, and M. S. Martinez Peria, 2012, "The Foundations
of Financial Inclusion: Understanding Ownership and Use of Formal Accounts," World Bank
Policy Working Paper 6290.
Allen, F., Otchere, I., and Senbet, L., 2011, “African Financial Systems: A Review”, Review
of Development Finance, 1, 79-113.
Anson, J., A. Berthaud, L. Klapper, and D. Singer, 2013, “Financial Inclusion and the Role of
the Post Office,” Policy Research Working Paper 6630, World Bank, Washington, DC.
Aportela, F., 1999, “Effects of Financial Access on Savings by Low-Income People,” Working
Paper, Banco de México, Research Department.
Ashraf, N., D. Karlan, and W. Yin, 2010, “Female Empowerment: Further Evidence from a
Commitment Savings Product in the Philippines,” World Development, 28 (3), 333–44.
Banerjee, A., E. Duflo, R. Glennerster, and C. Kinnan, 2010, “The Miracle of Microfinance?
Evidence from a Randomized Evaluation,” MIT Bureau for Research and Economic Analysis
of Development, Working Paper 278.
Beck, T., and R. Cull, 2013, “Banking in Africa,” World Bank Policy Research Working
Paper 6684.
Beck, T., Fuchs, M., and M. Uy, 2009, “Finance in Africa: Achievements and Challenges,”
World Bank Policy Research Working Paper 5020.
Bekaert, G., C. R. Harvey, and C. Lundblad, 2005, “Does Financial Liberalization Spur
Growth?,” Journal of Financial Economics, 77, 3-56.
Cameron, C., and P. Trivedi, 2005, Microeconometrics: Methods and Applications,
Cambridge University Press.
Collard, S., Kemson, E., and N. Dominy, 2003, “Promoting Financial Inclusion: An
Assessment of Initiatives using a Community Select Committee Approach,” The Policy Press,
University of Bristol, Bristol, Great Britain.
Dabla-Norris, E., Ji, Y., Townsend, R.M., and D.F. Unsal, 2014, “Financial
Deepening,Growth, and Inequality: A Structural Framework for Developing Countries,”
Working Paper, International Monetary Fund & Massachusetts Institute of Technology.
Demirguc-Kunt, A., and L. Klapper, 2012a, “Measuring Financial Inclusion: The Global
Findex Database An Overview,” World Bank Policy Research Working Paper 6025.
Demirguc-Kunt, A., and L. Klapper, 2012b, “Financial Inclusion in Africa: An Overview,”
World Bank Policy Research Working Paper 6088.
Demirguc-Kunt, A., Klapper, L., and D. Randall, 2013, “Islamic Finance and Financial
Inclusion: Measuring Use of and Demand for Formal Financial Services among Muslim
Adults,” World Bank Policy Research Working Paper 6642.
Dupas, P., and J. Robinson, 2009, “Savings Constraints and Microenterprise Development:
Evidence from a Field Experiment in Kenya,” National Bureau of Economic Research
Working Paper 14693.

43
Henry, P. B., 2000, “Do Stock Market Liberalizations Cause Investment Booms?”, Journal of
Financial Economics, 50, 301-334.
Klapper, L., and D. Singer, 2013, “Financial Inclusion in Africa: The Role of Informality,”
Presented at the African Economic Research Consortium Biannual Research Workshop.
Karlan, D., and J. Zinman, 2010, “Expanding Credit Access: Using Randomized Supply
Decisions to Estimate the Impacts,” Review of Financial Studies, 23 (1), 433–64.
Kempson, E., and C. Whyley, 1999, “Kept Out or Opted Out? Understanding and Combating
Financial Exclusion,” The Policy Press, University of Bristol, Bristol, Great Britain.
Klein, M., and G. Olivei, 2008, “Capital Account Liberalization, Financial Deepness and
Economic Growth,” Journal of International Money and Finance, 27 (6), 861-875.
Marshall, J.N., 2004, “Financial Institutions in Disadvantaged Areas: A Comparative
Analysis of Policies Encouraging Financial Inclusion in Britain and the United States,”
Environment and Planning A, 36, 241-261.
Pagano, M., 1993, “Financial Markets and Growth: An Overview,” European Economic
Review, 37, 613-22.
Levine, R., 1997, “Financial Development and Economic Growth: Views and Agenda,”
Journal of Economic Literature, 35, 688–726.
Levine, R., Loayza, N., and T. Beck , 2000, “Financial Intermediation and Growth: Causality
and Causes,” Journal of Monetary Economics, 46, 31-77.