Analysis of the Croatia Smart Specialization Strategy ...
214
Analysis of the Croatia Smart Specialization Strategy: Logical Framework, Instruments, and Indicator Results
Transcript of Analysis of the Croatia Smart Specialization Strategy ...

Analysis of the Croatia Smart Specialization Strategy: Logical Framework, Instruments, and Indicator Results

Analysis of the Croatia Smart Specialization Strategy: Logical Framework, Instruments, and Indicator Results
Croatia PubliC ExPEnditurE rEviEw in SCiEnCE, tEChnology and innovation
March 2021

Note
This report is a product of the staff of The World Bank. The findings, interpretations, and conclusions expressed in this report are entirely those of the authors and they do not nec-essarily reflect the views of The World Bank, its Executive Directors, or the governments they represent. The World Bank does not guarantee the accuracy of the data included in this work, which is drawn from multiple external sources. Nothing herein shall constitute, or be considered to be, a limitation upon or waiver of the privileges and immunities of The World Bank, all of which are specifically reserved.

Contents
Acknowledgments 6Acronyms and abbreviations 7Executive summary 8Introduction 12
1. Approach 15
2. Intervention logic 232.1 Sectoral priorities 302.2 Vision and objectives 342.3 Instruments 442.4 Indicators 54
3. Recommendations 633.1 Intervention logic and objectives 653.2 Policy mix and instruments 713.3 Monitoring and evaluation 72
References 75
Appendix 77I. Indicator-specific recommendations 78II. Structure and evolution of S3 policy mix 190III. Status of results indicators 195IV. Interpretation of the connections between instruments and objectives 226
analySiS of thE Croatia Smart SPECialization StratEgy: logiCal framEwork, inStrumEntS, and indiCator rESultS

Acknowledgments
This report was prepared by a World Bank team led by Todor Milchevski (Senior Private Sector Specialist, Task Team Leader) and comprising Andres Zahler (Senior Industrial Policy Specialist), Tomislav Zoretic (EU Funds and Monitoring and Evaluation Specialist), Jasmina Mrkonja (Innovation Policy Specialist), and Chhitij Bashyal (Monitoring and Eval-uation and Process Innovation Specialist). Aarre Laakso (Editor) helped enhance the qual-ity and clarity of the report. The report benefited from the helpful advice and comments of Yehia Khedr Eldozdar (Monitoring and Evaluation Specialist). The team would like to extend their gratitude to Ruzica Jugovic (Program Assistant) for administrative support.
The team would also like to thank Ilias Skamnelos (Practice Manager) and Elisabetta Ca-pannelli (Country Manager) for their guidance.
AnAlysis of the CroAtiA smArt speCiAlizAtion strAtegy: logiCAl frAmework, instruments, And indiCAtor results 6

Acronyms and abbreviations
CCE Croatian Chamber of Economy
CEKOM center of competence
EDP entrepreneurial discovery process
ESIF European Structural and Investment Funds
GVC global value chain
HRZZ Croatian Science Foundation
INNOVA Innovation Council for the Industry
MEEC Ministry of Economy, Entrepreneurship and Crafts
MESD Ministry of Economy and Sustainable Development
MSE Ministry of Science and Education
MLPS Ministry of Labor, Pension System, Family and Social Policy
NIC National Innovation Council
OPCC Operational Program Competitiveness and Cohesion 2014–2020
OPEHR Operational Program Efficient Human Resources 2014–2020
RDI research, development, and innovation
S3 Smart Specialization Strategy 2016–2020
SFI Strategy for Fostering Innovation 2014–2020
SME small and medium enterprises
STI science, technology, and innovation
STPA S3 sub-thematic priority area
TIC Thematic Innovation Council
TIP Thematic Innovation Platform
ToC Theory of Change
TPA S3 thematic priority area
aCronymS and abbrEviationS 7

Executive summary
This report assesses the intervention logic of the Croatian Smart Specialization Strategy 2016–2020 (S3) policy framework. The intervention logic is a set of assumptions about how a policy action will lead to desired outcomes. The report seeks to analyze and evalu-ate the S3 policy for Croatia from a “logical framework” perspective. A logical framework is a representation of how a policy action is supposed to work, connecting the available inputs, which are used to conduct activities, and the outputs and outcomes that are ex-pected from the action. The analysis presented in the report uses the Theory of Change (ToC) approach, which is a methodology for developing the intervention logic, to assess the clarity of and logical connections between overall goals, specific goals, sectoral ob-jectives, instruments, and indicators as defined in the S3. The purpose of the analysis is to identify opportunities to improve policy design, implementation, and monitoring, and thus enhance policy coherence and effectiveness.
The S3 approach was a novelty in the Croatian innovation policy system, and it faced numerous challenges and delays. Smart specialization strategies are national or regional innovation strategies that set priorities for building competitive advantages by developing and matching research and innovation strengths to business needs. The S3 introduced a new, sectoral approach to prioritization of policy interventions through identification of thematic and sub-thematic priority areas (TPAs and STPAs). However, the policy adop-tion process took longer than expected, and the official S3 document was adopted more than two years after the start of the EU financial perspective. This also delayed the use of European Structural and Investment Funds (ESIF) for research, development, and inno-vation (around HRK 6.74 billion)1 because adoption of the S3 was a precondition for their deployment. The bottom-up approach to policy prioritization underlying the S3 did not take root due to extensive delays in establishing appropriate sectoral governance bodies.
Key fiNdiNgs
The integration of the sectoral dimension in the overall intervention logic is limited. The S3 intervention logic consists of a combination of (a) horizontal policies aimed at raising competitiveness through research, development, and innovation (RDI) and (b) a vertical policy that prioritizes RDI investments in a limited set of sectors. As such, the S3 approach requires objectives, instruments, and resources to be guided by a bottom-up process of consultations with academia and industry (that is, the entrepreneurial discovery process
1 The value of ESIF-funded S3 instruments stated throughout the report was calculated based on the overview of S3 instruments in the S3 Action Plan 2019–2020. Discrepancies in comparison to the values in the official S3 document may exist due to changes to the S3 policy mix introduced in the Action Plan. Additional details on changes introduced are available in the section on S3 delivery instruments.
AnAlysis of the CroAtiA smArt speCiAlizAtion strAtegy: logiCAl frAmework, instruments, And indiCAtor results 8

or EDP). These stakeholders were consulted in the process of identifying five sectoral priorities (that is, TPAs). However, the delay in establishing the sectoral S3 governance structures contributed to limited connections between the sectoral priorities and the overall strategy of the S3 policy. More specifically, it is unclear how and to what extent the strategic objectives, instruments, and resources address the specific challenges identi-fied within TPAs. The diagnostic, challenges, goals, and instruments all seem to address broad, horizontal issues.
Objectives would benefit from further clarification in order to gauge the policy’s success. The policy document formulates a vision, an overall objective, and six specific strategic objectives. During implementation, additional layers of objectives were added (main objectives and specific sub-objectives). The formulation of objectives contains terms that may be interpreted in a variety of ways, such as “quality of life,” “socio-economic development,” “competitiveness,” and similar. Since these terms are not tied to any indi-cators or targets, this makes it difficult to specify their practical meaning and assess the effectiveness of the policy. Further, the logical connections or pathways of change between different levels of objectives are not always clear. Explicitly articulating how lower-level objectives contribute to achieving higher-level objectives would help demonstrate their logical consistency and make it possible to identify appropriate output and outcome in-dicators for assessing these connections.
Instruments were originally defined in a complex set of layers, but their structure was streamlined during implementation. Instruments were originally organized into three levels: delivery areas, delivery instruments, and “ways of implementation” (which repre-sent specific support schemes within one instrument). Not all levels of instruments have direct connections to other elements of the intervention logic. For example, delivery areas are not connected to specific objectives, and “ways of implementation” are not clearly connected to indicators, especially in cases where one delivery instrument is supported by multiple “ways of implementation.” Further, the concept of delivery instruments was not defined and used consistently—sometimes delivery instruments are formulated and described as objectives, other times as transfer mechanisms, and yet other times as support for institutional capacity development and implementation of S3 governance structures. Instruments dedicated to improving institutional and governance capacities are presented as contributing to specific objectives, but this contribution is often indirect compared to instruments that support the private sector or research sector. While the structure of instruments was streamlined during implementation, merging three layers of instruments into one, some inconsistencies remained.
There is a significant imbalance in the instruments, and consequently resources, al-located to different strategic objectives. Eighty-five percent of funding is allocated to instruments supporting two of six specific objectives. This may call into question the ability to achieve the remaining four objectives. Further, two of those four objectives are not covered by S3 “main” instruments, that is, instruments that are directly connected with TPAs. This casts doubt on whether and to what extent the TPAs will benefit from achieving these objectives.
ExECutivE Summary 9

The monitoring framework underwent certain changes during implementation, but there is still scope for improvement, particularly related to target setting and TPAs. Initially, output and outcome indicators were defined at the level of delivery instruments and were associated with baseline and target values. The plan was to also collect output indicators at the TPA level, but this materialized only for some instruments and some indicators. The resulting lack of data makes it difficult to identify implementation bottlenecks within TPAs. During implementation, the monitoring framework was substantially revised: some indica-tors were dropped, others were amended, and others were added. The revised monitoring framework includes definitions for indicators, which is an improvement compared to the initial setup, but omits targets for indicators, which is a setback. Intermediate indicators and milestones are also lacking, although they could be useful for taking timely action and corrective measures, where appropriate.
RecommeNdatioNs
The intervention logic of the S3 should be streamlined, clarified, and better connected with its sectoral dimension. The specialization aspect of the S3, which operationalized through the selection of sectoral priorities, should be fully integrated in the overall inter-vention logic. The complexity inherent in the S3 philosophy, combining horizontal and vertical RDI policies as well as top-down and bottom-up approaches, requires a struc-tured approach towards developing its intervention logic. This can be achieved through the following actions:
a. Developing an explicit intervention logic for the S3 – an explicit ToC developed for the strategy would help avoid any overlaps or missing links in the intervention logic;
b. Strengthening the link between the overall intervention logic and the TPA-level log-ic – an explicit ToC should be developed for each TPA based on sectoral diagnostics, demonstrating the connection between TPA-level logic and overall logic at each level (objectives, instruments, and inputs);
c. Improving the clarity of vision and objectives – to assess whether the objective of the strategy was met, the vision and objectives should be clarified by providing definitions of key terms and associating them with indicators; and
d. Enhancing the integration of S3 with other national strategies – the S3 should elabo-rate in more detail its complementarities and connections with other existing national and sectoral strategies.
AnAlysis of the CroAtiA smArt speCiAlizAtion strAtegy: logiCAl frAmework, instruments, And indiCAtor results 10

The policy mix and instruments should be more clearly defined, with robust connec-tions to the intervention logic and sectoral needs. Policy instruments are the central mechanisms for enacting change and should be carefully defined and consistent with the objectives set in the policy and the sectoral needs identified through the EDP. This can be achieved through the following actions:
a. Clearly defining instruments – by streamlining instrument categories and taking a consistent approach to defining instruments;
b. Separating institutional instruments from transfer mechanisms – instruments dedicated to support institutional capacities for RDI policy and governance should be separate from instruments to support the private and research sectors;
c. Clearly justifying and documenting changes to the policy mix – changes to the policy mix should be elaborated, listing the underlying factors they are based on, such as the experience of implementation, outputs of the EDP process, or other reasons; and
d. Strengthening the connection between instruments and TPA needs – sectoral vision, goals and project pipeline should guide the selection of instruments, including their design or redesign, prioritization, and overall funding allocation.
The monitoring and evaluation framework should be streamlined and improved to provide timely information on the pace of change and enable policymakers to make appropriate adjustments. The S3 requires constant experimentation and adjustments driven by the EDP. This makes it essential to have a robust and coherent monitoring and evaluation (M&E) framework, which may be developed through the following actions:
a. Building a coherent and consistent M&E system – connections between indicators at different policy levels should be improved, indicators should be standardized, process indicators and milestones should be introduced, and quantitative impact evaluations should be planned for selected instruments; and
b. Introducing measuring and tracking indicators at the TPA level – additional TPA-level indicators should be introduced, standardized indicators across the policy mix should be disaggregated by TPA and any other priority dimensions that can assist in identifying bottlenecks at the sectoral level.
ExECutivE Summary 11

Introduction
The concept of ‘smart specialization’ is a central part of the European Union policy framework to enhance innovation, competitiveness, and sustainable growth. As defined in Regulation EU/1303/2013, “smart specialization strategies” are national or regional in-novation strategies that set priorities for building competitive advantages by developing and matching research and innovation strengths to business needs. The purpose of such strategies is to take advantage of emerging opportunities and market developments in a coherent manner while avoiding duplication and fragmentation of efforts. The importance of smart specialization strategies is reflected in the fact that they were introduced as an ex-ante conditionality for all investment priorities under the thematic objective “Strength-ening research, technological development and innovation.” In practice, this meant that a smart specialization strategy was a prerequisite for obtaining resources from ESIF under the aforementioned thematic objective in 2014–2020.2
Smart specialization strategies are complex “vertical” science, technology, and innova-tion (STI) policies that require bottom-up and top-down approaches. Smart specialization strategies differ from traditional innovation policies in that they focus on specific sectors or regions and therefore require prioritization and strategic definition. They require active and collaborative participation, engagement, and commitment from government, the pri-vate sector, and academia from a bottom-up, sector-specific perspective embodied in the EDP. Through the EDP, each sector identifies its challenges, goals, instruments, financing needs, and needs for government action stemming from its goals and priorities. The dis-cussions and deliberation under the EDP are expected to generate better outcomes in the prioritized sectors. At the same time, smart specialization strategies demand actively coordinating existing institutions, creating new institutions at various policy levels, and adapting instruments or creating new ones to effectively support sectoral STI demands. This process requires the government to develop a coherent rationale and set of objectives for policy, governance, decision making, fund allocation, and monitoring and evaluation, thus supplementing the framework with a top-down perspective.
Smart specialization policies have outcomes at different levels and time frames. The initial allocation of funds to specific instruments in priority areas (supply side), the partic-ipation of stakeholders (both on supply and demand side), and the elaboration of collab-orative and individual projects at the sectoral level (demand side) allow for outputs such as implemented R&D projects or new infrastructure established. These outputs, in turn,
2 According to Regulation EU/1303/2013, the criterion for fulfillment of this conditionality is that a national or regional smart specialization strategy is in place that is based on a strengths-weaknesses-opportunities-threats (SWOT) or similar analysis to concentrate resources on a limited set of research and innovation priorities; outlines measures to stimulate private R&D investment; and contains a monitoring mechanism. Additionally, a framework outlining available budgetary resources for research and innovation has to be adopted.
AnAlysis of the CroAtiA smArt speCiAlizAtion strAtegy: logiCAl frAmework, instruments, And indiCAtor results 12

should translate to outcomes related to quality of research, development of new prod-ucts (goods and services), and have an impact on performance related to sales, exports, employment, and productivity. These levels (outputs, outcomes, and impact) need to be logically connected and guided by achievable short- and medium-term policy goals. They also need to be monitored with measurable, well-defined and time-bound indicators. The definition, connection, and measurement of these outputs, outcomes, and impacts are key to evaluating the different aspects of the S3.
The adoption of the S3 in Croatia was a milestone in the development of the national innovation policy system. It envisaged not only a significantly greater amount of public financing to support the STI agenda but also strengthening of institutions that plan and coordinate STI policy. At the same time, due to its complexity, the S3 generated important coordination challenges for the system and institutions involved. It implied the creation of new instruments and the adaptation or use of existing ones. It also required coordination with the existing STI strategic framework, such as the Strategy for Fostering Innovation 2014–2020.
The challenges and delays in the design and implementation of the policy jeopardized the key principles behind a coherent S3, particularly the use of the bottom-up approach. The policy adoption process took longer than expected. The Croatian government adopt-ed the S3 in March 2016, more than two years after the start of the EU financial perspec-tive 2014–2020. This caused delays in launching S3 programs funded through ESIF, given that the adoption of the strategy was a pre-condition for their launch. In particular, this affected the Operational Program Competitiveness and Cohesion 2014–2020 (OPCC), which was envisaged to fund by far the largest share of ESIF S3 programs in Croatia. The OPCC and the S3 were to some extent developed in parallel. (The OPCC was adopted in December 2014.) However, the final stage of S3 preparation in 2015 and the beginning of 2016 was conducted after the key aspects of support programs had already been set up in the OPCC, before the strategic vision of the S3 was formulated. This created the risk of a serious disconnect between the S3 and OPCC in the goals, instruments, indicators, and funding that could best address the competitiveness gaps, especially those that were identified through the EDP in 2015–2016.
Some of the key institutions that enable the proper functioning of the policy framework have been partially deployed, which may harm policy effectiveness. Examples are the National Innovation Council, which was established in July 2018 and had its first meet-ing in December 2018, and the Innovation Council for Industry, which was established in December 2017, and had its first meeting in September 2018. The setup of the policy gov-ernance system and the key bodies envisaged for EDP continuation were delayed even further. Thematic Innovation Councils, envisaged in the S3 as the backbone of the EDP, only began working at the beginning of 2019. The delays in the deployment of appropriate institutions to operationalize the S3 framework reduce the effectiveness of the policy itself and the significant resources it mobilizes.
introduCtion 13

The assessment of the intervention logic should provide policy makers with valuable insights ahead of the preparation of the next S3. Although initiated late in the process,3 the assessment of the intervention logic of the S3 will provide guidance to better prac-tices for design, implementation, and monitoring. This should be particularly useful for the upcoming EU financial perspective. The proposed Regulation for the 2021–2027 me-dium-term financial framework, will include preconditions that must be met (so-called
“enabling conditions”) in order to start allocating funds. The proposed enabling condition for the policy objective “A smarter Europe by promoting innovative and smart economic transformation” is good governance of a national or regional smart specialization strategy.
This document is structured in three sections. Section 1 elaborates the analytical frame-work used to analyze the S3 intervention logic. Section 2 presents the findings of the analysis, exploring each element of the intervention logic, and the connections between them, in detail. Section 3 concludes and provides recommendations for improving the intervention logic. In addition, Appendix I provides detailed recommendations for indica-tors used in the S3, Appendix II documents the structure and evolution of the policy mix for the S3, Appendix III provides an overview of the status of S3 results indicators, and Appendix IV presents the connection between instrument-level outcomes and specific policy-level objectives.
3 In the S3 policy document, a mid-term evaluation of the policy was envisaged in 2017.
AnAlysis of the CroAtiA smArt speCiAlizAtion strAtegy: logiCAl frAmework, instruments, And indiCAtor results 14

Approach
01 15

01 Approach
This report analyzes and evaluates the intervention logic of Croatia’s S3 policy using a “logical framework” approach. A logical framework is a representation of how a policy action is supposed to work, connecting the available inputs, which are used to conduct activities, and the outputs and outcomes that are expected from the action. Starting with an “ideal” logical framework, the report identifies gaps and redundancies at each level of policy design and proposes improvements to better connect different parts of the policy. The analysis also covers the latest updates of the monitoring system, the calls implemented, and the functioning of different bodies involved in the S3 in order to sug-gest recommendations capturing all that has been implemented in practice. The analysis covers both top-down and bottom-up approaches, the design and implementation of the sectoral perspective, and its connection with the overall policy framework.
iNteRveNtioN logic evaluatioN fRamewoRK
The logical framework of the S3 is assessed by constructing its ToC. A ToC is a detailed description of the mechanisms through which a change is expected to occur in a given context to achieve long-term goals. As such, a ToC illustrates the “pathways of change” connecting the inputs that are going into the project (such as funding, human resources, and time) to conduct various activities (such as applied research, product development, and so on) with the outputs of such activities, which together are expected to generate short-term and longer-term outcomes. The ToC specifies the logic, preconditions, re-quirements, and assumptions behind the causal relationship in each pathway of change. In other words, the ToC describes what and how the selected activities are connected to and will logically yield the desired outcomes and results. The ToC is not only a useful program design and planning tool but also an essential blueprint for building a rigorous framework for results measurement, particularly by helping develop indicators for iden-tified ToC elements.
Building ToCs allows policy makers to identify design problems, align expectations with the resources invested, and identify appropriate indicators that measure what an instru-ment is supposed to do. However, despite the advantages of ToCs, most institutions do not construct them for their instruments. As a result, instruments may have goals that have no clear connection with the intervention, indicators that are not clearly related to what the instrument does, or may be missing indicators that are relevant to the intervention.
A ToC can be presented as a diagram illustrating the elements of the logical framework. Figure 1.1 presents an example of a ToC diagram developed for an R&D support program. The vertical arrow on the left shows the logical path from inputs and activities to outputs and outcomes. The rest of the diagram shows specific elements attributed to the program.
AnAlysis of the CroAtiA smArt speCiAlizAtion strAtegy: logiCAl frAmework, instruments, And indiCAtor results 16

The bottom of the figure lists the inputs that allow for the intervention activities to be conducted. Each of these activities is expected to yield direct results—outputs, which under logical assumptions, should lead to outcomes that the program seeks to achieve. The outcomes of the program should have a direct connection with the program goal and with higher-level strategic goals, as shown at the top of the figure. Finally, there should be measurable, well-defined and time-bound indicators associated with each of these levels (inputs, activities, outputs, outcomes, and goals).
A similar logical framework can be constructed to assess the intervention logic of the S3. Figure 1.2 presents a generic logical framework for the S3. Starting from the bottom of the figure, the S3 requires direct inputs (that is, resources allocated to instruments) and indirect inputs (external conditions and governance conditions). These inputs are used to deploy different instruments. The activities deployed within instruments contribute to specific, medium-term objectives or outcomes, and the objectives, in turn, contribute to the long-term strategic objective and vision. This connection between inputs, instru-ments, specific objectives, and overall objectives requires credible assumptions regarding how each lower level contributes to the next highest level, as represented by the curved arrow in Figure 1.2. To measure the achievement of targets, it is necessary to define ap-propriate indicators at each level and document how they connect to higher-level goals. Finally, the box on the right represents the EDP process, which should inform objectives, instruments, and resource allocation of the S3. This should ideally happen before, or at least concurrently with, the definition of specific goals and instruments of the overall policy, in order for the goals and instruments to be directly informed by sectoral needs and priorities. Indicators should be directly related to the sectoral level, and measured and disaggregated at the sectoral level, showing the contribution of different sectors to the overall objectives.
Because the S3 logical framework involves multiple instruments, the analysis of the intervention logic also explores how each instrument contributes to the achievement of the specific objectives. The objectives, activities, and indicators for each instrument should have a clear connection with the corresponding variables at the S3 policy level. This creates a point of reference to justify or assess the instruments used and the allocation of resources to different instruments. In order to be consistent, realistic, and impactful, each of these instruments should thus have its own ToC, indicating clear inputs, activities, outputs, and outcomes (with indicators for each). Also, since the S3 has its own gover-nance and should be perceived as a sum of instruments contributing towards aggregated goals, the instruments contributing to the overall policy goals and to specific medium-term objectives should be also analyzed as a portfolio, i.e. as a collection of instruments that jointly contribute to the achievement of higher-level goals.
01 aPProaCh 17

Figure 1.1 A proposed ToC for an STI instrument for Croatia
Source: World Bank (2020).
Inpu
tac
tIvI
tyou
tput
outc
ome
Alignment with Higher
Goals
Program Goal
[A1]
Number of technology transfer models realized due to
project implementation
[A2]
Number of collaborative projects contracted after project
completion
[A] Increased transfer of R&D results into commercialization
[B1]
Number of scientific publications published in scientific journals and indexed in 'Web of Science'
[B2]
Number of IPR applications filed
[B] Improved capacity of research organizations to conduct high-quality applied research
[C1]
Value of R&D finance contracted from all sources after project completion
[C] Increased sufficiency of resources for R&D activities
Project management activities (implementation support, financial management, communication & reporting, procurement, etc.)
Research grants awarded through the program
Existing researchers deployed to conduct the research activities
Increased capacity of R&D sector to perform excellent research and to serve the needs of the economy (OPCC, S3)
Research organizations conduct applied research activities that respond to market needs
IF:
Applied research results add values to businesses for commercialization and encourage future collaborations
with research organizations
IF:
Knowledge and TT activities and events enable participants to match
supply and demand for research results for commercialization
IF:
Workforce is not only adequate but also possesses complementary skills and is incentivized and managed well by the
project
IF:
Project can indentify knowledge and skills gaps and caters capacity-building support to
improve research quality
IF:
Improved research infrastructure is utilized at full capacity, maintained regularly, and
upgraded in a timely fashion
IF:
The initial funds help develop the credibility of researchers and enable them to pursue
additional funding even after project completion
[a]
Increased applied research activities oriented towards market needs
[b]
Increased knowledge and technology transfer activities
[a]
Increased workforce engaged in R&D activities
[b]
Increased capacity-building support to improve knowledge and skills
[c]
Improved availibility of research equipment to conduct R&D activities
[a]
Improved funds availibility to conduct R&D activities
Identifying and financing R&D projects with clear aims to respond
to the needs of the economy, particularyl for research projects
whose results can be commercialized
Knowledge dissemination & technology transfer activities
Financing costs of purchasing patents or licences, or cost of
external professional services, or patentability studies
Financing recruitment of new researchers, particularly young researchers, and those
based on horizontal principles such as gender equality
Financing of the networking and training activities (participation in seminars,
conferences, workshops) related to project implementation
Financing investments for purchasing, maintaining, and upgrading research
equipment / instruments and necessary adaptions
Provision of research grants to research organizations meeting grant requirements
[Aa1]
Number of collaborative research projects supported
[Ab1]
Number of events organized or attended to promote knowledge
and technology transfer to business sector
[Ab2]
Number of enterprises reached to promote knowledge and
technology transfer
[Ba1]
Number of full-time equivalent (FTE) reseachers involved in project
implementation
[Bb1]
Number of researchers receiving training
[Bc1]
Number of researchers benefiting from new or improved research equipment
[Bc2]
Value of new or improved research equipment
[Ca1]
Value of funds distributed
Ass
umpt
ions
AnAlysis of the CroAtiA smArt speCiAlizAtion strAtegy: logiCAl frAmework, instruments, And indiCAtor results 01 ApproAch18 19

Indicators should be defined at each level of the logical framework. Ideally, each indicator should have a baseline value and a time-bound target value, with a justification and an assessment of (or assumption about) how much a change in the indicator will contribute to the corresponding objective. Indicators should first be defined at the input level, where they should be associated with processes or activities and directly related to instrument or resource deployment. Next, indicators for short-run or output-level achievements should be defined. Examples include the number of projects or firms supported, the number of scientists hired by companies, the number of R&D contracts signed, or the number of scholarships granted. Next, indicators can be set for medium-term achievements or out-comes. These might include the number of patent applications, number of new products developed, number of papers published, or number of newly introduced technologies. Fi-nally, longer-term outcome indicators related to specific and overall strategic objectives are defined. Indicators at this level might include the value of sales of new products or services, change in productivity or high-tech exports, or change in economic complexity of exports.
Figure 1.2 Framework for assessing the S3 intervention logic
Source: Staff elaboration.
TPAa / STPAs
Challenges
Goals and priorities
Gaps
Project pipeline
Indicators
Long-term vision
iNpu
tac
tivi
tyou
tput
outc
ome
Indicators
Indicators
Indicators
Indicators
EDP
Overall strategic objective
Specific objectives (medium run)
Instruments
Inputs: EU and national financial resources, private
financing
Inputs: External conditions (infrastructure, regulation,
firm, university, and goverment capabilities
Inputs: S3 governance,
TPA/STPA governance and priorities (EDP)
Ass
umpt
ions
and
logi
cal
cont
ribut
ion
of e
ach
goal
and
in
dica
tor t
o th
e ne
xt le
vel
AnAlysis of the CroAtiA smArt speCiAlizAtion strAtegy: logiCAl frAmework, instruments, And indiCAtor results 20

Sectoral objectives, challenges, key areas of change, and projects should guide the same variables at the overall policy level. From an intervention logic point of view, the overall S3, its objectives, the allocation and prioritization of resources, the use of existing instruments, their adaptation, and any need for new instruments should be informed by the priorities, needs, and pipeline projects from each STPA. Taking the STPAs into account in this way should ideally happen before—or at least concurrently with—the definition of specific goals and instruments for the overall policy, in order for the overall policy goals and instruments to be directly defined by the sectoral needs and priorities. The overall policy analysis should be complemented by the sectoral priorities, and it should take into account aggregate challenges stemming from sectoral needs.
a Note oN souRce documeNts
The analysis is based on the officially adopted S3 well as informal revisions introduced in practice in the monitoring framework during S3 implementation. The Smart Specializa-tion Strategy 2016–2020 adopted by the Croatian Government is the starting point for the analysis. However, in recent years, the Revised S3 Monitoring Framework and the official S3 Action Plan 2019–2020 introduced certain revisions to the S3 logic. These revisions affected the formulation of S3 objectives, the structure of the S3 policy mix, how policy instruments are presented, and the indicators tracked. These revisions were never formal-ized through amendments to the original strategy, which makes the task of analyzing the intervention logic more complex. In cases where any of the elements of the intervention logic were supplemented or revised in the later documents, the report explores the way such revisions were introduced and provides an assessment of the end results.
Where possible, the analysis draws comparisons with the S3 of another EU member state as a benchmark. For benchmarking purposes, the National Research and Innova-tion Strategy for Smart Specialization of the Czech Republic (2016) is used as a point of reference. The Czech Republic, being a central European country at a higher but relatively comparable level of development as Croatia, provides a solid benchmark. The Czech S3 was selected as an example of good practice among the ‘new’ EU members and highlights some of the challenges of the Croatian S3.
01 aPProaCh 21

Intervention logic
02 23

02 Intervention logic
○ The S3 intervention logic is highly complex, especially at the level of objectives and delivery instruments. The logical framework is missing a clear connection with sec-toral priorities as well as an elaboration of the assumptions behind each level of the intervention logic.
○ The sectoral dimension is only partially integrated in the intervention logic of the S3. Beyond identifying sectoral priorities, the EDP has had very limited influence on the elements of the intervention logic.
○ The vision and objectives are broad and vague and would benefit from having clear definitions and indicators. During implementation, the structure of objectives was further complicated and redundancies were introduced.
○ Instruments are defined in several layers, which introduces complexity and makes it more difficult to connect them to other elements of the intervention logic. This struc-ture was streamlined during implementation, but some inconsistency persists.
○ Indicators are set at the level of instruments, and very few are specific to sectoral prior-ities. Even though output indicators are supposed to be tracked at the level of sectoral priorities, this is in practice done only for some programs and indicators.
○ The revised monitoring framework introduced during implementation significantly re-structured indicators and introduced some improvements (for example, by adding defi-nitions) but also some setbacks (for example, the new indicators have no target values).
Developing a ToC for the S3 allows for a systematic overview and analysis of the inter-vention logic. Figure 2.1 shows a condensed overview of the intervention logic implied in the original S3 design. No explicit policy ToC was developed at the time of policy formu-lation, which may have obfuscated some gaps or overlaps in the intervention logic. The S3 defines a long-term vision and an overall strategic objective. The strategic objective is supported by six specific objectives and four delivery areas, which correspond to expected outcomes of the policy. Each specific objective and delivery area is supported by delivery instruments, which are formulated as collections of lower-level objectives and funding schemes. Specific objectives and delivery instruments are associated with output, out-come, and context indicators. Each delivery instrument is further disaggregated into one
AnAlysis of the CroAtiA smArt speCiAlizAtion strAtegy: logiCAl frAmework, instruments, And indiCAtor results 24

or more “ways of implementation,” which represent actual instruments and their activities. The S3 also defines inputs, which include financial resources (EU funds, national budget, and private investment), framework conditions (such as infrastructure, regulations, and capabilities of the research sector), and S3 governance. The S3 also reflects its sectoral perspective by defining five TPAs and thirteen STPAs.
Figure 2.1 Original S3 intervention logic for Croatia (implicit ToC)
Staff elaboration based on Croatia Smart Specialization Strategy 2016-2020.
TPAa / STPAs
Challenges
Goals and priorities
Gaps
Project pipeline
Indicators
Long-term vision
iNpu
tac
tivi
tyou
tput
outc
ome
Delivery instruments
Delivery areas
Output, outcome and
context indicators
EDP
Ways of implementation
(actual instruments and their activities)
Inputs: EU and national financial resources, private
financing
Inputs: External conditions (infrastructure, regulation,
firm, university, and goverment capabilities
Inputs: S3 Governance,
TPA/STPA governance and priorities (EDP)
Specific objectives
Overall strategic objective
Ass
umpt
ions
and
logi
cal
cont
ribut
ion
of e
ach
goal
and
in
dica
tor t
o th
e ne
xt le
vel
02 intErvEntion logiC 25

The S3 ToC revealed some gaps in the intervention logic. The missing elements of the framework are shown in dashed lines in Figure 2.1. First, the logical connections between the different elements of the framework (outputs, outcomes, overall objective, and vision) are not fully clear. Second, the underlying assumptions of how each component of every level affects the level above are not extensively elaborated. Third, the structure of the intervention logic is also missing the connection with the EDP. As described in Section 1, the EDP should be at the heart of the smart specialization approach. However, there is no feedback mechanism connecting the different elements of the S3 framework with TPA/STPA challenges, projects and indicators.
Redundancies identified in the intervention logic increase the complexity of the pol-icy framework. The S3 ToC revealed a high degree of complexity at the level of policy instruments. The S3 introduces four delivery areas, which appear in parallel to specific objectives, to group delivery instruments based on the part of the innovation chain that they target. This category is not associated with any specific indicators, so it does not have much analytical value. At the same time, it creates ambiguity at the level of specific objectives and increases complexity in the policy framework.
The concept of delivery instruments is not clearly defined and consistently applied. Deliv-ery instruments represent a mix of shorter-run objectives and actual delivery mechanisms. (See Section 2.3 for more detail.) The delivery instruments are operationalized through
“ways of implementation,” which represent delivery mechanisms with more specificity.4 The “ways of implementation,” however, do not have indicators assigned to them, so their expected contribution to the S3 objectives is not clear.
The approach adopted during implementation partially addressed the shortcomings of the initial design, but also increased its complexity. The structure of the implicit in-tervention logic used during implementation is presented in Figure 2.2. An explicit policy ToC is still missing, as is the elaboration of logic and connections between the TPAs and the overall S3 logic. The concept of delivery areas was abandoned during implementation. However, a new layer of outcomes was introduced between the strategic objective and specific objectives. This new layer consists of 4 dimensions and three main objectives. The main objectives and dimensions add little value to the existing specific objectives, so one of these categories can be considered redundant. Specific objectives were disaggregat-ed into specific sub-objectives, where a higher-level objective encompasses lower-level sub-objectives. Delivery instruments and “ways of implementation” were replaced by a more straightforward category of “policy instruments”. The connections between indicators and policy instruments were presented more clearly, which should clarify the logic of the intervention, its connection with the medium and higher-level objectives and facilitate the monitoring process.
4 “Ways of implementation” are listed in Annex 5 of the S3 document.
AnAlysis of the CroAtiA smArt speCiAlizAtion strAtegy: logiCAl frAmework, instruments, And indiCAtor results 26

Figure 2.2 Intervention logic during implementation (implicit ToC)
Source: Staff elaboration.
The analysis of each level of the intervention logic is based on the combination of the original S3 design and revisions introduced during implementation. Figure 2.3 shows a fully developed ToC that combines elements of the original S3 design with the new elements added during S3 implementation.5 This figure will be used for specific analysis, findings and recommendations in this report.
5 For simplicity, the figure does not show the original delivery instruments and “ways of implementation” that were replaced by policy instruments. A detailed list of these elements, presentation of their connections and how they were subsumed into policy instruments, is available in the Appendix. For the same reason, the categories of delivery areas and dimensions are not shown in the figure. The two elements, however, are analyzed in section 2.2.
TPAa / STPAs
Challenges
Goals and priorities
Gaps
Project pipeline
Indicators
Long-term visioniN
put
acti
vity
outp
utou
tcom
e
Specific sub-objectives
Output and
outcome indicators
Core indicatorsDimensions Main
objectivesContext
indicators
EDP
Policy instruments
Inputs: EU and national financial resources, private
financing
Inputs: External conditions (infrastructure, regulation,
firm, university, and goverment capabilities
Inputs: S3 governance,
TPA/STPA governance and priorities (EDP)
Specific objectives
Overall strategic objective
Ass
umpt
ions
and
logi
cal
cont
ribut
ion
of e
ach
goal
and
in
dica
tor t
o th
e ne
xt le
vel
02 intErvEntion logiC 27

Figure 2.3 A detailed proposed map of the current/revised S3 implicit ToC
Source: Staff elaboration based on Croatia Smart Specialization Strategy 2016-2020 and Revised Monitoring Framework.
Source: Staff elaboration based on Croatia Smart Specialization Strategy 2016-2020 and Revised Monitoring Framework.
outc
ome
Impa
ct
Croatia will be recognized as a knowledge-based economy embracing creativity and innovation at all levels of society for improved quality of live of all its citizens
1. Increased capacities of the RDI sector to perform excellent research and to serve
the needs of the economy
Focusing knowledge and innovation capacities into areas of greatest potential for Croatia to drive competitiveness and socio-economic development and transform Croatian economy through effective RDI activities
2. Overcoming the fragmentation of the innovation value chain and the gap
between research and the business sector
3. Modernizing and diversifying the Croatian economy through increasing
private investements into RDI
4. Upgrading in global value chains and promoting internationalization of
Croatian enterprises
5. Working in partnerships to address societal challenges
6. Development of smart skills - upgrading the qualifications of existing and new work
force for smart specialization
1.1 Better understanding of what research strengths currently exist which will inform what gaps
need to be filled
1.2 Avoidance of duplication or underutilization of publicly funded research infrastructure; Facilitated
access to enabling design, prototyping and pilot production infrastructure and expertise linked to the usage of
infrastructure
1.3 Increase R&D ability for conducting top quality research and cooperation on
national and international level
1.4 Research conducted for the needs of economy
1.5 Enhanced university-industry collaboration through knowledge
transfer and application of research results to the market
2.1 Strengthening links between scientific and business sector
2.2 Institutional set-up for Innovation system
3.1 Support to business investments in RDI (Strengthened capacities for RDI of enterprises
(including SMEs); their productivity, competitiveness and export activity
raised, and diversified production and services offer)
3.2 Strengthened SMEs capacities to innovate
(implementation of new solutions in the areas of technology, product,
process and organizational innovations, including marketing
innovations, design and innovation advisory, IPR and support services
as well as non-R&D based solutions applied by SMEs)
4.1 Benchmark of industrial sectors according to Global perspective, for purpose of better international positioning, focused policy
defining and targeted investments in future
5.1 Support to social innovation6.1 Improving tools for smart skills policies
6.2 Development and upgrading of smart skills within education system
(at all levels - vocational trainings, higher education and adult learning programs)
Supporting development of Competence Centers
Transfer of technology from ROs to business sector - Support to TTOs + STPII TTO support program
Research infrastructure usage and researchers' services for SMEs (STPII IRCRO program)
Establishment of Innovation Network for Industry and Thematic innovation Councils
Financial Inputs
(EU Funds, Government Resources, and Private
Investments
Governance
(S3 Governance, TPA/STPA governance
and priorities management)
Institutional Support
(Infrastructure regulation;
firm, university, and government
capabilities)
actI
vItI
eSou
tput
SIn
putS
Inpu
tS
Overall Strategic Objective
Specific objectives
S3 Vision
Specific sub-
objectives
Improving capacity, performance and skills for excellent and relevant research in the public sector Bridging the gap between the research and business sector Improving the efficiency and skills of the business sector for research, development and innovationMain objectives
Ass
umpt
ions
ElEmEnts addEd aftEr s3 adoption
“Transfer” policy instruments“Institutional” policy instruments
Science and Technology Foresight
Preparation of RDI infrastructural projects
Investment into organizational reform and infrastructure of R&D&I sector
Croatian Scientific and Educational Cloud (HR-ZOO)
Center for advanced laser techniques (CALT)
Children Centre for Translational Medicine at the Children’s Hospital Srebrnjak
Open scientific infrastructural platforms for innovative applications in economy and society – O-ZIP
Development and strengthening synergies with HORIZON 2020 horizontal activities: Twinning and ERA chairs
Development and strengthening synergies with HORIZON 2020 horizontal activities: Teaming
Centers of Research Excellence performing excellent science
Research projects of Croatian Science Foundation (all fields of science) – basic and applied research conducted by a recognizable research group
Installation Research program of Croatian Science Foundation (all fields of science)
Croatian-Swiss Research Programme 2017 – 2023 (CSRP) – all fields of science, Implementing body: Croatian Science Foundation
Young Researchers' Career Development Programme (all fields of science)
Program for enhancing R&D climate change activities
Science and Innovation Investment Fund
Second Science and Technology Project (STPII) - POC public
Strengthening capacities for research, development and innovation
Support to development of new products/services resulting from R&D
activities (Phase I)
Support to development of new products/services resulting from R&D
activities (Phase II)
Innovations in S3 areas
Integrator
Innovations of newly-established SMEs (Phase I)
Innovations of newly-established SMEs (Phase II)
Commercialization of Innovation in Entrepreneurship
Innovation Vouchers
EUREKA
EUROSTARS
Proof of technological feasibility and commercialization capacity of
innovative product/technology/service at SMEs (STPII - PoC private)
Support for RDI activities of SMEs for their technological upgrade and
global competitiveness (STPII – RAZUM program)
Strategic project to support the Cluster Competitiveness Initiatives Support to social innovation
Implementation of The Strategy for Lifelong Guidance and Career Development in the
Republic of Croatia 2016-2020
Implementing the Croatian Qualification Framework and development of tools for connecting education and labor market
Implementing the Croatian Qualification Framework on Higher Education level
STEM student scholarships
Career development of young researchers (PhD education)
Modernization of vocational education and training programs and raising their quality
to increase students' employability and opportunities for further education
Policy instruments
AnAlysis of the CroAtiA smArt speCiAlizAtion strAtegy: logiCAl frAmework, instruments, And indiCAtor results 02 InterventIon logIc28 29

2.1 Sectoral priorities
The S3, as a concept, has to be partially guided by a bottom-up sectoral logic. S3 policy objectives, specific objectives, and instruments should be guided by the needs of priority sectors, whose objectives, challenges, and projects should influence all elements of the intervention logic. The sectoral lens is introduced in practice through TPAs and STPAs, identified through the EDP. According to the S3 Platform of the EC Joint Research Cen-ter, the EDP is an inclusive and interactive bottom-up process in which participants from different environments (policy, business, academia, and so on) discover and produce in-formation about potential new activities and identify potential opportunities that emerge through this interaction, while policymakers assess outcomes and ways to facilitate the realization of this potential.
Croatia only partially adopted the bottom-up approach envisaged in the EDP process. To facilitate the EDP, the Ministry of Economy, Entrepreneurship, and Crafts (MEEC)6 led the establishment of Croatian Clusters of Competitiveness (CCCs). The establishment of CCCs was a top-down initiative to create platforms of triple-helix stakeholders to jointly define strategic goals and lead the S3 EDP. Of 13 CCCs, 8 participated in the elaboration of TPAs (Table 2.1), while 5 were not explicitly mentioned in the S3 as relevant for specific TPA identification.7 CCCs developed and adopted strategic guidelines for each sector. The strategic guidelines articulated the sectoral vision, general objective, and priority areas for improvement for the 2013–2020 period. The strategic guidelines also described the purpose, justification, and specific measures for targeting each priority area identified for the sector. Additionally, some business clusters were reportedly involved in the develop-ment of some TPAs. As opposed to CCCs, which were top-down, business clusters were self-organized clusters of companies established to support collaboration, internation-alization, supply chain development, promotion, and so on.
The S3 identified five TPAs, thirteen STPAs, and two cross-cutting themes based on con-sultations with stakeholders and analyses of strengths, weaknesses, and capabilities in each sector. Figure 2.4 presents the TPAs, STPAs, and cross-cutting themes selected as sectoral priorities for the S3. TPAs were identified mostly through consultations with CCCs, together with analyses of strengths and potentials in the business and research sectors and assessment of RDI capacities and ability to respond to societal challenges. Each TPA consists of two or three STPAs, which provide further specification. Two cross-cutting
6 The Ministry of Economy and Sustainable Development (MESD) was established in July 2020 as the successor of the Ministry of Economy, Entrepreneurship, and Crafts (MEEC). Therefore, all actions implemented after July 2020 refer to MESD, while actions implemented before that date refer to MEEC.
7 CCC of Construction Industry, CCC of Textile, Leather Goods and Footwear Industry, CCC of Creative and Cultural Industries, and CCC of Chemicals, Plastics and Rubber Industry. Additionally, the 13th CCC, covering Personalized Medicine Industry, was established in November 2015 and is not mentioned in the S3 document. This is understandable considering it was established very close to S3 adoption in March 2016.
AnAlysis of the CroAtiA smArt speCiAlizAtion strAtegy: logiCAl frAmework, instruments, And indiCAtor results 30

themes were also identified: key enabling technologies (KET)8 and information and com-munication technologies (ICT), which are considered equally relevant and applicable to all TPAs. For each TPA, the S3 describes the expected synergies of the business and RDI sector and potential for its further development. For each STPA, the S3 also elaborates the RDI capacity of the related industries, key stakeholders, strengths, and notable achieve-ments of the business sector. The same elements are then presented for the research sector, in most cases referring to public research. Finally, indicative RDI topics of the STPA are listed, together with related KET and ICT topics (Table 2.2).
Table 2.1 The CCCs involved in S3 TPA elaboration
tpa cccs
Health and Quality of Life ○ Health Industry ○ ICT Industry
Energy and Sustainable Environment
○ Electrical and Manufacturing Machinery and Technology ○ ICT Industry
Transport and Mobility ○ Automotive Industry ○ Maritime Industry ○ Electrical and Mechanical Machinery Industry and Technology ○ ICT industry
Security ○ Defense Industry ○ ICT Industry
Food and Bioeconomy ○ Food Processing ○ Wood Processing
Source: Croatia Smart Specialization Strategy 2016–2020.
8 According to the definition applied by the European Commission, KETs are a group of six technologies: micro and nanoelectronics, nanotechnology, industrial biotechnology, advanced materials, photonics, and advanced manufacturing technologies. Such technologies increase industrial innovation to address societal challenges and create advanced and sustainable economies.
02 intErvEntion logiC 31

Figure 2.4 TPAs and STPAs of the S3
Source: Croatia Smart Specialization Strategy 2016–2020.
Them
atic
pr
iorit
y ar
eas
(TPA
s)
Sub-
them
atic
prio
rity
area
s
(STP
Aa)
Cro
ss-c
uttin
g th
emes
e
Pharma - ceuticals,
biopharma ceuticals, medical
equipment and devices
Health services and
new methods of preventive
medicine and diagnostics
Nutritionism
Energy technologies, systems and equipment
Environment- friendly
technologies, equipment and
advenced materials
Added value manufacturing of road and rail veliches parts and systems
Environment- friendly
transport solutions
Intelligent transport
systems and logistics
Cyber security
Defense dual-use
Mine action program
Sustainable food production and processing
Sustainable wood production and processing
Health and quality of life
Energy and sustainable
environmentTransport
and mobilitySecurity Food and
bioeconomy
Key enabling technologies (KET) Information and Communication Technologies (ICT)
AnAlysis of the CroAtiA smArt speCiAlizAtion strAtegy: logiCAl frAmework, instruments, And indiCAtor results 32

Table 2.2 Example of indicative RDI topics for STPA Pharmaceuticals, biopharmaceuticals, medical equipment, and devices
iNdicative Rdi topics of the stpa iNdicative Rdi topics uNdeR cRoss-cuttiNg themes Kets aNd ict that aRe coNNected with the stpa
• discovery and development of drugs for hu-mans and animals: new chemical and bio-tech entities, new chemical synthesis processes for generic substances, products, or new entities (i.e., molecules under patent protection)
• development of new vaccines and blood plas-ma preparations
• development of new medical technologies and protocols/procedures (i.e., in cardiology and radiology)
• new finished dosage forms for generic and pat-ented drugs, including over-the counter prod-ucts and dermatological cosmetics
• herbal medicines • development of medical (including dental)
equipment and devices• development of systems, applications and solu-
tions used in research and testing of new med-icines, preparations, vaccines, and substances for monitoring, treating, or controlling diseases and illnesses and organism rejuvenation
• KETs for more efficient and less invasive drugs and therapies (implantable medical devices and improved surface coatings and coating techniques for drugs)
• KETs for robots and assistive technologies and processes
• process and embedded computer automation and control processes
• computer vision and machine learning with ap-plication in pharmaceuticals, biopharmaceuti-cals, medical equipment, and devices
Source: Croatia Smart Specialization Strategy 2016–2020.
The connection between the sectoral analysis (and related TPAs and STPAs) and overall policy objectives and instruments appears to be limited. The strategic choices for each TPA and STPA should be key drivers of (i) the instruments that should be used or created to address the competitiveness challenges of each sector and (ii) the resource allocation to address those challenges. S3 policy objectives should also be connected to or driven by sectoral competitiveness challenges arising from the TPAs. For example, if expanding the research base is a key challenge and resource needed for one TPA (more than other TPAs), then the specific objective of the S3 that refers to increasing research excellence should be relatively more focused and influenced by the investments of that TPA, and instruments supporting that objective should receive relatively more projects from that particular TPA. If, on the other hand, all sectors push for more business R&D, this objec-tive should probably be higher in importance. While the sectoral analysis identifies RDI priorities for each STPA (as shown in Table 2.2), the S3 does not explain how these priori-ties informed the selection of instruments and prioritization of TPAs within each specific objective, or the prioritization between different specific objectives.
02 intErvEntion logiC 33

Examples of using the EDP to revise sectoral priorities during implementation are lim-ited, and the approach for doing so is unclear. The EDP should influence the S3 policy continuously during its implementation, potentially revising the priorities based on per-formance monitoring. A re-prioritization was done only in the context of two programs implemented by the MESD: (1) Increasing the Development of New Products and Ser-vices that result from Research and Development Activities – Phase 2 (IRI-2); and (2) the Integrator program. In case of the IRI-2 program, a narrowed-down list of indicative RDI topics for each STPA was used to define eligible projects. The selection of RDI topics was based on the work of Thematic Innovation Councils,9 public consultations, insights from strategic projects,10 World Bank analyses, the MEEC and the CCE, and the collaboration of the private sector in the CCCs.11 However, details on the methodology for the selection of RDI topics were not provided. For the Integrator program, project eligibility directly ref-erences strategic segments for STPAs that were identified through the Strategic Project for Support to Competitiveness Clusters Initiatives.12 The program documentation again references CCCs as one of the sources of such prioritization, but in this case the TICs are not mentioned as one of the sources. Nonetheless, the exact approach and the degree of CCC engagement remain unclear.
2.2 Vision and objectives
The Croatian S3 defines a horizontal vision, an overall strategic objective, and six specific strategic objectives, but does not reflect the sectoral nature of the strategy. Figure 2.5 shows the formulation of the vision, strategic objective, and specific objectives. In the in-tervention logic framework, specific objectives correspond to planned outcomes of policy instruments, which contribute to the achievement of long-term impacts as formulated in the strategic objective and vision. All three categories of S3 objectives shown in Figure 2.5 are horizontal, that is, defined at the overall S3 level and referring equally to all TPAs.
The absence of a sectoral component in the S3 objectives could reflect the disconnect from the EDP in its original design. The connection with the EDP and the extent to which it influenced the formulation of the vision and the objectives is not explicit. This connection
9 Thematic Innovation Councils collected project ideas from their members, assessed them, and labeled them as relevant for an STPA or not. The results of this exercise were reportedly considered in the process of selecting RDI topics in a particular STPA.
10 See section 2.3 for more details. 11 For example, the STPA Mine Action Program was not considered a priority for financing under IRI-2.
According to the TIC for TPA Security, the STPA was excluded due to (1) lack of interest from the private sector in applying for projects in the area, (2) World Bank analyses characterizing it as a declining industry, (3) re-organization of the Croatian public administration system and discontinuation of the work of the Croatian Mine Action Center as of 2019, (4) the possibility of integrating, to some degree, relevant indicative RDI topics into topics of STPA Defense and Dual-Use Technologies and Products, and (5) the fact that no project ideas were submitted from the area.
12 More details on the S3 strategic projects are provided in section 2.3.
AnAlysis of the CroAtiA smArt speCiAlizAtion strAtegy: logiCAl frAmework, instruments, And indiCAtor results 34

is necessary to fulfill the principles that guide this type of policy. In fact, however, the anal-ysis and identification of challenges refer to the whole economy, the instruments are in essence horizontal, and the vertical perspective is rarely taken into account.
Figure 2.5 Overview of S3 vision and objectives, as originally presented in the S3 document
Source: Croatia Smart Specialization Strategy 2016-2020.
The long-term vision and overall strategic objective are vague and would benefit from clarification and quantification of the underlying concepts. The concepts used in the vision and strategic objective are not linked to any indicators or targets, which makes it difficult to measure the overall success of the S3. While the policy vision and objectives can be formulated broadly, they should be backed up by clear definitions and well-defined, measurable, and time-bound indicators. For example, the S3 provides no elaboration of what it practically means to be “recognized as a knowledge-based economy” or how one could know whether the country is “embracing creativity and innovation.” The vision
outc
ome
impa
ct
S3 Vision
Croatia will be recognized as a knowledge-based economy embracing creativity and innovation at all
levels of society for improved quality of live of all its citizens
Overall Strategic Objective
Focusing knowledge and innovation capacities into areas of greatest potential for Croatia to drive competitiveness and socio-economic development
and transform Croatian economy through effective RDI activities
Specific Objectives
1. Increased capacities of the RDI
sector to perform excellent research and to serve the needs
of the economy
2. Overcoming the fragmentation
of the innovation value chain and the gap between research and the
business sector
3. Modernizing and diversifying the
Croatian economy through increasing private investements into RDI
4. Upgrading in global value chains and
promoting internationalization of Croatian enterprises
5. Working in partnerships to
address societal challenges
6. Development of smart skills -
upgrading the qualifications of existing and new work force for
smart specialization
02 intErvEntion logiC 35

statement lacks specificity regarding the expected impact of these concepts on “quality of life.” Similarly, the elaboration of the overall objective should clarify the meaning of “so-cio-economic development,” “competitiveness,” and “the transformation of the Croatian economy,” given that these concepts are very broad and can be interpreted in a variety of ways. The specific meaning of the vision and objectives would be clearer if they were associated with indicators and baseline and target values. This would allow policymak-ers and stakeholders to measure the achievement of these concepts and evaluate the success of the S3.13 Box 2.1 shows how the vision and strategic objectives were defined and articulated in the Czech S3.
13 For a detailed discussion on S3 indicators see section 2.4.
Box 2.1 Vision and strategic objectives of the Czech Research and Innovation Strategy for Smart Specialisation (RIS3)
The Czech RIS3 provides a clearer and closer link between each level of objectives and indicators designed to assess the achievement of the corresponding level. The stated vision in the Czech RIS3 is as follows: “Czech Republic – enterprising, creative and attrac-tive to talent and money.” Each concept in the vision is explained and associated with indicators that seek to verify the fulfillment of each part of the vision, together with base-line levels of each of these indicators. For example the term “enterprising” is explained as relating to people that “put their ideas to the test in a competitive market” and “companies they manage want to be successful not only at home but also in the European or global market.” The achievement of this part of the vision is measured through three indicators: (1) Number of newly established companies per 1,000 inhabitants, (2) Share of people up to 35 years of age doing business, and (3) New companies as % of all active economic entities. Similarly, the Czech RIS3 defines indicators for strategic and specific objectives.
Source: Staff elaboration based on the National Research and Innovation Strategy for Smart Specialization of the Czech Republic (2016).
Specific strategic objectives partially overlap and would also benefit from additional elaboration of their meaning. For example, Strategic Objective 2 is formulated as “Over-coming the fragmentation of innovation value chain and the gap between research and business sector”. Measuring the achievement of this objective requires a clear explanation
AnAlysis of the CroAtiA smArt speCiAlizAtion strAtegy: logiCAl frAmework, instruments, And indiCAtor results 36

of what it means to “overcome” the fragmentation, a specification of what part of the value chain is fragmented, and indicators that can show that this goal is achieved. Another ex-ample is the term “societal challenges” used in Strategic Objective 5; “societal challenges” is a very broad concept and is not well explained in S3. In some cases, there is an overlap between different strategic objectives. For example, both Strategic Objective 1 and Stra-tegic Objective 2 refer to the connection between the research sector and businesses.
The logical connections between objectives at different levels are not fully explained. Achieving higher-level objectives requires making assumptions about how and to what extent lower-level objectives contribute to those higher-level objectives. While the descrip-tion of each specific objective explains its purpose, justification for selection, and associ-ated delivery instruments, there is no explanation of the connection with the higher-level overall strategic objective. The S3 does not document the assumptions that must be true for each specific objective to contribute to the level above. Because the objectives are formulated vaguely and open to interpretation, the logical connections between different levels are not self-evident (Box 2.2). Further, there are factors and conditions beyond the scope of the S3 policy that may influence its effectiveness and that should be recognized by the S3. These include different aspects of business environment, competition policy, and similar (see World Bank 2019 for further details).
Box 2.2 Elaboration of assumptions and connections between objectives at different levels: example from Strategic Objective 4
The assumptions underlying Specific Objective 4—Upgrading in global value chain and promoting internationalization of Croatian economy—are not fully elaborated. The stat-ed purpose of Specific Objective 4 is to “focus on investment in knowledge-based capital so as to upgrade to higher-value segments of global value chains and improve Croatia’s position in the global value chain in purpose to increase domestic value added content in export and promoting internationalization of Croatian economy.” The formulation of the purpose of the objective already contains an assumption: that focusing investment in knowledge-based “capital” will improve Croatia’s position in global value chains. However, the strategy does not present evidence that the lack of knowledge-based capital is the main constraint on the integration of Croatian firms into higher-value global value chains. There may be other factors at play.
Further, the elaboration of the specific objective does not specify the mechanism or pathway of change that would contribute to the overall strategic objective. The justifi-cation for the specific objectives provides generic links between integration into global value chains and growth and development. However, it does not explain how, under what conditions, or to what extent integration into higher-value segments of global value chains would be able to increase competitiveness and socio-economic development.
02 intErvEntion logiC 37

Finally, because the overall strategic objective and its key concepts are not elaborated or specified, it is difficult to assess the contribution of the specific objective to the overall objective. For example, the strategy does not specify the meaning of “competitiveness” or “socio-economic development,” making it difficult to assess the contribution of the specific objective to these aspirations.
The Czech RIS3 can serve as an example of how some of these assumptions could be integrated. In the presentation of the proposed key areas of intervention and strategic objectives, the Czech RIS3 lists a set of conditions and barriers for implementing interven-tions. For example, for the area of intervention “Higher innovation performance of com-panies,” the Czech RIS3 clearly elaborates the following factors: increasing the stability of the tax and regulatory environment, reducing the administrative burden in the business environment, and combating high levels of perceived corruption.
Source: Staff elaboration based on Croatia Smart Specialization Strategy 2016–2020 and National Research and Innovation Strategy for Smart Specialization of the Czech Republic (2016).
The underlying justification for the content of the S3 objectives is unclear and, to some extent, they are disconnected from the analysis provided in the document. The vision and overall objectives in a smart specialization strategy are usually justified by nationwide or mul-tisector challenges, market or system failures, and gaps. A diagnostic is typically presented to provide evidence of market or system failures, and the vision and objectives are proposed to address them. While the Croatian S3 presents a diagnostic, the identified challenges and weaknesses are only loosely connected to the vision and goals, and they do not appear to be linked to the specific challenges of the sectors that are supposed to transform the econo-my. For instance, the analysis chapter in the S3 document identifies challenges that include low relevance of high-tech and modern sectors, low diffusion and adoption of key enabling technologies, poor integration into value chains, weaknesses in the innovation system, low spending for R&D, bias in STI financing towards commercialization and on (few) high-tech firms, insufficient linkages between research and industry, low number of R&D personnel, concentration of tax incentive benefits by sector and firm size, the lack of early stage financ-ing, barriers to science-industry collaboration, and pervasive weaknesses in the governance framework. The conclusions of the analysis recognize the objectives of achieving sustainable income and employment growth, strengthening international competitiveness, producing and exporting innovation-based products, moving towards higher value-added activities, and so on. However, these challenges—and other aspirations referenced throughout the diagnos-tic—were not entirely translated into the overall objective or the specific objectives in the S3.
The S3 vision and objectives show little differentiation from other innovation policies or strategies of Croatia. The objectives of the S3 are strikingly similar to the Strategy for Fostering Innovation 2014–2020 (SFI, Table 2.3). For example, one of the specific objectives of the S3 is to upgrade the position of Croatian companies in global value chains (GVCs). In the SFI, this is part of the strategic vision. This could be explained by the fact that the SFI was adopted earlier, and to some extent ‘sets the stage’ for the S3. In this sense, the
AnAlysis of the CroAtiA smArt speCiAlizAtion strAtegy: logiCAl frAmework, instruments, And indiCAtor results 38

fact that GVC upgrading was a higher-level objective in the SFI, and then translated into one of the S3 specific objectives would be logical and reflect coherence between the two strategies. However, a vertical policy like S3 should reflect a stronger sectoral component than a regular horizontal innovation policy framework. Box 2.3 describes the connection of S3 with other national strategies.
Table 2.3 Comparison of the S3 objectives with objectives of the SFI
stRategy foR fosteRiNg iNNovatioN 2014–2020
smaRt specializatioN stRategy 2016–2020
visi
oN By 2020, Croatia will be internationally recog-nized for scientific-research excellence and positioned as a valuable partner in the global innovation value chain, based on an innovation system that permanently increases the com-petitiveness of the economy and responds to social challenges, and which is based on the creation and effective application of knowledge, creativity and innovation.
Croatia will be recognized as knowl-edge-based economy embracing creativity and innovation at all levels of society for im-proved quality of life of all its citizens.
oveR
all o
bjec
tive Increasing the level of competitiveness and
social wellbeing of the Croatian economy, as a result of investments in knowledge, creativity and innovation.
Focusing knowledge and innovation capaci-ties into areas of greatest potential for Croatia to drive competitiveness and socio-economic development and transform Croatian econo-my through effective RDI activities
spec
ific
obj
ecti
ves • SO1. Increasing innovation performance of
the Republic of Croatia• SO2. Increasing the share of business sector
investments in total investments in research and development
• SO3. Increasing the number of basic and applied research intended to strengthen the competitiveness of the economy
• SO4. Strengthening human capacity for research, technological development and innovation
• SO1. Increased capacities of RDI sector to perform excellent research and to serve the needs of the economy
• SO2. Overcoming the fragmentation of in-novation value chain and the gap between research and business sector
• SO3. Modernizing and diversifying Croa-tian economy through increasing private investments into RDI
• SO4. Upgrading in global value chain and promoting internationalization of Croatian enterprises
• SO5. Working in partnerships to address societal challenges
• SO6. Development of smart skills - up-grading the qualifications of existing and new work force for smart specialization
Source: Croatia Smart Specialization Strategy 2016–2020, Strategy for Fostering Innovation 2014–2020.
02 intErvEntion logiC 39

Box 2.3 Connection of S3 with other strategies
Smart specialization strategies have been put in place in various European countries after the adoption of several other transversal and sectoral strategies. For that reason, the S3 should, at minimum, acknowledge the existence of other relevant strategies and explain how they have been taken into account and how the S3 is aligned with and con-sistent with earlier strategies.
The Croatian S3 references numerous existing strategies but does not clearly identify connections and complementarities with those strategies. The S3 refers to five strate-gies that contribute to the achievement of national RDI targets. These are the Strategy for Education, Science and Technology, the Strategy for Fostering Innovation, the Industrial Strategy, the Croatian Research and Innovation Infrastructures Roadmap, and the Strategy for Cluster Development. The strategies and their main objectives are briefly described, but the connections and complementarities with the S3 are not explicitly drawn out. Similarly, additional strategies14 are mentioned within sectoral analyses, but there is no explanation of how each sectoral strategy incorporates or builds upon existing strategies.
In contrast, the Czech S3 does a better job at connecting the overall S3 and each sec-toral definition to previous existing strategies. From the beginning of the document, each previous strategy is clearly mentioned, and some connection is proposed in the document. This is done at the “macro” level and at the sectoral level. In the Croatia S3, one can only observe such connections at the sectoral level and without an explanation of how the prior strategies are used.
Source: Staff elaboration based on Croatia Smart Specialization Strategy 2016–2020.
Additional types of objectives were introduced during the implementation of the S3. Three new kinds of objectives were introduced during implementation: main objectives, dimensions, and sub-objectives. Three main objectives were introduced—research in the public sector,
14 The National Health Care Strategy 2012–2020, the National Strategy for Education, Science and Technology and the Croatian Innovation 2014–2020, the Croatian Strategy for Energy Development 2020, the National Program for Energy efficiency 2008–2016, the Strategic Plan of the Ministry of Environment and Nature Protection 2015–2017, the Innovation Strategy of Croatia 2014–2020, the Croatian Research and Innovation Infrastructures Roadmap, the Croatian Strategy for Water Resources Management, the Strategy for Transport Development 2014–2030, the Long-Term Plan for the Development of the Croatian Armed Forces, the National Mine Action Strategy 2009–2019, the National Security Strategy, the National Strategy for Cyber Security, the Plan of the Ministry of Agriculture, Fisheries and Rural Regions 2012–2014, the National Industrial Strategy 2014–2020, the e-Croatia 2020 Strategy, and the Strategy for Broadband Development in the Republic of Croatia 2016–2020.
AnAlysis of the CroAtiA smArt speCiAlizAtion strAtegy: logiCAl frAmework, instruments, And indiCAtor results 40

R&D and capabilities in the private sector, and the connection between the two. Each specific objective could contribute to one or more main objectives (Figure 2.6). Specific Objective 5, however, was not mapped to any of the new main objectives. Further, four dimensions were introduced and associated with revised context indicators. Three of the dimensions match the main objectives. The fourth refers to the performance of the national innovation system. Finally, the action plan provided additional detail about the specific objectives, which was an improvement compared to the official S3 document. Each of the specific objectives was disaggregated into one or more specific sub-objectives.
Changes in the organization of objectives are not sufficiently justified. According to the S3 Action Plan 2019–2020, the main objectives were introduced to contextualize and draw conclusions regarding the achievement of strategic objectives and to simplify and present the intervention logic more clearly. However, a more detailed and explicit justification of the creation of the main objectives would be useful to better guide the organization of policy around these main objectives. In other words, it would be helpful to explain how and why par-ticular specific objectives were combined and to document the nature of and assumptions behind the relations between them. Dimensions were introduced without clear justification. Because they partially mirror the main objectives, they add unnecessary complexity to the logical framework. The explanation provided for the fourth dimension, the one that is not mirrored by a main objective, is related to the results of strategic projects, which affect the performance of the national innovation system as a whole.15 However, it is not clear why this additional dimension was not simply translated into a main objective, which would make the concept of dimensions redundant.
The purpose of introducing specific sub-objectives is not fully clear, and some of them are defined ambiguously. Sub-objectives are listed under the original specific objectives. However, the rationale for their introduction is not clear. A complication is that the new sub-objectives are linked to the existing specific objectives but not the new main objectives. Given that one specific objective may be linked to more than one main objective, clear links between sub-objectives and the main objectives cannot be established. It would be useful to explain the rationale for each sub-objective and how and why the sub-objectives add up to every specific objective. For instance, sub-objective 1.1 is very abstract and difficult to assess with concrete instruments and indicators. Sub-objectives 1.5 and 2.1 can be interpreted as very similar if not completely the same because they both refer to strengthening the linkages be-tween the business sector and academia. Sub-objective 2.2, which refers to institutionalization of the innovation system, does not seem to be directly connected to the specific objective that it is included under. These are just some examples of ambiguity in the sub-objectives. For all of them, however, it would be useful to have a rationale on their meaning and intended purpose. Providing a rationale for the changes and a clear description of each sub-objective would also allow for future improvements to build logically on previous ones, decreasing the chance of making the same mistakes twice and thus improving potental upcoming revisions.
15 As noted in the S3 Implementation Report 2016–2019 (draft version), in this context the “strategic projects” include: Science and Technology Foresight (PI01), Croatian Scientific and Educational Cloud (HR-ZOO) (PI04), Center for Advanced Laser Techniques (CALT) (PI05), Establishment of Innovation Network for Industry and Thematic innovation Councils (PI22), and Strategic Project to Support the Cluster Competitiveness Initiatives (PI35).
02 intErvEntion logiC 41

Figure 2.6 Overview of S3 vision and objectives, including the new elements added in 2019-2020
Source: Staff elaboration based on S3 Action Plan 2019-2020, S3 Monitoring Framework and S3 Implementation Report 2016-2019.
outc
ome
Impa
ct
S3 Vision Croatia will be recognized as a knowledge-based economy embracing creativity and innovation at all levels of society for improved quality of live of all its citizens
Overall Strategic Objective
Focusing knowledge and innovation capacities into areas of greatest potential for Croatia to drive competitiveness and socio-economic development and transform Croatian economy through effective RDI activities
Main objectives
Specific objectives
Specific sub-
objectives
1.1 Better understanding of what research strengths currently exist, which will inform what gaps
need to be filled
1.2 Avoidance of duplication or underutilization of publicly funded research infrastructure; Facilitated
access to enabling design, prototyping and pilot production
infrastructure and expertise linked to the usage of infrastructure
1.3 Increase R&D ability for conducting top quality research and cooperation on national and
international levels
1.4 Research conducted for the needs of economy
1.5 Enhanced university-industry collaboration through knowledge
transfer and application of research results to the market
1. Increased capacities of the
RDI sector to perform excellent research and to serve the needs
of the economy
2. Overcoming the fragmentation
of the innovation value chain and the gap between research and the
business sector
3. Modernizing and diversifying the
Croatian economy through increasing private investements into RDI
4. Upgrading in global value chains and
promoting internationalization of Croatian enterprises
5. Working in partnerships to
address societal challenges
6. Development of smart skills -
upgrading the qualifications of existing and new work force for
smart specialization
2.1 Strengthening links between the scientific and business sector
2.2 Institutional set-up for Innovation system
3.1 Support to business investments in RDI (Strengthened capacities for RDI of enterprises
(including SMEs); their productivity, competitiveness and export activity
raised, and diversified production and services offer)
3.2 StrengthenedSMEs' capacities to innovate
(implementation of new solutions in the areas of technology, product,
process and organizational innovations, including marketing
innovations, design and innovation advisory, IPR and support services
as well as non-R&D based solutions applied by SMEs)
4.1 Benchmark of industrial sectors according to global perspective, for purpose
of better international positioning, focused policy defining and targeted
investments in future
5.1 Support to social innovation 6.1 Improving tools for smart skills policies
6.2 Development and upgrading of smart skills within the education system (at all levels - vocational training, higher education and adult learning programs)
Improving capacity, performance and skills for excellent and relevant research in the public sector Bridging the gap between the research and business sector Improving the efficiency and skills of the business sector for research, development and innovation
AnAlysis of the CroAtiA smArt speCiAlizAtion strAtegy: logiCAl frAmework, instruments, And indiCAtor results 02 InterventIon logIc42 43

2.3 Instruments
The level of instruments is divided into three tiers, which are not all clearly connected to elements of the intervention logic. These are delivery areas, delivery instruments, and
“ways of implementation.” Thirteen delivery instruments are grouped into four delivery areas, and each delivery instrument is further disaggregated into one or more “ways of implementation.”16 While each delivery instrument is mapped to one of six specific ob-jectives, delivery areas span multiple objectives. Similarly, “ways of implementation” are not directly linked to any indicators, making it difficult to measure their contribution to achievement of the objectives. Relations between types of policy elements are shown in Figure 2.7. The elements from the first column are paired with elements listed in the top cells of the other columns. When the S3 document provides a clear description, overview, or statement regarding how two types of elements are linked, the connection is labeled as direct. When a connection between two types of elements can be identified through their connections with a third one, it is considered indirect. Cases where a straightforward relation cannot be determined at all are marked with “no connection.” The lack of connec-tion between delivery areas and specific objectives raises questions about the purpose of defining delivery areas in the first place. Similarly, the inability to directly link the “ways of implementation” with indicators makes it difficult to quantify their expected contribution.
Indirect connections between elements of the intervention logic add to the complexity of the system and impede monitoring and evaluation of policy achievements. There are two indirect connections in the intervention logic. One is the link between “ways of imple-mentation” and the specific objectives, which can be inferred from the delivery instruments that the “ways of implementation” are part of and the objectives the delivery instruments support. The other is the expected target achievement in a particular delivery area, which can be determined by aggregating the contributions of individual delivery instruments.
The implementation framework differentiates between “main” and “other” S3 instru-ments. “Main” instruments require alignment with S3 STPAs as an eligibility condition in the project selection (grant award) procedure. In other words, in order to qualify for receiving funding through “main” instruments, the project needs to fit into one of the STPAs defined in the S3. (See also section 2.1.) “Other” S3 instruments appear to be connected to the S3 by alignment with its strategic objectives only. This is, however, not clearly explained. Of 42 instruments in total, 19 of them are “main” S3 instruments.
16 Adding yet an additional layer of complexity, the Action Plan 2016–2018 in Annex 4 of the S3, defines “activities” that are neither “delivery instruments” nor “ways of implementation.” They are actions that appear to be more even more specific than the “ways of implementation.” Unfortunately, this action plan is referred to several times in the text but not explained and only shown in the S3 Annex. The Annex also defines two very important variables: timeline/deadline and responsible institutions.
AnAlysis of the CroAtiA smArt speCiAlizAtion strAtegy: logiCAl frAmework, instruments, And indiCAtor results 44

Figure 2.7 Types of connections between S3 policy elements
Source: Staff elaboration.
It is unclear whether the defined instruments appropriately respond to the needs and objectives of TPAs. No thematic platforms were in place when the S3 was enacted, making the policy design blind to sectoral strategies and priorities. This means that there may be a disconnect between S3 delivery instruments, the EDP, and TPA priorities. The Czech S3 overcame this challenge by recognizing that the initial list of instruments was indicative and leaving the opportunity to introduce changes based on the EDP (Box 2.4). Further, the allocation of resources to each instrument in the Croatian S3 is defined at the overall level and lacks a connection with the TPA priorities.
Delivery area
Delivery instrument
Way of implementation
Indicators
Specific objective
Delivery area
Delivery instrument
Way of implemen-
tation
No connection
Direct Direct
Indirect Direct Direct
Direct Indirect Direct No connection
02 intErvEntion logiC 45

Box 2.4 Sectoral logic in the Czech S3
The Czech S3 recognizes that the instruments proposed in the strategy are not final and will be influenced by the results of the EDP. The Czech S3 states that “model projects or activities are…not a final or exhaustive list…many of them need to be verified in partnerships (e.g., in innovation platforms). Given the long-term process of co-operation and partner-ship…from the quadruple helix…it is not possible—with sufficient certainty—to describe and plan each activity and model projects for the entire period of RIS3 implementation.” The strategy explicitly states that proposing a definite structure of instruments would defeat the purpose of the EDP process.
Source: National Research and Innovation Strategy for Smart Specialization of the Czech Republic (2016).
The budget for S3 instruments is unevenly distributed across different specific objec-tives, which may jeopardize the achievement of some of them. According to the S3 Action Plan 2019–2020, the total S3 budget for instruments amounts to around HRK 7.14 billion. Figure 2.8 shows the financial allocation of instruments assigned to a specific objective.17 Policy instruments contributing to Specific Objective 1 have the highest budget (HRK 3.2 billion), followed by instruments contributing to Specific Objective 3 (HRK 2.85 billion). These two specific objectives together comprise close to 85 percent of the budget, while other specific objectives are supported by instruments with much lower budgets. Such a strong bias in allocation towards some objectives may influence the probability of achiev-ing results across objectives. Specific objectives 4, 5 and 6 have negligible budgets and the latter two are not covered by any “main” instrument at all. Considering that only the
“main” S3 instruments are directly connected with TPAs, this casts doubt on whether the TPAs will actually benefit from them and to what extent.
17 Number and names of policy instruments attributed to each specific objective are listed in Figure 2.2.
AnAlysis of the CroAtiA smArt speCiAlizAtion strAtegy: logiCAl frAmework, instruments, And indiCAtor results 46

deliveRy aReas
Delivery areas are not well-justified and complicate the S3 logic. The justification for in-troducing delivery areas was that some instruments might contribute to multiple specific objectives. However, in the S3 monitoring framework and action plan, each instrument is associated with a single specific objective. This one-to-one relationship between instru-ments and specific objectives contradicts the justification for delivery areas. Further, de-livery areas were supposed to group instruments according to their role in the innovation value chain. However, the delivery areas do not actually appear to follow such a structure. For instance, the area of smart skills development should be relevant for the whole inno-vation value chain. In practice, delivery areas introduce a parallel system, comparable to S3 specific objectives, that does not appear to add much analytical value.
There is no clear and direct correspondence between delivery areas and specific ob-jectives. Figure 2.9 shows the mapping of delivery instruments to specific objectives, as presented in the S3. Instruments are shown in boxes under the specific objectives that they are expected to contribute to, and their color refers to the delivery area they are classified in. The figure illustrates the disconnect between delivery areas and specific objectives, which makes analysis, monitoring and evaluation more difficult to execute.
Figure 2.8 Distribution of S3 instruments across specific strategic objectives (in million HRK)
Source: Staff elaboration based on S3 Action Plan 2019-2020
HRK
mill
ion
3,500
3,000
2,500
2,000
1,500
1,000
500
0
S01 S02 S03 S04 S05 S06
Main S3 instrumentsAll S3 instruments
02 intErvEntion logiC 47

Figure 2.9 Delivery areas versus specific objectives
Source: Staff elaboration.
Establishment of a more efficient national innovation system Development of RDI infrastructure and activities
Del
iver
y A
reas
Del
iver
y In
stru
men
tsSp
ecia
l Obj
ecti
ves
Increase capacity of the scientific-research sector for conducting
top quality research and
cooperation on national and international
levels
Strengthening research
excellence by supporting
national Centers of Research Excellence
and enabling synergies with
European Research Council
(ERC) grants
Support to research
organizations conducting
research and development
projects directed towards the needs of the
economy
Upgrading in global value chains and promoting internationalization of the Croatian economy Development of smart skills
Strategic Project ˝Science and
Technology Foresight˝
Strategic Project for Support to
Establishment of the
Innovation Network for Industry and
Thematic Innovation Platforms
Support to the development of Centers of Competence
Strengthening links between the scientific and business
sectors by supporting Technology
Transfer Offices and Science-Technology
Parks
Support to business
investments in RDI
Support to strengthening
SMEs’ capacities to
innovate
Strategic Project for Support to
Competitiveness Clusters
initiatives
Support to social
innovation
Establishing infrastructure for smart skills
policies
Additional instruments put in place
for assessing medium term
skill needs
Implementing the Croatian Qualification Framework mechanism
for delivering timely and
standardized training
programs based on future and medium-term
skill needs
Increased capacities of the
RDI sector to perform excellent
research and to serve the needs of the economy
Overcoming the fragmentation
of the inno-vation value
chain and the gap between research and the business
sector
Modernizing and diversifying
the Croatian economy through
increasing private
investments into RDI
Upgrading in global value chains and promoting
internationali-zation of Croatian
enterprises
Working in partnerships to address
societal challenges
Development of smart skills
- upgrading the qualifications
of existing and new work force for smart specialization
AnAlysis of the CroAtiA smArt speCiAlizAtion strAtegy: logiCAl frAmework, instruments, And indiCAtor results 48

deliveRy iNstRumeNts
The concept of delivery instruments is not clear and consistent. The S3 refers to 14 deliv-ery instruments, which represent a mix of public interventions and shorter-run objectives (Table 2.4). For example, the delivery instrument labeled “Increasing capacity of the sci-entific-research sector for conducting top-quality research and cooperation on national and international level” is not actually an instrument, a program or a specific project, but rather an objective related to research and cooperation.18
In some cases, a delivery instrument may have a different description of what it compris-es, while other instruments have overlapping descriptions. One example of this is the instrument “Additional instruments put in place for assessing medium term skill needs.” The S3 describes two elements within the instrument: (i) the annual employers’ survey on competences and (ii) the development of skill profiles for sectors defined in the Croatian Qualification Framework. Although it is not clearly stated in the description, it could be assumed that a significant share of activities within the instrument would be implement-ed by the Ministry of Labor, Pension System, Family and Social Policy (MLPS) and other public authorities, as direct beneficiaries. However, according to Annex 5 (which lays out the budget for each instrument), the instrument includes a single open call grant scheme program of the MLPS and does not refer to any other activities or programs.19 At the same time, the instrument “Implementing the Croatian Qualification Framework mechanism for delivering timely and standardized training programs based on future and medium-term skill needs” also mentions skills needs assessment and development of standards but does not clearly state which activities are envisaged and what their relation to the previous instrument is. Annex 5 envisages a single direct award procedure under the authority of the MLPS to implement it. Using such a loosely defined concept of delivery instruments, together with inconsistency their description throughout the document, reduces the clarity and coherence of the policy.
18 Moreover, this instrument is not consistently labeled throughout the document, and also shows up under the name “Building new and improving the existing RDI infrastructure”.
19 In Annex 5 of the S3, this instrument appears under the name “Medium term tools for skill assessment at the level of competences.”
02 intErvEntion logiC 49

Table 2.4 Classification of delivery instruments by area and type
deliveRy aRea deliveRy iNstRumeNt type
Establishment of a more efficient national innovation system
Strategic Project for Support to Establishment of the Innovation Network for the Industry and The-matic Innovation Platforms
Instrument (institutional)
Strategic Project ‘Science and Technology Foresight’
Instrument (institutional)
Strengthening links between the scientific and business sectors by supporting Technology Trans-fer Offices and Science-Technology Parks
Objective
Development of RDI infrastructure and activities
Increasing the capacity of the scientific-research sector to conduct top-quality research and coop-eration on national and international level
Objective
Support to the development of Centers of Competence
Instrument
Support to business investments in RDI Objective
Support to strengthening SMEs’ capacities to innovate
Objective
Support to social innovation Objective
Support to research organizations conducting research and development projects directed to-wards the needs of the economy
Objective
Strengthening research excellence by supporting national Centers of Research Excellence and en-abling synergies with European Research Council (ERC) grants
Both objective and instrument
Upgrading in global value chains and promoting internationalization of the Croatian economy
Strategic Project for Support to Competitiveness Clusters Initiatives
Instrument (institutional)
Development of smart skills
Establishing infrastructure for smart skills policies Instrument (institutional, broad)
Additional instruments put in place for assessing medium-term skill needs
Instrument (scope unclear)
Implementing the Croatian Qualification Frame-work mechanism for delivering timely and stan-dardized training programs based on future and medium-term skill needs
Instrument (institutional, scope unclear)
Source: Staff elaboration based on Croatia Smart Specialization Strategy 2016–2020.
AnAlysis of the CroAtiA smArt speCiAlizAtion strAtegy: logiCAl frAmework, instruments, And indiCAtor results 50

Some instruments that are not included in the S3 could contribute to S3 objectives. An-nex IV presents an overview of all S3 and non-S3 RDI support instruments, mapped against instrument-level outcomes and S3 objectives. The mapping shows that some non-S3 instruments contribute toward achieving the objectives stated in the S3. For example, with the exception of a single program, only non-S3 instruments address the outcome
“Enhanced collaboration in the scientific community (with foreign partners)” to achieve Specific Objective 1. A notable number of non-S3 instruments, such as the ones focusing on internationalization, certification, and product labeling, could potentially contribute to Specific Objective 4, but they are not acknowledged as such in the S3.
Instruments devoted to strengthening institutional capabilities would benefit from clearer delineation from instruments that support the private sector or academia. In Table 2.2, such instruments are labeled “institutional” and refer mainly to so-called Stra-tegic Projects, for which the beneficiaries are institutions involved in the S3 governance structure. In their current form, institutional instruments are not differentiated from the more conventional “transfer mechanisms” and target the same specific objectives and delivery areas. Three institutional instruments were meant to facilitate the EDP process: (i) the Strategic Project “Science and Technology Foresight” (Foresight project), (ii) the Strategic Project for Support to Establishment of the Innovation Network for the Indus-try and Thematic Innovation Platforms (INI), and (iii) the Strategic Project for Support to Competitiveness Clusters Initiatives (CCI). While these are very relevant and probably very needed initiatives, they should be in a different category from direct transfers, incen-tives, and capacity building directed to beneficiaries in the private sector, academia, or civil society. This is because their contribution to the achievement of specific objectives is less clear and more indirect compared to targeted support to the private and research sectors. For example, they could be part of a separate specific objective dedicated to building institutional capacities. This would also more appropriately reflect the specific pathway of change that these instruments follow.
In practice, institutional instruments did not produce all the planned deliverables, or the deliverables produced were utilized to a limited extent only. The INI project faced serious delays and produced a limited share of the expected outputs. The key activities of the project, that is, support to development of the TPA RDI strategies and project pipelines, have not yet been initiated. The Foresight project has not delivered the expected results either. Both projects are expected to end in 2021. The CCI project did deliver STPA-level analyses that could have been used in S3 policy and EDP continuation (Box 2.5). Such use in practice, however, appears to be limited to two grant programs (IRI and Integrator), as described in section 2.1.
02 intErvEntion logiC 51

Box 2.5 Outputs of the CCI project
The CCI project implemented by the MEEC aims to apply the cluster initiative approach to S3 STPAs. The CCI project comprises two elements. The first element involves creation of a strategic framework for cluster initiatives and supporting capacity-building and smart skills development. The objective of creating such framework is to identify opportunities to improve the position of the Croatian economy in GVCs and to identify gaps in value chains and new export markets and niches for Croatian enterprises for the S3 STPAs. The second element follows up with activities, such as pilot projects, for implementation of action plans and measures developed through the first element.
The CCI project produced STPA-based analyses and outputs that could be used for EDP continuation. The first element of the project was implemented through technical assistance by the World Bank. For each STPA of the S3, the project delivered the following written reports:
○ Report on “Assessment of GVC Positioning of the STPA” elaborates the definition and scope of each STPA. The reports include data on underlying industries and their performance, size and evolution of the domestic production and exports attributed to the STPA, growth and opportunities, profitability, innovativeness, RDI topics listed in the S3, and cluster agents connected with the STPA, including key firms, regulatory and monitoring bodies, and so on.
○ Report on “Strategic Segmentation” includes industry analysis, strategy diagnostic and potential roadmap with suggested short- and long-term strategic plan.
○ Report on investment plan, action plan to improve the position of Croatian firms in GVCs, FDI Strategy, Export Strategy, Territorial and Product Branding. The report covers the following elements:
○ “Investment Plan Proposal,” containing partnerships for joint investments to improve the position in GVCs for each STPA
○ “Action Plan to strengthen the position of Croatia in selected GVCs,” containing short-term measures that could be implemented within two years as well as mea-sures for mid-term and long-term periods
○ “FDI Strategy,” covering (i) identification of niches and markets to attract FDI; (ii) an Action Plan to attract investment in high technology sectors and emerging in-dustries; and (iii) an Action Plan for FDI promotional activities with marketing plan and branding strategy
○ “Export Strategy,” covering (i) a list of products, services and markets for prioritiza-tion; and (ii) an Action Plan for the promotion of exports
○ “Territorial and Product Branding Strategy,” covering (i) a list of Croatian brands and territorial and product brands in GVCs; and (ii) an Action Plan for territorial and product branding.
Source: Staff elaboration.
AnAlysis of the CroAtiA smArt speCiAlizAtion strAtegy: logiCAl frAmework, instruments, And indiCAtor results 52

ways of implemeNtatioN
“Ways of implementation” are more specific interventions below the level of delivery instruments, but they are not defined consistently. Each delivery instrument consists of one or more “ways of implementation.” For example, the delivery instrument “Support to research organizations conducting R&D projects directed towards the needs of economy” consists of two “ways of implementation”: (i) the grant scheme “Strengthening capacities for research, development and innovation - R&D collaboration projects” and (ii) the grant scheme “Science and Innovation Investment Fund.” In practice, “ways of implementation” can be considered instruments of the S3. Each of them is associated with a responsible institution, budget and funding sources, and a corresponding implementation timeframe. However, they are only found in Annex 5 of the official S3 document. Also, Annex 5 presents additional “ways of implementation” that are not linked to any particular delivery instru-ment, which are envisaged to contribute to S3 objectives to a certain extent only. These are, for example, the grant scheme for basic research funded from the national budget implemented by the Croatian Science Foundation, or grant schemes implemented by the Ministry of Agriculture to support innovation in rural development, maritime, and fisheries.
“Ways of implementation” are not well-connected to other elements of the intervention logic. They are linked to delivery instruments and delivery areas, but the connection to S3 objectives and indicators is not directly shown or elaborated anywhere in the S3. To some extent, it is possible to make indirect connections between “ways of implementation” and strategic objectives and indicators by observing indicators associated with delivery instruments (according to S3 Chapter 8) and matching the indicators to the “ways of im-plementation” included in a delivery instrument. This is possible when a delivery instru-ment consists of a single “way of implementation” or a small number of very distinct ones. However, for delivery instruments consisting of several “ways of implementation,” the connections are less clear. In any case, where a delivery instrument includes more than one “way of implementation,” it is not possible to derive the expected contribution of the
“ways of implementation” to the indicator defined at the level of the delivery instrument.
appRoach to iNstRumeNts duRiNg implemeNtatioN
During implementation, the policy mix was expanded with additional instruments, without providing a clear rationale for their inclusion. This change is evident from the revised overview of all S3 instruments in the S3 Action Plan 2019–2020. In some cases, it is reasonable to assume that the exact structure of the delivery mechanisms was not entirely known at the time of S3 adoption. Some programs were designed later on and thus added to the Action Plan. Some of the other instruments that are now included in the policy mix were originally classified in Annex 5 of S3 as “additional funding sources.” Such instruments were not exclusively targeting the S3 TPAs but were expected to contribute to S3 objectives to a limited degree. (See Appendix II.) However, some of the newly added instruments were already in place at the time of S3 adoption and were only introduced as part of the Action Plan. For instance, the Action Plan includes the international programs EUREKA and EUROSTARS, which were already in place in the time of S3 adoption but were not initially referenced in the S3 as delivery instruments.
02 intErvEntion logiC 53

The approach during implementation has been to streamline instruments and clarify their connections to specific objectives. In the S3 Action Plan 2019–2020 the delivery instruments and “ways of implementation” were subsumed and transformed into a single, more coherent, category of “policy instruments.” These revised instruments are listed with references to actual programs and projects and their funding sources, indicative al-locations, responsible institutions, and deadlines for launching calls for proposals.20 This enabled a more straightforward link between instruments and indicators. The revised S3 policy mix now includes a revamped list of 42 instruments that are directly linked to strategic sub-objectives, objectives and indicators.21
Some inconsistency remaining in the definition of instruments is especially evident in programs with multiple editions. For instance, the IRI program has had two editions so far, and each edition is considered to be a separate instrument. At the same time, other multi-edition programs, such as the Research Projects and Installation Research Projects programs of the Croatian Science Foundation, are listed as one instrument each. The latter two programs are also multi-annual programs that each have a single deadline stated in the Action Plan for launching the call for proposals. It is thus unclear whether only a single edition of these programs is considered to be an S3 policy instrument, and why. This is not the case for several other multi-annual programs, for instance EUROSTARS and EUREKA, for which the whole period of 2016–2020 is indicated as the timeframe.
2.4 Indicators
logical coNNectioNs
The vast majority of S3 indicators are defined horizontally, with very few TPA-specific indi-cators. The S3 defines four categories of indicators: output, outcome, context, and TPA-level context indicators. Box 2.6 defines each category. The S3 initially defined 36 output indicators, 20 outcome indicators, 15 context indicators, and 11 TPA-level context indicators.22 Each de-livery instrument is associated with at least one output and one outcome indicator, but not necessarily with a context indicator. Output and outcome indicators are defined horizontally, that is, at the overall S3 level without differentiation across TPAs. TPA-level context indicators are the only TPA-specific indicators and represent high-level outcomes relevant for each TPA. Because they are not related to any particular intervention, it is not clear why these indica-tors were selected or how they might be achieved. For example, two context indicators are used for TPA Health and Quality of Life: life expectancy at birth and the country ranking in the Euro Health Consumer Index. However, it is unclear why these specific indicators were chosen and to what extent the S3 interventions can lead to these high-level macro impacts.
20 A detailed overview of the original delivery instruments, “ways of implementation,” revised policy instruments, and the assumed linkages between them is available in Appendix II.
21 Furthermore, the 15 “additional funding sources” from the S3 document were transformed into 7 “additional instruments.” For simplicity, these are not shown in Figure 2.2.
22 A detailed list of original and revised S3 indicators and their current status is available in Appendix III.
AnAlysis of the CroAtiA smArt speCiAlizAtion strAtegy: logiCAl frAmework, instruments, And indiCAtor results 54

Box 2.6 Indicator definitions according to S3
output iNdicatoRs Output indicators represent the “physical” product of spending resources through policy interventions.Example: Number of enterprises supported to introduce new-to-the-market products.
Result/outcome iNdicatoRsResult/outcome indicators cover specific dimensions of well-being and progress that are intended to be influenced (positively or negatively) by the policy actions.Example: Sales of new-to-the-market and new-to-the-firm innovations (as percentage of turnover).
coNteXt iNdicatoRsContext indicators provide simple and reliable information describing a variable relative to the context. It gives information about a situation and its evolution in a country/region, or an area relevant to the assistance policy.Example: Increased sales of new-to-the-market and new-to-the-firm innovations.
tpa-level coNteXt iNdicatoRsExample: Increase of life expectancy at birth (years). (TPA1 Health and Quality of Life)
Source: Croatia Smart Specialization Strategy 2016–2020.
No intermediate targets or milestones are set in the S3 document. Process and short-er-run indicators could be associated with the activities of the instruments underlying the policy or to early work that stems from S3. In that case, output indicators would reflect aggregate results of instruments. Having this data would allow assessing problems early on and taking corrective actions if needed. These early indicators are not present in the S3 monitoring framework.
Tracking indicator achievement on the TPA level is declared in the S3 but is implemented only partially in practice. According to the S3, output indicators (except for institutional instruments) should be tracked at the TPA level as disaggregate measures. The same principle was upheld in the revised S3 monitoring framework. However, a review of the S3 implementation reports revealed that data is collected at TPA level only for a subset of indicators and implemented programs. The number of programs that track progress at the STPA level is even lower. Tracking progress on TPA level manifests some specific challenges at the operational level (see Appendix III for details). Further, there is no evi-dence of aggregation or connection of TPA indicators with country-level ones. Outcome and context indicators were not envisaged to be measured at the TPA level. Indicators are a way to establish connections between sectoral objectives and policy objectives and to understand the relevance and contribution of each TPA to the S3 mission and objectives.
02 intErvEntion logiC 55

The logical connection between indicators, instruments, and specific objectives is not always clear. Some outcome indicators are not clearly linked to a corresponding instrument. For example, the indicator tracking the share of exports of medium and high technology is associated with an instrument (Support to competitiveness cluster initiatives) whose contribution to the indicator is indirect at best. Further, because indicators are defined at the level of delivery instruments, and each delivery instrument is attributed to a single specific objective, it is possible to make an indirect connection between indicators and specific objectives. In practice, this means that each specific objective is associated with more than one indicator, and some indicators are associated with multiple objectives.23 For example, several context indicators overlap between different specific objectives be-cause they are linked to more than one delivery instrument (Table 2.5). Examples include increase in GDP per capita (SO2, SO3, SO4), increase in R&D expenditures as share of the GDP (SO1, SO2, SO3), and Summary Innovation Index (SO1, SO2, SO3). Since these are high-level indicators that cannot be clearly attributed to a single specific objective or its activities, they are probably more appropriate to measure higher-level objectives.
No indicators are assigned to the vision and overall objective, or at levels below deliv-ery instruments. Both vision and overall objective statements are generic and defined by using very broad concepts. Assigning indicators to them would lessen the ambiguity and enable measuring the performance of the S3 at the highest level. Similarly, no indicators are assigned to “ways of implementation,” which represent S3 delivery mechanisms at the level of actual programs and projects. Considering the ambiguous definition of delivery instruments, it would make more sense to have indicators associated with “ways of imple-mentation,” given that they represent the actual programs and projects more concretely.24
The logical connections between output, outcome, and context indicators are incomplete and are not clearly explained. The S3 presents a hierarchy between output, outcome, and context indicators, which are grouped according to instrument and specific objective, but the connection between them is not always clear. Each instrument is associated with at least one output and outcome indicator, but there is no elaboration of the assumptions regarding how each output contributes to the achievement of outcomes. For example, the output indicator “Number of social innovation projects” under Specific Objective 5 is linked to an outcome indicator related to patenting in the area of societal challenges, even though social innovation projects are rarely patentable. Further, context indicators are only associated with some instruments, and TPA-level context indicators are not linked to any particular instrument.
Context indicators are inconsistent. The definition of context indicators itself (Box 2.5) is vague and unclear. Some are very high level (for example, increased GDP per capita). These could be related to overall objectives but would be difficult to attribute to specific objectives or the S3 policy more broadly. Others seem to be smaller-scale outcome indica-tors directly associated with instruments. In some cases, they could even be considered output indicators (for example, increased number of new companies in economic areas
23 This indicates a certain degree of overlap between specific objectives, as pointed out in section 2.2.24 For more information on delivery instruments, “ways of implementation,” and the relation between
them, see section 2.3.
AnAlysis of the CroAtiA smArt speCiAlizAtion strAtegy: logiCAl frAmework, instruments, And indiCAtor results 56

included in a smart specialization). The exact level for some of them is not entirely clear, given that definitions, scope, and measurement details are not specified.
Table 2.5 Original S3 context indicators, organized by Strategic Objective
specific objective coNteXt iNdicatoRs
SO1: Increased capacities of RDI sector to perform excellent research and to serve the needs of the economy
Increased R&D expenditure as % of GDP (GERD)
Increased Summary Innovation Index
Increased HRST as % of labor force
SO2: Overcoming the fragmentation of innovation value chain and the gap between research and business sector
Increased number of new companies in economic areas included in a smart specialization
Increased employment in knowledge-intensive activities
Increased Medium/high-tech products contribution to trade balance
Increased sales of new to market and new to firm innovations
Increased number of new/innovative companies in S3 priority areas
Increased Gross Domestic Product (GDP) / capita (EUR PPS)
Increased R&D expenditure as % of GDP (GERD)
Increased Summary Innovation Index
Increased share of innovative companies in industry and services
Increased number of new companies in economic areas included in a smart specialization
SO3: Modernizing and diversifying Croatian economy through increasing private investments into RDI
Increased Gross Domestic Product (GDP) / capita (EUR PPS)
Increased R&D expenditure as % of GDP (GERD)
Increased Summary Innovation Index
Increased share of innovative companies in industry and services
Increased number of new companies in economic areas included in a smart specialization
Increased employment rates in knowledge-intensive sectors
02 intErvEntion logiC 57

specific objective coNteXt iNdicatoRs
SO4: Upgrading in global value chain and promoting internationalization of Croatian enterprises
Increased Gross Domestic Product (GDP) / capita (EUR PPS)
Increased value of FDI/capita (Euro)
Increased share of FDI in GDP
Increased share of foreign investment in R&D expenditure
Increased medium and high-tech products exports as % of total product exports
Export growth
SO5: Working in partnerships to address societal challenges
Improvement of the community welfare through solving specific societal challenges
SO06: Development of smart skills - upgrading the qualifications of existing and new work force for smart specialization
Increased employment in knowledge-intensive activities
Source: Croatia Smart Specialization Strategy 2016–2020.
The revised monitoring framework adopted during implementation changed the struc-ture and definition of indicators. The revised monitoring framework references an in-creased set of 52 output indicators and 33 outcome indicators (85 in total) assigned to policy instruments in the revised policy mix. Nine output indicators from the original list were omitted from the revised framework, 18 were unchanged, 10 were revised, and 20 new indicators were added. Similarly, 11 outcome indicators were removed, only 4 were unchanged, 6 were revised, and 20 were added. Each indicator was associated with a definition, which is an improvement compared to the original list of indicators. Context indicators were linked to the newly-introduced concept of dimensions25 and revised to refer to exclusively macro- or country-level data (Table 2.6). In most cases they reference different global and EU reports on competitiveness and innovation. Conceptually, this is an improvement compared to the original context indicators, and it is more straightfor-ward in terms of measurement and data collection.
A new concept—core indicators—was introduced during implementation and associated with the new main objectives. These are not new indicators but a set of existing output and outcome indicators (16 in total) extracted from the revised monitoring framework (Table 2.7). If the selected core indicators measured at the level of a main objective are achieved through multiple instruments, the target values should be adjusted to reflect this. However, no targets have been set in the S3 Action Plan 2019–2020.
25 See section 2.2 for more details.
AnAlysis of the CroAtiA smArt speCiAlizAtion strAtegy: logiCAl frAmework, instruments, And indiCAtor results 58

Table 2.6 Revised S3 context indicators, organized by S3 dimensions
maiN objective s3 dimeNsioN coNteXt iNdicatoRs
Improving capacity, performance, and skills for excellent and relevant research in the public sector
Improving capacity in the public research sector
Application success rate in H2020
Share of scientific publications among the top 10% most cited publications worldwide as % of total scientific publications of the country
Share of researchers in FTE in the public sector as % of active population
Bridging the gap between the research and business sector
Bridging the gap between the research and business sector
Innovative SMEs collaborating with others (% of SMEs) (sub-indicator of Summary Innova-tion Index)
Improving the efficiency and skills of the business sector for research, development, and innovation
Increasing research, development, and innovation in the business sector
Business Expenditures (BERD) as % of GDP
Share of FTE researchers in business enterprise sector as % of active population
Starting a business (from World Bank “Doing Business” report)
Firm investments (sub-indicator of Summary Innovation Index)
Innovators (sub-indicator of Summary Innova-tion Index)
N/A Performance of the national innovation system
Summary Innovation Index
European Innovation Scoreboard (EIS)
Global Innovation Index (GII)
Global Competitiveness Index (GCI)
Gross expenditures on R&D (GERD) as a % of GDP (R&D intensity)
Human resources in science and technology (HRST) as a share of the active population in the age group 25–64
Source: S3 Implementation Report 2016–2019 (draft version).
02 intErvEntion logiC 59

Table 2.7 Core indicators of the S3
s3 coRe iNdicatoRs
maiN objective output outcome
Improving capacity, performance, and skills for excellent and relevant research in the public sector
Number of RDI infrastructural projects
Number of fellowships for train-ing and career development of re-searchers on doctoral and post-doctoral level
Number of scientific publications published in journals indexed in the Web of Science core collection
Total contracted amount for RDI funding from Centralized EU funds (attracted by beneficiaries)
Number of collaborative contracted projects (by beneficiaries) with foreign HEI and PRO institutions
Number of young researchers who gained PhD degrees
Bridging the gap between the research and business sector
Number of enterprises cooper-ating with research institutions/organizations
Number of collaborative projects supported
Rate of public infrastructure usage by companies
Number of collaborative contracted projects between companies and PROs/HEIs after the end of supported projects
Total contracted amount for R&D funding from private sector (attracted by PROs/HEIs beneficiaries)
Improving the efficiency and skills of the business sector for research, development, and innovation
Number of enterprises support-ed to introduce new to the firm products
Private investment matching pub-lic support in innovation or R&D projects
Sales of new to the firm innovation (as per-centage of turnover)
Number of job positions in R&D created in enterprises by RDI projects after the end of funded project
Number of new innovative products/services/processes/technologies
Source: S3 Action Plan 2019–2020. Note: HEI = higher education institution; PRO = public research organization.
iNdicatoR defiNitioN, taRgets, aNd measuRemeNt
Target values for output, outcome, and TPA-level context indicators are not explained in the original S3 framework, while context indicators are not associated with any baseline or target values. Outcome indicators have baseline values from a particular year
AnAlysis of the CroAtiA smArt speCiAlizAtion strAtegy: logiCAl frAmework, instruments, And indiCAtor results 60

prior to S3 adoption, while the baseline values for output indicators are set to zero, since they measure activities that are introduced by the instrument. Both indicator types have target values, in most cases referring to 2023 as the deadline for achievement. However, no targets are set at the TPA level for output indicators, making it impossible to assess the success of implementation from the TPA perspective. No baseline or target values were provided for context indicators. Where targets do exist, there are no details or jus-tification as to how the target values were set or what the underlying assumptions were. For example, for delivery instrument “Support to SMEs capacities to innovate” in Specific Objective 3, the output indicator target is to support 36 firms to introduce new-to-the-market products and 83 firms to support new-to the-firm products. The outcome indicator for this instrument is to increase the share of innovative SMEs at the national level from 33.1 to 35 percent, which appears to be difficult to achieve considering the scale of the support. Clarifying the assumptions behind the value of targets would allow policymakers to assess whether those assumptions hold over time and whether adjustments to the targets set are needed. This process would be facilitated by setting periodic or interme-diate targets, which could signal potential bottlenecks and allow policymakers to revisit their target-setting assumptions.
An additional issue is that indicators are set at the level of delivery instruments and not at the level of the underlying “ways of implementation” based on which the budget is defined. Therefore, it is not possible to fully analyze the relation of budget and target values because targets are not available on the level of programs and projects. Having this information would be necessary to assess how the resources allocated to each program were utilized to achieve the targets.
Originally, indicators did not have definitions, measurement details, or information on how to verify their progress, but these were introduced during implementation. The indicators in the original S3 are listed without definitions or specifications for their mea-surement. Hence, in some cases, it is unclear what exactly should be measured or how. For example, under Specific Objective 4, the indicator related to cluster initiatives does not define what is considered to be a cluster initiative or what is meant by initiatives be-ing implemented. The revised monitoring framework sets data collection points and, in some cases, specifies methods for collecting data and sources that may be used for ver-ifying indicator values. Data on indicator progress is envisaged to be collected at project completion (for output indicators) and one, three and five years after project completion (for outcome indicators).
The revised monitoring framework also improved the link between indicators and in-struments but omitted references to target values, which is a setback compared to the original document. The revised concept of instruments is much clearer, and the indica-tors are now directly linked with programs and projects—and their budgets—which was not the case in the original version.26 However, the revised monitoring framework does not refer to any target values for the new indicators. This is a step backwards compared to the original framework, which had target values for at least some of the indicators (outputs and outcomes).
26 For more details on instruments, see section 2.3.
02 intErvEntion logiC 61

Recommendations
03 63

03 RecommendationsThe recommendations presented in this section result from the analysis of the logical framework of the S3 policy. The analysis aims to assess the clarity of the policy objectives, instruments, inputs, and monitoring framework and the logical connections between them. The S3 is by its nature a complex vertical policy that aims to channel RDI investments towards national sectoral priorities, with a high level of involvement of stakeholders. The resources available for the implementation of the S3 are direct inputs that are used to deploy different activities that are expected to produce certain effects or results. The analysis of the interven-tion logic examines whether the S3 has been set up coherently, so that all the elements in the logical chain between inputs and effects are clearly defined and well-connected. Ultimately, the purpose of this exercise is to provide inputs for the preparation of the next S3 (Box 3.1).
Box 3.1 Building momentum for the preparation of the next S3
Croatia is in a much better position to prepare the next S3 than it was several years ago. The institutions involved in S3 policy and implementation have built up valuable first-hand experience in the design and implementation of the first S3. As described in sections 2.3 and 2.4, they have already used this experience to attempt to streamline the intervention logic and to completely revamp the M&E framework. In the past two years, institutions have also invested in developing a wealth of knowledge and independent analytical work, which can provide a conceptual and practical basis for developing the future S3. These are not limited to the assessments of the S3 intervention logic and governance, but also include other analysis related to RDI policy more broadly, including a needs assessment, an analysis of the RDI policy mix, a functional review of RDI support programs, theories of change and results frameworks developed for RDI support programs, and an analysis of outputs and outcomes of selected programs. These can be used both to set the stra-tegic direction as well as to raise the implementation standard of the S3 going forward.
Government stakeholders have already demonstrated commitment to incorporating the findings and recommendations originating from the recent analytical work. Recently produced analysis has been used to formulate a set of reforms and investments as part of the National Recovery and Resilience Plan. Stakeholders have also expressed willingness to take this practice forward to the next ESIF programming period (2021–2027). Among others, this includes developing a robust M&E framework that will be built based on the theories of change developed for the current financing schemes, as well as on the findings of this S3 intervention logic report.
Source: Staff elaboration.
AnAlysis of the CroAtiA smArt speCiAlizAtion strAtegy: logiCAl frAmework, instruments, And indiCAtor results 64

The recommendations are structured into three priority areas. Table 3.1 provides a sum-mary of priority areas and recommendations. The first priority area is related to the devel-opment of the overall intervention logic and objectives, strengthening the links between the overall intervention logic and the sectoral logic, improving the clarity of objectives, and strengthening the links of the S3 with other strategies. The second priority area is related to the policy mix and definition of instruments. The third priority area focuses on improving the monitoring and evaluation system, including from a sectoral perspective.
Table 3.1 Summary of recommendations
pRioRity aRea 1 iNteRveNtioN logic aNd objectives
a Develop an explicit intervention logic for the S3
b Strengthen the link between overall intervention logic and TPA-level logic
c Improve clarity of vision and objectives
d Enhance the integration of S3 with other national strategies
pRioRity aRea 2 policy miX aNd iNstRumeNts
a Clearly define instruments
b Separate institutional instruments from transfer mechanisms
c Clearly justify and document changes to the policy mix
d Strengthen the connection between instruments and TPA needs
pRioRity aRea 3 moNitoRiNg aNd evaluatioN
a Build a coherent and consistent M&E system
b Measure and track indicators at the TPA level
3.1 Intervention logic and objectives
The overall intervention logic of the S3 should be streamlined, clarified, and better con-nected to the sectoral logic and other relevant national strategies. Streamlining could be accomplished by developing an explicit intervention logic, both for the horizontal and the sectoral perspective. The vision and objectives should be formulated more clearly, with an explanation of the assumptions underlying each step of the intervention logic. Integration and complementarities with other national strategies should be further de-veloped to take advantage of synergies and minimize redundancies.
03 rECommEndationS 65

RecommeNdatioN 1a | develop aN eXplicit iNteRveNtioN logic foR the s3
why The intervention logic of S3 is complex and implicit, as shown in section 2. This makes it difficult to identify all its elements, the connections between them, and the assumptions underlying those connections. Developing an explicit ToC for the policy would allow poli-cymakers to identify any redundancies or gaps in the intervention logic.
how An explicit ToC should be developed for the whole S3 policy. Figure 1.2 presents one possi-ble starting point. In addition, the connections between the levels of the intervention logic should be well-elaborated and justified.
RecommeNdatioN 1b | stReNgtheN the liNK betweeN oveRall iNteRveNtioN logic aNd tpa-level logic
why S3 policy objectives, instrument choice, and resource allocation should be informed by the challenges and priorities identified for each priority sector. However, the sectoral dimen-sion of the Croatian S3 is largely disconnected from overall policy objectives, instruments, and indicators (section 2.1).
how The link between the overall intervention logic of the S3 and intervention logic at the TPA level should be strengthened by developing an explicit ToC for each TPA and drawing a clear connection with the elements of the overall S3 logic. The approach for developing TPA-level ToCs is presented in Figure 3.1. To start off, each TPA should be associated with a clear definition of what it encompasses (including by using Standard international trade classification or SITC sectors, export codes, and similar). The first stage in developing the TPA-level intervention logic consists of sector diagnostics that should specify the sector’s contribution to the S3 vision and identify key sectoral constraints, opportunities, and strengths. The second stage—strategic planning—should establish a sectoral vision and mission, develop a sectoral ToC (see example in Figure 3.2), develop a sectoral strategy, and develop a results framework. In the third stage, operationalization, the sectoral strategy should undergo consultations with stakeholders, establish a governance mechanism, and conduct continuous monitoring.
In parallel, the EDP process should be strengthened so that TPAs facilitate the creation of synergies among the involved stakeholders. The implementation of strategic projects should provide timely and relevant outputs to facilitate the EDP process, and the delivera-bles produced should be utilized in practice.
A strategic policy-wide assessment of sectoral strategies, once they are fully in place, will help strengthen the link with TPA-level logic. This should be done by engaging in the already planned development of RDI strategies and project pipelines on the STPA level.
AnAlysis of the CroAtiA smArt speCiAlizAtion strAtegy: logiCAl frAmework, instruments, And indiCAtor results 66

Figure 3.1 Proposed approach to developing TPA-level intervention logic
Source: Staff elaboration.
Sect
or D
iagn
osti
cs1. Determine sector’s strategic value or role in achieving S3 vision or other priorities (e.g., by producing new workforce, driving economic growth, improving governance, etc.).
2. Assess key sector-specific constraints preventing the sector from maximizing its strategic value (e.g., poor research infrastructure, weak governance, limited financing availability, rank the constraints based on set criteria that enable prioritization of actions and allocation of resources.
3. Landscape sector-specific opportunities for growth that the sector can tap (e.g., growing demand for certain innovative products in domestic or foreign markets, comparative advantage, improved trade terms, availability of regional or national resources for certain priority activities, collaboration opportunities.
4. Identify key sectoral strengths of the sector to leverage its existing competencies and “competitive-edge factors” toward delivering its strategic value.
Stra
tegi
c Pl
anni
ng
1. Establish sectoral vision and mission to align sectoral priorities to achieve its strategic value towards S3; reach a common agreement (with academia, public, private, and civil sectors) on where the sector wants to be in 10–15 or 20 years (e.g., growth, share in GDP, export market size, job creation, improving competitiveness ranking, etc.).
2. Develop sectoral theory of change (ToC) that hypothesizes
“change pathways” necessary to achieve the vision/mission; the process can begin by identifying
(a) key outcomes that must be achieved to get to the vision/mission (e.g., for export growth, the objectives could be “increased internationalization of innovative products”); (b) outputs that any intervention must produce to achieve set outcomes (e.g., increased participation of firms in international fairs, internationalization strategy developed, engagement with foreign firms to discuss potential business partnerships); and (c) activities that can most effectively and efficiently result in such outputs (e.g.,
financial support for firms to participate in international fairs, advisory support to conduct market research, etc.).
3. Construct a sectoral strategy by further defining and refining the change pathways that are most actionable and effective in achieving the vision and producing the strategic value for S3, the outcome-level elements can be re-defined as
"sectoral objectives," different pathways that help to achieve those objectives can be considered "sectoral pillars," and activities can be seen as potential
intervention areas or “programs”.
4. Develop a results framework (RF) that assigns indicators for key elements of the sectoral strategy to enable monitoring and evaluation of the changes envisioned by the ToC; set targets and milestones based on the expected timeframe for realizing the change and allocation of resources; recommend (and establish, where possible) mechanisms for programs to report on the indicators on a periodic basis.
Ope
rati
onal
izat
ion
1. Review and revise the preliminary draft of the sectoral strategy with broad set of stakeholders who are critical for operationalizing the strategy; build ownership from the start by incorporating relevant feedback from different actors; enhance the quality of the content and strategy logic by engaging technical
experts from academia and sector specialists.
2. Undertake official processes to finalize the strategy.
3. Designate an official governance mechanism for oversight, decision-making, lobbying, and guiding the operationalization of the sectoral strategy.
4. Develop operational tools and materials for program managers to operationalize the strategy.
5. Continuously monitor and course-correct the sectoral strategy, by setting a periodic timeframe to review the progress on the results framework (including review of the trends, milestones achievement, and
variance from the target), assess the assumptions and risks anticipated in the ToC, and identify course corrections or new programming that improve the trajectory towards the vision.
03 rECommEndationS 67

Figure 3.2 A proposed ToC for a TPA/STPA juxtaposed with S3 ToC
Source: Staff elaboration.
outc
ome
impa
ctou
tput
sac
tivities
inpu
ts
S3 THEORY OF CHANGE SECTOR’S THEORY OF CHANGE
S3 Vision
Croatia will be recognized as a knowledge-based economy embracing creativity and innovation at all levels of society for improved
quality of live of all its citizens
Focusing knowledge and innovation capacities into areas of greatest potential for Croatia to drive competitiveness and socio-economic development and transform Croatian
economy through effective RDI activities
Overall Strategic Objective
Strategic Objectives
1. Increased capacities of the RDI sector to perform excellent research and to serve
the needs of the economy
2. Overcoming the fragmentation of the innovation
value chain and the gap between research and the business sector
3. Modernizing and diversifying the
Croatian economy through increasing private investements into RDI
4. Upgrading in global value chains and
promoting internationalization of Croatian enterprises
5. Working in partnerships to
address societal challenges
6. Development of smart skills - upgrading the qualifications of existing and new work force
for smart specializationStrategic
Sub- Objectives
Policy instruments “Transfer” policy instruments “Institutional” policy instruments
Governance(S3 governance, TPA/STPA governance and priorities
management)
Institutional Support (Infrastructure regulation; firm,
university, and government capabilities)
Financial Inputs (EU funds, governmentresources, and private
investments)
outc
ome
impa
ctou
tput
sac
tivities
inpu
ts
Sector Vision
Strategic Objectives
Strategic Sub-
Objectives
Policy instruments
Alignment of Sector’s vision to S3 Vision
Long-term vision to address sector-specific market failures
Alignment of Sector’s Strategic Objectives in key change areas to S3
Strategic Objectives
Strategic objectives that define key areas of change needed to achieve the
long-term vision (e.g., R&D, infrastructure, enterprise-research organization collaboration, human
capital, regulation/standards)
Contribution of Program /Policy-level Strategic
Sub-Objectives towards S3 Strategic Objectives
Focused objectives that contribute to the Strategic Objectives of the
sector through various anticipated change pathways that can be achieved
through various project activities or policy instruments.
Implementation of programs/Policy instruments in
sector-specific priorities; Coordination, collaboration,
and synergy with existing and new instruments
Activities, operations, and projects that are implemented by the sector
to achieve the Strategic Sub-Objectives
Sector Alignment
with S3 Strategy
Improving capacity, performance and skills for
excellent and relevant research in the public sector
Improving the efficiency and skills of the business sector
for research, development and innovation
Bridging the gap between the research and business sector
Main Objectives
Ass
umpt
ions
Ass
umpt
ions
analysis of the croatia smart specialization strategy: logical framework, instruments, and indicator results 03 recommendations68 69

RecommeNdatioN 1c| impRove claRity of visioN aNd objectives
why As elaborated in section 2.2, the vision and objectives lack clarity and are not directly as-sociated with indicators, which prevents measurement of their achievement. Further, the connection between overall objectives and TPA-level objectives is not explicitly elaborated.
how The vision and objectives statements should be accompanied by definitions of key terms and associated with indicators to verify whether the objectives have been met. The objec-tives should have clear connections with lower levels of the intervention logic as well as with the sectoral logic.
RecommeNdatioN 1d | eNhaNce the iNtegRatioN of s3 with otheR NatioNal stRategies
why The S3 vision and objectives show little differentiation from other innovation policies or strategies, as noted in section 2.2. While this may reflect consistency between different strategies, the S3 should have a more prominent sectoral lens. A more explicit effort to connect the S3 with other policies and policy bodies will allow for better coordination, less overlap, and greater interest of some key stakeholders.
how TPAs and STPAs should explicitly describe how each overall or sectoral strategy incorporates or builds upon existing strategies. More specifically, the S3 should explain its connection and complementarity with SFI and Cluster Policy. This effort would also help narrow the overall S3 objectives to be more clearly differentiated from other connected policies, focusing more on an industrial or vertical perspective. At the same time, elaborating the linkages between the S3 and other strategies that are relevant for particular TPAs and STPAs (for example, the Croatian Energy Development Strategy for TPA Energy and Sustainable Environment) would contribute to the coherence of the national strategic framework.
AnAlysis of the CroAtiA smArt speCiAlizAtion strAtegy: logiCAl frAmework, instruments, And indiCAtor results 70

3.2 Policy mix and instruments
The policy mix and individual instruments should be defined clearly and consistently, with robust connections to the overall intervention logic. The policy mix and individ-ual instruments are central mechanisms for enacting the desired change. The concept of instruments should be clearly and consistently applied, separating instruments for institutional support from other types of instruments. The prioritization of instruments should be more informed by sectoral needs, and changes to the policy mix should be accompanied by a clear rationale.
RecommeNdatioN 2a| cleaRly defiNe iNstRumeNts
why Choosing a single way to categorize instruments is necessary to simplify the intervention logic. As discussed in section 2.3., the official S3 document used several different layers (delivery areas, delivery instruments and ways of implementation) simultaneously to repre-sent instruments. The concept of a delivery instrument was not always consistently applied, and some were similar to objectives. Consistently using a single category for instruments will better organize the connection of instruments and indicators with objectives and fa-cilitate monitoring and evaluation.
how Apply a clear definition consistently across instruments. The defined instruments need to reflect identified challenges, gaps, priorities and goals, and to correspond to the interven-tion logic of the S3. Further, the timeframe for multi-annual programs needs to be defined more clearly. For instruments with multiple editions, consider defining the timeframe more clearly and in a way that also enables planning and tracking budget and indicator achieve-ment for individual program editions.
RecommeNdatioN 2b| sepaRate iNstitutioNal iNstRumeNts fRom tRaNsfeR mechaNisms
why Instruments dedicated to improving institutional and governance capacities have different pathways of change compared instruments that directly support the private sector or re-search sector. While there is a need for such instruments, their contribution to the achieve-ment of specific objectives is less clear and more indirect compared to targeted support to the private and research sectors.
how S3 instruments for institutional and governance capacities can be differentiated from trans-fer programs by setting a distinct strategic objective that aligns with the purpose of these instruments. For example, this new objective could relate to upgrading the capacities of the institutional actors involved in the S3 governance or to enabling necessary pre-conditions for the EDP and facilitating its implementation.
03 rECommEndationS 71

RecommeNdatioN 2c | cleaRly justify aNd documeNt chaNges to the policy miX
why The changes to the policy mix during implementation were not accompanied by a clear ratio-nale. Having a clear audit trail for the introduction of changes would facilitate comparisons between starting and revised designs and contribute to continuity and more comprehensive monitoring for evaluation purposes.
how Design the S3 in such a way to enable and facilitate regular updates and changes to the policy mix based on the EDP, foresight exercises and new needs of the target groups. Chang-es to the policy mix should be thoroughly documented, listing the underlying factors they are based upon, such as the experience of implementation, outputs of the EDP process, or other reasons, and based on consensus among the stakeholders. Keep clear records, with justifications, for changes introduced in the policy mix.
RecommeNdatioN 2d | stReNgtheN the coNNectioN betweeN iNstRumeNts aNd tpa Needs
why Although some EDP activities and consultations with triple-helix stakeholders were con-ducted through CCCs, the link between instruments and sectoral strategies and priorities is not fully developed in the S3 document. In the 2016-2020 period, there were no policy instruments targeting specific TPAs, and RDI programs generally were open to all TPAs. Nevertheless, the thematic innovation platforms were established and made operational, and they should be fully utilized so that the vision, goals, instruments, and resource prioriti-zation in the S3 can be informed and guided by sectoral requirements at each level, thereby increasing the strategy’s coherence and impact.
how Instruments should be defined and prioritized using sectoral challenges and priorities as inputs. Sectoral visions, goals, and project pipelines should guide future instrument calls beyond sectoral narrowing of indicative RDI topics for the STPAs or awarding extra points in project selection procedures. Sectoral needs should guide instrument design or redesign, prioritization, and overall fund allocation according to all sector priorities. In other words, each TPA should have policy mix specific for that TPA, in line with its vision, goals and objectives. TPA-specific RDI strategies could also help facilitate this process. For this to happen, the EDP should be much more effective at creating more incentives for self-organization among stakeholders in order to create synergies within each TPA. As a first step, EDP structures should take the lead in coordinating and advocating for the challenges and priorities of TPAs.
3.3 Monitoring and evaluation
Monitoring and evaluation are essential aspects of the S3 policy due to the constant need for experimentation and adjustments driven by the EDP. The S3 should identify a comprehensive but parsimonious set of indicators and targets that will allow policymakers to gauge the pace of change and make appropriate and timely adjustments. Indicators should be standardized and measured at all levels of the intervention logic. If the logic is set up properly and coherently, it should be straightforward to set up a logical hierarchy of
AnAlysis of the CroAtiA smArt speCiAlizAtion strAtegy: logiCAl frAmework, instruments, And indiCAtor results 72

indicators. Policymakers in Croatia have already taken steps to simplify and streamline the monitoring framework, but further improvements could be made toward standardization, target setting, and collecting TPA-specific data. Appendix I provides very specific recom-mendations for individual indicators in the S3 monitoring framework. These proposals would require a much improved M&E system, with more comprehensive and systematic data collection, starting at instrument level all the way to the strategic vision.
RecommeNdatioN 3a| build a coheReNt aNd coNsisteNt s3 m&e system
why The original monitoring framework in the S3 was defined mostly at the level of instruments, while higher and lower levels of the intervention logic were not directly associated with indicators. Indicators were not standardized or associated with specific definitions, which made it difficult to aggregate them to higher levels of the intervention logic. The monitoring framework was significantly streamlined during implementation, as policymakers chose to focus on a manageable set of core indicators, but there is still room for improvement in the indicator setup, as described below.
how Connections between indicators at different policy levels (instrument, specific goal, overall goal, and vision), and different policy production stages (input, output, outcome) should be improved. In particular, this requires modifying context indicators, improving the differenti-ation of output and outcome indicators, and adding process indicators. Targets set for the indicators should be consistent with the expected allocation of resources.
Indicators should be standardized. Appendix I proposes a set of recommendations for each indicator, building upon the report Analysis of Theory of Change and Results Framework (World Bank 2020).
Process indicators, intermediate targets, and milestones should be introduced to measure progress toward long-term change. This would allow tracking early signs of the advancement of policy goals and timely action and corrective measures, where necessary.
S3 action plans should contain information on measures and instruments with clearly de-fined responsibilities, budgets, timelines, and indicators for each year of implementation.
Quantitative impact evaluations should be envisaged for selected instruments. Further, given that non-S3 programs can also contribute to S3 objectives, the evaluation approach should consider how progress on S3 objectives are attributed and assessed in making policy decisions. Appendix IV presents a connection between S3 and non-S3 instruments, their outcomes, and S3-specific objectives, which may help identify the extent to which dif-ferent instrument-level outcomes are supported by S3 instruments as opposed to non-S3 instruments.
03 rECommEndationS 73

RecommeNdatioN 3b| measuRe aNd tRacK iNdicatoRs at the tpa level
why Building indicators, change pathways, and connections with objectives from a sectoral per-spective is necessary to capture the vertical nature of the S3 policy. This will allow assessing the contribution of each sector to the overall policy goals and evaluating each sector in terms of its advancement of and contribution to country competitiveness. From a bottom-up or demand-side perspective, by understanding how sectors are performing across outcome areas, policy makers can pin-point weaknesses in the change pathways of individual stra-tegic objectives and respond with customized policy priorities to meet sectoral demands. Currently, most output indicators are envisaged to be disaggregated and measured at the TPA level, but this is in practice done only for some programs and instruments.
how Indicators need to be adapted to make a proper connection with sectoral data. Standard-ized indicators across the policy mix should be disaggregated by sector and any other pri-ority dimensions that can assist in identifying the root causes of weaknesses. Intermediate targets and milestones should also be introduced at TPA level. For instance, if a sector is performing well in indicators under the change pathway of “Improved capacity of research-ers to conduct excellent RDI work” but is under-performing in “Increased transfer of R&D results in commercialization,” then policy makers can determine the “sectoral bottleneck,” which, in this example, is the market inefficiency related to commercialization, rather than improving the quality of research. Policy makers can then identify appropriate solutions, for example by reallocating resources or prioritizing policies related to commercialization support in the sector. Also, including specific TPA level indicators should help to upgrade the TPA level monitoring.
AnAlysis of the CroAtiA smArt speCiAlizAtion strAtegy: logiCAl frAmework, instruments, And indiCAtor results 74

References
75

References
Government of the Czech Republic. 2016. National Research and Innovation Strategy for Smart Specialisation of the Czech Republic. Department for Analysis and Coordination of Science, Research and Innovation.
Government of the Republic of Croatia. 2016. "Croatia Smart Specialization Strate-gy 2016-2020." https://s3platform.jrc.ec.europa.eu/documents/20182/222782/strategy_ EN.pdf/e0e7a3d7-a3b9-4240-a651-a3f6bfaaf10e
National Innovation Council. 2019. "Croatia Smart Specialization Strategy 2016-2020: Action Plan for 2019 and 2020."
Nauwelaers, Claire. 2018. "Frame for RIS3 monitoring system in Croatia."
S3 Interministerial Working Group and S3 Technical Secretariat. 2020. "Report on Im-plementation of the Croatia Smart Specialization Strategy 2016-2020 (draft)."
World Bank. 2019. "Croatia Public Expenditure Review in Science, Technology, and Inno-vation: Analysis of the Quality and Coherence of the Policy Mix." Analytical report, Zagreb.
World Bank. 2020. "Croatia Public Expenditure Review in Science, Technology, and Inno-vation: Analysis of Theory of Change and Results Framework." Analytical report, Zagreb.
AnAlysis of the CroAtiA smArt speCiAlizAtion strAtegy: logiCAl frAmework, instruments, And indiCAtor results 76

Appendix
77

Appendix
I. Indicator-specific recommendations
Although the S3 indicators were revised and to some extent improved in the recent years, there is still room to define and specify them further. In this section, the report assesses the revised S3 monitoring framework and makes recommendations for revi-sions for strengthening the framework and S3 indicators of policy instruments (PI) and harmonizing indicators with non-S3 policy instruments. The section follows the structure of the revised S3 monitoring framework, which provides an overview of the S3 programs presented together with output and outcome indicators to which they are expected to contribute. For clarification, not all PIs that contribute to the same objective have the same indicators assigned to them. However, for the sake of simplicity, this section shows all indicators connected with each specific sub-objective (SSO) in a batch, without differ-entiating between instruments that contribute to their achievement. In other words, in the table below, an indicator is listed only once per SSO regardless of the number of PIs that are expected to contribute to its achievement.27
27 Assessment is provided for all the indicators in the revised monitoring framework. Additionally, in cases where the same indicators were in the Analysis of Theory of Change and Results Framework (2020), proposals for indicator revisions are also included to leverage the ToC work.
AnAlysis of the CroAtiA smArt speCiAlizAtion strAtegy: logiCAl frAmework, instruments, And indiCAtor results 78

specific objective 1: iNcReased capacities of Rdi sectoR to peRfoRm eXcelleNt ReseaRch aNd to seRve the Needs of the ecoNomy
iNdicatoR level
iNdicatoR (iN Revised s3 fRamewoRK)
assessmeNt & RecommeNdatioNs
SSO1.1: Better understanding of what research strengths currently exist which will inform what gaps need to be filled
PI: Strategic project “Science and Technology Foresight” (Owner: Ministry of Science and Education)
output Visualized maps of defined research disciplines and technology areas
assessmeNt• Revise the indicator so that it can be quantified, such as by writing
as “Number of visualized maps of defined research disciplines and technology areas developed”
• Define different aspects of the indicator clearly, particularly the following: a) what it means by visualized maps; b) list of “defined research disciplines and technology areas,” if already established or known by the program
output Reports and common vision (foresight) developed
assessmeNt• Clarify what is to be measured by this indicator, particularly if
there is a distinction between “reports” and “common vision (foresights)”; if the two are different, it is better to separate them or use a parent indicator that enables disaggregation into these two elements; if the indicator is quantitative, such as for reports, then it advisable to revise the indicator to capture quantity by writing “Number of reports…”
outcome Creating a priority setting system for scientific R&D policy in Croatia
assessmeNt• The indicator reads as an activity rather than an indicator; hence,
clarify what is to be measured by this indicator. In particular, if it is a milestone of having created a priority setting system, then it should be a binary “yes” or “no” indicator
• Define different aspects of the indicator clearly, particularly the following: a) what is considered a priority setting system – is it a set of criteria that will be established/approved for policy formu-lation?; and b) whether the indicator will track only “development” of such system or also implementation
aPPEndix 79

SSO1.2: Avoidance of duplication or under-utilization of publicly funded research infrastructure; Facilitated access to enabling design, prototyping and pilot production infrastructure and expertise linked to the usage of infrastructure
PI: Strategic project “Science and Technology Foresight” (Owner: Ministry of Science and Education)
output Web based user interface for input, management and analysis of data developed and operational
assessmeNt• Define the indicator further to provide specifications of the
mentioned interface to be developed, particularly any criteria that will be used to assess and approve the system
• Consider adding additional measures that capture the “function-ality” of the developed system by capturing information such as utilization rate, volume of data managed, etc.
output Legal framework for collection and management of RDI data in research organizations developed
assessmeNt• (No change suggested)
outcome Rate of public infrastructure usage by owner
assessmeNt• Define the indicator to elaborate how utilization or usage rate of
public infrastructure is to be calculated. If the calculation is to be harmonized with similar indicators on research infrastructure, then the equation could be similar to “capacity used/maximum capacity” of the research infrastructure, where “capacity used” can be measured in terms of occupancy rate of spaces in the infrastructure
• This indicator measures the usage by owner; however, a parent indicator can be created for overall occupancy usage, and the current indicator can be a disaggregate so that it is easier to compare overall utilization rate across other programs that might not have the same user or user groups
outcome Rate of public infrastructure usage shared between public research organizations
assessmeNt• Define the indicator to elaborate how utilization or usage rate of
public infrastructure is to be calculated. If the calculation is to be harmonized with similar indicators on research infrastructure, then the equation could be similar to “capacity used/maximum capacity” of the research infrastructure, where “capacity used” can be measured in terms of occupancy rate of spaces in the infrastructure
• This indicator measures the usage by public research organiza-tions; however, a parent indicator can be created for overall oc-cupancy usage, and the current indicator can be a disaggregate so that it is easier to compare overall utilization rate across oth-er programs that might not have the same user or user groups
AnAlysis of the CroAtiA smArt speCiAlizAtion strAtegy: logiCAl frAmework, instruments, And indiCAtor results 80

outcome Rate of public infrastructure usage by companies
assessmeNt• Define the indicator to elaborate how utilization or usage rate of
public infrastructure is to be calculated. If the calculation is to be harmonized with similar indicators on research infrastructure, then the equation could be similar to “capacity used/maximum capacity” of the research infrastructure, where “capacity used” can be measured in terms of occupancy rate of spaces in the infrastructure
• This indicator measures the usage by companies; however, a par-ent indicator can be created for overall occupancy usage, and the current indicator can be a disaggregate so that it is easier to compare overall utilization rate across other programs that might not have the same user or user groups
SSO1.3: Increase R&D ability for conducting top quality research and cooperation on national and international level
PIs:• Preparation of RDI infrastructural projects• Investment into organizational reform and infrastructure of RDI sector• Croatian Scientific and Educational Cloud (HR-ZOO)• Center for Advanced Laser Techniques (CALT)• Children Centre for Translational Medicine at the Children’s Hospital Srebrnjak• Open scientific infrastructural platforms for innovative applications in economy and society – O-ZIP• Development and strengthening synergies with HORIZON 2020 horizontal activities: Twinning and
ERA chairs• Development and strengthening synergies with HORIZON 2020 horizontal activities: Teaming• Research projects of Croatian Science Foundation (all fields of science) – basic and applied research
conducted by a recognizable research group• Installation Research program of Croatian Science Foundation (all fields of science)• Croatian-Swiss Research Programme 2017–2023 (CSRP) – all fields of science, Implementing body:
Croatian Science Foundation• Young Researchers’ Career Development Programme – all fields of science, Implementing body:
Croatian Science Foundation• Program for enhancing R&D climate change activities(Owners: Ministry of Science and Education, Croatian Science Foundation)
output Number of RDI infrastructure projects prepared
assessmeNt• Improve clarity of the indicator by providing adequate definition
of what prepared infrastructure projects should entail• Improve specificity of the indicator by noting that the counted
projects are those supported through the policy instruments
aPPEndix 81

output Number of RDI infrastructure projects
assessmeNt• Consider revising the definition slightly and tracking the projects
disaggregated by their type, as per suggestion below• Improve specificity of the indicator by noting that the counted
projects are those supported through the policy instruments
RevisioNIndicator: Number of RDI infrastructure projects supportedDefinition: The indicator refers to the number of RDI infrastructure projects that are specifically supported through the funds provided by the program. RDI infrastructure projects are those that will enable organizational reform of ROs through investments in infrastructure. Indicator refers to (and is disaggregated to count) the number of (i) newly constructed RDI infrastructure; (ii) improved existing RDI in-frastructure within existing fields or to open new research directions; and (iii) equipped facilities for RDI (procurement and installation of equipment including laboratory and office furniture and software and IT equipment required for use of research and development equipment).Disaggregation: By S3 priority areas, by disaggregation measures mentioned in the definitionTarget: As set by the programDeadline for Achievement: The date of project completion (final payment disbursement)Means of Collection and Verification (MoCV): • Verification: in grant contract; approved requests for reimburse-
ments; decision on final payment disbursement; in cases of projects requiring obtaining use permit or certification in accor-dance with national legislation, it is necessary to do so in order for project activities to be considered finished
• Process: Target assigned during application phase; progress tracked through quarterly project implementation reports; as-sessment at approval of final implementation report and final payment disbursement of individual projects. Beneficiaries are not required to report on this indicator during project implemen-tation, because it is tracked by the program managers based on the status of implementation of particular projects (projects in implementation phase and projects completed).
output Number of researchers working in improved research infrastructure facilities
assessmeNt• Consider tracking newly employed researchers in such infra-
structure as an additional measure
AnAlysis of the CroAtiA smArt speCiAlizAtion strAtegy: logiCAl frAmework, instruments, And indiCAtor results 82

output Number of supported Teaming, Twinning and ERA chair projects
assessmeNt • (No change suggested)
output Number of projects of National Centers of Research Excellence supported
assessmeNt • Harmonize as per the suggestion below
RevisioNDefinition: The indicator refers to the number of Centers of Research Excellence supported to conduct research activities with the grant support awarded through the program.Disaggregation: By field of research; by S3 thematic priority areasTarget: As set by the applicantDeadline for Achievement: The date of project completion (final payment disbursement)MoCV:• Verification: Grant contract; approved requests for reimburse-
ments; decision on final payment• Target assigned during application phase; progress tracked
through quarterly project implementation reports; assessment at approval of final implementation report and final payment dis-bursement of individual projects. Beneficiaries are not required to report on this indicator during project implementation, because it is tracked by the program managers based on the status of im-plementation of particular projects (projects in implementation phase and projects completed).
output Number of researchers working in supported CoREs
assessmeNt • Harmonize with other indicators tracking number of researchers
involved in project implementation and track CoRE researchers as a disaggregate measure
output Number of research projects supported
assessmeNt • (No change suggested)
aPPEndix 83

output Number of joint research projects supported
assessmeNt • Harmonize the indicator with other projects that also support
collaborative approach to project implementation• Define the indicator further to improve clarity on what indica-
tor measures• Add disaggregation to capture different characteristics of the
project
RevisioNIndicator: Number of collaborative research projects supportedDefinition: The indicator refers to the number of collaborative R&D projects conducted by grantees with the grant awarded under the program. This indicator will capture only completed projects, which are defined as those that have approval of the grantee’s final project implementation report and for which the grantee has received the final payment. For monitoring purposes, the indicator should track the projects that are contracted, those that are ongoing, and those that have been completed.Disaggregation: By project status (awarded/ongoing, completed); by project results (projects that achieved their objectives, projects with objectives partially achieved, projects that were discontinued due to irregularities or other reasons); by research field; by S3 thematic priority areas; by region; by novelty of collaboration (new, existing); by perception of quality of collaboration (satisfaction); by partner origin (Croatian, foreign)Target: As set by the programDeadline for Achievement: The date of project completion (final payment disbursement)MoCV: • Verification: Grant contract; approved requests for reimburse-
ments; decision on final payment • Process: Target assigned during application phase; progress
tracked through annual project implementation reports; as-sessment at approval of final implementation report and final payment disbursement of individual projects. Beneficiaries are not required to report on this indicator during project implemen-tation, because it is tracked by the program managers based on the status of implementation of particular projects (projects in implementation phase and projects completed).
AnAlysis of the CroAtiA smArt speCiAlizAtion strAtegy: logiCAl frAmework, instruments, And indiCAtor results 84

output Number of new researchers in supported subjects
assessmeNt • Harmonize with other indicators tracking number of researchers
involved in project implementation and track the newly employed researchers as a disaggregate measure
• Define indicator further, with slight revision in wording to har-monize with other program indicators
RevisioNIndicator: Number of full-time equivalent (FTE) researchers involved in project implementationDefinition: The indicator counts researchers that directly carry out research and development activities related to the implementation of the project. Workforce may be existing or new, employed at the beneficiary and partners or contracted from third parties. Auxiliary staff for R&D activities (jobs that are not directly involved in R&D activities) are not counted. The measurement unit is “Full-time equivalent.” Engagement of researchers employed in the research activities supported by the project less than full-time should be con-verted to the number of FTE employees by dividing the researchers’ scheduled hours by the number of hours in the full-time workweek.Disaggregation: By employment duration (existing researchers, newly employed researchers); by employment origin (researchers employed at the beneficiary/partner institutions, external/contracted, and visiting researchers); by field/academic discipline; by gender; by source of financing of researchers’ salaries (fully or partially support-ed through the grant, institutional funds, other funds); by seniority (PhD students, post-doctoral researchers, senior researchers, oth-er); out of which: • Vulnerable groups (minorities, migrants, disabled, other disad-
vantaged persons)• Ratio of male to female of researchers employedTarget: As assigned by the applicantDeadline for Achievement: The date of project completion (final payment disbursement)MoCV: • Verification: Implementation reports describing the research-
ers’ involvement in project implementation; supporting evidence (employment contracts, timesheets)
• Process: Target assigned during application phase; progress tracked through annual project implementation reports, as-sessment at approval of final implementation report and final payment disbursement of individual projects
aPPEndix 85

output Number of supported doctoral students
assessmeNt • Use a parent indicator “Number of full-time equivalent (FTE) re-
searchers involved in project implementation,” which is disag-gregated to this indicator, which is defined below:
RevisioNIndicator: Number of full-time equivalent (FTE) researchers involved in project implementationDefinition: The indicator counts researchers that directly carry out research and development activities related to the implementation of the project. Workforce may be existing or new, employed at the beneficiary and partners or contracted from third parties. Auxiliary staff for R&D activities (jobs that are not directly involved in R&D activities) are not counted. The measurement unit is “Full-time equivalent.” Engagement of researchers employed in the research activities supported by the project less than full-time should be con-verted to the number of FTE employees by dividing the researchers’ scheduled hours by the number of hours in the full-time workweek.Disaggregation: By employment duration (existing researchers, newly employed researchers); by employment origin (researchers employed at the beneficiary/partner institutions, external/contracted, and visiting researchers); by field/academic discipline; by gender; by source of financing of researchers’ salaries (fully or partially support-ed through the grant, institutional funds, other funds); by seniority (PhD students, post-doctoral researchers, senior researchers, oth-er); out of which: • Vulnerable groups (minorities, migrants, disabled, other disad-
vantaged persons)• Ratio of male to female of researchers employedTarget: As assigned by the applicantDeadline for Achievement: The date of project completion (final payment disbursement)MoCV: • Verification: Implementation reports describing the researchers’
involvement in project implementation; supporting evidence (employment contracts, timesheets)
• Process: Target assigned during application phase; progress tracked through annual project implementation reports, as-sessment at approval of final implementation report and final payment disbursement of individual projects
AnAlysis of the CroAtiA smArt speCiAlizAtion strAtegy: logiCAl frAmework, instruments, And indiCAtor results 86

outcome Number of collaborative contracted projects (by beneficiaries in HEIs and PROs) with foreign HEI and PRO institutions
assessmeNt • Use a parent indicator “Number of collaborative projects con-
tracted after project completion” that is disaggregated to this indicator, which is defined below:
RevisioNIndicator: Number of collaborative projects contracted after proj-ect completionDefinition: The indicator refers to the number of new collaborative research projects involving the beneficiary of the supported project and at least one other entity and contracted after the end of imple-mentation of the supported project. The beneficiary organization is involved as either the main beneficiary or a partner in the imple-mentation of the new projects contracted.Disaggregation: By collaboration novelty (new, existing); by type of partner (research organization, enterprise, other); by partner origin (domestic, foreign, diaspora); by type of research (basic, applied, ex-perimental development); by science area; by science field; by fund-ing source (national, EU, private, other); by S3 thematic priority areaTarget: As assigned by the applicantDeadline for Achievement: 5 years from the date of project completionMoCV: • Verification: Post-project implementation reports providing in-
formation on project beneficiary and partners, date of contract award, project value and funding source, short description of objectives and activities, links to web pages providing additional information (if applicable)
• Process: Target assigned during application phase; post-im-plementation reporting and assessment 1, 3 and 5 years after project completion
aPPEndix 87

outcome Number of scientific publications published in journals indexed in the Web of Science Core Collection
assessmeNt • Indicator can be broadened to capture all scientific publications
indexed in the Web of Science but with the ability to disaggre-gate by proxy measures of “quality” of the articles using journal ranks, number of citations, etc. as suggested in the revision below
• Use as a parent indicator for other indicators tracking publica-tions (e.g., publications in top journals, or co-authored with the private sector)
• Optional measures can be used to track additional features of such publications
RevisioNIndicator: Number of scientific publications published in scientific journals and indexed in Web of ScienceDefinition: Scientific papers are written and published reports describing original research results with the aim of informing the scientific community and society as a whole about scientific dis-coveries. Scientific papers indexed on the Web of Science (Core Collection) platform include articles, reviews, proceedings, letters, and chapters in books. Disaggregation: By rank of journal where publication was published (first- and second-quartile journals, other); by scientific areas; by scientific fields; by S3 priority areas; out of which: number of joint publications with industry partnersTarget: As assigned by the applicantDeadline for Achievement: 5 years from the date of project completionOptional Measures:• Number of citations received by publications supported by the
program• Change in h-index of organizations supported• Time needed for the publication to get first citation• Number of other publications resulting from project activi-
ties (other publications are publications not indexed in ‘Web of Science’)
MoCV: • Verification: Implementation and post-implementation reports
containing list of publications and DOIs; source verification in Web of Science (Core Collection)
• Process: Data to be collected in year 1, 3, and 5 after project completion. Target for each recipient and program of the fund-ing should be set in the application and contract based on the feasibility and likelihood of publications during and after the project period.
AnAlysis of the CroAtiA smArt speCiAlizAtion strAtegy: logiCAl frAmework, instruments, And indiCAtor results 88

outcome Number of publications in top-ranking international, peer-reviewed first or second-quartile journals with applicant being main or corresponding author in certain scientific area according to the relevant scientific databases
assessmeNt• Standardize this indicator with existing indicator “Number of sci-
entific publications published in scientific journals and indexed in ‘Web of Science’” but with added disaggregation tracking whether the publication was published in a top-ranking journal
outcome Total contracted amount of RDI funding from centralized EU funds (attracted by beneficiaries)
assessmeNt• Use a parent indicator “Value of R&D finance contracted from all
sources after project completion” that is disaggregated to this indicator, which is defined below:
RevisioNIndicator: Value of R&D finance contracted from all sources after project completionDefinition: Value of funds allocated to research and innovation proj-ects acquired through competitive procedures, e.g., national and centralized EU-level funding programs, or contracted from private sector. Funds should be acquired by project beneficiary after the end of the support and should have a clear purpose of conducting R&D activities or strengthening capacities for R&D (such as financ-ing equipment purchase).Disaggregation: By type of research (basic, applied, experimental development); by research field; by S3 thematic priority areas; by region; by funding source (national, EU, private, other)Target: As assigned by the applicantDeadline for Achievement: 5 years from the date of project completionMoCV: • Verification: Post-implementation reports, providing information
on date of contract award, project value and funding source, short description of planned objectives and activities, S3 alignment, links to web pages providing additional information (if applicable)
• Process: Target assigned during application phase; post-imple-mentation reporting/assessment 1, 3 and 5 years after project completion
aPPEndix 89

outcome Total contracted amount of RDI funding from national funds (attracted by beneficiaries)
assessmeNt• Use a parent indicator “Value of R&D finance contracted from all
sources after project completion” that is disaggregated to this indicator, which is defined below:
RevisioNIndicator: Value of R&D finance contracted from all sources after project completionDefinition: Value of funds allocated to research and innovation proj-ects acquired through competitive procedures, e.g., national and centralized EU-level funding programs, or contracted from private sector. Funds should be acquired by project beneficiary after the end of the support and should have a clear purpose of conducting R&D activities or strengthening capacities for R&D (such as financ-ing equipment purchase).Disaggregation: By type of research (basic, applied, experimental development); by research field; by S3 thematic priority areas; by region; by funding source (national, EU, private, other)Target: As assigned by the applicantDeadline for Achievement: 5 years from the date of project completionMoCV: • Verification: Post-implementation reports, providing information
on date of contract award, project value and funding source, short description of planned objectives and activities, S3 alignment, links to web pages providing additional information (if applicable)
• Process: Target assigned during application phase; post-imple-mentation reporting/assessment 1, 3 and 5 years after project completion
SSO1.4 Research conducted for the needs of the economy
PIs: ○ Science and Innovation Investment Fund (SIIF) ○ Second Science and Technology Project (STPII) – POC public
(Owners: Ministry of Science and Education, HAMAG-BICRO)
output Number of R&D projects conducted by research organizations
assessmeNt• Harmonize with other indicators tracking research projects and
introduce disaggregate measures, including by type of benefi-ciary conducting the project
AnAlysis of the CroAtiA smArt speCiAlizAtion strAtegy: logiCAl frAmework, instruments, And indiCAtor results 90

output Number of FTE researchers engaged in research organizations
assessmeNt• Standardize the indicator with similar indicators tracking the
number of researchers involved in other programs• Clarify the definition with more information and disaggregates
RevisioNIndicator: Number of full-time equivalent (FTE) researchers involved in project implementationDefinition: The indicator counts researchers that directly carry out research and development activities related to the implementation of the project. Workforce may be existing or new, employed at the beneficiary and partners or contracted from third parties. Auxiliary staff for R&D activities (jobs that are not directly involved in R&D activities) are not counted. The measurement unit is “Full-time equivalent.” Engagement of researchers employed in the research activities supported by the project less than full-time should be con-verted to the number of FTE employees by dividing the researchers’ scheduled hours by the number of hours in the full-time workweek.Disaggregation: By employment duration (existing researchers, newly employed researchers); by employment origin (researchers employed at the beneficiary/partner institutions, external/contracted, and visiting researchers); by field/academic discipline; by gender; by source of financing of researchers’ salaries (fully or partially support-ed through the grant, institutional funds, other funds); by seniority (PhD students, post-doctoral researchers, senior researchers, oth-er); Out of which: • Vulnerable groups (minorities, migrants, disabled, other disad-
vantaged persons)• Ratio of male to female of researchers employedTarget: As assigned by the applicantDeadline for Achievement: The date of project completion (final payment disbursement)MoCV:• Verification: Implementation reports describing the researchers’
involvement in project implementation; supporting evidence (employment contracts, timesheets)
• Process: Target assigned during application phase; progress tracked through annual project implementation reports, as-sessment at approval of final implementation report and final payment disbursement of individual projects
output Technical success of projects (concept proven or not)
assessmeNt• Track as disaggregate measure of the indicator tracking the
number of projects supported
aPPEndix 91

output Number of market analyses
assessmeNt• Provide clear definition and MoCV on what qualifies to be cap-
tured by the indicator, as suggested below
RevisioNDefinition: The indicator measures the number of market analy-ses prepared with the advisory support received from consultants or service providers funded through the program. Market analyses are prepared as analytical inputs for development of commercial-ization strategies or plans and include elements such as market sizing and analysis of potential customers, competition, barriers to entry, regulation, etc.Disaggregation: By industry, S3 priority areasTarget: As assigned by the applicantDeadline for Achievement: The date of project completion (final payment disbursement)MoCV:• Verification: Implementation reports; supporting evidence (copies
of market analyses prepared, invoices for the service provided)• Process: Target assigned during application phase; progress
tracked through implementation report for the first half of the implementation period; assessment at approval of final imple-mentation report of individual projects
output Number of demonstrations of technical feasibility resulting from PoC projects
assessmeNt• Track as disaggregate measure of the indicator tracking the
number of projects supported
output Number of (laboratory) prototypes resulting from PoC projects
assessmeNt• Track as disaggregate measure of the indicator tracking the
number of projects supported
AnAlysis of the CroAtiA smArt speCiAlizAtion strAtegy: logiCAl frAmework, instruments, And indiCAtor results 92

output Number of commercialization strategies
assessmeNt• Provide clear definition and MoCV on what qualifies to be cap-
tured by the indicator, as suggested below
RevisioNDefinition: The indicator measures the number of commercialization strategies or plans developed with the advisory support received from consultants or service providers funded through the program. This indicator captures the number of final deliverables in the form of actual commercialization strategies or plans developed after var-ious analytical activities, such as market analysis, cost-benefit anal-ysis, or other studies that become inputs to the strategy document.Disaggregation: By industryTarget: As assigned by the applicantDeadline for Achievement: The date of project completion (final payment disbursement)MoCV:• Verification: Implementation reports; supporting evidence (copies
of strategies or plans developed, invoices for the service provided)• Process: Target assigned during application phase; progress
tracked through implementation report for the first half of the implementation period; assessment at approval of final imple-mentation report of individual projects
aPPEndix 93

outcome Number of collaborative contracted projects between companies and HEIs/PROs after the end of supported projects
assessmeNt• Use a parent indicator “Number of collaborative projects con-
tracted after project completion” that is disaggregated to this indicator, which is defined below:
RevisioNIndicator: Number of collaborative projects contracted after proj-ect completionDefinition: The indicator refers to the number of new collaborative research projects involving the beneficiary of the supported project and at least one other entity and contracted after the end of imple-mentation of the supported project. The beneficiary organization is involved as either the main beneficiary or a partner in the imple-mentation of the new projects contracted.Disaggregation: By collaboration novelty (new, existing); by type of partner (research organization, enterprise, other); by partner origin (domestic, foreign, diaspora); by type of research (basic, applied, ex-perimental development); by science area; by science field; by fund-ing source (national, EU, private, other); by S3 thematic priority areaTarget: As assigned by the applicantDeadline for Achievement: 5 years from the date of project completionMoCV: • Verification: Post-project implementation reports providing in-
formation on project beneficiary and partners, date of contract award, project value and funding source, short description of objectives and activities, links to web pages providing additional information (if applicable)
• Process: Target assigned during application phase; post-im-plementation reporting and assessment 1, 3 and 5 years after project completion
AnAlysis of the CroAtiA smArt speCiAlizAtion strAtegy: logiCAl frAmework, instruments, And indiCAtor results 94

outcome Number of collaborative contracted projects (by beneficiaries in HEIs and PRO) with foreign HEI and PRO institutions
assessmeNt• Use a parent indicator “Number of collaborative projects con-
tracted after project completion” that is disaggregated to this indicator, which is defined below:
RevisioNIndicator: Number of collaborative projects contracted after proj-ect completionDefinition: The indicator refers to the number of new collaborative research projects involving the beneficiary of the supported project and at least one other entity and contracted after the end of imple-mentation of the supported project. The beneficiary organization is involved as either the main beneficiary or a partner in the imple-mentation of the new projects contracted.Disaggregation: By collaboration novelty (new, existing); by type of partner (research organization, enterprise, other); by partner origin (domestic, foreign, diaspora); by type of research (basic, applied, ex-perimental development); by science area; by science field; by fund-ing source (national, EU, private, other); by S3 thematic priority areaTarget: As assigned by the applicantDeadline for Achievement: 5 years from the date of project completionMoCV: • Verification: Post-project implementation reports providing in-
formation on project beneficiary and partners, date of contract award, project value and funding source, short description of objectives and activities, links to web pages providing additional information (if applicable)
• Process: Target assigned during application phase; post-im-plementation reporting and assessment 1, 3 and 5 years after project completion
aPPEndix 95

outcome Number of start-ups/spin-offs/spin-outs originating from supported projects
assessmeNt• Use a parent indicator that is disaggregated to this indicator,
which is defined below:
RevisioNIndicator: Number of technology transfer models realized due to project implementationDefinition: The indicator refers to transfers of research results (knowl-edge and technology) realized due to project implementation with the purpose of their further development or their use in development and commercialization of new products (goods or services). Project results can be transferred from the project beneficiary or partners to third parties in the form of signed R&D agreements or contracts and intellectual property (IP) licensing agreements, or the transfer can be realized through establishment of new enterprises. More spe-cifically, the following are the types of technology transfer models captured (and disaggregated) by the indicator:• Number of new start-ups/spin-offs/spin-outs originating out
of supported projects: Number of new enterprises (start-up/spin-off/spin-out) established by project beneficiary or project partners as a result of funded project. A start-up is an enterprise less than 3 years old. A spin-off is an enterprise that has been started by a university group but has never left the university environment and perhaps exists to offer specialist consultancy services without the intention for any further expansion or full technology transfer. A spin-out is an enterprise in which the university or institute has an equity stake.
• Number of licensing agreements signed with the industry: The licensing agreement is a contract to be used by enterprises for technology transfer through granting rights of industrial owner-ship (license of patents and trademarks).
• Number of other technology transfer agreements signed with the industry: Any other forms of technology transfer or commer-cialization agreements signed with the enterprises.
• Number of contract research agreements with the industry.Disaggregation: By models of technology transfer (as listed in the definition)Target: As assigned by the applicantDeadline for Achievement: 5 years from the date of project completionMoCV:• Verification: Implementation and post-implementation reports;
supporting evidence (copies of contracts signed, formal docu-mentation on establishment of an enterprise, etc.)
• Process: Target assigned during application phase; annual report-ing during project implementation period; post-implementation reporting and assessment 1, 3 and 5 years after project completion
AnAlysis of the CroAtiA smArt speCiAlizAtion strAtegy: logiCAl frAmework, instruments, And indiCAtor results 96

outcome Number of IP applications filed
assessmeNt• The indicator could be standardized with other indicators using
the indicator and definition described below, including disaggre-gation of filed and registered applications, because timeframe may vary based on the policy instruments’ support intensity or approach
RevisioNIndicator: Number of IPR applications filed Definition: Indicator refers to the number of IPR applications (in-cluding patents, trademarks, industrial designs, etc.) filed by the project beneficiary and partners involved in project implementation as a result of the research activities conducted in the scope of the financed project. Applicant should state the expected number of IPR applications in the project application. In the post-implemen-tation reporting phase, applicant should provide a description of a clear link between the conducted research activities and the IPR protection filed.Disaggregation: By type of IPR (patents, industrial design, trade-marks); by application status (filed, registered/approved); by type of procedure (national, international)Target: At least 1 per projectDeadline for Achievement: 5 years from the date of project completionOptional Measures:• Number of ‘patentability studies’ conducted to verify and pro-
tect IP of project results (by outcome: project result patentable/not patentable)
Target: As assigned by the applicantDeadline for Achievement: 5 years from the date of project completionMoCV:• Verification: Implementation and post-implementation reports;
supporting evidence (documentation verifying the IPR applica-tion and its status)
• Process: Target assigned during application phase; annual re-porting during project implementation period; post-implemen-tation reporting and assessment 1, 3 and 5 years after project completion
outcome Number of IP applications registered
assessmeNt• The indicator could be standardized with other indicators and
used as a disaggregate of “Number of IPR applications filed”
aPPEndix 97

outcome Number of Scientific publications published in the journals indexed in the Web of Science Core Collection
assessmeNt• Indicator can be broadened to capture all scientific publications
indexed in the Web of Science, providing the ability to disaggre-gate by proxy measures of “quality” of the articles using journal ranks, number of citations, etc. as suggested in the revision below
• Use as a parent indicator for other indicators tracking publica-tions (e.g., publications in top journals, or co-authored with the private sector)
• Optional measures can be used to track additional features of such publications
RevisioNIndicator: Number of scientific publications published in scientific journals and indexed in ‘Web of Science’Definition: Scientific papers are written and published reports describing original research results with the aim of informing the scientific community and the society as a whole about scientific discoveries. Scientific papers indexed on the Web of Science (Core Collection) platform include articles, reviews, proceedings, letters, and chapters in books. Disaggregation: By rank of journal where publication was published (first and second-quartile journals, other); by scientific areas; by scientific fields; by S3 priority areas; out of which: number of joint publications with industry partnersOptional Measures:• Number of citations received by publications supported by the
program• Change in h-index of organizations supported• Time needed for the publication to get first citation• Number of other publications resulting from the project activ-
ities (Definition: other publications refer to those publications that were not indexed in ‘Web of Science’)
Target: As assigned by the applicantDeadline for Achievement: 5 years from the date of project completionMoCV: • Verification: Implementation and post-implementation reports
containing list of publications and DOIs; source verification in Web of Science (Core Collection)
• Process: Data to be collected in year 1, 3, and 5 after project completion. Target for each recipient and program of the fund-ing should be set in the application and contract based on the feasibility and likelihood of publications during and after the project period.
AnAlysis of the CroAtiA smArt speCiAlizAtion strAtegy: logiCAl frAmework, instruments, And indiCAtor results 98

outcome Total contracted amount of RDI funding from centralized EU funds (attracted by beneficiaries)
assessmeNt• Use a parent indicator “Value of R&D finance contracted from all
sources after project completion” that is disaggregated to this indicator, which is defined below:
RevisioNIndicator: Value of R&D finance contracted from all sources after project completionDefinition: Value of funds allocated to research and innovation proj-ects acquired through competitive procedures, e.g., national and centralized EU-level funding programs, or contracted from private sector. Funds should be acquired by project beneficiary after the end of the support and should have a clear purpose of conducting R&D activities or strengthening capacities for R&D (such as financ-ing equipment purchase).Disaggregation: By type of research (basic, applied, experimental development); by research field; by S3 thematic priority areas; by region; by funding source (national, EU, private, other)Target: As assigned by the applicantDeadline for Achievement: 5 years from the date of project completionMoCV: • Verification: Post-implementation reports, providing information
on date of contract award, project value and funding source, short description of planned objectives and activities, S3 alignment, links to web pages providing additional information (if applicable)
• Process: Target assigned during application phase; post-imple-mentation reporting/assessment 1, 3 and 5 years after project completion
aPPEndix 99

outcome Total contracted amount of RDI funding from national funds (attracted by beneficiaries)
assessmeNt• Use a parent indicator “Value of R&D finance contracted from all
sources after project completion” that is disaggregated to this indicator, which is defined below:
RevisioNIndicator: Value of R&D finance contracted from all sources after project completionDefinition: Value of funds allocated to research and innovation proj-ects acquired through competitive procedures, e.g., national and centralized EU-level funding programs, or contracted from private sector. Funds should be acquired by project beneficiary after the end of the support and should have a clear purpose of conducting R&D activities or strengthening capacities for R&D (such as financ-ing equipment purchase).Disaggregation: By type of research (basic, applied, experimental development); by research field; by S3 thematic priority areas; by region; by funding source (national, EU, private, other)Target: As assigned by the applicantDeadline for Achievement: 5 years from the date of project completionMoCV: • Verification: Post-implementation reports, providing information
on date of contract award, project value and funding source, short description of planned objectives and activities, S3 alignment, links to web pages providing additional information (if applicable)
• Process: Target assigned during application phase; post-imple-mentation reporting/assessment 1, 3 and 5 years after project completion
AnAlysis of the CroAtiA smArt speCiAlizAtion strAtegy: logiCAl frAmework, instruments, And indiCAtor results 100

outcome Total contracted amount of further RDI funding from private sector (attracted by beneficiaries)
assessmeNt• Use a parent indicator “Value of R&D finance contracted from all
sources after project completion” that is disaggregated to this indicator, which is defined below:
RevisioNIndicator: Value of R&D finance contracted from all sources after project completionDefinition: Value of funds allocated to research and innovation proj-ects acquired through competitive procedures, e.g., national and centralized EU-level funding programs, or contracted from private sector. Funds should be acquired by project beneficiary after the end of the support and should have a clear purpose of conducting R&D activities or strengthening capacities for R&D (such as financ-ing equipment purchase).Disaggregation: By type of research (basic, applied, experimental development); by research field; by S3 thematic priority areas; by region; by funding source (national, EU, private, other)Target: As assigned by the applicantDeadline for Achievement: 5 years from the date of project completionMoCV: • Verification: Post-implementation reports, providing information
on date of contract award, project value and funding source, short description of planned objectives and activities, S3 alignment, links to web pages providing additional information (if applicable)
• Process: Target assigned during application phase; post-imple-mentation reporting/assessment 1, 3 and 5 years after project completion
aPPEndix 101

outcome Number of applied research projects implemented/in implementation after the end of a funded project
assessmeNt• The indicator could be harmonized with other indicators using
the indicator and definition described below:
RevisioNIndicator: Number of collaborative projects contracted after proj-ect completionDefinition: The indicator refers to the number of new collaborative research projects involving the beneficiary of the supported project and at least one other entity and contracted after the end of imple-mentation of the supported project. The beneficiary organization is involved as either the main beneficiary or a partner in the imple-mentation of the new projects contracted.Disaggregation: By novelty of collaboration (new, existing); by re-search field; by S3 thematic priority areas; by region; by funding source (national, EU, private, other)Target: As assigned by the applicantDeadline for Achievement: 5 years from the date of project completionMoCV:• Verification: Post-project implementation reports providing in-
formation on project beneficiary and partners, date of contract award, project value and funding source, short description of objectives and activities, links to web pages providing additional information (if applicable)
• Process: Target assigned during application phase; post-im-plementation reporting and assessment 1, 3 and 5 years after project completion
AnAlysis of the CroAtiA smArt speCiAlizAtion strAtegy: logiCAl frAmework, instruments, And indiCAtor results 102

outcome Number of applied research projects implemented/in implementation after the end of a funded project
assessmeNt• The indicator could be harmonized with other indicators using
the indicator and definition described below:
RevisioNIndicator: Number of collaborative projects contracted after proj-ect completionDefinition: The indicator refers to the number of new collaborative research projects involving the beneficiary of the supported project and at least one other entity and contracted after the end of imple-mentation of the supported project. The beneficiary organization is involved as either the main beneficiary or a partner in the imple-mentation of the new projects contracted.Disaggregation: By novelty of collaboration (new, existing); by re-search field; by S3 thematic priority areas; by region; by funding source (national, EU, private, other)Target: As assigned by the applicantDeadline for Achievement: 5 years from the date of project completionMoCV:• Verification: Post-project implementation reports providing in-
formation on project beneficiary and partners, date of contract award, project value and funding source, short description of objectives and activities, links to web pages providing additional information (if applicable)
• Process: Target assigned during application phase; post-im-plementation reporting and assessment 1, 3 and 5 years after project completion
outcome Number of new innovative products/services/processes/technologies
assessmeNt• The indicator could be split into two indicators that measure
product and process innovations separately• The indicator definitions could be standardized (with the OECD/
Eurostat definition) and harmonized with similar indicators as shown below.
RevisioN1) Indicator: Number of product innovations introducedDefinition: The indicator measures the number of new product innovations introduced by supported entities during and after the project implementation period. A product innovation is the intro-duction of a good or service that is new or significantly improved with respect to its characteristics or intended uses. This includes significant improvements in technical specifications, components and materials, incorporated software, user friendliness, or other functional characteristics. Product innovations can utilize new knowledge or technologies or can be based on new uses or combi-nations of existing knowledge or technologies. The term “product” is used to cover both goods and services. Product innovations include both the introduction of new goods and services and significant improvements in the functional or user characteristics of existing goods and services (Source: OECD/Eurostat). The number of product innovations is reported cumulatively, up to a data collection point set in the post-implementation period.Disaggregation: By S3 thematic priority areas; by industry; by mar-ket (domestic, international); by type (goods, services); by novelty (new, improved)• Out of which: Number of “new-to-market” product innovations
introduced (Note: A product is considered “new-to-market” if there is no other product available on the national market that offers the same functionality or if the new product uses technol-ogy that is significantly different from the technology of existing products. Potential product novelty is determined in the phase of assessment of project proposals submitted and verified when the product is developed.)
Target: As assigned by the applicantDeadline for Achievement: 5 years from the date of project completionMoCV:• Verification: Implementation and post-implementation reports;
supporting evidence• Process: Target assigned during application phase; assessment
at project completion; post-implementation reporting and as-sessment 1, 3 and 5 years after project completion
aPPEndix 103

2) Indicator: Number of process innovations introducedDefinition: The indicator measures the number of new process in-novations introduced by supported entities during and after project completion. A process innovation is the implementation of a new or significantly improved production or delivery method. This includes significant changes in techniques, equipment, or software. Process innovations can be intended to decrease unit costs of production or delivery, to increase quality, or to produce or deliver new or signifi-cantly improved products. Process innovations include new or signifi-cantly improved methods for the creation and provision of services. They can involve significant changes in the equipment and software used in services-oriented firms or in the procedures or techniques that are employed to deliver services. Process innovations also cover new or significantly improved techniques, equipment, and software in ancillary support activities, such as purchasing, accounting, com-puting, and maintenance (Source: OECD/Eurostat). The number of process innovations is reported cumulatively, up to a data collection point set in the post-implementation period.Disaggregation: By S3 thematic priority areas; by type of processesTarget: As assigned by the applicantDeadline for Achievement: 5 years from the date of project completionMoCV:• Verification: Implementation and post-implementation reports;
supporting evidence• Process: Target assigned during application phase; annual re-
porting during project implementation period; post-implemen-tation reporting and assessment 1, 3 and 5 years after project completion
SSO1.5 Enhanced university-industry collaboration through knowledge transfer and application of research results to the market
PI: Strengthening capacities for research, development and innovation (STRIP) (Owner: Ministry of Science and Education)
output Share of companies that are newcomers to RDI schemes
assessmeNt• Define what is meant by newcomers, i.e., are they enterprises
that had not previously received support through this particular program only or any other programs?
• Establish MoCV to describe information collection and verifi-cation process
AnAlysis of the CroAtiA smArt speCiAlizAtion strAtegy: logiCAl frAmework, instruments, And indiCAtor results 104

output Number of FTE researchers engaged in research organizations
assessmeNt• Standardize the indicator with similar indicators tracking the
number of researchers involved in other programs• Clarify the definition with more information and disaggregates
RevisioNIndicator: Number of full-time equivalent (FTE) researchers involved in project implementationDefinition: The indicator counts researchers that directly carry out research and development activities related to the implementation of the project. Workforce may be existing or new, employed at the beneficiary and partners, or contracted from third parties. Auxiliary staff for R&D activities (jobs that are not directly involved in R&D activities) are not counted. The measurement unit is “Full-time equivalent.” Engagement of researchers employed in the research activities supported by the project less than full-time should be con-verted to the number of FTE employees by dividing the researchers’ scheduled hours by the number of hours in the full-time workweek.Disaggregation: By employment duration (existing researchers, newly employed researchers); by employment origin (researchers employed at the beneficiary/partner institutions, external/contracted, and visiting researchers); by field/academic discipline; by gender; by source of financing of researchers’ salaries (fully or partially support-ed through the grant, institutional funds, other funds); by seniority (PhD students, post-doctoral researchers, senior researchers, oth-er); Out of which: • Vulnerable groups (minorities, migrants, disabled, other disad-
vantaged persons)• Ratio of male to female of researchers employedTarget: As assigned by the applicantDeadline for Achievement: The date of project completion (final payment disbursement)MoCV:• Verification: Implementation reports describing the researchers’
involvement in project implementation; supporting evidence (employment contracts, timesheets)
• Process: Target assigned during application phase; progress tracked through annual project implementation reports, as-sessment at approval of final implementation report and final payment disbursement of individual projects
aPPEndix 105

output Number of FTE researchers engaged in private companies
assessmeNt• Standardize the indicator with similar indicators tracking the
number of researchers involved in other programs• Clarify the definition with more information and disaggregates
RevisioNIndicator: Number of full-time equivalent (FTE) researchers involved in project implementationDefinition: The indicator counts researchers that directly carry out research and development activities related to the implementation of the project. Workforce may be existing or new, employed at the beneficiary and partners, or contracted from third parties. Auxiliary staff for R&D activities (jobs that are not directly involved in R&D activities) are not counted. The measurement unit is “Full-time equivalent.” Engagement of researchers employed in the research activities supported by the project less than full-time should be con-verted to the number of FTE employees by dividing the researchers’ scheduled hours by the number of hours in the full-time workweek.Disaggregation: By employment duration (existing researchers, newly employed researchers); by employment origin (researchers employed at the beneficiary/partner institutions, external/contracted, and visiting researchers); by field/academic discipline; by gender; by source of financing of researchers’ salaries (fully or partially support-ed through the grant, institutional funds, other funds); by seniority (PhD students, post-doctoral researchers, senior researchers, oth-er); Out of which: • Vulnerable groups (minorities, migrants, disabled, other disad-
vantaged persons)• Ratio of male to female of researchers employedTarget: As assigned by the applicantDeadline for Achievement: The date of project completion (final payment disbursement)MoCV: • Verification: Implementation reports describing the researchers’
involvement in project implementation; supporting evidence (employment contracts, timesheets)
• Process: Target assigned during application phase; progress tracked through annual project implementation reports, as-sessment at approval of final implementation report and final payment disbursement of individual projects
AnAlysis of the CroAtiA smArt speCiAlizAtion strAtegy: logiCAl frAmework, instruments, And indiCAtor results 106

output Number of collaborative projects conducted
assessmeNt• Harmonize the indicator with other projects that also support
collaborative approach to project implementation• Define the indicator further to improve clarity on what indica-
tor measures• Add disaggregation to capture different characteristics of the
project
RevisioNIndicator: Number of collaborative research projects supportedDefinition: The indicator refers to the number of collaborative R&D projects conducted by grantees with the grant awarded under the program. This indicator will capture only completed projects, which are defined as those having approval of the grantee’s final project implementation report and grantee receiving the final payment. For monitoring purposes, the indicator should track the projects that are contracted, ongoing, and completed.Disaggregation: By project status (awarded/ongoing, completed); by project results (projects that achieved their objectives, projects with objectives partially achieved, projects that were discontinued due to irregularities or other reasons); by research field; by S3 thematic priority areas; by region; by novelty of collaboration (new, existing); by perception of quality of collaboration (satisfaction); by partner origin (Croatian, foreign)Target: As set by the programDeadline for Achievement: The date of project completion (final payment disbursement)MoCV: • Verification: Grant contract; approved requests for reimburse-
ments; decision on final payment • Process: Target assigned during application phase; progress
tracked through annual project implementation reports; as-sessment at approval of final implementation report and final payment disbursement of individual projects. Beneficiaries are not required to report on this indicator during project implemen-tation because it is tracked by the program managers based on the implementation status of particular projects (projects in implementation phase and projects completed).
aPPEndix 107

output Number of enterprises supported cooperating with research institutions
assessmeNt• Revise definition slightly for clarity and to harmonize measure-
ment details across indicators and programs• Add disaggregation to provide details on collaboration supported
and S3 thematic priority areas covered• Revise MoCV to harmonize across indicators
RevisioNDefinition: The indicator counts the number of enterprises col-laborating with research organizations on R&D projects supported through the program. At least one enterprise and one research or-ganization must collaborate on the project. The collaboration may be new or a continuation of existing collaboration and must last at least as long as the project. All enterprises participating in the proj-ect as partners are counted as contributing to the indicator. Double counting is avoided, meaning a single enterprise is counted only once regardless of the number of projects it is participating in.Disaggregation: By research field; by S3 thematic priority areas; by region; by novelty of collaboration (new, existing); by perception of quality of collaboration (satisfaction)Target: As set by the programDeadline for Achievement: The date of project completion (final payment disbursement)MoCV:• Verification: Grant contract; partnership agreements; ap-
proved requests for reimbursements; decision on final payment disbursement
• Process: Target assigned during application phase; progress tracked through quarterly project implementation reports; as-sessment at approval of final implementation report and final payment disbursement of individual projects
AnAlysis of the CroAtiA smArt speCiAlizAtion strAtegy: logiCAl frAmework, instruments, And indiCAtor results 108

output Private investment matching public support in innovation or R&D projects
assessmeNt• Revise indicator and definition to explicitly refer to the value of pri-
vate investment and to standardize wording with other indicators• Add disaggregation to enable further analysis of S3 thematic
priority areas
RevisioNIndicator: Value of private investment matching public support in RDI projectsDefinition: This indicator measures the total value of private con-tribution in supported RDI projects, including non-eligible parts of the project. The amount is an addition to the public funds received from the program. The amount is calculated by subtracting the public funds (including the grant value and other contributions from public sources, if applicable) from the total project value (including eligible and non-eligible project costs).Disaggregation: By industry; by S3 thematic priority area; by domes-tic vs. foreign investmentsTarget: As assigned by the applicantDeadline for Achievement: The date of project completion (final payment disbursement)MoCV:• Verification: Grant contract, approved requests for reimburse-
ments, decision on final payment; signed statement declaring the value of own investments of enterprises through ineligible costs
• Process: Target assigned during application phase; progress tracked through implementation reports, assessment at approval of final implementation report and final payment disbursement of individual projects
aPPEndix 109

outcome Number of job positions in R&D created in enterprises by RDI projects after the end of funded project
assessmeNt• Revise indicator to harmonize across programs and combine
with similar indicators tracked by the project• Revise definition for clarity and to add details on measurement• Add disaggregation to reveal the demographics of researchers
hired by the enterprises for R&D work
RevisioNIndicator: Change in employment of researchers in enterprises af-ter project completionDefinition: The indicator measures the change in the gross number of full-time equivalent (FTE) researchers employed in the supported enterprises after project completion. The indicator is calculated as the difference between the number of researchers (FTE) in enterpris-es in the year preceding the submission of the project application (baseline value) and the number of researchers (FTE) up to five years after project completion (target value). Engagement of researchers employed less than full-time should be converted to the number of FTE employees by dividing the researchers’ scheduled hours by the number of hours in the full-time workweek.Disaggregation:• By gender• Out of which: Number of young researchers (research students,
PhD students, early-stage researchers) employed• Out of which: Vulnerable groups (minorities, migrants, disabled,
other disadvantaged persons)Target: As assigned by the applicantDeadline for Achievement: 5 years from the date of project completionMoCV:• Verification: Post-implementation reports; supporting evidence
(employment contracts)• Process: Target assigned during application phase; post-imple-
mentation reporting and assessment after 1, 3 and 5 years from project completion
AnAlysis of the CroAtiA smArt speCiAlizAtion strAtegy: logiCAl frAmework, instruments, And indiCAtor results 110

outcome Number of collaborative contracted projects between companies and HEIs/PROs after the end of supported projects
assessmeNt• Use a parent indicator “Number of collaborative projects con-
tracted after project completion” that is disaggregated to this indicator, which is defined below:
RevisioNIndicator: Number of collaborative projects contracted after proj-ect completionDefinition: The indicator refers to the number of new collaborative research projects involving the beneficiary of the supported project and at least one other entity and contracted after the end of imple-mentation of the supported project. The beneficiary organization is involved as either the main beneficiary or a partner in the imple-mentation of the new projects contracted.Disaggregation: By collaboration novelty (new, existing); by type of partner (research organization, enterprise, other); by partner origin (domestic, foreign, diaspora); by type of research (basic, applied, ex-perimental development); by science area; by science field; by fund-ing source (national, EU, private, other); by S3 thematic priority areaTarget: As assigned by the applicantDeadline for Achievement: 5 years from the date of project completionMoCV: • Verification: Post-project implementation reports providing in-
formation on project beneficiary and partners, date of contract award, project value and funding source, short description of objectives and activities, links to web pages providing additional information (if applicable)
• Process: Target assigned during application phase; post-im-plementation reporting and assessment 1, 3 and 5 years after project completion
aPPEndix 111

outcome Number of collaborative contracted projects (by beneficiaries in HEIs and PRO) with foreign HEI and PRO institutions
assessmeNt• Use a parent indicator “Number of collaborative projects con-
tracted after project completion” that is disaggregated to this indicator, which is defined below:
RevisioNIndicator: Number of collaborative projects contracted after proj-ect completionDefinition: The indicator refers to the number of new collaborative research projects involving the beneficiary of the supported project and at least one other entity and contracted after the end of imple-mentation of the supported project. The beneficiary organization is involved as either the main beneficiary or a partner in the imple-mentation of the new projects contracted.Disaggregation: By collaboration novelty (new, existing); by type of partner (research organization, enterprise, other); by partner origin (domestic, foreign, diaspora); by type of research (basic, applied, ex-perimental development); by science area; by science field; by fund-ing source (national, EU, private, other); by S3 thematic priority areaTarget: As assigned by the applicantDeadline for Achievement: 5 years from the date of project completionMoCV: • Verification: Post-project implementation reports providing in-
formation on project beneficiary and partners, date of contract award, project value and funding source, short description of objectives and activities, links to web pages providing additional information (if applicable)
• Process: Target assigned during application phase; post-im-plementation reporting and assessment 1, 3 and 5 years after project completion
outcome Number of joint publications (between PRO beneficiary and industry partner(s))
assessmeNt• Standardize this indicator with existing indicator “Number of sci-
entific publications published in scientific journals and indexed in ‘Web of Science’” but with added distinction of whether the publication was a done jointly between PRO beneficiary and industry partner(s). In the mentioned indicator, one suggestion would be to add the following disaggregation: “Out of which: Number of joint publications with industry partners”
AnAlysis of the CroAtiA smArt speCiAlizAtion strAtegy: logiCAl frAmework, instruments, And indiCAtor results 112

outcome Number of Scientific publications published in the journals indexed in the Web of Science Core Collection
assessmeNt• Indicator can be broadened to capture all scientific publications
indexed in the Web of Science, providing the ability to disaggre-gate by proxy measures of “quality” of the articles using journal ranks, number of citations, etc. as suggested in the revision below
• Use as a parent indicator for other indicators tracking publica-tions (e.g., publications in top journals, or co-authored with the private sector)
• Optional measures can be used to track additional features of such publications
RevisioNIndicator: Number of scientific publications published in scientific journals and indexed in “Web of Science”Definition: Scientific papers are written and published reports describing original research results with the aim of informing the scientific community and the society as a whole about scientific discoveries. Scientific papers indexed on the Web of Science (Core Collection) platform include articles, reviews, proceedings, letters, and chapters in books. Disaggregation: By rank of journal where publication was published (first and second-quartile journals, other); by scientific areas; by scientific fields; by S3 priority areas; out of which: number of joint publications with industry partnersTarget: As assigned by the applicantDeadline for Achievement: 5 years from the date of project completionOptional Measures:• Number of citations received by publications supported by the
program• Change in h-index of organizations supported• Time needed for the publication to get first citation• Number of other publications resulting from the project activ-
ities (Definition: other publications refer to those publications that were not indexed in “Web of Science”)
MoCV: • Verification: Implementation and post-implementation reports
containing list of publications and DOIs; source verification in Web of Science (Core Collection)
• Process: Data to be collected in year 1, 3, and 5 after project completion. Target for each recipient and program of the fund-ing should be set in the application and contract based on the feasibility and likelihood of publications during and after the project period.
aPPEndix 113

outcome Number of new innovative products/services/processes/technologies
assessmeNt• The indicator could be split into two indicators that measure
product and process innovations separately• The indicator definitions could be standardized (with the OECD/
Eurostat definition) and harmonized with similar indicators as shown below.
RevisioN1) Indicator: Number of product innovations introducedDefinition: The indicator measures the number of new product innovations introduced by supported entities during and after the project implementation period. A product innovation is the intro-duction of a good or service that is new or significantly improved with respect to its characteristics or intended uses. This includes significant improvements in technical specifications, components and materials, incorporated software, user friendliness, or other functional characteristics. Product innovations can utilize new knowledge or technologies or can be based on new uses or combi-nations of existing knowledge or technologies. The term “product” is used to cover both goods and services. Product innovations include both the introduction of new goods and services and significant improvements in the functional or user characteristics of existing goods and services (Source: OECD/Eurostat). The number of product innovations is reported cumulatively, up to a data collection point set in the post-implementation period.Disaggregation: By S3 thematic priority areas; by industry; by mar-ket (domestic, international); by type (goods, services); by novelty (new, improved)Out of which: Number of “new-to-market” product innovations intro-duced (Note: A product is considered “new-to-market” if there is no other product available on the national market that offers the same functionality or if the new product uses technology that is signifi-cantly different from the technology of existing products. Potential product novelty is determined in the phase of assessment of project proposals submitted and verified when the product is developed.)Target: As assigned by the applicantDeadline for Achievement: 5 years from the date of project completionMoCV:• Verification: Implementation and post-implementation reports;
supporting evidence• Process: Target assigned during application phase; assessment
at project completion; post-implementation reporting and as-sessment 1, 3 and 5 years after project completion
AnAlysis of the CroAtiA smArt speCiAlizAtion strAtegy: logiCAl frAmework, instruments, And indiCAtor results 114

2) Indicator: Number of process innovations introducedDefinition: The indicator measures the number of new process in-novations introduced by supported entities during and after project completion. A process innovation is the implementation of a new or significantly improved production or delivery method. This includes significant changes in techniques, equipment, or software. Process innovations can be intended to decrease unit costs of production or delivery, to increase quality, or to produce or deliver new or signifi-cantly improved products. Process innovations include new or signifi-cantly improved methods for the creation and provision of services. They can involve significant changes in the equipment and software used in services-oriented firms or in the procedures or techniques that are employed to deliver services. Process innovations also cover new or significantly improved techniques, equipment, and software in ancillary support activities, such as purchasing, accounting, com-puting, and maintenance (Source: OECD/Eurostat). The number of process innovations is reported cumulatively, up to a data collection point set in the post-implementation period.Disaggregation: By S3 thematic priority areas; by type of processesTarget: As assigned by the applicantDeadline for Achievement: 5 years from the date of project completionMoCV:• Verification: Implementation and post-implementation reports;
supporting evidence• Process: Target assigned during application phase; annual re-
porting during project implementation period; post-implemen-tation reporting and assessment 1, 3 and 5 years after project completion
aPPEndix 115

outcome Number of commercialization and technology transfer agreements
assessmeNt• Combine and revise indicator to a parent indicator to enable ag-
gregation of different types of technology transfer models realized while still enabling disaggregated measurement of individual models such as the one measured by this indicator
RevisioNIndicator: Number of technology transfer models realized due to project implementationDefinition: The indicator refers to transfers of research results (knowledge and technology) realized due to project implementa-tion with the purpose of their further development or their use in development and commercialization of new products (goods or services). Project results can be transferred from project beneficiary or partners to third parties in the form of signed R&D agreements or contracts and intellectual property (IP) licensing agreements, or the transfer can be realized through establishment of new enterprises. More specifically, the following are the types of technology transfer models captured (and disaggregated) by the indicator:• Number of new start-ups/spin-offs/spin-outs originating out of
supported projects: Number of new enterprises (start-up/spin-off/spin-out) established by project beneficiary or project part-ners as a result of funded project. A start-up is an enterprise less than 3 years old. Spin-off is an enterprise that has been started by a University group, but which has never left the university environment and perhaps exists to offer specialist consultancy services without the intention for any further expansion or full technology transfer. Spin-out is an enterprise in which the uni-versity or institute has an equity stake.
• Number of licensing agreements signed with the industry: The licensing agreement is a contract to be used by enterprises for technology transfer through granting rights of industrial owner-ship (license of patents and trademarks).
• Number of other technology transfer agreements signed with the industry: Any other forms of technology transfer or commer-cialization agreements signed with the enterprises.
• Number of contract research agreements with the industry.Disaggregation: By models of technology transfer (as listed in the definition)Target: As assigned by the applicantDeadline for Achievement: 5 years from the date of project completionMoCV:• Verification: Implementation and post-implementation reports;
supporting evidence (copies of contracts signed, formal docu-mentation on establishment of an enterprise, etc.)
• Process: Target assigned during application phase; annual report-ing during project implementation period; post-implementation reporting and assessment 1 and 3 years after project completion
AnAlysis of the CroAtiA smArt speCiAlizAtion strAtegy: logiCAl frAmework, instruments, And indiCAtor results 116
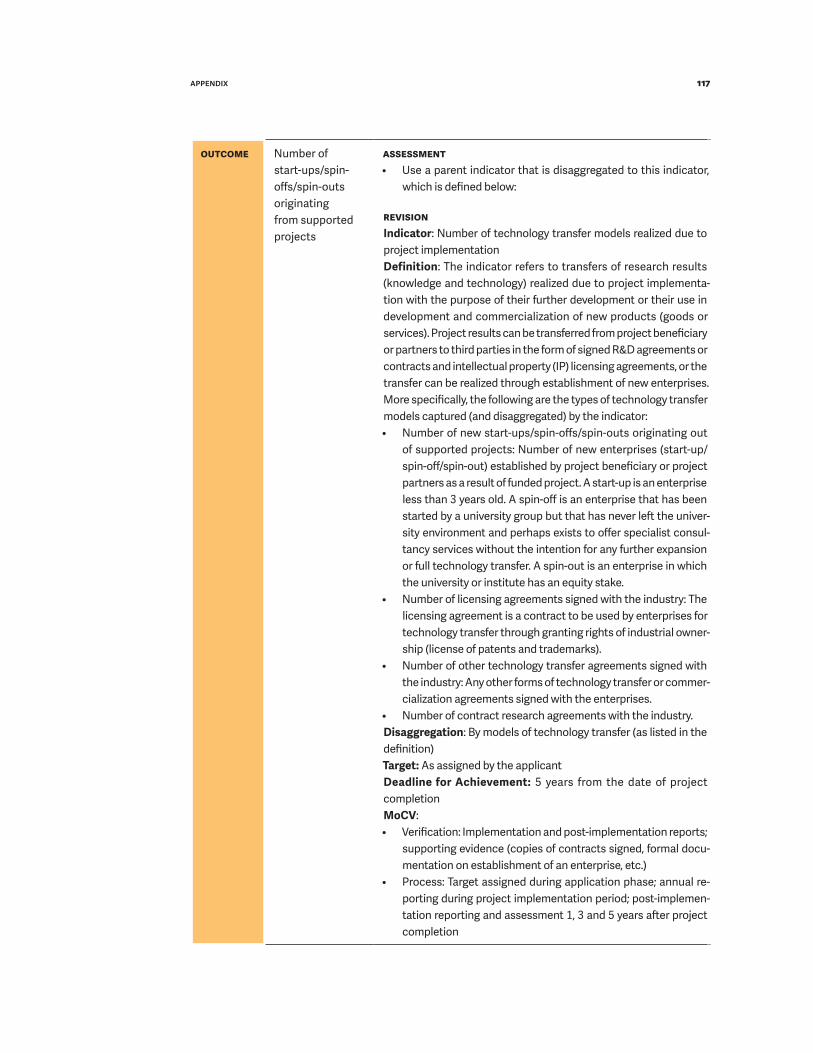
outcome Number of start-ups/spin-offs/spin-outs originating from supported projects
assessmeNt• Use a parent indicator that is disaggregated to this indicator,
which is defined below:
RevisioNIndicator: Number of technology transfer models realized due to project implementationDefinition: The indicator refers to transfers of research results (knowledge and technology) realized due to project implementa-tion with the purpose of their further development or their use in development and commercialization of new products (goods or services). Project results can be transferred from project beneficiary or partners to third parties in the form of signed R&D agreements or contracts and intellectual property (IP) licensing agreements, or the transfer can be realized through establishment of new enterprises. More specifically, the following are the types of technology transfer models captured (and disaggregated) by the indicator:• Number of new start-ups/spin-offs/spin-outs originating out
of supported projects: Number of new enterprises (start-up/spin-off/spin-out) established by project beneficiary or project partners as a result of funded project. A start-up is an enterprise less than 3 years old. A spin-off is an enterprise that has been started by a university group but that has never left the univer-sity environment and perhaps exists to offer specialist consul-tancy services without the intention for any further expansion or full technology transfer. A spin-out is an enterprise in which the university or institute has an equity stake.
• Number of licensing agreements signed with the industry: The licensing agreement is a contract to be used by enterprises for technology transfer through granting rights of industrial owner-ship (license of patents and trademarks).
• Number of other technology transfer agreements signed with the industry: Any other forms of technology transfer or commer-cialization agreements signed with the enterprises.
• Number of contract research agreements with the industry.Disaggregation: By models of technology transfer (as listed in the definition)Target: As assigned by the applicantDeadline for Achievement: 5 years from the date of project completionMoCV:• Verification: Implementation and post-implementation reports;
supporting evidence (copies of contracts signed, formal docu-mentation on establishment of an enterprise, etc.)
• Process: Target assigned during application phase; annual re-porting during project implementation period; post-implemen-tation reporting and assessment 1, 3 and 5 years after project completion
aPPEndix 117

outcome Number of IP applications filed
assessmeNt• The indicator could be standardized with other indicators using
the indicator and definition described below, including disaggre-gation of filed and registered applications, because timeframe may vary based on the policy instruments’ support intensity or approach
RevisioNIndicator: Number of IPR applications filed Definition: Indicator refers to the number of IPR applications (in-cluding patents, trademarks, industrial designs, etc.) filed by the project beneficiary and partners involved in project implementation as a result of the research activities conducted in the scope of the financed project. Applicant should state the expected number of IPR applications in the project application. In the post-implemen-tation reporting phase, applicant should provide a description of a clear link between the conducted research activities and the IPR protection filed.Disaggregation: By type of IPR (patents, industrial design, trade-marks); by application status (filed, registered/approved); by type of procedure (national, international)Target: At least 1 per projectDeadline for Achievement: 5 years from the date of project completionOptional Measures:• •Numberof“patentabilitystudies”conductedtoverifyandpro-
tect IP of project results (by outcome: project result patentable/not patentable)
MoCV:• Verification: Implementation and post-implementation reports;
supporting evidence (documentation verifying the IPR applica-tion and its status)
• Process: Target assigned during application phase; annual re-porting during project implementation period; post-implemen-tation reporting and assessment 1, 3 and 5 years after project completion
outcome Number of IP applications registered
assessmeNt• The indicator could be standardized with other indicators and
used as a disaggregate of “Number of IPR applications filed”
AnAlysis of the CroAtiA smArt speCiAlizAtion strAtegy: logiCAl frAmework, instruments, And indiCAtor results 118

outcome Total contracted amount of RDI funding from centralized EU funds (attracted by beneficiaries)
assessmeNt• Use a parent indicator “Value of R&D finance contracted from all
sources after project completion” that is disaggregated to this indicator, which is defined below:
RevisioNIndicator: Value of R&D finance contracted from all sources after project completionDefinition: Value of funds allocated to research and innovation proj-ects acquired through competitive procedures, e.g., national and centralized EU-level funding programs, or contracted from private sector. Funds should be acquired by project beneficiary after the end of the support and should have a clear purpose of conducting R&D activities or strengthening capacities for R&D (such as financ-ing equipment purchase).Disaggregation: By type of research (basic, applied, experimental development); by research field; by S3 thematic priority areas; by region; by funding source (national, EU, private, other)Target: As assigned by the applicantDeadline for Achievement: 5 years from the date of project completion• MoCV: • Verification: Post-implementation reports, providing information
on date of contract award, project value and funding source, short description of planned objectives and activities, S3 alignment, links to web pages providing additional information (if applicable)
• Process: Target assigned during application phase; post-imple-mentation reporting/assessment 1, 3 and 5 years after project completion
aPPEndix 119

outcome Total contracted amount of RDI funding from national funds (attracted by beneficiaries)
assessmeNt• Use a parent indicator “Value of R&D finance contracted from all
sources after project completion” that is disaggregated to this indicator, which is defined below:
RevisioNIndicator: Value of R&D finance contracted from all sources after project completionDefinition: Value of funds allocated to research and innovation proj-ects acquired through competitive procedures, e.g., national and centralized EU-level funding programs, or contracted from private sector. Funds should be acquired by project beneficiary after the end of the support and should have a clear purpose of conducting R&D activities or strengthening capacities for R&D (such as financ-ing equipment purchase).Disaggregation: By type of research (basic, applied, experimental development); by research field; by S3 thematic priority areas; by region; by funding source (national, EU, private, other)Target: As assigned by the applicantDeadline for Achievement: 5 years from the date of project completionMoCV: • Verification: Post-implementation reports, providing information
on date of contract award, project value and funding source, short description of planned objectives and activities, S3 alignment, links to web pages providing additional information (if applicable)
• Process: Target assigned during application phase; post-imple-mentation reporting/assessment 1, 3 and 5 years after project completion
AnAlysis of the CroAtiA smArt speCiAlizAtion strAtegy: logiCAl frAmework, instruments, And indiCAtor results 120

outcome Total contracted amount of further RDI funding from private sector (attracted by beneficiaries)
assessmeNt• Use a parent indicator “Value of R&D finance contracted from all
sources after project completion” that is disaggregated to this indicator, which is defined below:
RevisioNIndicator: Value of R&D finance contracted from all sources after project completionDefinition: Value of funds allocated to research and innovation proj-ects acquired through competitive procedures, e.g., national and centralized EU-level funding programs, or contracted from private sector. Funds should be acquired by project beneficiary after the end of the support and should have a clear purpose of conducting R&D activities or strengthening capacities for R&D (such as financ-ing equipment purchase).Disaggregation: By type of research (basic, applied, experimental development); by research field; by S3 thematic priority areas; by region; by funding source (national, EU, private, other)Target: As assigned by the applicantDeadline for Achievement: 5 years from the date of project completionMoCV: • Verification: Post-implementation reports, providing information
on date of contract award, project value and funding source, short description of planned objectives and activities, S3 alignment, links to web pages providing additional information (if applicable)
• Process: Target assigned during application phase; post-imple-mentation reporting/assessment 1, 3 and 5 years after project completion
aPPEndix 121

specific objective 2: oveRcomiNg the fRagmeNtatioN of iNNovatioN value chaiN aNd the gap betweeN ReseaRch aNd busiNess sectoR
SSO2.1: Strengthening links between scientific and business sector
PIs: • Supporting development of Competence Centers• Transfer of technology from research organizations to business sector• Research infrastructure usage and researchers’ services for SMEs (STPII IRCRO program)(Owners: Ministry of Economy and Sustainable Development, Ministry of Science and Education, HAMAG-BICRO)
output Number of R&D projects supported
assessmeNt• Use as parent indicator combining similar indicators that track
number of projects supported and introduce disaggregate measures
AnAlysis of the CroAtiA smArt speCiAlizAtion strAtegy: logiCAl frAmework, instruments, And indiCAtor results 122
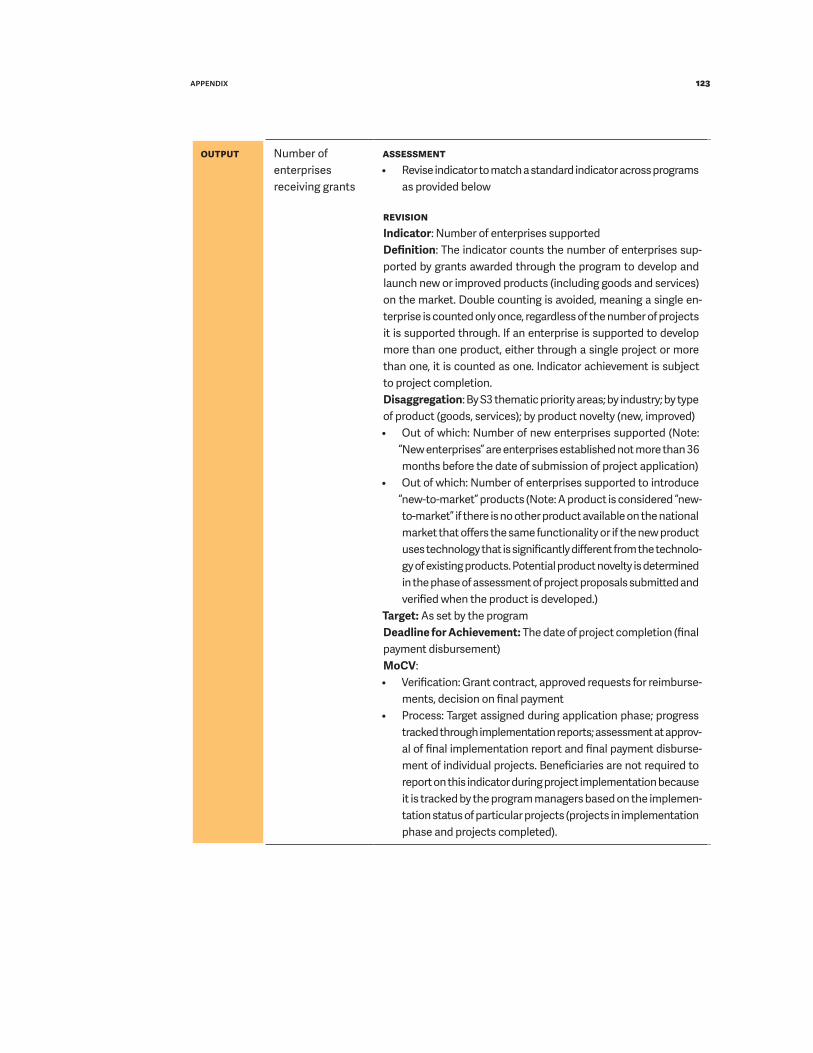
output Number of enterprises receiving grants
assessmeNt• Revise indicator to match a standard indicator across programs
as provided below
RevisioNIndicator: Number of enterprises supportedDefinition: The indicator counts the number of enterprises sup-ported by grants awarded through the program to develop and launch new or improved products (including goods and services) on the market. Double counting is avoided, meaning a single en-terprise is counted only once, regardless of the number of projects it is supported through. If an enterprise is supported to develop more than one product, either through a single project or more than one, it is counted as one. Indicator achievement is subject to project completion.Disaggregation: By S3 thematic priority areas; by industry; by type of product (goods, services); by product novelty (new, improved)• Out of which: Number of new enterprises supported (Note:
“New enterprises” are enterprises established not more than 36 months before the date of submission of project application)
• Out of which: Number of enterprises supported to introduce “new-to-market” products (Note: A product is considered “new-to-market” if there is no other product available on the national market that offers the same functionality or if the new product uses technology that is significantly different from the technolo-gy of existing products. Potential product novelty is determined in the phase of assessment of project proposals submitted and verified when the product is developed.)
Target: As set by the programDeadline for Achievement: The date of project completion (final payment disbursement)MoCV:• Verification: Grant contract, approved requests for reimburse-
ments, decision on final payment• Process: Target assigned during application phase; progress
tracked through implementation reports; assessment at approv-al of final implementation report and final payment disburse-ment of individual projects. Beneficiaries are not required to report on this indicator during project implementation because it is tracked by the program managers based on the implemen-tation status of particular projects (projects in implementation phase and projects completed).
aPPEndix 123

output Number of enterprises supported to introduce new to the market products
assessmeNt• Combine similar indicators into a single indicator counting the
enterprises supported through the program• Revise definition for clarity and to harmonize measurement
details across indicators and programs• Add disaggregation to provide details on type and novelty of
products developed, new enterprises supported, enterprises supported to develop new-to-market products, and S3 the-matic priority areas covered
• Revise MoCV to harmonize across indicators
RevisioNIndicator: Number of enterprises supportedDefinition: The indicator counts the number of enterprises sup-ported by grants awarded through the program to develop and launch new or improved products (including goods and services) on the market. Double counting is avoided, meaning a single en-terprise is counted only once, regardless of the number of projects it is supported through. If an enterprise is supported to develop more than one product, either through a single project or more than one, it is counted as one. Indicator achievement is subject to project completion.Disaggregation: By S3 thematic priority areas; by industry; by type of product (goods, services); by product novelty (new, improved) • Out of which: Number of new enterprises supported (Note:
“New enterprises” are enterprises established not more than 36 months before the date of submission of project application)
• Out of which: Number of enterprises supported to introduce “new-to-market” products (Note: A product is considered “new-to-market” if there is no other product available on the national market that offers the same functionality or if the new product uses technology that is significantly different from the technolo-gy of existing products. Potential product novelty is determined in the phase of assessment of project proposals submitted and verified when the product is developed.)
Target: As set by the programDeadline for Achievement: The date of project completion (final payment disbursement)MoCV:• Verification: Grant contract, approved requests for reimburse-
ments, decision on final payment• Process: Target assigned during application phase; progress
tracked through implementation reports; assessment at approv-al of final implementation report of individual projects. Benefi-ciaries are not required to report on this indicator during project implementation because it is tracked by the program manag-ers based on the implementation status of particular projects (projects in implementation phase and projects completed).
AnAlysis of the CroAtiA smArt speCiAlizAtion strAtegy: logiCAl frAmework, instruments, And indiCAtor results 124

output Number of enterprises supported to introduce new to the firm products
assessmeNt• Combine similar indicators into a single indicator counting the
enterprises supported through the program• Revise definition for clarity and to harmonize measurement
details across indicators and programs• Add disaggregation to provide details on type and novelty of
products developed, new enterprises supported, enterprises supported to develop new-to-market products, and S3 the-matic priority areas covered
• Revise MoCV to harmonize across indicators
RevisioNIndicator: Number of enterprises supportedDefinition: The indicator counts the number of enterprises sup-ported by grants awarded through the program to develop and launch new or improved products (including goods and services) on the market. Double counting is avoided, meaning a single en-terprise is counted only once, regardless of the number of projects it is supported through. If an enterprise is supported to develop more than one product, either through a single project or more than one, it is counted as one. Indicator achievement is subject to project completion.Disaggregation: By S3 thematic priority areas; by industry; by type of product (goods, services); by product novelty (new, improved) • Out of which: Number of new enterprises supported (Note:
“New enterprises” are enterprises established not more than 36 months before the date of submission of project application)
• Out of which: Number of enterprises supported to introduce “new-to-market” products (Note: A product is considered “new-to-market” if there is no other product available on the national market that offers the same functionality or if the new product uses technology that is significantly different from the technolo-gy of existing products. Potential product novelty is determined in the phase of assessment of project proposals submitted and verified when the product is developed.)
Target: As set by the programDeadline for Achievement: The date of project completion (final payment disbursement)MoCV:• Verification: Grant contract, approved requests for reimburse-
ments, decision on final payment• Process: Target assigned during application phase; progress
tracked through implementation reports; assessment at approv-al of final implementation report of individual projects. Benefi-ciaries are not required to report on this indicator during project implementation because it is tracked by the program manag-ers based on the implementation status of particular projects (projects in implementation phase and projects completed).
aPPEndix 125

output Number of enterprises implementing KET
assessmeNt• Track as a disaggregate measure of “Number of enterprises sup-
ported.” In the mentioned indicator, one suggestion would be to add the following disaggregation: “Out of which: Number of enterprises supported to implement Key Enabling Technologies (Note: Key Enabling Technologies refer to micro and nanoelec-tronics, nanotechnology, industrial biotechnology, advanced ma-terials, photonics, and advanced manufacturing technologies)”
output Number of new researchers in supported subjects
assessmeNt• Harmonize with other indicators tracking number of research-
ers involved in project implementation and track the newly employed researchers as a disaggregate measure
• Define indicator further, with slight revision in wording to har-monize with other program indicators
RevisioNIndicator: Number of full-time equivalent (FTE) researchers involved in project implementationDefinition: The indicator counts researchers that directly carry out research and development activities related to the implementation of the project. Workforce may be existing or new, employed at the beneficiary and partners, or contracted from third parties. Auxiliary staff for R&D activities (jobs that are not directly involved in R&D activities) are not counted. The measurement unit is “Full-time equivalent.” Engagement of researchers employed in the research activities supported by the project less than full-time should be con-verted to the number of FTE employees by dividing the researchers’ scheduled hours by the number of hours in the full-time workweek.Disaggregation: By employment duration (existing researchers, newly employed researchers); by employment origin (researchers employed at the beneficiary/partner institutions, external/contract-ed, and visiting researchers); by field/academic discipline; by gen-der; by source of financing of researchers’ salaries (fully or partially supported through the grant, institutional funds, other funds); by seniority (PhD students, post-doctoral researchers, senior research-ers, other); Out of which: • Vulnerable groups (minorities, migrants, disabled, other disad-
vantaged persons)• Ratio of male to female of researchers employedTarget: As assigned by the applicantDeadline for Achievement: The date of project completion (final payment disbursement)MoCV: • Verification: Implementation reports describing the researchers’
involvement in project implementation; supporting evidence (employment contracts, timesheets)
• Process: Target assigned during application phase; progress tracked through annual project implementation reports, as-sessment at approval of final implementation report and final payment disbursement of individual projects
AnAlysis of the CroAtiA smArt speCiAlizAtion strAtegy: logiCAl frAmework, instruments, And indiCAtor results 126

output Number of collaborative projects conducted
assessmeNt• Harmonize the indicator with other projects that also support
collaborative approach to project implementation• Define the indicator further to improve clarity on what indi-
cator measures• Add disaggregation to capture different characteristics of the
project
RevisionIndicator: Number of collaborative research projects supportedDefinition: The indicator refers to the number of collaborative R&D projects conducted by grantees with the grant awarded under the program. This indicator will capture only completed projects, which are defined as those having approval of the grantee’s final project implementation report and grantee receiving the final payment. For monitoring purposes, the indicator should track the projects that are contracted, ongoing, and completed.Disaggregation: By project status (awarded/ongoing, completed); by project results (projects that achieved their objectives, projects with objectives partially achieved, projects that were discontin-ued due to irregularities or other reasons); by research field; by S3 thematic priority areas; by region; by novelty of collaboration (new, existing); by perception of quality of collaboration (satisfaction); by partner origin (Croatian, foreign)Target: As set by the programDeadline for Achievement: The date of project completion (final payment disbursement)MoCV: • Verification: Grant contract; approved requests for reimburse-
ments; decision on final payment • Process: Target assigned during application phase; progress
tracked through annual project implementation reports; as-sessment at approval of final implementation report and final payment disbursement of individual projects. Beneficiaries are not required to report on this indicator during project im-plementation because it is tracked by the program managers based on the implementation status of particular projects (projects in implementation phase and projects completed).
output Number of company-company collaborations within RDI projects
assessmeNt• Use a parent indicator “Number of collaborative research proj-
ects supported” that is disaggregated to this indicator
aPPEndix 127
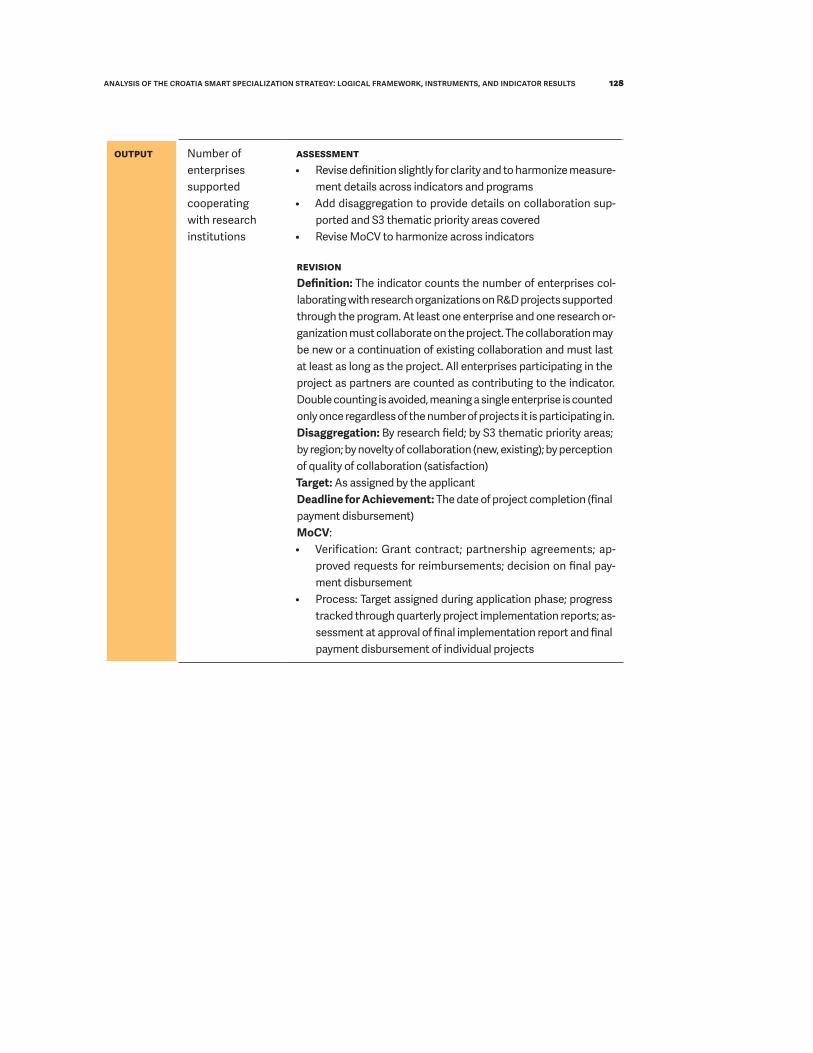
output Number of enterprises supported cooperating with research institutions
assessmeNt• Revise definition slightly for clarity and to harmonize measure-
ment details across indicators and programs• Add disaggregation to provide details on collaboration sup-
ported and S3 thematic priority areas covered• Revise MoCV to harmonize across indicators
RevisioNDefinition: The indicator counts the number of enterprises col-laborating with research organizations on R&D projects supported through the program. At least one enterprise and one research or-ganization must collaborate on the project. The collaboration may be new or a continuation of existing collaboration and must last at least as long as the project. All enterprises participating in the project as partners are counted as contributing to the indicator. Double counting is avoided, meaning a single enterprise is counted only once regardless of the number of projects it is participating in.Disaggregation: By research field; by S3 thematic priority areas; by region; by novelty of collaboration (new, existing); by perception of quality of collaboration (satisfaction)Target: As assigned by the applicantDeadline for Achievement: The date of project completion (final payment disbursement)MoCV:• Verification: Grant contract; partnership agreements; ap-
proved requests for reimbursements; decision on final pay-ment disbursement
• Process: Target assigned during application phase; progress tracked through quarterly project implementation reports; as-sessment at approval of final implementation report and final payment disbursement of individual projects
AnAlysis of the CroAtiA smArt speCiAlizAtion strAtegy: logiCAl frAmework, instruments, And indiCAtor results 128

output Private investment matching public support in innovation or R&D projects
assessmeNt• Revise indicator and definition to explicitly refer to the value
of private investment and to standardize wording with other indicators
• Add disaggregation to enable further analysis of S3 thematic priority areas
RevisioNIndicator: Value of private investment matching public support in RDI projectsDefinition: This indicator measures the total value of private con-tribution in supported RDI projects, including non-eligible parts of the project. The amount is an addition to the public funds received from the program. The amount is calculated by subtracting the public funds (including the grant value and other contributions from public sources, if applicable) from the total project value (in-cluding eligible and non-eligible project costs).Disaggregation: By industry; by S3 thematic priority area; by do-mestic vs foreign investmentsTarget: As assigned by the applicantDeadline for Achievement: The date of project completion (final payment disbursement)MoCV:• Verification: Grant contract, approved requests for reimburse-
ments, decision on final payment; signed statement declaring the value of own investments of enterprises through ineligible costs
• Process: Target assigned during application phase; progress tracked through implementation reports, assessment at ap-proval of final implementation report and final payment dis-bursement of individual projects
aPPEndix 129

output Number of commercialization and technology transfer agreements (signed with industry)
assessmeNt• Combine and revise indicator to a parent indicator to enable
aggregation of different types of technology transfer models realized while still enabling disaggregated measurement of individual models such as the one measured by this indicator
RevisioNIndicator: Number of technology transfer models realized due to project implementationDefinition: The indicator refers to transfers of research results (knowledge and technology) realized due to project implementa-tion with the purpose of their further development or their use in development and commercialization of new products (goods or services). Project results can be transferred from project beneficiary or partners to third parties in the form of signed R&D agreements or contracts and intellectual property (IP) licensing agreements, or the transfer can be realized through establishment of new enter-prises. More specifically, the following are the types of technology transfer models captured (and disaggregated) by the indicator:• Number of new start-ups/spin-offs/spin-outs originating out
of supported projects: Number of new enterprises (start-up/spin-off/spin-out) established by project beneficiary or project partners as a result of funded project. A start-up is an enter-prise less than 3 years old. A spin-off is an enterprise that has been started by a university group but that has never left the university environment and perhaps exists to offer specialist consultancy services without the intention for any further ex-pansion or full technology transfer. A spin-out is an enterprise in which the university or institute has an equity stake.
• Number of licensing agreements signed with the industry: The licensing agreement is a contract to be used by enterprises for technology transfer through granting rights of industrial ownership (license of patents and trademarks).
• Number of other technology transfer agreements signed with the industry: Any other forms of technology transfer or com-mercialization agreements signed with the enterprises.
• Number of contract research agreements with the industry.Disaggregation: By models of technology transfer (as listed in the definition)Target: As assigned by the applicantDeadline for Achievement: The date of project completion (final payment disbursement)MoCV:• Verification: Implementation and post-implementation reports;
supporting evidence (copies of contracts signed, formal docu-mentation on establishment of an enterprise, etc.)
• Process: Target assigned during application phase; annual reporting during project implementation period; post-imple-mentation reporting and assessment 1 and 3 years after proj-ect completion
AnAlysis of the CroAtiA smArt speCiAlizAtion strAtegy: logiCAl frAmework, instruments, And indiCAtor results 130

output Share of companies that are newcomers to RDI schemes
assessmeNt• Define what is meant by newcomers, i.e., are they enterprises
that had not previously received support through this partic-ular program only or any other programs?
• Establish MoCV to describe information collection and veri-fication process
output Number of FTE researchers engaged in private companies
assessmeNt• Standardize the indicator with similar indicators tracking the
number of researchers involved in other programs• Clarify the definition with more information and disaggregates
RevisioNIndicator: Number of full-time equivalent (FTE) researchers in-volved in project implementationDefinition: The indicator counts researchers that directly carry out research and development activities related to the implementa-tion of the project. Workforce may be existing or new, employed at the beneficiary and partners, or contracted from third parties. Auxiliary staff for R&D activities (jobs that are not directly involved in R&D activities) are not counted. The measurement unit is “Full-time equivalent.” Engagement of researchers employed in the research activities supported by the project less than full-time should be converted to the number of FTE employees by dividing the researchers’ scheduled hours by the number of hours in the full-time workweek.Disaggregation: By employment duration (existing researchers, newly employed researchers); by employment origin (researchers employed at the beneficiary/partner institutions, external/con-tracted, and visiting researchers); by field/academic discipline; by gender; by source of financing of researchers’ salaries (fully or partially supported through the grant, institutional funds, other funds); by seniority (PhD students, post-doctoral researchers, se-nior researchers, other); Out of which: • Vulnerable groups (minorities, migrants, disabled, other dis-
advantaged persons)• Ratio of male to female of researchers employedTarget: As assigned by the applicantDeadline for Achievement: The date of project completion (final payment disbursement)MoCV: • Verification: Implementation reports describing the researchers’
involvement in project implementation; supporting evidence (employment contracts, timesheets)
• Process: Target assigned during application phase; progress tracked through annual project implementation reports, as-sessment at approval of final implementation report and final payment disbursement of individual projects
aPPEndix 131

outcome Number of job positions in R&D created in ROs by RDI projects after the end of funded project
assessmeNt• Standardize the indicator with similar indicator used in other
programs• Clarify the definition with more information and disaggregates
outcome Number of collaborative contracted projects between companies and HEIs/PROs after the end of supported projects
assessmeNt• Use a parent indicator “Number of collaborative projects con-
tracted after project completion” that is disaggregated to this indicator, which is defined below:
RevisioNIndicator: Number of collaborative projects contracted after proj-ect completionDefinition: The indicator refers to the number of new collabora-tive research projects involving the beneficiary of the supported project and at least one other entity and contracted after the end of implementation of the supported project. The beneficiary orga-nization is involved as either the main beneficiary or a partner in the implementation of the new projects contracted.Disaggregation: By collaboration novelty (new, existing); by type of partner (research organization, enterprise, other); by partner origin (domestic, foreign, diaspora); by type of research (basic, applied, experimental development); by science area; by science field; by funding source (national, EU, private, other); by S3 the-matic priority areaTarget: As assigned by the applicantDeadline for Achievement: 5 years from the date of project completionMoCV: • Verification: Post-project implementation reports providing
information on project beneficiary and partners, date of con-tract award, project value and funding source, short descrip-tion of objectives and activities, links to web pages providing additional information (if applicable)
• Process: Target assigned during application phase; post-im-plementation reporting and assessment 1, 3 and 5 years after project completion
AnAlysis of the CroAtiA smArt speCiAlizAtion strAtegy: logiCAl frAmework, instruments, And indiCAtor results 132

outcome Number of new innovative products/services/processes/technologies
assessmeNt• The indicator could be split into two indicators that measure
product and process innovations separately• The indicator definitions could be standardized (with the OECD/
Eurostat definition) and harmonized with similar indicators as shown below.
RevisioN1) Indicator: Number of product innovations introducedDefinition: The indicator measures the number of new product innovations introduced by supported entities during and after the project implementation period. A product innovation is the intro-duction of a good or service that is new or significantly improved with respect to its characteristics or intended uses. This includes significant improvements in technical specifications, components and materials, incorporated software, user friendliness, or other functional characteristics. Product innovations can utilize new knowledge or technologies or can be based on new uses or com-binations of existing knowledge or technologies. The term “prod-uct” is used to cover both goods and services. Product innovations include both the introduction of new goods and services and sig-nificant improvements in the functional or user characteristics of existing goods and services (Source: OECD/Eurostat). The number of product innovations is reported cumulatively, up to a data col-lection point set in the post-implementation period.Disaggregation: By S3 thematic priority areas; by industry; by mar-ket (domestic, international); by type (goods, services); by novelty (new, improved)• Out of which: Number of “new-to-market” product innovations
introduced (Note: A product is considered “new-to-market” if there is no other product available on the national market that offers the same functionality or if the new product uses technology that is significantly different from the technology of existing products. Potential product novelty is determined in the phase of assessment of project proposals submitted and verified when the product is developed.)
Target: As assigned by the applicantDeadline for Achievement: 5 years from the date of project completionMoCV:• Verification: Implementation and post-implementation reports;
supporting evidence• Process: Target assigned during application phase; assessment
at project completion; post-implementation reporting and as-sessment 1, 3 and 5 years after project completion
aPPEndix 133

2) Indicator: Number of process innovations introducedDefinition: The indicator measures the number of new process innovations introduced by supported entities during and after project completion. A process innovation is the implementation of a new or significantly improved production or delivery method. This includes significant changes in techniques, equipment, or software. Process innovations can be intended to decrease unit costs of production or delivery, to increase quality, or to produce or deliver new or significantly improved products. Process inno-vations include new or significantly improved methods for the creation and provision of services. They can involve significant changes in the equipment and software used in services-oriented firms or in the procedures or techniques that are employed to de-liver services. Process innovations also cover new or significantly improved techniques, equipment, and software in ancillary sup-port activities, such as purchasing, accounting, computing, and maintenance (Source: OECD/Eurostat). The number of process innovations is reported cumulatively, up to a data collection point set in the post-implementation period.Disaggregation: By S3 thematic priority areas; by type of processesTarget: As assigned by the applicantDeadline for Achievement: 5 years from the date of project completionMoCV:• Verification: Implementation and post-implementation reports;
supporting evidence• Process: Target assigned during application phase; annual
reporting during project implementation period; post-imple-mentation reporting and assessment 1, 3 and 5 years after project completion
AnAlysis of the CroAtiA smArt speCiAlizAtion strAtegy: logiCAl frAmework, instruments, And indiCAtor results 134

outcome Number of commercialization and technology transfer agreements
assessmeNt• Combine and revise indicator to a parent indicator to enable
aggregation of different types of technology transfer models realized while still enabling disaggregated measurement of individual models such as the one measured by this indicator
RevisioNIndicator: Number of technology transfer models realized due to project implementationDefinition: The indicator refers to transfers of research results (knowledge and technology) realized due to project implementa-tion with the purpose of their further development or their use in development and commercialization of new products (goods or services). Project results can be transferred from project beneficiary or partners to third parties in the form of signed R&D agreements or contracts and intellectual property (IP) licensing agreements, or the transfer can be realized through establishment of new enter-prises. More specifically, the following are the types of technology transfer models captured (and disaggregated) by the indicator:• Number of new start-ups/spin-offs/spin-outs originating out
of supported projects: Number of new enterprises (start-up/spin-off/spin-out) established by project beneficiary or project partners as a result of funded project. A start-up is an enter-prise less than 3 years old. A spin-off is an enterprise that has been started by a university group but that has never left the university environment and perhaps exists to offer specialist consultancy services without the intention for any further ex-pansion or full technology transfer. A spin-out is an enterprise in which the university or institute has an equity stake.
• Number of licensing agreements signed with the industry: The licensing agreement is a contract to be used by enterprises for technology transfer through granting rights of industrial ownership (license of patents and trademarks).
• Number of other technology transfer agreements signed with the industry: Any other forms of technology transfer or com-mercialization agreements signed with the enterprises.
• Number of contract research agreements with the industry.Disaggregation: By models of technology transfer (as listed in the definition)Target: As assigned by the applicantDeadline for Achievement: 3 years from the date of project completion• MoCV:• Verification: Implementation and post-implementation reports;
supporting evidence (copies of contracts signed, formal docu-mentation on establishment of an enterprise, etc.)
• Process: Target assigned during application phase; annual reporting during project implementation period; post-imple-mentation reporting and assessment 1 and 3 years after proj-ect completion
aPPEndix 135

outcome Number of licensing agreements
assessmeNt• Combine and revise indicator to a parent indicator to enable
aggregation of different types of technology transfer models realized while still enabling disaggregated measurement of individual models such as the one measured by this indicator
RevisioNIndicator: Number of technology transfer models realized due to project implementationDefinition: The indicator refers to transfers of research results (knowledge and technology) realized due to project implementa-tion with the purpose of their further development or their use in development and commercialization of new products (goods or services). Project results can be transferred from project beneficiary or partners to third parties in the form of signed R&D agreements or contracts and intellectual property (IP) licensing agreements, or the transfer can be realized through establishment of new enter-prises. More specifically, the following are the types of technology transfer models captured (and disaggregated) by the indicator:• Number of new start-ups/spin-offs/spin-outs originating out
of supported projects: Number of new enterprises (start-up/spin-off/spin-out) established by project beneficiary or project partners as a result of funded project. A start-up is an enter-prise less than 3 years old. A spin-off is an enterprise that has been started by a university group but that has never left the university environment and perhaps exists to offer specialist consultancy services without the intention for any further ex-pansion or full technology transfer. A spin-out is an enterprise in which the university or institute has an equity stake.
• Number of licensing agreements signed with the industry: The licensing agreement is a contract to be used by enterprises for technology transfer through granting rights of industrial ownership (license of patents and trademarks).
• Number of other technology transfer agreements signed with the industry: Any other forms of technology transfer or com-mercialization agreements signed with the enterprises.
• Number of contract research agreements with the industry.Disaggregation: By models of technology transfer (as listed in the definition)Target: As assigned by the applicantDeadline for Achievement: 3 years from the date of project completionMoCV:• Verification: Implementation and post-implementation reports;
supporting evidence (copies of contracts signed, formal docu-mentation on establishment of an enterprise, etc.)
• Process: Target assigned during application phase; annual reporting during project implementation period; post-imple-mentation reporting and assessment 1 and 3 years after proj-ect completion
AnAlysis of the CroAtiA smArt speCiAlizAtion strAtegy: logiCAl frAmework, instruments, And indiCAtor results 136

outcome Number of start-ups/spin-offs/spin-outs originating from supported projects
assessmeNt• Use a parent indicator that is disaggregated to this indicator,
which is defined below:
Indicator: Number of technology transfer models realized due to project implementationDefinition: The indicator refers to transfers of research results (knowledge and technology) realized due to project implementa-tion with the purpose of their further development or their use in development and commercialization of new products (goods or services). Project results can be transferred from project beneficiary or partners to third parties in the form of signed R&D agreements or contracts and intellectual property (IP) licensing agreements, or the transfer can be realized through establishment of new enter-prises. More specifically, the following are the types of technology transfer models captured (and disaggregated) by the indicator:• Number of new start-ups/spin-offs/spin-outs originating out
of supported projects: Number of new enterprises (start-up/spin-off/spin-out) established by project beneficiary or project partners as a result of funded project. A start-up is an enter-prise less than 3 years old. A spin-off is an enterprise that has been started by a university group but that has never left the university environment and perhaps exists to offer specialist consultancy services without the intention for any further ex-pansion or full technology transfer. A spin-out is an enterprise in which the university or institute has an equity stake.
• Number of licensing agreements signed with the industry: The licensing agreement is a contract to be used by enterprises for technology transfer through granting rights of industrial ownership (license of patents and trademarks).
• Number of other technology transfer agreements signed with the industry: Any other forms of technology transfer or com-mercialization agreements signed with the enterprises.
• Number of contract research agreements with the industry.Disaggregation: By models of technology transfer (as listed in the definition)Target: As assigned by the applicantDeadline for Achievement: 5 years from the date of project completionMoCV:• Verification: Implementation and post-implementation reports;
supporting evidence (copies of contracts signed or formal doc-umentation on establishment of an enterprise, etc.)
• Process: Target assigned during application phase; annual reporting during project implementation period; post-imple-mentation reporting and assessment 1, 3 and 5 years after project completion
aPPEndix 137

outcome Number of IP applications filed
assessmeNt• The indicator could be standardized with other indicators us-
ing the indicator and definition described below, including disaggregation of filed and registered applications, because timeframe may vary based on the policy instruments’ support intensity or approach
RevisioNIndicator: Number of IPR applications filed Definition: Indicator refers to the number of IPR applications (in-cluding patents, trademarks, industrial designs, etc.) by the project beneficiary and partners involved in project implementation as a result of the research activities conducted in the scope of the financed project. Applicant should state the expected number of IPR applications in the project application. In the post-implemen-tation reporting phase, applicant should provide a description of a clear link between the conducted research activities and the IPR protection filed.Disaggregation: By type of IPR (patents, industrial design, trade-marks); by application status (filed, registered/approved); by type of procedure (national, international)Target: At least 1 per projectDeadline for Achievement: 5 years from the date of project completionOptional Measures:• Number of “patentability studies” conducted to verify and
protect IP of project results (by outcome: project result pat-entable/not patentable)
MoCV:• Verification: Implementation and post-implementation reports;
supporting evidence (documentation verifying the IPR appli-cation and its status)
• Process: Target assigned during application phase; annual reporting during project implementation period; post-imple-mentation reporting and assessment 1, 3 and 5 years after project completion
AnAlysis of the CroAtiA smArt speCiAlizAtion strAtegy: logiCAl frAmework, instruments, And indiCAtor results 138

outcome Number of IP applications registered
assessmeNt• The indicator could be standardized with other indicators and
used as a disaggregate of “Number of IPR applications filed”
outcome Total contracted amount of further RDI funding from private sector (attracted by beneficiaries)
assessmeNt• Use a parent indicator “Value of R&D finance contracted from
all sources after project completion” that is disaggregated to this indicator, which is defined below:
RevisioNIndicator: Value of R&D finance contracted from all sources after project completionDefinition: Value of funds allocated to research and innovation projects acquired through competitive procedures, e.g., national and centralized EU-level funding programs, or contracted from private sector. Funds should be acquired by project beneficiary after the end of the support and should have a clear purpose of conducting R&D activities or strengthening capacities for R&D (such as financing equipment purchase).Disaggregation: By type of research (basic, applied, experimental development); by research field; by S3 thematic priority areas; by region; by funding source (national, EU, private, other)Target: As assigned by the applicantDeadline for Achievement: 5 years from the date of project completionMoCV: • Verification: Post-implementation reports, providing infor-
mation on date of contract award, project value and funding source, short description of planned objectives and activities, S3 alignment, links to web pages providing additional infor-mation (if applicable)
• Process: Target assigned during application phase; post-im-plementation reporting/assessment 1, 3 and 5 years after project completion
aPPEndix 139

outcome Sales of new-to-firm innovation (as percentage of turnover)
assessmeNt• Revise indicator for clarity, given that all firm-level innova-
tions are new-to-firm; harmonize terminology across programs (i.e., using the word “revenue” instead of “turnover”) so that it specifies the stated outcome more clearly because the cur-rent indicator does not clearly define all the stated elements; combine two indicators with removal of the new-to-firm and new-to-market distinction in order to enhance clarity and avoid measurement issues
• Revise definition for clarity and use OECD/Eurostat terminol-ogy in order to ensure standardization
• Revise MoCV to harmonize across indicators to enable more efficient data collection and analysis
RevisioNIndicator: Percentage of sales revenue from product innovationsDefinition: The indicator measures the percentage share of total annual revenue from sales that can be attributed to the product innovation resulting from the supported project. A product inno-vation is the introduction of a good or service that is new or sig-nificantly improved with respect to its characteristics or intended uses. This includes significant improvements in technical specifi-cations, components and materials, incorporated software, user friendliness, or other functional characteristics. Product innova-tions can utilize new knowledge or technologies or can be based on new uses or combinations of existing knowledge or technolo-gies. The term “product” is used to cover both goods and services. Product innovations include both the introduction of new goods and services and significant improvements in the functional or user characteristics of existing goods and services.Disaggregation: By S3 thematic priority areas; by industry; by mar-ket (domestic, international); by product type (goods, services); by product novelty (new, improved)Target: As assigned by the applicantDeadline for Achievement: 5 years from the date of project completionMoCV:• Verification: Post-implementation reports; supporting evidence• Process: Target assigned during application phase; post-im-
plementation reporting and assessment after 1, 3 and 5 years from project completion
AnAlysis of the CroAtiA smArt speCiAlizAtion strAtegy: logiCAl frAmework, instruments, And indiCAtor results 140

outcome Number of partnerships with other TTOs
assessmeNt• Revise indicator to specify that the period for achievement is
after project period• Revise definition to expand on the information by defining what
constitutes a “partnership”• Add MoCV to provide more information on process and veri-
fication methods
RevisioNIndicator: Number of partnerships with other TTOs after project completionDefinition: The indicator refers to the number of partnerships formed with other TTOs in Croatia after the project period as a result of its improved capacity and resources to collaborate. Here,
“partnership” refers to any formal collaborative activities organized (such as events) or formal Memorandums of Understanding (MoUs) signed with other TTOs. One-off meetings or visits to other TTOs may not be considered as sustained partnership. The indicator will count partnerships in which some preliminary activities could have begun during the project period, with formal partnership occurring only after the project period. Any partnerships built during the proj-ect period will be counted under the output indicator.Disaggregation: By type of partnership activitiesTarget: As assigned by the applicantDeadline for Achievement: 5 years from the date of project completionMoCV:• Verification: Post-implementation reports; supporting evidence
(copies of MoUs signed, etc.)• Process: Target assigned during application phase; post-im-
plementation reporting and assessment 1, 3 and 5 years after project completion
SSO2.2: Institutional set-up for innovation system
PI: Establishment of Innovation Network for Industry and Thematic innovation Councils (Owner: Ministry of Economy and Sustainable Development);
output Number of companies receiving non-financial support
assessmeNt• Add a definition that specifies what non-financial supports are
to be tracked by the program• Use those specific non-financial support initiatives or measures
as disaggregates to track how many enterprises are being sup-ported through each type of initiative
aPPEndix 141

output Number of Thematic innovation councils established
assessmeNt• Define what is meant by “established,” i.e., approval of the Coun-
cil by a higher body, formulation of the constitution, finalization of members in the Council, etc.
• Establish timeline for achievement, or yearly targets of how many to be established over time
output Number of Innovation web platforms established
assessmeNt• If one platform is expected to be established; this indicator
can be set as a binary indicator of yes and no and “Number of…” is redundant
• Define what is meant by “established,” i.e., approval of web platform by designated authority, etc.
• Establish timeline for achievement, or yearly targets of how many to be established over time
• Consider having additional indicators that measure utilization rate or quality of the web-platform by users
output Number of thematic strategies for RDI prepared
assessmeNt• Define what is meant by “prepared,” i.e., whether approval is also
required for the prepared strategies by designated authority, etc.• Establish timeline for achievement, or yearly targets of how
many to be prepared over time• Consider having additional indicators that measure wheth-
er those strategies are implemented or used for program development
output Report on mapping of RDI capacities in business sector
assessmeNt• Revise the indicator to read “Number of reports on mapping of
RDI capacities in business sector” if more than one is expect-ed to be prepared; if not, this indicator can be set as a binary indicator of yes and no
• Define what the report entails, such as any criteria for the con-tent that will be used to review or approve the report
outcome Number of strategic projects (project proposals) defined within thematic innovation platforms
assessmeNt• Define the indicator further to elaborate on how strategic proj-
ects are to be “defined” within thematic innovation platforms; it is not clear whether the intent is to measure the success of thematic innovation platforms based on number of projects that are supported; this should be clarified in the definition
• Anticipated timeline for launching such strategic projects should also be established
AnAlysis of the CroAtiA smArt speCiAlizAtion strAtegy: logiCAl frAmework, instruments, And indiCAtor results 142

specific objective 3: modeRNiziNg aNd diveRsifyiNg cRoatiaN ecoNomy thRough iNcReasiNg pRivate iNvestmeNts iN Rdi
SSO3.1: Support to business investments in RDI(Strengthened capacities for RDI of enterprises (including SMEs); their productivity, competitive-ness and export activity raised and diversified production and services offer)
PIs:• Fostering development of new products/services resulting from R&D activities – Phases I and II• EUREKA• EUROSTARS(Owners: Ministry of Economy and Sustainable Development, HAMAG-BICRO)
output Number of R&D projects supported
assessmeNt• Use as parent indicator combining similar indicators that track
number of projects supported and introduce disaggregate measures
output Share of funded projects per specific TRL level range
assessmeNt• Merge with indicator “Number of R&D projects supported” by
using TRL level as a disaggregation measure
aPPEndix 143

output Number of enterprises supported
assessmeNt• Revise indicator to match a standard indicator across programs
as provided below
RevisioNIndicator: Number of enterprises supportedDefinition: The indicator counts the number of enterprises supported by grants awarded through the program to develop and launch new or improved products (including goods and services) on the market. Double counting is avoided, meaning a single enterprise is counted only once, regardless of the number of projects it is supported through. If an enterprise is supported to develop more than one product, ei-ther through a single project or more than one, it is counted as one. Indicator achievement is subject to project completion.Disaggregation: By S3 thematic priority areas; by industry; by type of product (goods, services); by product novelty (new, improved)• Out of which: Number of new enterprises supported (Note:
“New enterprises” are enterprises established not more than 36 months before the date of submission of project application)
• Out of which: Number of enterprises supported to introduce “new-to-market” products (Note: A product is considered “new-to-market” if there is no other product available on the national market that offers the same functionality or if the new product uses technology that is significantly different from the technolo-gy of existing products. Potential product novelty is determined in the phase of assessment of project proposals submitted and verified when the product is developed.)
Target: As set by the programDeadline for Achievement: the date of project completion (final payment disbursement)MoCV:• Verification: Grant contract, approved requests for reimburse-
ments, decision on final payment• Process: Target assigned during application phase; progress
tracked through implementation reports; assessment at approval of final implementation report and final payment disbursement of individual projects. Beneficiaries are not required to report on this indicator during project implementation because it is tracked by the program managers based on the implementation status of particular projects (projects in implementation phase and projects completed).
AnAlysis of the CroAtiA smArt speCiAlizAtion strAtegy: logiCAl frAmework, instruments, And indiCAtor results 144

output Number of enterprises receiving grants
assessmeNt• Revise indicator to match a standard indicator across programs
as provided below
RevisioNIndicator: Number of enterprises supportedDefinition: The indicator counts the number of enterprises supported by grants awarded through the program to develop and launch new or improved products (including goods and services) on the market. Double counting is avoided, meaning a single enterprise is counted only once, regardless of the number of projects it is supported through. If an enterprise is supported to develop more than one product, ei-ther through a single project or more than one, it is counted as one. Indicator achievement is subject to project completion.Disaggregation: By S3 thematic priority areas; by industry; by type of product (goods, services); by product novelty (new, improved)• Out of which: Number of new enterprises supported (Note:
“New enterprises” are enterprises established not more than 36 months before the date of submission of project application)
• Out of which: Number of enterprises supported to introduce “new-to-market” products (Note: A product is considered “new-to-market” if there is no other product available on the national market that offers the same functionality or if the new product uses technology that is significantly different from the technolo-gy of existing products. Potential product novelty is determined in the phase of assessment of project proposals submitted and verified when the product is developed.)
Target: As assigned by the applicantDeadline for Achievement: The date of project completion (final payment disbursement)MoCV:• Verification: Grant contract, approved requests for reimburse-
ments, decision on final payment• Process: Target assigned during application phase; progress
tracked through implementation reports; assessment at approval of final implementation report and final payment disbursement of individual projects. Beneficiaries are not required to report on this indicator during project implementation because it is tracked by the program managers based on the implementation status of particular projects (projects in implementation phase and projects completed).
output Share of companies that are newcomers to RDI schemes
assessmeNt• Specify what is meant by newcomers, i.e., are they enterprises
that had not previously received support through this particular program only or any other RDI programs?
• Establish MoCV to describe information collection and verifi-cation process
aPPEndix 145

output Number of enterprises supported to introduce new to the market products
assessmeNt• Combine similar indicators into a single indicator counting the
enterprises supported through the program• Revise definition for clarity and to harmonize measurement de-
tails across indicators and programs• Add disaggregation to provide details on type and novelty of
products developed, new enterprises supported, enterprises supported to develop new-to-market products, and S3 thematic priority areas covered
• Revise MoCV to harmonize across indicators
RevisioNIndicator: Number of enterprises supportedDefinition: The indicator counts the number of enterprises supported by grants awarded through the program to develop and launch new or improved products (including goods and services) on the market. Double counting is avoided, meaning a single enterprise is counted only once, regardless of the number of projects it is supported through. If an enterprise is supported to develop more than one product, ei-ther through a single project or more than one, it is counted as one. Indicator achievement is subject to project completion.Disaggregation: By S3 thematic priority areas; by industry; by type of product (goods, services); by product novelty (new, improved) • Out of which: Number of new enterprises supported (Note:
“New enterprises” are enterprises established not more than 36 months before the date of submission of project application)
• Out of which: Number of enterprises supported to introduce “new-to-market” products (Note: A product is considered “new-to-market” if there is no other product available on the national market that offers the same functionality or if the new product uses technology that is significantly different from the technolo-gy of existing products. Potential product novelty is determined in the phase of assessment of project proposals submitted and verified when the product is developed.)
Target: As set by the programDeadline for Achievement: The date of project completion (final payment disbursement)MoCV:• Verification: Grant contract, approved requests for reimburse-
ments, decision on final payment• Process: Target assigned during application phase; progress
tracked through implementation reports; assessment at approval of final implementation report of individual projects. Beneficiaries are not required to report on this indicator during project imple-mentation because it is tracked by the program managers based on the implementation status of particular projects (projects in implementation phase and projects completed).
AnAlysis of the CroAtiA smArt speCiAlizAtion strAtegy: logiCAl frAmework, instruments, And indiCAtor results 146

output Number of enterprises supported to introduce new to the firm products
assessmeNt• Combine similar indicators into a single indicator counting the
enterprises supported through the program• Revise definition for clarity and to harmonize measurement de-
tails across indicators and programs• Add disaggregation to provide details on type and novelty of
products developed, new enterprises supported, enterprises supported to develop new-to-market products, and S3 thematic priority areas covered
• Revise MoCV to harmonize across indicators
RevisioNIndicator: Number of enterprises supportedDefinition: The indicator counts the number of enterprises supported by grants awarded through the program to develop and launch new or improved products (including goods and services) on the market. Double counting is avoided, meaning a single enterprise is counted only once, regardless of the number of projects it is supported through. If an enterprise is supported to develop more than one product, ei-ther through a single project or more than one, it is counted as one. Indicator achievement is subject to project completion.Disaggregation: By S3 thematic priority areas; by industry; by type of product (goods, services); by product novelty (new, improved) • Out of which: Number of new enterprises supported (Note:
“New enterprises” are enterprises established not more than 36 months before the date of submission of project application)
• Out of which: Number of enterprises supported to introduce “new-to-market” products (Note: A product is considered “new-to-market” if there is no other product available on the national market that offers the same functionality or if the new product uses technology that is significantly different from the technolo-gy of existing products. Potential product novelty is determined in the phase of assessment of project proposals submitted and verified when the product is developed.)
Target: As set by the programDeadline for Achievement: The date of project completion (final payment disbursement)MoCV:• Verification: Grant contract, approved requests for reimburse-
ments, decision on final payment• Process: Target assigned during application phase; progress
tracked through implementation reports; assessment at approval of final implementation report of individual projects. Beneficiaries are not required to report on this indicator during project imple-mentation because it is tracked by the program managers based on the implementation status of particular projects (projects in implementation phase and projects completed).
aPPEndix 147

output Number of enterprises implementing KET
assessmeNt• Track as a disaggregate measure of “Number of enterprises sup-
ported.” In the mentioned indicator, one suggestion would be to add the following disaggregation: “Out of which: Number of enter-prises supported to implement Key Enabling Technologies (Note: Key Enabling Technologies refer to micro and nanoelectronics, nanotechnology, industrial biotechnology, advanced materials, photonics, and advanced manufacturing technologies)”
output Number of collaborative projects conducted
assessmeNt• Harmonize the indicator with other projects that also support
collaborative approach to project implementation• Define the indicator further to improve clarity on what indica-
tor measures• Add disaggregation to capture different characteristics of the
project
RevisioNIndicator: Number of collaborative research projects supportedDefinition: The indicator refers to the number of collaborative R&D projects conducted by grantees with the grant awarded under the program. This indicator will capture only completed projects, which are defined as those having approval of the grantee’s final project implementation report and grantee receiving the final payment. For monitoring purposes, the indicator should track the projects that are contracted, ongoing, and completed.Disaggregation: By project status (awarded/ongoing, completed); by project results (projects which achieved their objectives, projects with objectives partially achieved, projects which were discontin-ued due to irregularities or other reasons); by research field; by S3 thematic priority areas; by region; by novelty of collaboration (new, existing); by perception of quality of collaboration (satisfaction); by partner origin (Croatian, foreign)Target: As set by the programDeadline for Achievement: The date of project completion (final payment disbursement)MoCV: • Verification: Grant contract; approved requests for reimburse-
ments; decision on final payment • Process: Target assigned during application phase; progress
tracked through annual project implementation reports; as-sessment at approval of final implementation report and final payment disbursement of individual projects. Beneficiaries are not required to report on this indicator during project implemen-tation because it is tracked by the program managers based on the implementation status of particular projects (projects in implementation phase and projects completed).
AnAlysis of the CroAtiA smArt speCiAlizAtion strAtegy: logiCAl frAmework, instruments, And indiCAtor results 148

output Number of company-company collaborations within RDI projects
assessmeNt• Use a parent indicator “Number of collaborative research projects
supported” that is disaggregated to this indicator
output Number of enterprises supported cooperating with research institutions
assessmeNt• Revise definition slightly for clarity and to harmonize measure-
ment details across indicators and programs• Add disaggregation to provide details on collaboration supported
and S3 thematic priority areas covered• Revise MoCV to harmonize across indicators
RevisioNDefinition: The indicator counts the number of enterprises col-laborating with research organizations on R&D projects supported through the program. At least one enterprise and one research or-ganization must collaborate on the project. The collaboration may be new or a continuation of existing collaboration and must last at least as long as the project. All enterprises participating in the proj-ect as partners are counted as contributing to the indicator. Double counting is avoided, meaning a single enterprise is counted only once regardless of the number of projects it is participating in.Disaggregation: By research field; by S3 thematic priority areas; by region; by novelty of collaboration (new, existing); by perception of quality of collaboration (satisfaction)Target: As assigned by the applicantDeadline for Achievement: The date of project completion (final payment disbursement)MoCV:• Verification: Grant contract; partnership agreements; ap-
proved requests for reimbursements; decision on final payment disbursement
• Process: Target assigned during application phase; progress tracked through quarterly project implementation reports; as-sessment at approval of final implementation report and final payment disbursement of individual projects
aPPEndix 149

output Private investment matching public support in innovation or R&D projects
assessmeNt• Revise indicator and definition to explicitly refer to the value of pri-
vate investment and to standardize wording with other indicators• Add disaggregation to enable further analysis of S3 thematic
priority areas
RevisioNIndicator: Value of private investment matching public support in RDI projectsDefinition: This indicator measures the total value of private con-tribution in supported RDI projects, including non-eligible parts of the project. The amount is an addition to the public funds received from the program. The amount is calculated by subtracting the public funds (including the grant value and other contributions from public sources, if applicable) from the total project value (including eligible and non-eligible project costs).Disaggregation: By industry; by S3 thematic priority area; by domes-tic vs. foreign investmentsTarget: As assigned by the applicantDeadline for Achievement: The date of project completion (final payment disbursement)MoCV:• Verification: Grant contract, approved requests for reimburse-
ments, decision on final payment; signed statement declaring the value of own investments of enterprises through ineligible costs
• Process: Target assigned during application phase; progress tracked through implementation reports, assessment at approval of final implementation report and final payment disbursement of individual projects
AnAlysis of the CroAtiA smArt speCiAlizAtion strAtegy: logiCAl frAmework, instruments, And indiCAtor results 150
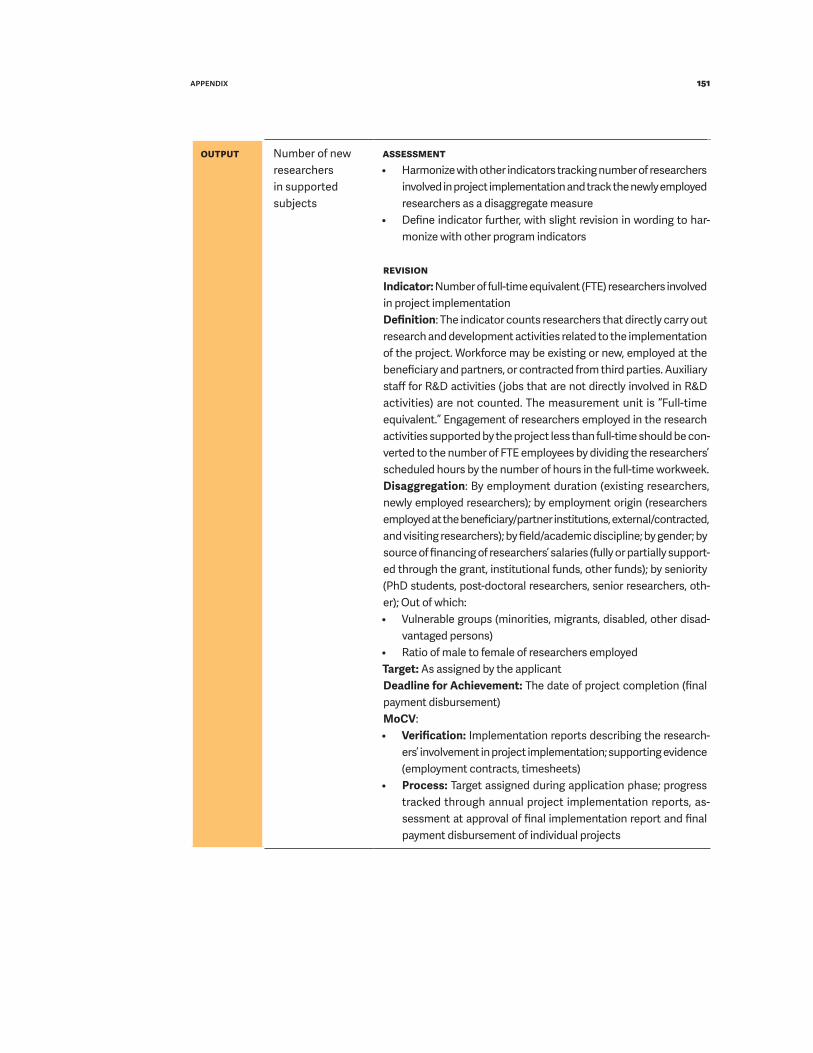
output Number of new researchers in supported subjects
assessmeNt• Harmonize with other indicators tracking number of researchers
involved in project implementation and track the newly employed researchers as a disaggregate measure
• Define indicator further, with slight revision in wording to har-monize with other program indicators
RevisioNIndicator: Number of full-time equivalent (FTE) researchers involved in project implementationDefinition: The indicator counts researchers that directly carry out research and development activities related to the implementation of the project. Workforce may be existing or new, employed at the beneficiary and partners, or contracted from third parties. Auxiliary staff for R&D activities (jobs that are not directly involved in R&D activities) are not counted. The measurement unit is “Full-time equivalent.” Engagement of researchers employed in the research activities supported by the project less than full-time should be con-verted to the number of FTE employees by dividing the researchers’ scheduled hours by the number of hours in the full-time workweek.Disaggregation: By employment duration (existing researchers, newly employed researchers); by employment origin (researchers employed at the beneficiary/partner institutions, external/contracted, and visiting researchers); by field/academic discipline; by gender; by source of financing of researchers’ salaries (fully or partially support-ed through the grant, institutional funds, other funds); by seniority (PhD students, post-doctoral researchers, senior researchers, oth-er); Out of which: • Vulnerable groups (minorities, migrants, disabled, other disad-
vantaged persons)• Ratio of male to female of researchers employedTarget: As assigned by the applicantDeadline for Achievement: The date of project completion (final payment disbursement)MoCV: • Verification: Implementation reports describing the research-
ers’ involvement in project implementation; supporting evidence (employment contracts, timesheets)
• Process: Target assigned during application phase; progress tracked through annual project implementation reports, as-sessment at approval of final implementation report and final payment disbursement of individual projects
aPPEndix 151

outcome Number of job positions in R&D created and filled in enterprises by RDI projects after the end of funded project
assessmeNt• Revise indicator to harmonize across programs and combine
with similar indicators tracked by the project• Revise definition for clarity and to add details on measurement• Add disaggregation to reveal the demographics of researchers
hired by the enterprises for R&D work
RevisioNIndicator: Change in employment of researchers in enterprises af-ter project completionDefinition: The indicator measures the change in the gross number of full-time equivalent (FTE) researchers employed in the supported enterprises after project completion. The indicator is calculated as the difference between the number of researchers (FTE) in enterpris-es in the year preceding the submission of the project application (baseline value) and the number of researchers (FTE) up to five years after project completion (target value). Engagement of researchers employed less than full-time should be converted to the number of FTE employees by dividing the researchers’ scheduled hours by the number of hours in the full-time workweek.Disaggregation:• By gender• Out of which: Number of young researchers (research students,
PhD students, early-stage researchers) employed• Out of which: Vulnerable groups (minorities, migrants, disabled,
other disadvantaged persons)Target: As assigned by the applicantDeadline for Achievement: 5 years from the date of project completionMoCV:• Verification: Post-implementation reports; supporting evidence
(employment contracts)• Process: Target assigned during application phase; post-imple-
mentation reporting and assessment after 1, 3 and 5 years from project completion
AnAlysis of the CroAtiA smArt speCiAlizAtion strAtegy: logiCAl frAmework, instruments, And indiCAtor results 152

outcome Number of collaborative contracted projects between companies and HEIs/PROs after the end of supported projects
assessmeNt• Use a parent indicator “Number of collaborative projects con-
tracted after project completion” that is disaggregated to this indicator, which is defined below:
RevisioNIndicator: Number of collaborative projects contracted after proj-ect completionDefinition: The indicator refers to the number of new collaborative research projects involving the beneficiary of the supported project and at least one other entity and contracted after the end of imple-mentation of the supported project. The beneficiary organization is involved as either the main beneficiary or a partner in the implemen-tation of the new projects contracted.Disaggregation: By collaboration novelty (new, existing); by type of partner (research organization, enterprise, other); by partner origin (domestic, foreign, diaspora); by type of research (basic, applied, ex-perimental development); by science area; by science field; by fund-ing source (national, EU, private, other); by S3 thematic priority areaTarget: As assigned by the applicantDeadline for Achievement: 5 years from the date of project completionMoCV: • Verification: Post-project implementation reports providing in-
formation on project beneficiary and partners, date of contract award, project value and funding source, short description of objectives and activities, links to web pages providing additional information (if applicable)
• Process: Target assigned during application phase; post-im-plementation reporting and assessment 1, 3 and 5 years after project completion
aPPEndix 153

outcome Number of new innovative products/services/processes/technologies
assessmeNt• The indicator could be split into two indicators that measure
product and process innovations separately• The indicator definitions could be standardized (with the OECD/
Eurostat definition) and harmonized with similar indicators as shown below.
RevisioN1) Indicator: Number of product innovations introducedDefinition: The indicator measures the number of new product innovations introduced by supported entities during and after the project implementation period. A product innovation is the intro-duction of a good or service that is new or significantly improved with respect to its characteristics or intended uses. This includes significant improvements in technical specifications, components and materials, incorporated software, user friendliness, or other functional characteristics. Product innovations can utilize new knowledge or technologies or can be based on new uses or combi-nations of existing knowledge or technologies. The term “product” is used to cover both goods and services. Product innovations include both the introduction of new goods and services and significant improvements in the functional or user characteristics of existing goods and services (Source: OECD/Eurostat). The number of product innovations is reported cumulatively, up to a data collection point set in the post-implementation period.Disaggregation: By S3 thematic priority areas; by industry; by mar-ket (domestic, international); by type (goods, services); by novelty (new, improved)• Out of which: Number of “new-to-market” product innovations
introduced (Note: A product is considered “new-to-market” if there is no other product available on the national market that offers the same functionality or if the new product uses technol-ogy that is significantly different from the technology of existing products. Potential product novelty is determined in the phase of assessment of project proposals submitted and verified when the product is developed.)
Target: As assigned by the applicantDeadline for Achievement: 5 years from the date of project completionMoCV:• Verification: Implementation and post-implementation reports;
supporting evidence• Process: Target assigned during application phase; assessment
at project completion; post-implementation reporting and as-sessment 1, 3 and 5 years after project completion
AnAlysis of the CroAtiA smArt speCiAlizAtion strAtegy: logiCAl frAmework, instruments, And indiCAtor results 154

2) Indicator: Number of process innovations introducedDefinition: The indicator measures the number of new process in-novations introduced by supported entities during and after project completion. A process innovation is the implementation of a new or significantly improved production or delivery method. This includes significant changes in techniques, equipment, or software. Process innovations can be intended to decrease unit costs of production or delivery, to increase quality, or to produce or deliver new or signifi-cantly improved products. Process innovations include new or signifi-cantly improved methods for the creation and provision of services. They can involve significant changes in the equipment and software used in services-oriented firms or in the procedures or techniques that are employed to deliver services. Process innovations also cover new or significantly improved techniques, equipment, and software in ancillary support activities, such as purchasing, accounting, com-puting, and maintenance (Source: OECD/Eurostat). The number of process innovations is reported cumulatively, up to a data collection point set in the post-implementation period.Disaggregation: By S3 thematic priority areas; by type of processesTarget: As assigned by the applicantDeadline for Achievement: 5 years from the date of project completionMoCV:• Verification: Implementation and post-implementation reports;
supporting evidence• Process: Target assigned during application phase; annual re-
porting during project implementation period; post-implemen-tation reporting and assessment 1, 3 and 5 years after project completion
aPPEndix 155

outcome Number of commercialization and technology transfer agreements
assessmeNt• Combine and revise indicator to a parent indicator to enable ag-
gregation of different types of technology transfer models real-ized while still enabling disaggregated measurement of individual models such as the one measured by this indicator
RevisioNIndicator: Number of technology transfer models realized due to project implementationDefinition: The indicator refers to transfers of research results (knowledge and technology) realized due to project implementa-tion with the purpose of their further development or their use in development and commercialization of new products (goods or services). Project results can be transferred from project beneficiary or partners to third parties in the form of signed R&D agreements or contracts and intellectual property (IP) licensing agreements, or the transfer can be realized through establishment of new enterprises. More specifically, the following are the types of technology transfer models captured (and disaggregated) by the indicator:• Number of new start-ups/spin-offs/spin-outs originating out
of supported projects: Number of new enterprises (start-up/spin-off/spin-out) established by project beneficiary or project partners as a result of funded project. A start-up is an enterprise less than 3 years old. A spin-off is an enterprise that has been started by a university group but that has never left the univer-sity environment and perhaps exists to offer specialist consul-tancy services without the intention for any further expansion or full technology transfer. A spin-out is an enterprise in which the university or institute has an equity stake.
• Number of licensing agreements signed with the industry: The licensing agreement is a contract to be used by enterprises for technology transfer through granting rights of industrial owner-ship (license of patents and trademarks).
• Number of other technology transfer agreements signed with the industry: Any other forms of technology transfer or commer-cialization agreements signed with the enterprises.
• Number of contract research agreements with the industry.Disaggregation: By models of technology transfer (as listed in the definition)Target: As assigned by the applicantDeadline for Achievement: 3 years from the date of project completionMoCV:• Verification: Implementation and post-implementation reports;
supporting evidence (copies of contracts signed, formal docu-mentation on establishment of an enterprise, etc.)
• Process: Target assigned during application phase; annual report-ing during project implementation period; post-implementation reporting and assessment 1 and 3 years after project completion
AnAlysis of the CroAtiA smArt speCiAlizAtion strAtegy: logiCAl frAmework, instruments, And indiCAtor results 156

outcome Number of licensing agreements
assessmeNt• Combine and revise indicator to a parent indicator to enable ag-
gregation of different types of technology transfer models real-ized while still enabling disaggregated measurement of individual models such as the one measured by this indicator
RevisioNIndicator: Number of technology transfer models realized due to project implementationDefinition: The indicator refers to transfers of research results (knowledge and technology) realized due to project implementa-tion with the purpose of their further development or their use in development and commercialization of new products (goods or services). Project results can be transferred from project beneficiary or partners to third parties in the form of signed R&D agreements or contracts and intellectual property (IP) licensing agreements, or the transfer can be realized through establishment of new enterprises. More specifically, the following are the types of technology transfer models captured (and disaggregated) by the indicator:• Number of new start-ups/spin-offs/spin-outs originating out
of supported projects: Number of new enterprises (start-up/spin-off/spin-out) established by project beneficiary or project partners as a result of funded project. A start-up is an enterprise less than 3 years old. A spin-off is an enterprise that has been started by a university group but that has never left the univer-sity environment and perhaps exists to offer specialist consul-tancy services without the intention for any further expansion or full technology transfer. A spin-out is an enterprise in which the university or institute has an equity stake.
• Number of licensing agreements signed with the industry: The licensing agreement is a contract to be used by enterprises for technology transfer through granting rights of industrial owner-ship (license of patents and trademarks).
• Number of other technology transfer agreements signed with the industry: Any other forms of technology transfer or commer-cialization agreements signed with the enterprises.
• Number of contract research agreements with the industry.Disaggregation: By models of technology transfer (as listed in the definition)Target: As assigned by the applicantDeadline for Achievement: 3 years from the date of project completionMoCV:• Verification: Implementation and post-implementation reports;
supporting evidence (copies of contracts signed or formal doc-umentation on establishment of an enterprise, etc.)
• Process: Target assigned during application phase; annual report-ing during project implementation period; post-implementation reporting and assessment 1 and 3 years after project completion
aPPEndix 157

outcome Number of start-ups/spin-offs/spin-outs originating from supported projects
assessmeNt• Combine and revise indicator to a parent indicator to enable ag-
gregation of different types of technology transfer models real-ized while still enabling disaggregated measurement of individual models such as the one measured by this indicator
RevisioNIndicator: Number of technology transfer models realized due to project implementationDefinition: The indicator refers to transfers of research results (knowledge and technology) realized due to project implementa-tion with the purpose of their further development or their use in development and commercialization of new products (goods or services). Project results can be transferred from project beneficiary or partners to third parties in the form of signed R&D agreements or contracts and intellectual property (IP) licensing agreements, or the transfer can be realized through establishment of new enterprises. More specifically, the following are the types of technology transfer models captured (and disaggregated) by the indicator:• Number of new start-ups/spin-offs/spin-outs originating out of
supported projects: Number of new enterprises (start-up/spin-off/spin-out) established by project beneficiary project partners as a result of funded project. A start-up is an enterprise less than 3 years old. A spin-off is an enterprise that has been started by a university group but that has never left the university environ-ment and perhaps exists to offer specialist consultancy services without the intention for any further expansion or full technol-ogy transfer. A spin-out is an enterprise in which the university or institute has an equity stake.
• Number of licensing agreements signed with the industry: The licensing agreement is a contract to be used by enterprises for technology transfer through granting rights of industrial owner-ship (license of patents and trademarks).
• Number of other technology transfer agreements signed with the industry: Any other forms of technology transfer or commer-cialization agreements signed with the enterprises.
• Number of contract research agreements with the industry.Disaggregation: By models of technology transfer (as listed in the definition)Target: As assigned by the applicantDeadline for Achievement: 3 years from the date of project completionMoCV:• Verification: Implementation and post-implementation reports;
supporting evidence (copies of contracts signed, formal docu-mentation on establishment of an enterprise, etc.)
• Process: Target assigned during application phase; annual report-ing during project implementation period; post-implementation reporting and assessment 1 and 3 years after project completion
AnAlysis of the CroAtiA smArt speCiAlizAtion strAtegy: logiCAl frAmework, instruments, And indiCAtor results 158

outcome Number of IP applications filed
assessmeNt• The indicator could be standardized with other indicators using
the indicator and definition described below, including disaggre-gation of filed and registered applications, because timeframe may vary based on the policy instruments’ support intensity or approach
RevisioNIndicator: Number of IPR applications filed Definition: Indicator refers to the number of IPR applications (in-cluding patents, trademarks, industrial designs, etc.) filed by the project beneficiary and partners involved in project implementation as a result of the research activities conducted in the scope of the financed project. Applicant should state the expected number of IPR applications in the project application. In the post-implemen-tation reporting phase, applicant should provide a description of a clear link between the conducted research activities and the IPR protection filed.Disaggregation: By type of IPR (patents, industrial design, trade-marks); by application status (filed, registered/approved); by type of procedure (national, international)Target: At least 1 per projectDeadline for Achievement: 5 years from the date of project completionOptional Measures:• Number of “patentability studies” conducted to verify and pro-
tect IP of project results (by outcome: project result patentable/not patentable)
MoCV:• Verification: Implementation and post-implementation reports;
supporting evidence (documentation verifying the IPR applica-tion and its status)
• Process: Target assigned during application phase; annual re-porting during project implementation period; post-implemen-tation reporting and assessment 1, 3 and 5 years after project completion
outcome Number of IP applications registered
assessmeNt• The indicator could be standardized with other indicators and
used as a disaggregate of “Number of IPR applications filed”
aPPEndix 159

outcome Private investment in R&D projects after the end of funded project
assessmeNt• Make minor revisions of indicator and definition to specify mea-
surement details• Add disaggregation to provide additional information on type of
investment conducted • Revise MoCV by specifying verification source
RevisioNIndicator: Value of private investment in R&D projects after project completionDefinition: The indicator measures the total value of private invest-ment by supported enterprises to undertake R&D activities after the end of the supported project. This amount reflects the increase in private sector expenditure in R&D after project completion, mea-sured on annual basis up to 5 years after the grant period, excluding future grants awarded to the enterprise.Disaggregation: By investment purpose (cost categories); by S3 thematic priority area; by industryTarget: As assigned by the applicantDeadline for Achievement: 5 years from the date of project completionMoCV:• Verification: Post-implementation reports• Process: Target assigned during application phase; post-imple-
mentation reporting and assessment after 1, 3 and 5 years from project completion
AnAlysis of the CroAtiA smArt speCiAlizAtion strAtegy: logiCAl frAmework, instruments, And indiCAtor results 160

outcome Sales of new-to-firm innovation (as percentage of turnover)
assessmeNt• Revise indicator for clarity, given that all firm-level innovations are
new-to-firm; harmonize terminology across programs (i.e., using the word “revenue” instead of “turnover”) so that it specifies the stated outcome more clearly because the current indicator does not clearly define all the stated elements; combine two indica-tors with removal of the new-to-firm and new-to-market distinc-tion in order to enhance clarity and avoid measurement issues
• Revise definition for clarity and use OECD/Eurostat terminology in order to ensure standardization
• Revise MoCV to harmonize across indicators to enable more efficient data collection and analysis
RevisioNIndicator: Percentage of sales revenue from product innovationsDefinition: The indicator measures the percentage share of total annual revenue from sales that can be attributed to the product in-novation resulting from the supported project. A product innovation is the introduction of a good or service that is new or significantly improved with respect to its characteristics or intended uses. This includes significant improvements in technical specifications, com-ponents and materials, incorporated software, user friendliness, or other functional characteristics. Product innovations can utilize new knowledge or technologies or can be based on new uses or combi-nations of existing knowledge or technologies. The term “product” is used to cover both goods and services. Product innovations include both the introduction of new goods and services and significant improvements in the functional or user characteristics of existing goods and services.Disaggregation: By S3 thematic priority areas; by industry; by mar-ket (domestic, international); by product type (goods, services); by product novelty (new, improved)Target: As assigned by the applicantDeadline for Achievement: 5 years from the date of project completionMoCV:• Verification: Post-implementation reports; supporting evidence• Process: Target assigned during application phase; post-imple-
mentation reporting and assessment after 1, 3 and 5 years from project completion
outcome Sales of new-to-market innovation (as percentage of turnover)
assessmeNt• Track as disaggregate of “Sales of new-to-firm innovation (as
percentage of turnover)” because “new-to-market” products are a sub-category of “new-to-firm” products (which refers to all product innovations introduced)
aPPEndix 161

outcome Increase in companies’ turnover compared to year of contracting
assessmeNt• Revise the indicator name to harmonize wording across indica-
tors and to introduce neutrality by referring to “change” instead of “increase”
RevisioNIndicator: Change in sales revenue after project completionDefinition: The indicator measures the value of change in sales revenue of the supported enterprises after project completion. The indicator is calculated as the difference between the value of sales revenue of the supported enterprises in the year preceding the sub-mission of the project application (baseline value) and the annual value of sales revenue up to five years after project completion (tar-get value), expressed in absolute numbers. Sales revenue is taken as annual gross sales revenue, which does not include any grant support received by the enterprise.Disaggregation:• Out of which: Change in revenue from sales abroad (export)Optional Measures:• Percentage change in sales revenue• Percentage change in revenue from sales abroadTarget: As assigned by the applicantDeadline for Achievement: 5 years from the date of project completionMoCV:• Verification: Post-implementation survey, annual financial state-
ments of enterprises• Process: Target assigned during application phase; post-imple-
mentation reporting and annual assessment up to 5 years from project completion
AnAlysis of the CroAtiA smArt speCiAlizAtion strAtegy: logiCAl frAmework, instruments, And indiCAtor results 162

outcome Number of collaborative contracted projects (by beneficiaries in companies) with foreign HEI and PRO institutions
assessmeNt• Use a parent indicator “Number of collaborative projects con-
tracted after project completion” that is disaggregated to this indicator, which is defined below:
RevisioNIndicator: Number of collaborative projects contracted after project completionDefinition: The indicator refers to the number of new collaborative research projects involving the beneficiary of the supported project and at least one other entity and contracted after the end of imple-mentation of the supported project. The beneficiary organization is involved as either the main beneficiary or a partner in the implemen-tation of the new projects contracted.Disaggregation: By collaboration novelty (new, existing); by type of partner (research organization, enterprise, other); by partner origin (domestic, foreign, diaspora); by type of research (basic, applied, ex-perimental development); by science area; by science field; by fund-ing source (national, EU, private, other); by S3 thematic priority areaTarget: As assigned by the applicantDeadline for Achievement: 5 years from the date of project completionMoCV: • Verification: Post-project implementation reports providing in-
formation on project beneficiary and partners, date of contract award, project value and funding source, short description of objectives and activities, links to web pages providing additional information (if applicable)
• Process: Target assigned during application phase; post-im-plementation reporting and assessment 1, 3 and 5 years after project completion
outcome Increase in share of turnover from exports compared to contracting year
assessmeNt• Use parent indicator “Increase in companies’ turnover compared
to year of contracting” and track as disaggregate measure, given that export revenue is part of turnover
SSO3.2: Strengthened SMEs capacities to innovate (implementation of new solutions in the areas of technology, product, process and organizational innovations, including marketing innovations, design and innovation advisory, IPR and support services as well as non R&D based solutions applied by SMEs)
PIs:• Innovations in S3 areas• Integrator• Innovations of newly established SMEs (Phases I and II)• Commercialization of Innovation in Entrepreneurship• Innovation Vouchers• Proof of technological feasibility and commercialization capacity of innovative product/technology/
service at SMEs (STPII – PoC private)• Support for RDI activities of SMEs for their technological upgrade and global competitiveness (ST-
PII – RAZUM program)(Owners: Ministry of Economy and Sustainable Development, HAMAG-BICRO)
aPPEndix 163

output Number of enterprises supported
assessmeNt• Revise indicator to match a standard indicator across programs
as provided below
RevisioNIndicator: Number of enterprises supportedDefinition: The indicator counts the number of enterprises supported by grants awarded through the program to develop and launch new or improved products (including goods and services) on the market. Double counting is avoided, meaning a single enterprise is counted only once, regardless of the number of projects it is supported through. If an enterprise is supported to develop more than one product, ei-ther through a single project or more than one, it is counted as one. Indicator achievement is subject to project completion.Disaggregation:By S3 thematic priority areas; by industry; by type of product (goods, services); by product novelty (new, improved)• Out of which: Number of new enterprises supported (Note:
“New enterprises” are enterprises established not more than 36 months before the date of submission of project application)
• Out of which: Number of enterprises supported to introduce “new-to-market” products (Note: A product is considered “new-to-market” if there is no other product available on the national market that offers the same functionality or if the new product uses technology that is significantly different from the technolo-gy of existing products. Potential product novelty is determined in the phase of assessment of project proposals submitted and verified when the product is developed.)
Target: As set by the programDeadline for Achievement: The date of project completion (final payment disbursement)MoCV:• Verification: Grant contract, approved requests for reimburse-
ments, decision on final payment• Process: Target assigned during application phase; progress
tracked through implementation reports; assessment at approval of final implementation report and final payment disbursement of individual projects. Beneficiaries are not required to report on this indicator during project implementation because it is tracked by the program managers based on the implementation status of particular projects (projects in implementation phase and projects completed).
AnAlysis of the CroAtiA smArt speCiAlizAtion strAtegy: logiCAl frAmework, instruments, And indiCAtor results 164

output Number of enterprises receiving grants
assessmeNt• Revise indicator to match a standard indicator across programs
as provided below
RevisioNIndicator: Number of enterprises supportedDefinition: The indicator counts the number of enterprises supported by grants awarded through the program to develop and launch new or improved products (including goods and services) on the market. Double counting is avoided, meaning a single enterprise is counted only once, regardless of the number of projects it is supported through. If an enterprise is supported to develop more than one product, ei-ther through a single project or more than one, it is counted as one. Indicator achievement is subject to project completion.Disaggregation: By S3 thematic priority areas; by industry; by type of product (goods, services); by product novelty (new, improved)• Out of which: Number of new enterprises supported (Note:
“New enterprises” are enterprises established not more than 36 months before the date of submission of project application)
• Out of which: Number of enterprises supported to introduce “new-to-market” products (Note: A product is considered “new-to-market” if there is no other product available on the national market that offers the same functionality or if the new product uses technology that is significantly different from the technolo-gy of existing products. Potential product novelty is determined in the phase of assessment of project proposals submitted and verified when the product is developed.)
Target: As set by the programDeadline for Achievement: The date of project completion (final payment disbursement)MoCV:• Verification: Grant contract, approved requests for reimburse-
ments, decision on final payment• Process: Target assigned during application phase; progress
tracked through implementation reports; assessment at approval of final implementation report and final payment disbursement of individual projects. Beneficiaries are not required to report on this indicator during project implementation because it is tracked by the program managers based on the implementation status of particular projects (projects in implementation phase and projects completed).
aPPEndix 165

output Number of new enterprises receiving grants
assessmeNt• Revise indicator to match a standard indicator across programs
that has this indicator as a disaggregate, as provided below
RevisioNIndicator: Number of enterprises supportedDefinition: The indicator counts the number of enterprises supported by grants awarded through the program to develop and launch new or improved products (including goods and services) on the market. Double counting is avoided, meaning a single enterprise is counted only once, regardless of the number of projects it is supported through. If an enterprise is supported to develop more than one product, ei-ther through a single project or more than one, it is counted as one. Indicator achievement is subject to project completion.Disaggregation:• By S3 thematic priority areas; by industry; by type of product
(goods, services); by product novelty (new, improved)• Out of which: Number of new enterprises supported (Note:
“New enterprises” are enterprises established not more than 36 months before the date of submission of project application)
• Out of which: Number of enterprises supported to introduce “new-to-market” products (Note: A product is considered “new-to-market” if there is no other product available on the national market that offers the same functionality or if the new product uses technology that is significantly different from the technolo-gy of existing products. Potential product novelty is determined in the phase of assessment of project proposals submitted and verified when the product is developed.)
Target: As set by the programDeadline for Achievement: The date of project completion (final payment disbursement)MoCV:• Verification: Grant contract, approved requests for reimburse-
ments, decision on final payment• Process: Target assigned during application phase; progress
tracked through implementation reports; assessment at approval of final implementation report and final payment disbursement of individual projects. Beneficiaries are not required to report on this indicator during project implementation because it is tracked by the program managers based on the implementation status of particular projects (projects in implementation phase and projects completed).
AnAlysis of the CroAtiA smArt speCiAlizAtion strAtegy: logiCAl frAmework, instruments, And indiCAtor results 166

output Number of enterprises supported to introduce new to the market products)
assessmeNt• Combine similar indicators into a single indicator counting the
enterprises supported through the program• Revise definition for clarity and to harmonize measurement de-
tails across indicators and programs• Add disaggregation to provide details on type and novelty of
products developed, new enterprises supported, enterprises supported to develop new-to-market products, and S3 thematic priority areas covered
• Revise MoCV to harmonize across indicators
RevisioNIndicator: Number of enterprises supportedDefinition: The indicator counts the number of enterprises supported by grants awarded through the program to develop and launch new or improved products (including goods and services) on the market. Double counting is avoided, meaning a single enterprise is counted only once, regardless of the number of projects it is supported through. If an enterprise is supported to develop more than one product, ei-ther through a single project or more than one, it is counted as one. Indicator achievement is subject to project completion.Disaggregation: By S3 thematic priority areas; by industry; by type of product (goods, services); by product novelty (new, improved) • Out of which: Number of new enterprises supported (Note:
“New enterprises” are enterprises established not more than 36 months before the date of submission of project application)
• Out of which: Number of enterprises supported to introduce “new-to-market” products (Note: A product is considered “new-to-market” if there is no other product available on the national market that offers the same functionality or if the new product uses technology that is significantly different from the technolo-gy of existing products. Potential product novelty is determined in the phase of assessment of project proposals submitted and verified when the product is developed.)
Target: As set by the programDeadline for Achievement: The date of project completion (final payment disbursement)MoCV:• Verification: Grant contract, approved requests for reimburse-
ments, decision on final payment• Process: Target assigned during application phase; progress
tracked through implementation reports; assessment at approval of final implementation report of individual projects. Beneficiaries are not required to report on this indicator during project imple-mentation because it is tracked by the program managers based on the implementation status of particular projects (projects in implementation phase and projects completed).
aPPEndix 167

output Number of enterprises supported to introduce new to the firm products
assessmeNt• Combine similar indicators into a single indicator counting the
enterprises supported through the program• Revise definition for clarity and to harmonize measurement de-
tails across indicators and programs• Add disaggregation to provide details on type and novelty of
products developed, new enterprises supported, enterprises supported to develop new-to-market products, and S3 thematic priority areas covered
• Revise MoCV to harmonize across indicators
RevisioNIndicator: Number of enterprises supportedDefinition: The indicator counts the number of enterprises supported by grants awarded through the program to develop and launch new or improved products (including goods and services) on the market. Double counting is avoided, meaning a single enterprise is counted only once, regardless of the number of projects it is supported through. If an enterprise is supported to develop more than one product, ei-ther through a single project or more than one, it is counted as one. Indicator achievement is subject to project completion.Disaggregation: By S3 thematic priority areas; by industry; by type of product (goods, services); by product novelty (new, improved) • Out of which: Number of new enterprises supported (Note:
“New enterprises” are enterprises established not more than 36 months before the date of submission of project application)
• Out of which: Number of enterprises supported to introduce “new-to-market” products (Note: A product is considered “new-to-market” if there is no other product available on the national market that offers the same functionality or if the new product uses technology that is significantly different from the technolo-gy of existing products. Potential product novelty is determined in the phase of assessment of project proposals submitted and verified when the product is developed.)
Target: As set by the programDeadline for Achievement: The date of project completion (final payment disbursement)MoCV:• Verification: Grant contract, approved requests for reimburse-
ments, decision on final payment• Process: Target assigned during application phase; progress
tracked through implementation reports; assessment at approval of final implementation report of individual projects. Beneficiaries are not required to report on this indicator during project imple-mentation because it is tracked by the program managers based on the implementation status of particular projects (projects in implementation phase and projects completed).
AnAlysis of the CroAtiA smArt speCiAlizAtion strAtegy: logiCAl frAmework, instruments, And indiCAtor results 168

output Private investment matching public support in innovation or R&D projects
assessmeNt• Revise indicator and definition to explicitly refer to the value of pri-
vate investment and to standardize wording with other indicators• Add disaggregation to enable further analysis of S3 thematic
priority areas
RevisioNIndicator: Value of private investment matching public support in RDI projectsDefinition: This indicator measures the total value of private con-tribution in supported RDI projects, including non-eligible parts of the project. The amount is an addition to the public funds received from the program. The amount is calculated by subtracting the public funds (including the grant value and other contributions from public sources, if applicable) from the total project value (including eligible and non-eligible project costs).Disaggregation: By industry; by S3 thematic priority area; by domes-tic vs. foreign investmentsTarget: As assigned by the applicantDeadline for Achievement: The date of project completion (final payment disbursement)MoCV:• Verification: Grant contract, approved requests for reimburse-
ments, decision on final payment; signed statement declaring the value of own investments of enterprises through ineligible costs
• Process: Target assigned during application phase; progress tracked through implementation reports, assessment at approval of final implementation report and final payment disbursement of individual projects
output Share of companies that are newcomers to RDI schemes
assessmeNt• Define what is meant by newcomers, i.e., those enterprises that
had not previously received support through this particular pro-gram only or any other programs?
• Establish MoCV to describe information collection and verifi-cation process
output Technical success of projects (concept proven or not)
assessmeNt• Track as disaggregate measure of the indicator tracking the
number of projects supported
aPPEndix 169

output Number of market analyses
assessmeNt• Provide clear definition and MoCV on what qualifies to be cap-
tured by the indicator, as suggested below
RevisioNDefinition: The indicator measures the number of market analy-ses prepared with the advisory support received from consultants or service providers funded through the program. Market analyses are prepared as analytical inputs for development of commercial-ization strategies or plans and include elements such as market sizing and analysis of potential customers, competition, barriers to entry, regulation, etc.Disaggregation: By industry, S3 priority areasTarget: As assigned by the applicantDeadline for Achievement: The date of project completion (final payment disbursement)MoCV:• Verification: Implementation reports; supporting evidence (copies
of market analyses prepared, invoices for the service provided)• Process: Target assigned during application phase; progress
tracked through implementation report for the first half of the implementation period; assessment at approval of final imple-mentation report of individual projects
output Number of demonstrations of technical feasibility resulting from PoC projects
assessmeNt• Track as disaggregate measure of the indicator tracking the
number of projects supported
output Number of (laboratory) prototypes resulting from PoC projects
assessmeNt• Track as disaggregate measure of the indicator tracking the
number of projects supported
AnAlysis of the CroAtiA smArt speCiAlizAtion strAtegy: logiCAl frAmework, instruments, And indiCAtor results 170

output Number of commercialization strategies
assessmeNt• Provide clear definition and MoCV on what qualifies to be cap-
tured by the indicator, as suggested below
RevisioNDefinition: The indicator measures the number of commercialization strategies or plans developed with the advisory support received from consultants or service providers funded through the program. This indicator captures the number of final deliverables in the form of actual commercialization strategies or plans developed after var-ious analytical activities, such as market analysis, cost-benefit anal-ysis, or other studies that become inputs to the strategy document.Disaggregation: By industryTarget: As assigned by the applicantDeadline for Achievement: The date of project completionMoCV:• Verification: Implementation reports; supporting evidence (copies
of strategies or plans developed, invoices for the service provided)• Process: Target assigned during application phase; progress
tracked through implementation report for the first half of the implementation period; assessment at approval of final imple-mentation report of individual projects
aPPEndix 171

outcome Number of new innovative products/services/processes/technologies
assessmeNt• The indicator could be split into two indicators that measure
product and process innovations separately• The indicator definitions could be standardized (with the OECD/
Eurostat definition) and harmonized with similar indicators as shown below.
RevisioN1) Indicator: Number of product innovations introducedDefinition: The indicator measures the number of new product innovations introduced by supported entities during and after the project implementation period. A product innovation is the intro-duction of a good or service that is new or significantly improved with respect to its characteristics or intended uses. This includes significant improvements in technical specifications, components and materials, incorporated software, user friendliness, or other functional characteristics. Product innovations can utilize new knowledge or technologies or can be based on new uses or combi-nations of existing knowledge or technologies. The term “product” is used to cover both goods and services. Product innovations include both the introduction of new goods and services and significant improvements in the functional or user characteristics of existing goods and services (Source: OECD/Eurostat). The number of product innovations is reported cumulatively, up to a data collection point set in the post-implementation period.Disaggregation: By S3 thematic priority areas; by industry; by mar-ket (domestic, international); by type (goods, services); by novelty (new, improved)• Out of which: Number of “new-to-market” product innovations
introduced (Note: A product is considered “new-to-market” if there is no other product available on the national market that offers the same functionality or if the new product uses technol-ogy that is significantly different from the technology of existing products. Potential product novelty is determined in the phase of assessment of project proposals submitted and verified when the product is developed.)
Target: As assigned by the applicantDeadline for Achievement: 5 years from the date of project completionMoCV:• Verification: Implementation and post-implementation reports;
supporting evidence• Process: Target assigned during application phase; assessment
at project completion; post-implementation reporting and as-sessment 1, 3 and 5 years after project completion
AnAlysis of the CroAtiA smArt speCiAlizAtion strAtegy: logiCAl frAmework, instruments, And indiCAtor results 172

2) Indicator: Number of process innovations introducedDefinition: The indicator measures the number of new process in-novations introduced by supported entities during and after project completion. A process innovation is the implementation of a new or significantly improved production or delivery method. This includes significant changes in techniques, equipment or software. Process innovations can be intended to decrease unit costs of production or delivery, to increase quality, or to produce or deliver new or signifi-cantly improved products. Process innovations include new or signifi-cantly improved methods for the creation and provision of services. They can involve significant changes in the equipment and software used in services-oriented firms or in the procedures or techniques that are employed to deliver services. Process innovations also cover new or significantly improved techniques, equipment, and software in ancillary support activities, such as purchasing, accounting, com-puting, and maintenance (Source: OECD/Eurostat). The number of process innovations is reported cumulatively, up to a data collection point set in the post-implementation period.Disaggregation: By S3 thematic priority areas; by type of processesTarget: As assigned by the applicantDeadline for Achievement: 5 years from the date of project completionMoCV:• Verification: Implementation and post-implementation reports;
supporting evidence• Process: Target assigned during application phase; annual re-
porting during project implementation period; post-implemen-tation reporting and assessment 1, 3 and 5 years after project completion
aPPEndix 173

outcome Private investment in R&D projects after the end of funded project
assessmeNt• Make minor revisions of indicator and definition to specify mea-
surement details• Add disaggregation to provide additional information on type of
investment conducted • Revise MoCV by specifying verification source
RevisioNIndicator: Value of private investment in R&D projects after project completionDefinition: The indicator measures the total value of private invest-ment by supported enterprises to undertake R&D activities after the end of the supported project. This amount reflects the increase in private sector expenditure in R&D after project completion, mea-sured on annual basis up to 5 years after the grant period, excluding future grants awarded to the enterprise.Disaggregation: By investment purpose (cost categories); by S3 thematic priority area; by industryTarget: As assigned by the applicantDeadline for Achievement: 5 years from the date of project completionMoCV:• Verification: Post-implementation reports• Process: Target assigned during application phase; post-imple-
mentation reporting and assessment after 1, 3 and 5 years from project completion
AnAlysis of the CroAtiA smArt speCiAlizAtion strAtegy: logiCAl frAmework, instruments, And indiCAtor results 174

outcome Sales of new-to-firm innovation (as percentage of turnover)
assessmeNt• Revise indicator for clarity, given that all firm-level innovations are
new-to-firm; harmonize terminology across programs (i.e., using the word “revenue” instead of “turnover”) so that it specifies the stated outcome more clearly because the current indicator does not clearly define all the stated elements; combine two indica-tors with removal of the new-to-firm and new-to-market distinc-tion in order to enhance clarity and avoid measurement issues
• Revise definition for clarity and use OECD/Eurostat terminology in order to ensure standardization
• Revise MoCV to harmonize across indicators to enable more efficient data collection and analysis
RevisioNIndicator: Percentage of sales revenue from product innovationsDefinition: The indicator measures the percentage of total annual revenue from sales that can be attributed to the product innovation resulting from the supported project. A product innovation is the in-troduction of a good or service that is new or significantly improved with respect to its characteristics or intended uses. This includes sig-nificant improvements in technical specifications, components and materials, incorporated software, user friendliness, or other functional characteristics. Product innovations can utilize new knowledge or technologies or can be based on new uses or combinations of exist-ing knowledge or technologies. The term “product” is used to cover both goods and services. Product innovations include both the intro-duction of new goods and services and significant improvements in the functional or user characteristics of existing goods and services.Disaggregation: By S3 thematic priority areas; by industry; by mar-ket (domestic, international); by product type (goods, services); by product novelty (new, improved)Target: As assigned by the applicantDeadline for Achievement: 5 years from the date of project completionMoCV:• Verification: Post-implementation reports; supporting evidence• Process: Target assigned during application phase; post-imple-
mentation reporting and assessment after 1, 3 and 5 years from project completion
outcome Sales of new-to-market innovation (as percentage of turnover)
assessmeNt• Track as disaggregate of “Sales of new-to-firm innovation (as
percentage of turnover),” because “new-to-market” products are a sub-category of “new-to-firm” products (which refers to all product innovations introduced)
aPPEndix 175

outcome Increase in companies’ turnover compared to year of contracting
assessmeNt• Revise the indicator name to harmonize wording across indica-
tors and to introduce neutrality by referring to “change” instead of “increase”
RevisioNIndicator: Change in sales revenue after project completionDefinition: The indicator measures the value of change in sales revenue of the supported enterprises after project completion. The indicator is calculated as the difference between the value of sales revenue of the supported enterprises in the year preceding the sub-mission of the project application (baseline value) and the annual value of sales revenue up to five years after project completion (tar-get value), expressed in absolute numbers. Sales revenue is taken as annual gross sales revenue, which does not include any grant support received by the enterprise.Disaggregation:• Out of which: Change in revenue from sales abroad (export)Optional Measures:• Percentage change in sales revenue• Percentage change in revenue from sales abroadTarget: As assigned by the applicantDeadline for Achievement: 5 years from the date of project completionMoCV:• Verification: Post-implementation survey, annual financial state-
ments of enterprises• Process: Target assigned during application phase; post-imple-
mentation reporting and annual assessment up to 5 years from project completion
outcome Increase in share of turnover from exports compared to contracting year
assessmeNt• Use parent indicator “Increase in companies’ turnover compared
to year of contracting” and track as disaggregate measure, given that export revenue is part of turnover
AnAlysis of the CroAtiA smArt speCiAlizAtion strAtegy: logiCAl frAmework, instruments, And indiCAtor results 176

outcome Number of job positions in R&D created in enterprises by RDI projects after the end of funded project
assessmeNt• Revise indicator to harmonize across programs and combine
with similar indicators tracked by the project• Revise definition for clarity and to add details on measurement• Add disaggregation to reveal the demographics of researchers
hired by the enterprises for R&D work
RevisioNIndicator: Change in employment of researchers in enterprises af-ter project completionDefinition: The indicator measures the change in the gross number of full-time equivalent (FTE) researchers employed in the supported enterprises after project completion. The indicator is calculated as the difference between the number of researchers (FTE) in enterpris-es in the year preceding the submission of the project application (baseline value) and the number of researchers (FTE) up to five years after project completion (target value). Engagement of researchers employed less than full-time should be converted to the number of FTE employees by dividing the researchers’ scheduled hours by the number of hours in the full-time workweek.Disaggregation:• By gender• Out of which: Number of young researchers (research students,
PhD students, early-stage researchers) employed• Out of which: Vulnerable groups (minorities, migrants, disabled,
other disadvantaged persons)Target: As assigned by the applicantDeadline for Achievement: 5 years from the date of project completionMoCV:• Verification: Post-implementation reports; supporting evidence
(employment contracts)• Process: Target assigned during application phase; post-imple-
mentation reporting and assessment after 1, 3 and 5 years from project completion
aPPEndix 177

outcome Number of IP applications filed
assessmeNt• The indicator could be standardized with other indicators using
the indicator and definition described below, including disaggre-gation of filed and registered applications, because timeframe may vary based on the policy instruments’ support intensity or approach
RevisioNIndicator: Number of IPR applications filed Definition: Indicator refers to the number of IPR applications (in-cluding patents, trademarks, industrial designs, etc.) filed by the project beneficiary and partners involved in project implementation as a result of the research activities conducted in the scope of the financed project. Applicant should state the expected number of IPR applications in the project application. In the post-implemen-tation reporting phase, applicant should provide a description of a clear link between the conducted research activities and the IPR protection filed.Disaggregation: By type of IPR (patents, industrial design, trade-marks); by application status (filed, registered/approved); by type of procedure (national, international)Target: At least 1 per projectDeadline for Achievement: 5 years from the date of project completionOptional Measures:• Number of “patentability studies” conducted to verify and pro-
tect IP of project results (by outcome: project result patentable/not patentable)
MoCV:• Verification: Implementation and post-implementation reports;
supporting evidence (documentation verifying the IPR applica-tion and its status)
• Process: Target assigned during application phase; annual re-porting during project implementation period; post-implemen-tation reporting and assessment 1, 3 and 5 years after project completion
outcome Number of IP applications registered
assessmeNt• The indicator could be standardized with other indicators and
used as a disaggregate of “Number of IPR applications filed”
AnAlysis of the CroAtiA smArt speCiAlizAtion strAtegy: logiCAl frAmework, instruments, And indiCAtor results 178

outcome Number of start-ups/spin-offs/spin-outs originating from supported projects
assessmeNt• Use a parent indicator that is disaggregated to this indicator,
which is defined below:
Indicator: Number of technology transfer models realized due to project implementationDefinition: The indicator refers to transfers of research results (knowledge and technology) realized due to project implementa-tion with the purpose of their further development or their use in development and commercialization of new products (goods or services). Project results can be transferred from project beneficiary or partners to third parties in the form of signed R&D agreements or contracts and intellectual property (IP) licensing agreements, or the transfer can be realized through establishment of new enterprises. More specifically, the following are the types of technology transfer models captured (and disaggregated) by the indicator:• Number of new start-ups/spin-offs/spin-outs originating out
of supported projects: Number of new enterprises (start-up/spin-off/spin-out) established by project beneficiary or project partners as a result of funded project. A start-up is an enterprise less than 3 years old. A spin-off is an enterprise that has been started by a university group, but that has never left the univer-sity environment and perhaps exists to offer specialist consul-tancy services without the intention for any further expansion or full technology transfer. A spin-out is an enterprise in which the university or institute has an equity stake.
• Number of licensing agreements signed with the industry: The licensing agreement is a contract to be used by enterprises for technology transfer through granting rights of industrial owner-ship (license of patents and trademarks).
• Number of other technology transfer agreements signed with the industry: Any other forms of technology transfer or commer-cialization agreements signed with the enterprises.
• Number of contract research agreements with the industry.Disaggregation: By models of technology transfer (as listed in the definition)Target: As assigned by the applicantDeadline for Achievement: 5 years from the date of project completionMoCV:• Verification: Implementation and post-implementation reports;
supporting evidence (copies of contracts signed, formal docu-mentation on establishment of an enterprise, etc.)
• Process: Target assigned during application phase; annual re-porting during project implementation period; post-implemen-tation reporting and assessment 1, 3 and 5 years after project completion
aPPEndix 179

specific objective 4: upgRadiNg iN global value chaiN aNd pRomotiNg iNteRNa-tioNalizatioN of cRoatiaN eNteRpRises
SSO4.1: Benchmark of industrial sectors according to Global perspective, for purpose of better international positioning, focused policy defining and targeted investments in future
PI: Strategic project to support the Cluster Competitiveness Initiatives (Owner: Ministry of Economy and Sustainable Development)
output Number of companies receiving non-financial support
assessmeNt• Add a definition that specifies what non-financial supports are
to be tracked by the program• Use those specific non-financial support initiatives or measures
as disaggregates to track how many enterprises are being sup-ported through each type of initiative
output Number of implemented competitiveness cluster initiatives
assessmeNt• Define the indicator to describe qualifications of the initiatives
counted under this indictor• Use disaggregates to enable further analysis of the indicator• Clarify MoCV to ensure data for the indicator can be collected
and verified
output Number of identified potential new brands under STPA (sub-thematic priority areas)
assessmeNt• Define the indicator to set criteria for how program identifies
“potential new brands,” i.e., based on market-testing or market analysis, benchmarking with similar products, etc.
• Use disaggregates to enable further analysis of the indicator• Clarify MoCV to ensure data for the indicator can be collected
and verified
AnAlysis of the CroAtiA smArt speCiAlizAtion strAtegy: logiCAl frAmework, instruments, And indiCAtor results 180

output Number of companies / associations (competitiveness clusters) taking part in internationali-zation initiatives (fairs, exhibitions, trade visits)
assessmeNt• Simplify the indicator to count only “number of enterprises”
that took part in internationalization initiatives rather than “associations” because latter might not reveal how many com-panies benefitted
• Define the types of international initiatives in the definition (and not in the indicator) and add relevant disaggregates
• Set MoCV that helps to collect and verify data for the indicator
RevisioNIndicator: Number of enterprises that participated in internation-alization eventsDefinition: The indicator refers to the number of enterprises that participated at events organized for the purpose of internation-alization of the enterprises and for which support was provided through the program. Internationalization activities are appear-ances at events, fairs, business meetings, international project development workshops organized and aimed at international-ization of SMEs’ products.Disaggregation: By S3 priority areas, out of which newly estab-lished, by type of internationalization event (fairs/exhibition, trade visits, etc.)Target: As assigned by the applicantDeadline for Achievement: The date of project completion (final payment disbursement)MoCV:• Verification: Implementation reports; supporting evidence
(event programs, attendance signature lists with names and ID numbers of enterprises and persons representing them, event photos, invoices related to participation of companies at internationalization events)
• Process: Target assigned during application phase; progress tracked through implementation reports; assessment at ap-proval of final implementation report and final payment dis-bursement of individual projects
aPPEndix 181

outcome Number of collaborative contracted projects between companies and HEIs/PROs after the end of supported projects
assessmeNt• Use a parent indicator “Number of collaborative projects con-
tracted after project completion” that is disaggregated to this indicator, which is defined below:
RevisioNIndicator: Number of collaborative projects contracted after proj-ect completionDefinition: The indicator refers to the number of new collabora-tive research projects involving the beneficiary of the supported project and at least one other entity and contracted after the end of implementation of the supported project. The beneficiary orga-nization is involved as either the main beneficiary or a partner in the implementation of the new projects contracted.Disaggregation: By collaboration novelty (new, existing); by type of partner (research organization, enterprise, other); by partner origin (domestic, foreign, diaspora); by type of research (basic, applied, ex-perimental development); by science area; by science field; by fund-ing source (national, EU, private, other); by S3 thematic priority areaTarget: As assigned by the applicantDeadline for Achievement: 5 years from the date of project completionMoCV: • Verification: Post-project implementation reports providing
information on project beneficiary and partners, date of con-tract award, project value and funding source, short descrip-tion of objectives and activities, links to web pages providing additional information (if applicable)
• Process: Target assigned during application phase; post-im-plementation reporting and assessment 1, 3 and 5 years after project completion
AnAlysis of the CroAtiA smArt speCiAlizAtion strAtegy: logiCAl frAmework, instruments, And indiCAtor results 182
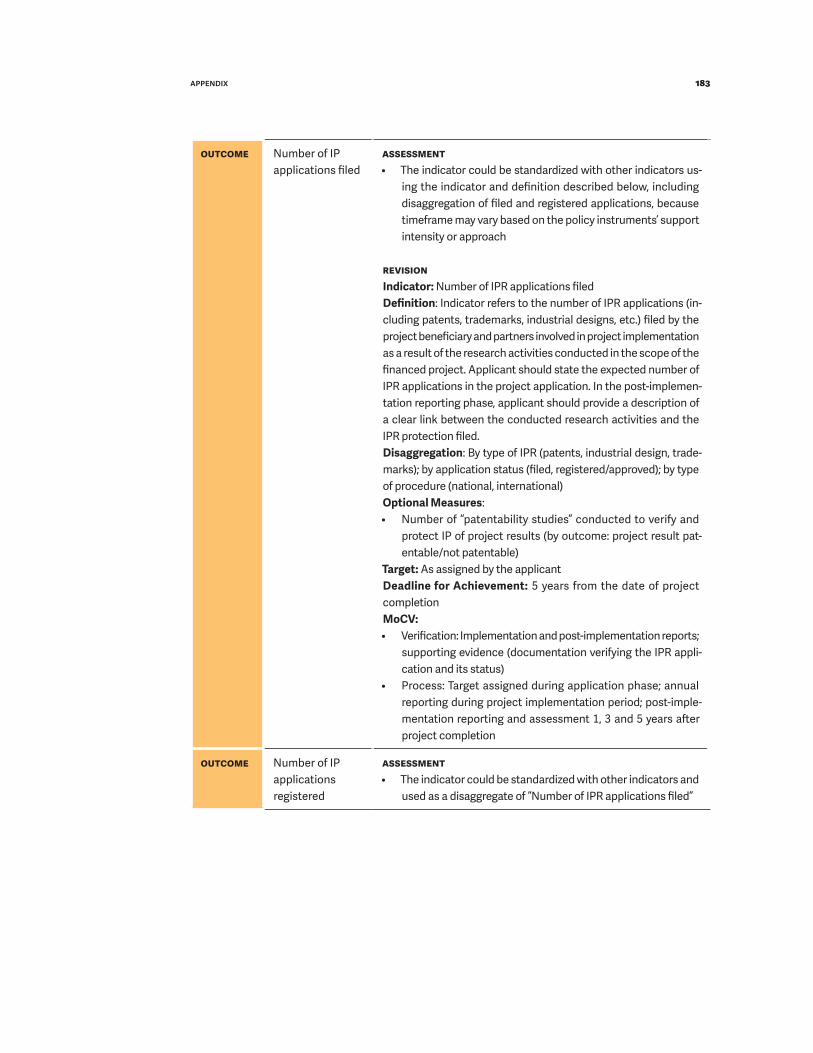
outcome Number of IP applications filed
assessmeNt• The indicator could be standardized with other indicators us-
ing the indicator and definition described below, including disaggregation of filed and registered applications, because timeframe may vary based on the policy instruments’ support intensity or approach
RevisioNIndicator: Number of IPR applications filed Definition: Indicator refers to the number of IPR applications (in-cluding patents, trademarks, industrial designs, etc.) filed by the project beneficiary and partners involved in project implementation as a result of the research activities conducted in the scope of the financed project. Applicant should state the expected number of IPR applications in the project application. In the post-implemen-tation reporting phase, applicant should provide a description of a clear link between the conducted research activities and the IPR protection filed.Disaggregation: By type of IPR (patents, industrial design, trade-marks); by application status (filed, registered/approved); by type of procedure (national, international)Optional Measures:• Number of “patentability studies” conducted to verify and
protect IP of project results (by outcome: project result pat-entable/not patentable)
Target: As assigned by the applicantDeadline for Achievement: 5 years from the date of project completionMoCV:• Verification: Implementation and post-implementation reports;
supporting evidence (documentation verifying the IPR appli-cation and its status)
• Process: Target assigned during application phase; annual reporting during project implementation period; post-imple-mentation reporting and assessment 1, 3 and 5 years after project completion
outcome Number of IP applications registered
assessmeNt• The indicator could be standardized with other indicators and
used as a disaggregate of “Number of IPR applications filed”
aPPEndix 183

outcome Sales of new-to-firm innovation (as percentage of turnover)
assessmeNt• Revise indicator for clarity, given that all firm-level innova-
tions are new-to-firm; harmonize terminology across programs (i.e., using the word “revenue” instead of “turnover”) so that it specifies the stated outcome more clearly because the cur-rent indicator does not clearly define all the stated elements; combine two indicators with removal of the new-to-firm and new-to-market distinction in order to enhance clarity and avoid measurement issues
• Revise definition for clarity and use OECD/Eurostat terminol-ogy in order to ensure standardization
• Revise MoCV to harmonize across indicators to enable more efficient data collection and analysis
RevisioNIndicator: Percentage of sales revenue from product innovationsDefinition: The indicator measures the percentage share of total annual revenue from sales that can be attributed to the product innovation resulting from the supported project. A product inno-vation is the introduction of a good or service that is new or signifi-cantly improved with respect to its characteristics or intended uses. This includes significant improvements in technical specifications, components and materials, incorporated software, user friendliness, or other functional characteristics. Product innovations can utilize new knowledge or technologies or can be based on new uses or combinations of existing knowledge or technologies. The term
“product” is used to cover both goods and services. Product inno-vations include both the introduction of new goods and services and significant improvements in the functional or user character-istics of existing goods and services.Disaggregation: By S3 thematic priority areas; by industry; by mar-ket (domestic, international); by product type (goods, services); by product novelty (new, improved)Target: As assigned by the applicantDeadline for Achievement: 5 years from the date of project completionMoCV:• Verification: Post-implementation reports; supporting evidence• Process: Target assigned during application phase; post-im-
plementation reporting and assessment after 1, 3 and 5 years from project completion
AnAlysis of the CroAtiA smArt speCiAlizAtion strAtegy: logiCAl frAmework, instruments, And indiCAtor results 184

outcome Sales of new-to-market innovation (as percentage of turnover)
assessmeNt• Track as disaggregate of “Sales of new-to-firm innovation (as
percentage of turnover)” because “new-to-market” products are a sub-category of “new-to-firm” products (which refers to all product innovations introduced)
outcome Increase in companies’ turnover compared to year of contracting
assessmeNt• Revise the indicator name to harmonize wording across in-
dicators and to introduce neutrality by referring to “change” instead of “increase”
RevisioNIndicator: Change in sales revenue after project completionDefinition: The indicator measures the value of change in sales revenue of the supported enterprises after project completion. The indicator is calculated as the difference between the value of sales revenue of the supported enterprises in the year preceding the submission of the project application (baseline value) and the annual value of sales revenue up to five years after project comple-tion (target value), expressed in absolute numbers. Sales revenue is taken as annual gross sales revenue, which does not include any grant support received by the enterprise.Disaggregation:• Out of which: Change in revenue from sales abroad (export)Optional Measures:• Percentage change in sales revenue• Percentage change in revenue from sales abroadTarget: As assigned by the applicantDeadline for Achievement: 5 years from the date of project completionMoCV:• Verification: Post-implementation survey, annual financial state-
ments of enterprises• Process: Target assigned during application phase; post-im-
plementation reporting and annual assessment up to 5 years from project completion
outcome Increase in share of turnover from exports compared to contracting year
assessmeNt• Use parent indicator “Increase in companies’ turnover compared
to year of contracting” and track as disaggregate measure, giv-en that export revenue is part of turnover
aPPEndix 185

specific objective 5: woRKiNg iN paRtNeRships to addRess social iNNovatioN
SSO5.1: Support to social innovation
PI: Support to social innovation (Owner: Ministry of Economy and Sustainable Development)
(no indicator mentioned) n/a
specific objective 6: cReatiNg smaRt sKills – upgRadiNg the qualificatioNs of eXistiNg aNd New woRK foRce foR smaRt specializatioN
SSO6.1: Improving tools for smart skills policies
PI: Improving the system of lifelong professional guidance and career development in the Republic of Croatia (Owner: Ministry of Labor, Pension System, Family and Social Policy)
output Development of new econometric forecasting model/system and foresight
assessmeNt• The current indicator reads more like a milestone action; as
such, it can be further defined as an indicator in the following way to specify approval of the model or system for application
– “Number of new econometric forecasting models or systems for smart skills policies approved for application”
• Target can be set as per anticipated number of such models or systems to be developed
output Number of new or improved services supported in development and implementation
assessmeNt• Revise the indicator to improve clarity and specificity on what
types of services are tracked by the indicator
PI: Implementing the Croatian Qualification Framework and development of tools for connecting education and labor market (Owner: Ministry of Labor, Pension System, Family and Social Policy)
output Number of occupational standards in line with CROQF developed, based on which new educational programs will be aligned with labor market needs
assessmeNt• Define the indicator with additional information, particularly
on what comprises occupational standards (versus “education programs/qualification standards” captured through another indicator); the process that determines whether such standards are developed “in line with CROQF” should also be elaborated to ensure there is consistent interpretation of the indicator
AnAlysis of the CroAtiA smArt speCiAlizAtion strAtegy: logiCAl frAmework, instruments, And indiCAtor results 186

PI: Implementing the Croatian Qualification Framework on higher-education level (Owner: Ministry of Science and Education)
output Number of education programs/qualifications standards in line with CROQF developed
assessmeNt• The indicator can be revised to clarify any distinction suggested
between “programs” and “qualifications standards”; if the two elements are substantially different, then it is more reasonable to separate them into two indicators or use a parent indicator that can be disaggregated into these two elements
• Define the indicator to clarify the types of education programs or qualification standards that are covered by the indicator; the process that determines whether such programs/standards are developed “in line with CROQF” should also be elaborated to ensure there is consistent interpretation of the indicator
output Number of qualification standards in the CROQF register developed, based on which new educational programs will be aligned with labor market needs
assessmeNt• Define the indicator with additional information, particularly
on what the “CROQF register” entails if it is not commonly un-derstood; clarify whether, if certain qualification standards are revised through program efforts, that would need to be captured; specify the target and timeframe for monitoring the change
SSO6.2: Development and upgrading of smart skills within education system (at all levels - vocational trainings, higher education and adult learning programs)
PI: STEM student scholarships (Owner: Ministry of Science and Education)
output Number of students awarded with scholarships
assessmeNt• Define indicator further and add disaggregates, along with MoCV
that will be used to collect and verify information
RevisioNDefinition: The indicator refers to the number of undergraduate and graduate students awarded with scholarships, as well as those in integrated undergraduate and graduate studies in priority areas, such as STEM. STEM areas refer to biotechnical, technical, biomed-ical, natural sciences, and ICT-related study programs (informatics, business informatics, information science, and informatology). The indicator value is calculated on annual basis.Disaggregation: By level of study program (undergraduate, grad-uate, integrated undergraduate and graduate); by STEM area (bio-technical, technical, biomedical, natural sciences, ICT); by gender• Out of which: Vulnerable groups (minorities, migrants, disabled,
other disadvantaged persons)
aPPEndix 187

outcome Completion rate of students who received scholarships
assessmeNt• Define indicator further and add disaggregates, along with MoCV
that will be used to collect and verify information
RevisioNDefinition: The indicator refers to the share of students who re-ceived scholarships through the program and successfully finished their studies in due time (without pausing or repeating any years) in the total number of students who received scholarships and are due to finish the studies in a particular year. The indicator value is calculated on yearly basis, taking into account the number of years needed to finish a particular study program.Disaggregation: By level of study program (undergraduate, grad-uate, integrated undergraduate and graduate); by STEM area (bio-technical, technical, biomedical, natural sciences, ICT)Target: As set by the programDeadline for Achievement: 5 years from the date of project completionMoCV:• Verification: Enrollment data provided by HEIs to MSE• Process: Information collected and processed on yearly basis,
starting 3 years after project commencement and up to 5 years after project completion
PI: Career development of young researchers (PhD education) (Owner: Ministry of Science and Education)
output Number of fellowships for training and career development of researchers on doctoral and postdoctoral level
assessmeNt• Define indicator further and add disaggregates, along with
MoCV that will be used to collect and verify information
outcome Number of young researchers who gained doctoral (PhD) degree
assessmeNt• Specify in the indicator whether “number of young re-
searchers” refers to only to those that were supported through the program
outcome Number of persons who in the reference year acquired a PhD degree in STEM areas
assessmeNt• Specify in the indicator if “number of persons” refers to only
scholarship recipients to avoid confusion• Define what constitutes STEM areas; the definition can be
harmonized with other indicators by using the following de-scription of STEM areas: “STEM areas refer to biotechnical, technical, biomedical, natural sciences, and ICT-related study programs (informatics, business informatics, information science, and informatology).”
AnAlysis of the CroAtiA smArt speCiAlizAtion strAtegy: logiCAl frAmework, instruments, And indiCAtor results 188

PI: Modernization of vocational education and training programs and raising their quality to increase students’ employability and opportunities for further education (Owner: Ministry of Science and Education)
output Number of Sectoral curricula for vocational education and training based on learning outcomes in targeted sectors developed
assessmeNt• Define the indicator with additional information. The phrase
“sectoral curricula for VET based on learning outcomes” should be elaborated with relevant examples to improve clarity of what is intended by the indicator. The “targeted sectors” should be listed in the definition and used for dis-aggregation to enable more in-depth analysis of sectoral gaps in curriculum development. The indicator definition should specify whether “developed” should be interpreted to capture those curricula that are “implemented” or applied in VET; if both developed and implemented curricula are to be tracked, then the indicator can be kept as “developed” and a disaggregated indicator can be added that reads “out of which – implemented”
outcome Percentage of vocational schools in which newly developed VET curricula based on learning outcomes in targeted sectors are implemented (y1);
assessmeNt• Define the indicator with additional information. The phrase
“sectoral curricula for VET curricula based on learning out-comes” should be elaborated with relevant examples to improve clarity of what is intended by the indicator. The
“targeted sectors” should be listed out in the definition and used for disaggregation to enable more in-depth analysis of sectoral gaps in curricula development
aPPEndix 189

deliveRy iNstRumeNt (di) (oRigiNal)
way of implemeNtatioN (wi) (oRigiNal)
policy iNstRumeNt (pi) (Revised) 29
di01 Increase RDI ability for conducting top quality research and cooperation on national and international level
wi05 Grant scheme for development of project documentation “Project pipeline preparation for European Regional Development Fund 2014 – 2020” (restricted)
pi02 Preparation of RDI infrastructural projects
wi06 Grant scheme for infrastructure of R&D sector “Investments into organizational reform and infrastructure of RDI sector” (restricted)
pi03 Investment into organizational reform and infrastructure of RDI sector
pi04 Croatian Scientific and Educational Cloud (HR-ZOO)
pi05 Center for advanced laser techniques (CALT)
pi06 Children Centre for Translational Medicine at the Children’s Hospital Srebrnjak
pi07 Open scientific infrastructural platforms for innovative applications in economy and society – O-ZIP
28 The numeration of the elements in the table follows the order in which they are listed/labeled in the adopted S3 document (for Delivery Instruments and Ways of Implementation), and S3 Action Plan 2019–2020 (for Policy Instruments).
29 The 19 “Main” Policy Instruments are listed in italic. The concept of “Main” instruments is described in section 2.3.
II. Structure and evolution of S3 policy mix
The S3 policy mix was transformed by replacing the initial categories of “delivery in-struments” (DI) and “ways of implementation” (WI) with a single category of “policy instruments” (PI). However, there appears to be no formal document available that would establish clear connections between the DIs and WIs in the original structure (from the ad-opted S3 document) and the PIs in the revised set-up (from the S3 Action Plan 2019–2020). The connections of DIs and WIs with PIs presented in this table were therefore introduced by the authors based on their own interpretation of the available descriptions of partic-ular elements and the indicators linked with them in the original and revised structure. It is, however, worth noting that in some cases the descriptions of the elements are not entirely clear, and the possible linkages appear somewhat ambiguous.
Table II.1 S3 Policy Mix in the official S3 document and S3 Action Plan 2019-202028
AnAlysis of the CroAtiA smArt speCiAlizAtion strAtegy: logiCAl frAmework, instruments, And indiCAtor results 190

deliveRy iNstRumeNt (di) (oRigiNal)
way of implemeNtatioN (wi) (oRigiNal)
policy iNstRumeNt (pi) (Revised)
wi07 Grant scheme “Enabling synergies with HORIZON 2020 through infrastructural investment”- “Enabling synergies with HORIZON 2020 initiatives for spreading excellence: Teaming, Twinning and ERA chairs” (open)
pi08 Development and strengthening synergies with HORIZON 2020 horizontal activities: Twinning and ERA chairs
pi09 Development and strengthening synergies with HORIZON 2020 horizontal activities: Teaming
di02 Strengthening research excellence by supporting national Centers of Research Excellence and enabling synergies with ERC grants
wi14 Grant scheme supporting national Centers of Research Excellence (restricted)
pi10 Centers of Research Excellence performing excellent science
wi15 Grant scheme enabling synergies with ERC grants (open)
N/a30
di03 Support to research organizations conducting R&D&I projects directed towards the needs of economy
wi12 Grant scheme Strengthening capacities for research, development and innovation- R&D collaboration projects (open)
pi18 Strengthening capacities for research, development and innovation
wi13 Grant scheme “Science and Innovation Investment Fund” (open)
pi16 Science and Innovation Investment Fund
di04 Project “Science and Technology Foresight”
wi02 Strategic project Science and Technology Foresight project
pi01 Science and Technology Foresight
di05 Development of Innovation Network for Industry and creation of Thematic Innovation Platforms
wi01 Strategic project Establishment of Innovation Network for Industry and development of Thematic Innovation Platforms
pi22 Establishment of Innovation Network for Industry and Thematic innovation Councils
30 According to the Report on S3 Implementation in the period 2016–2018, this grant scheme was cancelled because there were no eligible applicants (existing ERC grantees).
aPPEndix 191

deliveRy iNstRumeNt (di) (oRigiNal)
way of implemeNtatioN (wi) (oRigiNal)
policy iNstRumeNt (pi) (Revised)
di06 Creation of Centers of Competence
wi08 Grant scheme for Centers of Competence (open)
pi19 Supporting development of Competence Centers
di07 Strengthening links between scientific and business sector through support to Technology Transfer Offices and Science Technology Parks
wi03 Grant scheme for Technology Transfer Offices Program (open call)
pi20 Transfer of technology from ROs to business sector - Support to TTOs + STPII TTO support program
wi04 Grant scheme for Science-Technology Parks Program (open call)
N/a31
di08 Support to business investment in RDI
wi09 Grant scheme for business investment in RDI (open)
pi23 Support to development of new products/services resulting from R&D activities (Phase I)
pi24 Support to development of new products/services resulting from R&D activities (Phase II)
di09 Support to SMEs capacities to innovate
wi10 Support to SMEs capacities to innovate (grant scheme)
pi25 Innovations in S3 areas
pi26 Integrator
di10 Competitiveness Cluster initiatives
wi16 Strategic Project Support to competitiveness cluster initiatives
pi35 Strategic project to support the Cluster Competitiveness Initiatives
di11 Support to social innovation
wi11 TA project (OECD) – The Croatia Social Innovation Project
pi36 Support to development of social innovation (OECD Technical Assistance Project: Social Innovation in Croatia)
31 According to the Report on S3 Implementation in the period 2016–2018, this grant scheme was cancelled because at the time there was no national strategy or policy on STPs.
AnAlysis of the CroAtiA smArt speCiAlizAtion strAtegy: logiCAl frAmework, instruments, And indiCAtor results 192

deliveRy iNstRumeNt (di) (oRigiNal)
way of implemeNtatioN (wi) (oRigiNal)
policy iNstRumeNt (pi) (Revised)
di12 Establishing infrastructure for smart skills policies
wi17 Establishing infrastructure for smart skills policies (Direct Award Procedure)
pi37 Implementation of The Strategy for Lifelong Guidance and Career Development in the Republic of Croatia 2016-2020
pi40 STEM student scholarships
pi41 Career development of young researchers (PhD education)
di13 Additional instruments put in place for assessing medium term skill needs
wi18 Medium term tools for skill assessment at the level of competences (Grant scheme - open call)
pi42 Modernization of vocational education and training programs and raising their quality to increase students’ employability and opportunities for further education
di14 Implementing the Croatian Qualification Framework mechanism for delivering timely and standardized training programs based on future and medium-term skill needs
wi19 Implementing the Croatian Qualification Framework mechanism for delivering timely and standardized training programs based on future and medium-term skill needs (direct award procedure)
pi38 Implementing the Croatian Qualification Framework and development of tools for connecting education and labor market
pi39 Implementing the Croatian Qualification Framework on Higher Education level
aPPEndix 193

policy iNstRumeNts (pi) (coNt.)32 (Revised)
pi11 Research projects of Croatian Science Foundation (all fields of science) – basic and applied re-search conducted by a recognizable research group
pi12 Installation Research program of Croatian Science Foundation (all fields of science)*
pi13 Croatian-Swiss Research Programme 2017 – 2023 (CSRP) – all fields of science*
pi14 Young Researchers’ Career Development Programme (all fields of science)
pi15 Program for enhancing R&D climate change activities*
pi17 Second Science and Technology Project (STPII) – POC public*
pi21 Research infrastructure usage and researchers’ services for SMEs (STPII IRCRO program)*
pi27 Innovations of newly established SMEs (Phase I)
pi28 Innovations of newly established SMEs (Phase II)
pi29 Commercialization of Innovation in Entrepreneurship
pi30 Innovation Vouchers
pi31 EUREKA*
pi32 EUROSTARS*
pi33 Proof of technological feasibility and commercialization capacity of innovative product/technol-ogy/service at SMEs (STPII – PoC private)*
pi34 Support for RDI activities of SMEs for their technological upgrade and global competitiveness (STPII – RAZUM program)*
32 Some of the Policy Instruments listed in this section were included in the S3 document under “Additional Sources of Funding” (as per Annex 5 of the S3) and thus are not linked with particular DIs or WIs. In other cases, they appear to have not been included in the original S3 structure at all. (The latter are marked with asterisks.)
Source: Staff elaboration based on the adopted S3 document and S3 Action plan 2019-2020
AnAlysis of the CroAtiA smArt speCiAlizAtion strAtegy: logiCAl frAmework, instruments, And indiCAtor results 194

III. Status of results indicators
This appendix provides an overview of the indicators and their achievement at the end of 2020, both for the original set of S3 indicators and the indicators revised or added during implementation. As elaborated in the section 2.4 of the report, each of the three indicator types from the S3 document (output, outcome, and context) were in some form revised or expanded during implementation. Tables III.1, III.3, III.5 and III.7 present output, outcome, context and TPA-level context indicators from the original S3 document and their current values. Tables III.2, III.4 and III.6 present the results of revised output, outcome and context indicators. According to stakeholders involved in the data collection process, in some cases the initial set of indicators is not tracked anymore and is fully replaced by the revised version. However, since revised versions do not have targets assigned for any of the indicators, there are no reference values for assessing progress compared to expectations.
Reported values may be underestimated in cases where the indicator is not tracked for instruments that could contribute to generating the same results. Some indicators are not tracked in all instruments that likely contribute to the achievement of the same results. One obvious example is the output indicator “Number of RDI projects conducted by research organizations”. The indicator is tracked for a single instrument (“Support to research organizations conducting R&D projects directed towards the needs of econo-my”) that covers two grant scheme programs. It is obvious, however, that a lot of other S3 instruments also support research organizations in conducting RDI projects, so the actual achievement in this sense is likely higher and the value reported in the table does not accurately reflect the progress achieved. Nevertheless, if the list of instruments connected with an indicator is expanded, target values need to be revised, as they were initially set based on specific instruments. In some cases, there is room for streamlining and harmonizing indicators. Some specific suggestions for this are provided in Appendix I “Indicator-specific recommendations”.
Data collection was conducted as a joint effort of the S3 IWG members, the TS, and the World Bank team. Data was collected at the level of individual delivery instruments con-tributing to indicator achievement, which was then aggregated by the World Bank team. Initially, there was an attempt to obtain the data through the TS. And, while a lot of the data was available in various different formats, not everything was there as envisaged in the S3. For the purpose of completeness, the alternative approach was to ask the IWG members representing the institutions responsible for the relevant instruments (MSE, MESD, and MLSP) to verify the data provided by the TS and add and amend as needed. The TS also provided data on the progress of context indicators. The data collection for progress at TPA level required an additional effort, in which MSE, MESD, MLSP and HAMAG-BICRO provided data for programs under their responsibility, while the World Bank team aggre-gated the data across different institutions. The data was aggregated “as delivered” by the aforementioned institutions, with only minor technical modifications needed for aggrega-tion purposes in some cases. In other words, neither the methodology of measurement nor the reported values were questioned or additionally verified by the World Bank team.
28 29 30 31 32
aPPEndix 195

Challenges related to measurement of TPA-level progress persist. A significant number of indicators have missing values, especially at TPA level. These mostly relate to programs that did not require applicants and projects to be aligned with S3 TPAs, but were included in the S3 as “additional funding sources”. Examples of such programs are innovation pro-grams of the MESD. According to the S3 document, the contribution of such programs to the S3 was estimated at 25 percent of funding. However, for such programs, progress on TPA level is in most cases not monitored and the TPA contribution is not estimated. Therefore, all results reported by such instruments are included as part of the overall val-ues, but aggregated TPA values may be underestimated. This means that the progress shown is not directly linked with S3 priorities. In this context, the practice varies across the responsible institutions. One indicative effort are the instruments directly managed by HAMAG-BICRO. Funding provided through those programs was disbursed to bene-ficiaries regardless of whether their project proposals were aligned with an S3 TPA or not, provided that they satisfied the eligibility and selection criteria set for the programs. While alignment of the funded projects with the S3 TPAs was not known at the moment of awarding the grant contracts, this was determined ex post. This approach allowed for tracking of TPA-level progress by aggregating project-level indicator achievement of the TPA-aligned projects.
In cases where TPA progress is monitored, the approach varies across responsible institutions, and should be harmonized going forward. For example, MESD favors the approach of attributing a single project to a single TPA area, while the MSE takes more in-depth approach and assumes that a single project may contribute to multiple TPAs by considering contribution at STPA level.33 Additionally, there appears to be a difference in opinion across the institutions on whether particular indicators can be tracked on TPA level or not. Some institutions provided indicator values disaggregated at TPA level while other institutions provided only overall values for the same indicator and stated that dis-aggregation was not applicable. As a result, in some cases there is a discrepancy between the sum of reported TPA values and the total value. More precisely, the total achieved values shown in the tables are in some cases higher than the sum of values for the five TPAs. The difference refers either to progress that is not attributed to any of the S3 TPAs, or the data on S3 alignment is not available. Going forward, the institutions involved in the S3 should agree on a common approach for measuring and monitoring results at TPA level, as this is crucial for early detection of bottlenecks, which can ultimately affect the success of the strategy.
33 The MSE estimates the contribution to each TPA by associating an equal share of each project to relevant STPAs, aggregating shares at TPA level, and applying TPA-level shares to overall project results. For example, if a project contributes to a total of 3 STPAs, then each STPA is associated with 1/3 or 33 percent of project achievements. If two of the three STPAs contribute to a single TPA, then 66 percent of the results (33 percent plus 33 percent) of the project is associated with that TPA. This approach yields TPA results that are expressed as decimal numbers, even though the overall result is measured as a whole number.
AnAlysis of the CroAtiA smArt speCiAlizAtion strAtegy: logiCAl frAmework, instruments, And indiCAtor results 196

output iNdicatoRs
Output indicators are assigned to delivery instruments and tracked up to 2023. The status of output indicators as originally defined in the S3 is presented in Table III.1. As discussed earlier in the report, a single delivery instrument is in some cases comprised of several programs, whereas in other cases it may refer only to a single program, or even project. On the other hand, the same indicator may be assigned to more than one delivery instrument, with separate target values set for each of them. All output indicators have a baseline value set to zero, whereas the target value is set for the year 2023. In most cases, the S3 document envisaged disaggregation of indicators at TPA level.
Data is missing for some indicators, mostly related to TPA level disaggregation. Empty fields in Table III.1 denote missing values, while data that was not envisaged to be collected at TPA level is marked with “n/a”. TPA level data is missing for programs that did not require alignment with S3 TPAs as the eligibility condition for providing funding. The methodology for TPA disaggregation varies across programs. For some programs, each project and its outputs are assigned to a single TPA. For other programs, TPA progress is estimated by taking into account multiple STPAs that a project is expected to be contributing to.
The revised set of output indicators introduced during implementation provides expand-ed information on program achievements, but progress will be difficult to assess as it is not linked to any target values. The status of revised output indicators is presented in Table III.1. The revised S3 monitoring framework expanded the original set of indicators, as well as the list of programs for which they are tracked. Existing indicators were modified, new indicators were added, and some indicators were dropped. Again, some indicators are tracked for multiple instruments that contribute to different objectives. In Table III.2, the data related to such indicators is presented as an aggregate value, with reference to all strategic objectives that the indicator is linked to.34 While baseline values for all indi-cators are set to zero, targets are not set at all.
The data on overall progress is available for all indicators, but monitoring of TPA-level progress varies across programs and institutions managing them. For some indicators, the aggregated progress was achieved by instruments managed by different institutions. As a result of different practices, data on TPA progress for such indicators is missing in many cases, given that not all institutions track progress at TPA level. For most programs that supported projects beyond the S3 TPAs, TPA progress was not assessed, and the data is not available.
34 For simplification purposes, the instruments contributing to the achievement of the indicators are not listed.
aPPEndix 197

Table III.1 Progress on S3 output indicators (2020)
status (2020)
specific strategic objective
delivery instrument indicator baseline value (2016)
target value (2023)
total tpa 1: health and quality of life
tpa 2: energy and sustainable environment
tpa 3: transport and mobility
tpa 4: security tpa 5: food and bioeconomy
so1 Strategic Project ‘Science and Technology Foresight’
Legal framework for collection and management of RDI data in research organizations developed
0 1 0 n/a n/a n/a n/a n/a
so1 Strategic Project ‘Science and Technology Foresight’
Reports and common vision (foresight) developed
0 1 0 n/a n/a n/a n/a n/a
so1 Strategic Project ‘Science and Technology Foresight’
Web based user interface for input, manage-ment and analysis of data developed and productive Maps and visualization of defined research disciplines and technology areas
0 1 0 n/a n/a n/a n/a n/a
so1 Support to research organizations conducting R&D projects directed towards the needs of economy
Number of enterprises cooperating with research organizations (CO26) 0 30 32 6.93 16.66 3.58 2.95 1.87
so1 Strengthening research excellence by suppor-ting National Centres of Research Excellence and enabling synergies with ERC grants
Number of National Centres of Research Excellence’ projects supported 0 6 10 5 1.58 0.5 1 1.92
so1 Increase R&D ability for conducting top quality research and cooperation on national and international levels
Number of RDI infrastructure projects0 6 32 11.59 10.81 2.18 2.32 5.06
so1 Support to research organizations conducting R&D projects directed towards the needs of economy
Number of RDI projects conducted by ROs0 75 0 0 0 0 0 0
so1 Increase R&D ability for conducting top quality research and cooperation on national and international levels
Number of researchers working in improved research infrastructure facilities (CO25) 0 1,215 123.5 69.49 19.11 15.78 7.89 11.22
so1 Strengthening research excellence by suppor-ting National Centres of Research Excellence and enabling synergies with ERC grants
Number of researchers working in supported CoRE 0 210 599 303.17 80.75 23 78 114.08
so1 Strengthening research excellence by suppor-ting National Centres of Research Excellence and enabling synergies with ERC grants
Number of supported projects enabling synergies with ERC grants 0 3 6 1 1.83 0.33 0.83 2
so1 Increase R&D ability for conducting top quality research and cooperation on national and international levels
Number of supported Teaming, Twinning and ERA chair projects 0 3 6 1 1.83 0.33 0.83 2
so1 Strengthening research excellence by suppor-ting National Centres of Research Excellence and enabling synergies with ERC grants
Share of funding of CoRE as % of public funding of R&D 0 3.60%
4.195% (2019)
n/a n/a n/a n/a n/a
analysis of the croatia smart specialization strategy: logical framework, instruments, and indicator results appendix198 199

status (2020)
specific strategic objective
delivery instrument indicator baseline value (2016)
target value (2023)
total tpa 1: health and quality of life
tpa 2: energy and sustainable environment
tpa 3: transport and mobility
tpa 4: security tpa 5: food and bioeconomy
so2 Support to the development of Centers of Competence
Number of enterprises cooperating with research organizations (CO26)
0 30 39 4 0 18 5 12
so2 Support to the development of Centers of Competence
Number of enterprises supported to introduce new to the firm products (CO29)
0 70 44 4 0 20 6 14
so2 Support to the development of Centers of Competence
Number of enterprises supported to introduce new to the market products (CO28)
0 30 44 4 0 20 6 14
so2 Strategic Project for Support to Establishment of the Innovation Network for the Industry and Thematic Innovation Platforms
Number of established Thematic innovation councils 0 5 5 1 1 1 1 1
so2 Strategic Project for Support to Establishment of the Innovation Network for the Industry and Thematic Innovation Platforms
Number of established web innovation platforms 0 1 1
so2 Strategic Project for Support to Establishment of the Innovation Network for the Industry and Thematic Innovation Platforms
Number of identified strategic projects under Thematic innovation platforms 0 25
so2 Support to the development of Centers of Competence
Number of new researchers working in supported entities (CO24)
0 30 146 31 0 70 13 32
so2 Strategic Project for Support to Establishment of the Innovation Network for the Industry and Thematic Innovation Platforms
Number of prepared Thematic Strategies for RDI 0 5 0
so2 Support to the development of Centers of Competence
Number of R&D projects supported0 100 9 1 0 2 2 4
so2 Strengthening links between scientific and business sector by supporting Technology Transfer Offices and Science-Technology Parks
Number of RO’s employees trained (in topics related to knowledge and technology transfer)
0 720
so2 Strengthening links between scientific and business sector by supporting Technology Transfer Offices and Science-Technology Parks
Number of supported science and technology parks 0 4
so2 Strengthening links between scientific and business sector by supporting Technology Transfer Offices and Science-Technology Parks
Number of TTO agreements/contracts0 330
so2 Support to the development of Centers of Competence
Private investment matching public support in innovation or R&D projects (CO27)
0 € 30,000,000.00 € 39,831,457.10 € 944,134.01 € - € 18,455,755.27 € 4,652,744.86 € 15,778,822.96
so3 Support to business investments in RDI Number of enterprises cooperating with research organizations (CO26)
0 100 126 17 54 28 19 8
so3 Support to business investments in RDI Number of enterprises receiving grants (CO02) 0 400 35 5 11 11 6 2
analysis of the croatia smart specialization strategy: logical framework, instruments, and indicator results appendix200 201

status (2020)
specific strategic objective
delivery instrument indicator baseline value (2016)
target value (2023)
total tpa 1: health and quality of life
tpa 2: energy and sustainable environment
tpa 3: transport and mobility
tpa 4: security tpa 5: food and bioeconomy
so3 Support to business investments in RDI Number of enterprises supported to introduce new to the firm products (CO29)
0 330 166 25 55 42 33 11
so3 Support to strengthening SMEs’ capacities to innovate
Number of enterprises supported to introduce new to the firm products (CO29)
0 83 388 23 50 23 20 16
so3 Support to business investments in RDI Number of enterprises supported to introduce new to the market products (CO28)
0 70 162 25 53 41 33 10
so3 Support to strengthening SMEs’ capacities to innovate
Number of enterprises supported to introduce new to the market products (CO28)
0 36 372 23 47 24 20 13
so3 Support to business investments in RDI Number of R&D projects supported 0 500 32 4 12 10 4 2
so3 Support to business investments in RDI Private investment matching public support in innovation or R&D projects (CO27)
0 € 136,666,666.66 € 100,302,933.37 € 13,854,898.84 € 34,646,078.93 € 21,156,848.21 € 20,357,881.45 € 10,287,225.95
so4 Strategic Project for Support to Competitiveness Clusters Initiatives
Number of companies/associations (competitiveness clusters) taking part in internationalization initiatives (fairs, exhibitions, trade visits)
0 12 0
so4 Strategic Project for Support to Competitiveness Clusters Initiatives
Number of identified new brands under STPAs 0 13 0
so4 Strategic Project for Support to Competitiveness Clusters Initiatives
Number of implemented competitiveness cluster initiatives
0 15 0
so5 Support to social innovation Number of social innovation projects 0 3
so6 Establishing infrastructure for smart skills policies
Development of new econometric forecasting model
0 2 0
so6 Implementing the Croatian Qualification Framework mechanism for delivering timely and standardized training programs based on future and medium-term skill needs
Number of adult learners awarded with vouchers
0 10,000 1,610
so6 Implementing the Croatian Qualification Framework mechanism for delivering timely and standardized training programs based on future and medium-term skill needs
Number of education programs/qualifications standards in line with CROQF developed
0 200 0
so6 Establishing infrastructure for smart skills policies
Number of fellowships for training and career development of researchers on doctoral and postdoctoral level
0 40 177
so6 Establishing infrastructure for smart skills policies
Number of persons who in the reference year acquired a PhD degree in STEM areas
405 445 0
analysis of the croatia smart specialization strategy: logical framework, instruments, and indicator results appendix202 203

status (2020)
specific strategic objective
delivery instrument indicator baseline value (2016)
target value (2023)
total tpa 1: health and quality of life
tpa 2: energy and sustainable environment
tpa 3: transport and mobility
tpa 4: security tpa 5: food and bioeconomy
so6 Additional instruments put in place for assessing medium term skill needs
Number of Sectoral curricula for vocational education and training based on learning outcomes and targeted sectors of the national / regional strategic interests supported through the development of the projects
0 5 0
so6 Establishing infrastructure for smart skills policies
Number of students awarded with scholarships in STEM and ICT areas
0 15,000 10,082
35 In some cases, there is a discrepancy between the sum of reported TPA values and the total value. More precisely, the total achieved values shown in the tables are in some cases higher than the sum of values for the five TPAs. The difference refers either to progress that is not attributed to any of the S3 TPAs, or the data on S3 alignment is not available.
Table III.2 Progress on S3 output indicators from the revised S3 monitoring framework (2020)
status (2020)
specific strategic objective
indicator total tpa 1: health and quality of life
tpa 2: energy and sustainable environment
tpa 3: transport and mobility
tpa 4: security tpa 5: food and bioeconomy
so1 Number of RDI infrastructural projects 32 11.6 10.81 2.18 2.32 5.05
so1 Number of researchers working in improved research infrastructure facilities 123.5 69.49 19.11 15.78 7.89 11.22
so1 Number of National Centres of Research Excellence (CoRE) projects supported 10 5 1.58 0.5 1 1.92
so1 Number of researchers who participated in the work of supported CoRE 599 303.17 80.75 23 78 114.08
so1 Number of joint research projects supported 11
so1, so2, so3 Number of new researchers in supported entities 544 31 0 70 13 32
so1 Number of supported Teaming, Twinning and ERA Chair projects 6 1 1.83 0.33 0.83 2
so1 RDI infrastructural projects prepared 10 2.85 1.59 2.83 2.09 0.64
so1 Number of research projects supported 464
so1, so3 Number of (laboratory) prototypes resulting from PoC projects 86 9 12 11 4 4
so1, so3 Number of commercialization strategies resulting from PoC projects 24 3 4 3 0 0
so1, so3 Number of demonstrations of technical feasibility resulting from PoC projects 87 8 13 8 4 4
35
analysis of the croatia smart specialization strategy: logical framework, instruments, and indicator results appendix204 205

status (2020)
specific strategic objective
indicator total tpa 1: health and quality of life
tpa 2: energy and sustainable environment
tpa 3: transport and mobility
tpa 4: security tpa 5: food and bioeconomy
so1, so3 Number of market analyses 24 2 6 3 0 0
so1, so3 Technical success of projects (concept proven or not) 74 11 11 6 2 2
so1 Number of FTE researchers engaged in PROs 0
so1 Number of R&D projects conducted by ROs 0
so1 Legal framework for collection and management of RDI data in research organizations developed 0 n/a n/a n/a n/a n/a
so1 Reports and common vision (foresight) developed 0 n/a n/a n/a n/a n/a
so1 Visualized maps of defined research disciplines and technology areas 0
so1 Web based user interface for input, management and analysis of data developed and operational 0 n/a n/a n/a n/a n/a
so1, so2, so3 Number of enterprises cooperating with research organisations 215 27.93 70.66 49.58 26.95 21.87
so1 Number of FTE researchers engaged in private companies 0
so1, so2, so3 Number of supported collaborative projects of the scientific-research and business sector 155 22 54 28 21 12
so1, so2, so3 Private investment matching public support in innovation or R&D projects36 € 234,401,042.19 € 29,331,553.66 € 64,100,640.75 € 50,696,324.62 € 35,922,236.42 € 35,582,103.75
so1, so2, so3 Share of companies that are newcomers to support RDI schemes37 93.67%
so1 Number of supported doctoral students 249
so2, so3 Number of enterprises supported to introduce new to the firm products 639 52 105 85 59 41
so2 Innovation web platform established 1
so2, so4 Number of enterprises receiving non-financial support 217
so2 Number of established Thematic innovation councils 5 1 1 1 1 1
so2 Number of prepared thematic strategies for RDI 0
so2 Report on mapping of RDI capacities in business sector 1
so2, so3 Number of company-company collaborations within RDI projects 207 20 13 86 31 57
so2, so3 Number of enterprises implementing KET 38 8 10 9 5 6
so2, so3 Number of enterprises receiving grants 178 5 11 11 6 2
36 For some instruments, the noted measurement unit was HRK. For aggregation purposes, these values were converted to EUR, at the rate of EUR/HRK=7.6.
37 Achieved value is calculated as average of the values reported for individual instruments for which the data is available.
analysis of the croatia smart specialization strategy: logical framework, instruments, and indicator results appendix206 207

status (2020)
specific strategic objective
indicator total tpa 1: health and quality of life
tpa 2: energy and sustainable environment
tpa 3: transport and mobility
tpa 4: security tpa 5: food and bioeconomy
so2, so3 Number of enterprises receiving support 618 52 106 86 59 42
so2, so3 Number of enterprises supported to introduce new to the market products 601 52 100 85 59 37
so2, so3 Number of R&D projects supported 41 5 12 12 6 6
so2 Number of commercialization and technology transfer agreements (signed with industry) 11
so3 Number of new enterprises receiving grants 261 0 3 1 0 1
so3 Share of funded projects per specific starting/ending TRL n/a n/a n/a n/a n/a n/a
so4 Number of companies/associations (competitiveness clusters) taking part in internationalization initiatives (Fairs, Exhibitions, Trade visits)
0
so4 Number of identified potential new brands under STPA (sub-thematic priority areas) 0
so4 Number of implemented competitiveness cluster initiatives 0
so6 Number of fellowships for training and career development of researchers on doctoral and postdoctoral level
177
so6 Development of new forecasting model/system and model for establishing Human Resources Recording System
0
so6 Number of new or improved services that support development and implementation 0
so6 Number of occupational standards in line with CROQF developed, based on which new educational programs will be aligned with labor market needs
11
so6 Number of education programmes/qualification standards in line with CROQF developed 0
so6 Number of qualification standards in the CROQF register based on which new study programs will be aligned with labor market needs
0
so6 Number of Sectoral curricula for vocational education and training based on learning outcomes in targeted sectors developed
0
so6 Number of students awarded with scholarships 10,082
analysis of the croatia smart specialization strategy: logical framework, instruments, and indicator results appendix208 209

outcome iNdicatoRs
Outcome indicators were set with the ambition to track national-level changes that can be credibly attributed to the S3 interventions. The status of outcome indicators as originally defined in the S3 is presented in Table III.3. In most cases, the indicators refer to public statistical data at national level. In the S3 document, they are linked to particular specific objectives and delivery instruments, as indicated in the table below. Baseline val-ues refer to different timeframes while targets are in most cases defined for the year 2023.
The indicators and the reported achievements are disconnected from the S3 TPAs. The outcome indicators are not TPA-specific and there are no direct references in the S3 doc-ument that would plan for them to be tracked on TPA level. Correspondingly, there are no estimates of TPA-level progress for these indicators. The overall values are in most cases tracked, except for a handful of indicators for which data was not provided.
During implementation, new outcome indicators were added in the revised monitoring framework to be tracked on project level in the post-implementation period. The status of revised outcome indicators is presented in Table III.4. In most cases, these indicators are planned to be tracked through surveys with program beneficiaries, that are scheduled to be conducted 1, 3 or 5 years after completion of the funded projects. Such achievements are then aggregated at instrument level, and finally aggregated across different instru-ments, as shown in the table below.38 As previously noted, no baseline or target values were set for any of the added indicators.
As of the end of 2020, very limited amount of data for outcome indicators was available. According to program managers, the reason for this is that there are no projects that would qualify for tracking the indicator in the mentioned timeframe (1, 3 and 5 years from project completion). In other words, projects were reportedly completed very recently or are yet to be completed, and it is too soon to assess their outcomes. TPA disaggregation is scarce in practice, as TPA progress is tracked for a limited number of indicators.
35 36 37 38
38 For simplification purposes, the table does not list all the instruments for which an indicator is tracked, but only refers to strategic objectives which they are linked to.
AnAlysis of the CroAtiA smArt speCiAlizAtion strAtegy: logiCAl frAmework, instruments, And indiCAtor results 210

Table III.3 Progress on S3 outcome indicators
specific stRategic objective
deliveRy iNstRumeNt iNdicatoR baseliNe value
taRget value (2023)
status (yeaR)
so1 Strategic Project ‘Science and Technology Foresight’
Creating a priority setting system for Scientific R&D policy in Croatia
n/a n/a 0 (2020)
so1 Increase R&D ability for conducting top quality research and cooperation on national and international levels
Number of H2020 projects granted to Croatian ROs participants
72 (2015)
213* 521 (2020)
so1 Support to research organizations conducting R&D projects directed towards the needs of economy
Number of patent applications by resident legal entities
365 (2013)
392 189 (2019)
so1 Multiple: (1) Increase R&D ability for conducting top quality research and cooperation on national and international levels (2) Strengthening research excellence by supporting National Centres of Research Excellence and enabling synergies with ERC grants
Number of scientific publications published in the journals indexed in the Web of Science Core Collection
30,362 (2013)
36,430 61,700 (2020)
so2 Support to the development of Centers of Competence
Number of researchers (FTE) employed in business sector
1,058 (2013)
1,571 1,809.5 (2018)
so2 Strengthening links between scientific and business sector by supporting Technology Transfer Offices and Science-Technology Parks
Number of spin off/spin out companies
n/a n/a40 0 (2020)
39 For indicators marked with an asterisk, the target year is 2020.40 According to the S3 document, baseline and target values were planned to be set upon
completion of the Strategic Project “Science and Technology Foresight”. As of end of 2020, the project is not yet completed.
39
aPPEndix 211

specific stRategic objective
deliveRy iNstRumeNt iNdicatoR baseliNe value
taRget value (2023)
status (yeaR)
so2, so3 Multiple: (1) Strategic Project for Support to Establish-ment of the Innovation Network for the Industry and Thematic Innovation Platforms (2) Support to the development of Centers of Competence (3) Support to business investments in RDI
Business expenditure on R&D (BERD) as % of GDP
0.41% (2013)
0.70% 0.54% (2019)
so2, so3 Multiple: (1) Support to the development of Centers of Competence (2) Support to business investments in RDI
Sales of new to the market and new to the firm innovations (as percentage of turnover)
10.5 (2010)
14.4 8.04% (2016)
so3 Support to business investments in RDI
Increase of patent applications, trademarks and industrial design in Croatia
1,826 2,700 1,841 (2019)
so3 Support to strengthening SMEs’ capacities to innovate
Innovative SMEs compared to total number of SMEs
33.1% (2012)
35% 42.8% (2016)
so4 Strategic Project for Support to Competitiveness Clusters Initiatives
Exports of medium and high-technology products as a share of total products exports
37.6 (2013)
41.36*
so4 Strategic Project for Support to Competitive-ness Clusters Initiatives
Increased number of Competitiveness Clusters members
350 (2014)
500*
so5 Support to social innovation
Increased number of PCT patent applications in societal challenges per billion GDP (PPS EUR)
0.22 (2011)
0.35
so6 Establishing infrastructure for smart skills policies
Completion rate of students who received scholarships
45.84% 65% 52.33% (2020)
AnAlysis of the CroAtiA smArt speCiAlizAtion strAtegy: logiCAl frAmework, instruments, And indiCAtor results 212

specific stRategic objective
deliveRy iNstRumeNt iNdicatoR baseliNe value
taRget value (2023)
status (yeaR)
so6 Establishing infrastructure for smart skills policies
Developed forecasting system by the Ministry of Labour and Pension (System for creating occupational and qualification standards which meets the needs of the S3)
0 (2014) 2 0 (2020)
so6 Implementing the Croatian Qualification Framework mechanism for delivering timely and standardized training programs based on future and medium-term skill needs
Increased number of adult learners gaining qualifications
0 (2014) 5,000 1,032 (2020)
so6 Implementing the Croatian Qualification Framework mechanism for delivering timely and standardized training programs based on future and medium-term skill needs
Increased number of education programs/qualifications standards in in the CROQF Register
0 (2014) 100
so6 Establishing infrastructure for smart skills policies
Increased number of employed researchers in early stage of career development in Croatian research system
10% 15%
so6 Establishing infrastructure for smart skills policies
Increased number of new PhDs in STEM areas
33.59% (2013)
43.59%*
so6 Additional instruments put in place for assessing medium term skill needs
Percentage of vocational schools in which they carried a newly developed sectoral curricula based on learning outcomes and targeted sectors of the national / regional strategic interests
0% (2014)
10% 0 (2020)
aPPEndix 213

Table III.4 Progress on revised S3 outcome indicators (2020)
status (2020)
specific strategic objective indicator
total tpa 1: health and
quality of life
tpa 2: energy and sustainable environment
tpa 3: transport and
mobility
tpa 4: security
tpa 5: food and
bioeconomy
so1 Number of collaborative contracted projects (by beneficiaries in HEIs and PRO) with foreign HEI and PRO institutions
14
so1 Number of Scientific publications published in journals indexed in the Web of Science core collection
1,823 507 489 293 262 271
so1 Total contracted amount for RDI funding from centralized EU funds (attracted by beneficiaries) HRK 114,000.00
so1 Total contracted amount for RDI funding from national funds (attracted by beneficiaries) HRK 29,291,515.70
so1 Number of publications in top-ranking international, peer-reviewed first or second-quartile journals with applicant being main or corresponding author in certain scientific area according to the relevant scientific databases
6,431
so1 Number of applied research projects implemented/in implementation after the end of funded project
15
so1, so2, so3, so4 Number of collaborative contracted projects between companies and HEIs/PROs after the end of supported projects
22
so1, so2, so3, so4 Number of IP protection applications-filed 16 1 4 2 0 0
so1, so2, so3, so4 Number of IP protection applications-registered 14 1 2 1 0 0
so1, so2, so3 Number of new innovative products / services / processes / technologies 83 0 7 5 3 0
so1, so2, so3 Number of start-ups/spin-offs/spin-outs originating from supported projects 1 0 0 1 0 0
so1, so2 Total contracted amount for R&D funding from private sector attracted by PROs /HEIs beneficiaries
HRK 1,995,544.00
so1 Priority setting system for scientific R&D policy in Croatia created
so1 Rate of public infrastructure usage by companies
so1 Rate of public infrastructure usage by owner
so1 Rate of public infrastructure usage shared between Public Research Organizations
41
41 For some indicators, one or more instruments contributing to their achievement were not S3 programs in a narrow sense, that is, projects were not required to be aligned with S3 TPAs. Therefore, data on TPA-level progress is not available for these indicators, or the total achieved value shown in the table is in some cases higher than the sum of values for the five TPAs. The difference refers either to progress that is not attributed to any of the S3 TPAs, or the data on TPA alignment is not available.
analysis of the croatia smart specialization strategy: logical framework, instruments, and indicator results appendix214 215

status (2020)
specific strategic objective indicator
total tpa 1: health and
quality of life
tpa 2: energy and sustainable environment
tpa 3: transport and
mobility
tpa 4: security
tpa 5: food and
bioeconomy
so1, so2, so3 Number of commercialization and technology transfer agreements
so1, so2, so3 Number of job positions in R&D created in enterprises by RDI projects after the end of funded project
51
so1 Number of joint publications (between RO beneficiary and industry partner)
so2 Number of strategic (project proposals) defined within thematic innovation platforms 300 63 110 54 45 28
so2 Number of job positions in R&D created in ROs by RDI projects after the end of funded project
so2, so3 Number of licensing agreements
so2, so3, so4 Sales of new to the firm innovation (as percentage of turnover)
so2 Number of partnerships with other TTOs
so3, so4 Increase in companies’ turnover compared to year of contracting 70%42
so3, so4 Increase in share of turnover from exports compared to contracting year 712%43
so3 Private investment in R&D projects after the end of public funded project HRK 8,936,529.97
HRK 495,270.00 HRK 390,000.00 HRK 0.00 HRK
1,360,000.00 HRK 0.00
so3, so4 Sales of new to the market innovation (as percentage of turnover)
so3 Number of collaborative contracted projects (by beneficiaries in companies) with foreign HEI and PRO institutions
3
so6 Number of persons who in the reference year acquired a PhD degree in STEM areas 0
so6 Number of young researchers who gained doctoral (PhD) degree 0
so6 Percentage of vocational schools in which newly developed VET curricula based on learning outcomes in targeted sectors are implemented
0%
so6 Completion rate of students who received scholarships 52.33%
42 Data available for a single instrument: Support for RDI activities of SMEs (RAZUM).43 Data available for a single instrument: Support for RDI activities of SMEs (RAZUM).
analysis of the croatia smart specialization strategy: logical framework, instruments, and indicator results appendix216 217

coNteXt iNdicatoRs
Context indicators refer to high-level objectives but are still associated with individual specific objectives and delivery instruments. The status of context indicators as defined in the original S3 is presented in Table III.5. According to the S3 document, the listed context indicators aim to show general changes in the socio-economic situation and are used to define or modify the scope of public intervention. No baseline or target values were set for any of them, however.
In practice, context indicators are not tracked in their original form anymore. No data in this form was provided by any of the institutions governing the listed instruments. A revised set of context indicators is tracked instead, as presented in Table III.6. Revised context indicators refer to national-level indicators from public statistical sources and international reports.
A separate set of TPA-specific context indicators is defined, for which progress is tracked to a limited extent. These are the only TPA-specific indicators of any kind in the S3 document, as well as in the later revisions of the S3 monitoring framework. However, these indicators are disconnected to S3 specific strategic objectives and refer exclusive-ly to high-level aspirations within each TPA. Table III.7 lists the values of such indicators, with the most recent data referring to 2018. For a significant share of indicators, however, progress seems not to be tracked, as data was not delivered.
AnAlysis of the CroAtiA smArt speCiAlizAtion strAtegy: logiCAl frAmework, instruments, And indiCAtor results 218

Table III.5 Overview of original context indicators defined on the overall S3 level
specific stRategic objective
deliveRy iNstRumeNt iNdicatoR baseliNe value
taRget value
so1 Multiple: (1) Increase R&D ability for conducting top quality research and cooperation on national and international levels (2) Strengthening research excellence by supporting National Centres of Research Excellence and enabling synergies with ERC grants (3) Support to research organizations conducting R&D projects directed towards the needs of economy (4) Strategic Project ‘Science and Technology Foresight’
Increased HRST as % of labor force
n/a n/a
so1, so2, so3
Multiple: (1) Increase R&D ability for conducting top quality research and cooperation on national and international levels (2) Strengthening research excellence by supporting National Centres of Research Excellence and enabling synergies with ERC grants (3) Support to research organizations conducting R&D projects directed towards the needs of economy (4) Strategic Project ‘Science and Technology Foresight’ (5) Support to the development of Centers of Competence (6) Support to business investments in RDI (7) Support to strengthening SMEs’ capacities to innovate
Increased R&D expenditure as % of GDP (GERD)
n/a n/a
aPPEndix 219

specific stRategic objective
deliveRy iNstRumeNt iNdicatoR baseliNe value
taRget value
so1, so2, so3
Multiple: (1) Increase R&D ability for conducting top quality research and cooperation on national and international levels (2) Strengthening research excellence by supporting National Centres of Research Excellence and enabling synergies with ERC grants (3) Support to research organizations conducting R&D projects directed towards the needs of economy (4) Strategic Project ‘Science and Technology Foresight’ (5) Support to the development of Centers of Competence (6) Support to business investments in RDI (7) Support to strengthening SMEs’ capacities to innovate
Increased Summary Innovation Index
n/a n/a
so2 Strengthening links between scientific and business sector by supporting Technology Transfer Offices and Science-Technology Parks
Increased number of new/innovative companies in S3 priority areas
n/a n/a
so2 Strategic Project for Support to Establishment of the Innovation Network for the Industry and Thematic Innovation Platforms
Increased sales of new to market and new to firm innovations
n/a n/a
so2, so3
Multiple: (1) Strategic Project for Support to Establishment of the Innovation Network for the Industry and Thematic Innovation Platforms (2) Support to the development of Centers of Competence (3) Support to business investments in RDI (4) Support to strengthening SMEs’ capacities to innovate
Increased number of new companies in economic areas included in smart specialization
n/a n/a
AnAlysis of the CroAtiA smArt speCiAlizAtion strAtegy: logiCAl frAmework, instruments, And indiCAtor results 220

specific stRategic objective
deliveRy iNstRumeNt iNdicatoR baseliNe value
taRget value
so2, so3
Multiple: (1) Support to the development of Centers of Competence (2) Support to business investments in RDI (3) Support to strengthening SMEs’ capacities to innovate
Increased share of innovative companies in industry and services
n/a n/a
so2, so3, so4
Multiple: (1) Support to the development of Centers of Competence (2) Support to business investments in RDI (3) Support to strengthening SMEs’ capacities to innovate (4) Strategic Project for Support to Competitiveness Clusters Initiatives
Increased Gross Domestic Product (GDP) / capita (EUR PPS)
n/a n/a
so2, so3, so6
Multiple: (1) Strategic Project for Support to Establishment of the Innovation Network for the Industry and Thematic Innovation Platforms (2) Support to business investments in RDI (3) Support to strengthening SMEs’ capacities to innovate (4) Establishing infrastructure for smart skills policies (5) Additional instruments put in place for assessing medium term skill needs (6) Implementing the Croatian Qualification Framework mechanism for delivering timely and standardized training programs based on future and medium-term skill needs
Increased employment rate in knowledge-intensive activities
n/a n/a
so2, so4
Multiple: (1) Strategic Project for Support to Establishment of the Innovation Network for the Industry and Thematic Innovation Platforms (2) Strategic Project for Support to Competitiveness Clusters Initiatives
Increased medium and high-tech products exports as % of total product exports
n/a n/a
so4 Strategic Project for Support to Competitiveness Clusters Initiatives
Export growth n/a n/a
aPPEndix 221

specific stRategic objective
deliveRy iNstRumeNt iNdicatoR baseliNe value
taRget value
so4 Strategic Project for Support to Competitiveness Clusters Initiatives
Increased share of FDI in GDP
n/a n/a
so4 Strategic Project for Support to Competitiveness Clusters Initiatives
Increased share of foreign investment in R&D expenditure
n/a n/a
so4 Strategic Project for Support to Competitiveness Clusters Initiatives
Increased value of FDI/capita (Euro)
n/a n/a
so5 Support to social innovation Improvement of the community welfare through solving specific societal challenges
n/a n/a
Table III.6 Revised context indicators and the latest available data on their achievement
iNdicatoR baseliNe value
taRget value
achievemeNt (2018)
achievemeNt (2019) 44
Summary Innovation Index 51.2% (2017)
n/a 54.80% 58.80%
European Innovation Scoreboard (EIS) (rank)
23 (2017) n/a 26 25
Global Innovation Index (GII) (rank) 41 (2017) n/a 44 41
Global competitiveness Index (GCI) (rank)
68 (2017) n/a 63 n/a
Innovation Capability (GCI pilar) (rank)
63 (2017) n/a 73 n/a
Gross expenditures on R&D (GERD) as a % of GDP (R&D intensity)
0.86% (2017)
n/a 0.97% 1.11%
Human resources in science and tech-nology (HRST) as a share of the active population in the age group 25-64
38.2% (2017)
n/a 40.00% 40.10%
44 Unless noted otherwise, the values refer to 2019.
AnAlysis of the CroAtiA smArt speCiAlizAtion strAtegy: logiCAl frAmework, instruments, And indiCAtor results 222

iNdicatoR baseliNe value
taRget value
achievemeNt (2018)
achievemeNt (2019) 44
Application success rate in H2020 11% (2014-2016)
n/a n/a 13.95% (2014-2020)
Share of scientific publications among the top 10% most cited publications worldwide as % of total scientific publications of the country
3.31% (2015)
n/a n/a 4.08% (2016)
Share of researchers in FTE in the public (GOV + HES) sector as % of active population
0.1% (2017) n/a 0.105% 0.106%
Innovative SMEs collaborating with others (% of SMEs)
0.26% (2017)
n/a 0.40% n/a
Business Expenditures (BERD) as % of GDP
0.42% (2017)
0.7% (2023)
0.47% 0.54%
Share of FTE researchers in business enterprise sector as % of active population
0.092% (2017)
n/a 0.102% 0.124%
Starting a business (rank) 123 (2018) n/a n/a 114
Firm investments (dimension of Summary Innovation Index)
96.7% (2017)
n/a 93.60% 117.94%
Innovators (dimension of Summary Innovation Index)
72.1% (2017)
n/a 95.40% 85.99%
aPPEndix 223

Table III.7 TPA-specific context indicators and the latest available data on their achievement
tpa indicator baseline value target value (2023) achievement (2016) achievement (2017) achievement (2018)
TPA 1: Health and Quality of Life Increase of life expectancy at birth (years) 78 (2013) 79.5 78.2 78 78.2
TPA 1: Health and Quality of Life Increase in ranking on Euro Health Consumer Index (rank) 24th (2014) 20 19 26 24
TPA 2: Energy and Sustainable Environment
Share of renewable energy in gross final energy consumption (percentage)
18% (2013) 20% 28.27% 27.28% 28.02%
TPA 2: Energy and Sustainable Environment
Decrease in Greenhouse gas emissions (CO2 equivalent) (thousand tonnes)
26,449 (2012) 24,000.00 24,763.00 25,472.00
TPA 3: Transport and Mobility Better quality transport services and reduced environmental pollution – reduction of Greenhouse gas emissions in transport sector (CO2 equivalent) (thousand tonnes)
5,709 (2012) 5,200.00
TPA 3: Transport and Mobility Reduction of energy consumption of transport and mobility sector (thousand tonnes of oil equivalent)
2,037.9 (2013) 1,700.00 2,039.00 2,189.00 2,140.40
TPA 4: Security Increased GDP contribution of military and non-military goods and products (approved value of licenses issued for military goods and products, EUR)
€ 711,535,861.19 (2013)
€ 782,689,447.3
TPA 4: Security Reduced number of companies and individuals in Croatia experiencing cyber-crimes (percentage)
8% (2013) 6%
TPA 4: Security Allied Quality Assurance Publication (AQAP) standardization to be implemented in Croatia
not implemented implemented
TPA 5: Food and Bioeconomy Increase of areas under organic farming (percentage) 2.4% (2012) 4.00% 6.05% 6.46% 6.94%
TPA 5: Food and Bioeconomy Increase of total waste recovered (other than energy recovery) (kilograms per capita)
243 (2012) 300
analysis of the croatia smart specialization strategy: logical framework, instruments, and indicator results appendix224 225

IV. Interpretation of the connections between instruments and objectives
program outcome-level objectives derived from the analysis of 42 programs (both s3 policy instruments, non-s3 instruments)
so1. increased capacities of rdi sector to perform excellent research and to serve the needs of the economy
so2. overcoming the fragmentation of innovation value chain and the gap between research and business sector
so3. modernizing and diversifying croatian economy through increasing private r&d
so4. upgrading in global value chain and promoting internationalization of croatian economy
so5. working in partnerships to address societal challenges
so6. creating smart skills - upgrading the qualifications of existing and new work force for smart specialization
Adoption of ICT solutions B02 SME ICT
Enhanced capacity to support technology transfer
A06 TTOs
Enhanced collaboration in the scientific community
A03 CoRE C01 Research Projects C02 Installation Research C04 RDI Climate Change C07 ERC Applications C08 Partnership in Research
Enhanced collaboration in the scientific community (with foreign partners)
C05 Joint Research C06 Tenure Track Pilot C09 Research Cooperability C10 Crossing Borders C11 My First Collaboration Grant C12 Gaining Experience Grant
Enhanced mentoring capacities of research organizations
C01 Research Projects C03 Young Researchers Career C06 Tenure Track Pilot
Enhanced RDI capacity of enterprises
A02 STRIP B15 CEKOM B10 Innovation Vouchers B11CCommercialization of Innovations B12 Innovations in S3 B14 IRI 2 B16 POC D01 Eureka D02 Eurostars D07 Croatian Venture Capital
D03 Smart Factory Hub Voucher D04 B Light Scheme D06 Urban Agglomeration D05 Startup Incubators
Improved access to new or upgraded RDI infrastructure and equipment
A04 RDI Infrastructure A05 Synergies
B15 CEKOM
Improved capacity of research organizations to conduct high-quality applied research
A01 SIIF A02 STRIP
s3 policy instruments non-s3 instruments
analysis of the croatia smart specialization strategy: logical framework, instruments, and indicator results appendix226 227

program outcome-level objectives derived from the analysis of 42 programs (both s3 policy instruments, non-s3 instruments)
so1. increased capacities of rdi sector to perform excellent research and to serve the needs of the economy
so2. overcoming the fragmentation of innovation value chain and the gap between research and business sector
so3. modernizing and diversifying croatian economy through increasing private r&d
so4. upgrading in global value chain and promoting internationalization of croatian economy
so5. working in partnerships to address societal challenges
so6. creating smart skills - upgrading the qualifications of existing and new work force for smart specialization
Improved capacity of researchers to conduct excellent RDI work
A03 CoRE C01 Research Projects C02 Installation Research C03 Young Researchers Career C04 RDI Climate Change C05 Joint Research C06 Tenure Track Pilot C07 ERC Applications C08 Partnership in Research C09 Research Cooperability C10 Crossing Borders C11 My First Collaboration Grant C12 Gaining Experience Grant
Improved career prospects of young researchers
C01 Research Projects C02 Installation Research C03 Young Researchers Career C06 Tenure Track Pilot C09 Research Cooperability C11 My First Collaboration Grant
Improved organizational functions to support RDI work
A04 RDI Infrastructure
Improved quality of management systems as demonstrated by achievement of internationally recognized level of standards
B07 ISO Norms
Increase in completion rate of students in STEM fields
A07 STEM
Increase in internationalization of products
B05 BSO SME Internationalization B06 SME Internationalization D04 B Light Scheme
Increase in product development B01 New SMEs Innovations
Increase in product sales B01 New SMEs Innovations
Increase in the survival of newly established enterprises
B01 New SMEs Innovations
analysis of the croatia smart specialization strategy: logical framework, instruments, and indicator results appendix228 229

program outcome-level objectives derived from the analysis of 42 programs (both s3 policy instruments, non-s3 instruments)
so1. increased capacities of rdi sector to perform excellent research and to serve the needs of the economy
so2. overcoming the fragmentation of innovation value chain and the gap between research and business sector
so3. modernizing and diversifying croatian economy through increasing private r&d
so4. upgrading in global value chain and promoting internationalization of croatian economy
so5. working in partnerships to address societal challenges
so6. creating smart skills - upgrading the qualifications of existing and new work force for smart specialization
Increased access to mentorship services
B09 BOND
Increased collaboration between research organizations and enterprises
A02 STRIP B15 CEKOM B10 Innovation Vouchers B14 IRI 2
Increased international collaboration of enterprises
D01 Eureka D02 Eurostars
D03 Smart Factory Hub Voucher D04 B Light Scheme
Increased operational efficiency of enterprises
B02 SME ICT
Increased product certification B13 Certification
Increased products obtaining quality labels
B08 Quality Labels
Increased quality of BSOs’ services B09 BOND
Increased regional availability of BSOs’ services
B09 BOND
Increased sufficiency of resources for R&D activities
A01 SIIF A03 CoRE A05 Synergies
Increased transfer of R&D results into commercialization
A01 SIIF A02 STRIP A03 CoRE C10 Crossing Borders C11 My First Collaboration Grant
A06 TTOs B15 CEKOM C08 Partnership in Research
Increased utilization of business infrastructure
B04 Biz Infra D05 Startup Incubators D06 Urban Agglomeration
Introduction of new model of researchers’ career development in research organizations
C06 Tenure Track Pilot
Utilization of knowledge and skills learned
B03 BSOs D05 Startup Incubators D06 Urban Agglomeration
analysis of the croatia smart specialization strategy: logical framework, instruments, and indicator results appendix230 231

program outcome-level objectives derived from the analysis of 42 programs (both s3 policy instruments, non-s3 instruments)
so1. increased capacities of rdi sector to perform excellent research and to serve the needs of the economy
so2. overcoming the fragmentation of innovation value chain and the gap between research and business sector
so3. modernizing and diversifying croatian economy through increasing private r&d
so4. upgrading in global value chain and promoting internationalization of croatian economy
so5. working in partnerships to address societal challenges
so6. creating smart skills - upgrading the qualifications of existing and new work force for smart specialization
S3 Policy Instruments not covered in the above Analysis
○ Science and Technology Foresight
○ Preparation of RDI infrastructural projects
○ Croatian Scientific and Educational Cloud (HR-ZOO)
○ Center for advanced laser techniques (CALT) Children Centre for Translational Medicine at the Children’s Hospital Srebrnjak
○ Open scientific infrastructural platforms for innovative applications in economy and society – O-ZIP
○ Development and strengthening synergies with HORIZON 2020 horizontal activities: Teaming
○ Research infrastructure usage and researchers’ services for SMEs (STPII IRCRO program)
○ Establishment of Innovation Network for Industry and Thematic innovation Councils
○ Integrator ○ Support for RDI
activities of SMEs for their technological upgrade and global competitiveness (STPII – RAZUM program)
○ Strategic project to support the Cluster Competitiveness Initiatives
○ Support to social innovation
○ Implementation of The Strategy for Lifelong Guidance and Career Development in the Republic of Croatia 2016-2020
○ Implementing the Croatian Qualification Framework and development of tools for connecting education and labour market
○ Implementing the Croatian Qualification Framework on Higher Education level
○ Career development of young researchers (PhD education)
○ Modernization of vocational education and training programs and raising their quality to increase students’ employability and opportunities for further education
Source: Staff elaboration based on Croatia Smart Specialization Strategy 2016–2020.
analysis of the croatia smart specialization strategy: logical framework, instruments, and indicator results appendix232 233