Analysis of the Biodiversity of Coleoptera (beetles) in 3 ... of the biodiversity of... · through...
13
Report Analysis of the Biodiversity of Coleoptera (beetles) in 3 different ecosystems in Gobabeb, Namibia, for the year 2006 using the ongoing pitfall traps Kuiseb River - Interdunes - Quartz Hill Date: 05. January 2007 Writer: Robert J. Prillinger ([email protected]) Gobabeb Training and Research Center, Central Namib Desert, Namibia [email protected] - www.gobabeb.org
Transcript of Analysis of the Biodiversity of Coleoptera (beetles) in 3 ... of the biodiversity of... · through...

Report
Analysis of the Biodiversity of Coleoptera (beetles) in 3 different
ecosystems in Gobabeb, Namibia, for the year 2006
using the ongoing pitfall traps
Kuiseb River - Interdunes - Quartz Hill
Date: 05. January 2007
Writer: Robert J. Prillinger ([email protected])
Gobabeb Training and Research Center, Central Namib Desert, [email protected] - www.gobabeb.org
1 Index
1 Index 2
2 Introduction 3
3 Key Question and Objective 3
4 Materials and Methods 3
5 Results 4
5.1 General 4
5.2 Kuiseb River (ecosystem 1) 4
5.2.1 Monthly results 4
5.2.2 Annual results 5
5.3 Interdune (ecosystem 2) 5
5.3.1 Monthly results 5
5.3.2 Annual results 6
5.4 Quartz Hill (ecosystem 3) 7
5.4.1 Monthly results 7
5.4.2 Annual results 8
6 Discussion and Interpretation 9
6.1 General 9
6.2 Kuiseb River (ecosystem 1) 106.3 Interdune (ecosystem 2) 10
6.4 Quartz Hill (ecosystem 3) 11
6.5 Problems which could falsify results 12
7 Summary 13
8 References 13
9 Appendix 13

2 IntroductionGobabeb, a training and research center in the Namibian desert, offers a unique and very un-
touched environment containing a lot of endemic species. For more than 25 years there have been
dry pitfall traps set out in three different ecosystems (Kuiseb river bed, Interdune, Quartz Hill) to
catch animals and to monitor them regularly.
This report contains the analysis of biodiversity of Coleoptera (beetles) in all three ecosystems
using the data of the whole year 2006. The data excludes other caught animals in the dry pitfall
traps (e.g. scorpions, geckos, lizards, ants, silverfish, spiders, ... ). To mathematically describe the
biodiversity the common Shannon-Wiener diversity index (H') was used. (The exact formula of the
index is explained in number 4 "Materials and Methods"). The Shannon-Wiener diversity index
takes two main parameters into consideration which PRICE (1984, pA 70) describes to the point:
'Thus number of species (species richness) in the community and their evenness in abundance (or
equitability) are the two parameters that define H'. As species are added, diversity increases, and
as species become evenly distributed in abundance, diversity increases".
The results of the Shannon-Wiener diversity index calculation in the three ecosystems in Gobabeb
are the basis for the discussion and interpretation, which shall also be handled here.
3 Key Question and ObjectiveThe main key question is: "How high or alternatively how low is the biodiversity of Coleoptera in the
three investigated ecosystems for the year 2006?". Leading further, questions about the heteroge-
neity, influencing factors (climate, trap, ... ) and special distributional patterns in Gobabeb also
appear and will be tried to be answered in number 6 "Discussion and Interpretation".
4 Materials and MethodsOn the whole 65 dry pitfall traps have been set (20 in the Kuiseb River, 25 in the Interdunes and 20
pit traps at Quartz Hill). All pit traps have an average diameter of 16cm and some of them are cov-
ered with boards to prevent that the animals dry out or get eaten by predators. They are all
distributed with a minimum of 2 m radius to each other, although they are usually set up in smaller
groups in one biotope. Three times a week all pit traps were emptied and all individuals counted,
identified and recorded, while dead animals in the whole were added, dead animal pieces (blown in
through the wind) however not. The Coleoptera were usually identified according to the species
while other animals (e.g. scorpions, ants, spiders, geckos ... ) where only identified according to the
order or family. With the collected data of the year 2006 it was possible to calculate the Shannon-
Wiener diversity index (H') for each pit trap on each monitored day. The results were then summed
up to a monthly and eventually annually mean.
Shannon-Wiener diversity index (H'):
The sum total is for all species and Pi is the relative abundance of species i (MAPAURE, 2006,p.14).

5 Results5.1 General
Each pit fall trap (out of the 65) was inspected over the year in average for 126 days (differentiated
slightly because of floods, where a few pit falls could be monitored while others could not). As a
result 8180 diversity indexes where calculated.
The annual over-all view, comparing the biodiversity of Coleoptera between the 3 ecosystems (see
Figure 4.0), indicates very clearly that the Kuiseb River has got the highest Coleoptera biodiversity
(0,383). The Interdunes as well as the pit traps at Quartz Hill have got an about 3,5 times lower
annually diversity index with a value of about 0,109.
Figure 4.0 - Biodiversity of Coleoptera in Gobabeb - Mean 20060,45 ,..-------------------------,
0,40
0,35
0,30
0,25
0,20
0,15
0,10
0,05
0,00
0,38319
0,10941 0,10864
Kuiseb River Interdune
Ecosystem
Quartz Hill
Source: Gobabeb, Prill inger, 2007, n=8180
5.2 Kuiseb River (ecosystem 1)
5.2.1 Monthly results
The Biodiversity changes in the Kuiseb river bed over the year and the lowest values in general
can be marked in March (see Figure 1.1). After the winter the diversity rises and the peak can be
registered in November. Some pitfall traps have a very low diversity throughout the whole year.
Figure 1.1 - Biodiversity of Coleoptera - Monthly Mean - Kuiseb River
1,40 ,.------------------------------,
~~ 1,20"CI:
~ 1,00of!!Q):5 0,80oIii:» 0,60I:Q):i: 0,40C:o~ 0,20III~
CI)
Jan-06 Feb-06 Mar-06 Apr-06 May-06 Jun-06 Jul-06 Aug-06 Sep-06 Oct-06 Nov-06 Dec-06
month-yearSource: Gobabeb, Prill inger, 2007, n=2560
-+-1
---'-3---5
7-9""""-11
-1315
--17-+-19
21---'-23---'-25
-27""""-29---'-A_c--E-+-G
I

Especially the pit traps (21 to 29) on the eastern side of the river (see appendix - map1) have a
low biodiversity throughout the whole year (appendix, Figure 1.1.3). The most steady values (ap-
pendix, Figure 1.1.1) over the year can be registered at the pit fall trap group 1 to 9 in "spoon city"
(see appendix - map1).
5.2.2 Annual results
The annual biodiversity in the Kursieb river bed with an average index of 0,383 ranges from pitfall
trap 21 with the lowest value (0,122) to pitfall trap 17 with the highest index of 0,789 (see Figure
1.2). It is significant that all pit trap groups located closely to each other have a similar biodiversity
index. Especially the group 11 to 19 (located very near to the river bed) have got the highest biodi-
versity. The pit trap group 21 to 29 have the lowest values, while pit trap group A to I and 1 to 9 are
in the average middle field.
Figure 1.2 - Biodiversity of Coleoptera -Annually Mean - Kuiseb River
0,90'
- 17j: 0,80~)((I) 0,70"Cc::
~ 0,60.ii1(I).~ 0,50
"C0in 0,40•..(I)c::(I)
0,30~,c::0 0,20eeca..c:
0,10tJ)
0,00
2006
yearSource: Gobabeb, Priilinger, 2007, n=2560
-1_3_507
_9011
-13
015
-17
-19
021023
-25_27
_29
-AC
-EOG01
5.3 Interdune (ecosystem 2)
5.3.1 Monthly results
The second ecosystem, the Interdunes, have two main sites (A and B), which are located about
0,6km from each other in the south of Gobabeb (see appendix - map2). Site A is nearer to the
Gobabeb station while site B is located further away in the Namib desert dunes. On both sites the
biodiversity increases in April, reaching its significant peak in May and June, then falling back to a
very low diversity index again and staying low for the rest of the year (see Figure 2.1 and Figure2.2). At site A, two pit traps (A7 and A 13) keep a low index over the whole year.

Figure 2.1 - Biodiversity of Coleoptera -Monthly Mean -Interdune (site B)
-+-- B1
-B3
-----.- B5
B7
_B9
-B11
_B13
B15
--B17
~ -+-- B19
<0 <0 <0 <0B21
<0 <00 9 0 9 9 0.J. 6. 0 -----.- B23~ Ol tl >-, ~ Q) 0 a Q)
<{ (f) Z 0
0,70 ,------------------------------,
0,00to to to to <0 <09 9 0 9 0 0C .0 ~ C. >- C:Ctl Q) Ctl Ctl ~-, LL ~ <{ ~ -,
~.~ 0,60
.~'t:J 0,50.2 r:~ ::s 0,40a> )(:ii ~ 0,303:-=C:oec:Ctls:III
0,20
0,10
Source: Gobabeb, Prillinger, 2007, n=1488month-year
0,80 ,-------------------------------,
Figure 2.2 - Biodiversity of Coleoptera -Monthly Mean - Interdune (site A) -+--A1
--A3
-----.- A5A7
-A9-e-A11
--A13
A15--A17-+--A19
A21
-----.-A23-A25
~.~ 0,70Q)
~ 0,60oiii £' 0,50
~ ~ 0,40.!!! 't:J~ .s 0,30C:g 0,20c:~ 0,10
III ~~~~~~~~~~~~~~0,00CD CD to CD CD to CD0 a 0 a a a 9C: 1:, .!. <5. >- C: "SCtl Q) Ctl Ctl :::l-.. LL ~ -c ~ -, -..
month-year
CDa6.Q)(f)
CDooQ)o
CDat5o
CDa>aZ
Source: Gobabeb, Prillinger, 2007, n=1612
5.3.2 Annual results
The annual biodiversity in the Interdunes (Figure 2.3 and Figure 2.4) differentiates very much be-
tween the two sites. While the values of each pit trap in site 8 are very similar and homogenous,
the biodiversity indexes of the pit traps in site A strongly fluctuate to each other. The lowest value
in site 8 (0,069) is in pit trap 813 - one of the most south located pit traps - while the highest index
(pit trap 83 = 0,171) is positioned more north towards the Gobabeb station and River bed. At site A
pit traps A1, A7, A13 and A15 have the lowest values with about 0,052 (while A1 lines up first from
north to A25 in the south). The highest biodiversity at site A can be found at pit trap A9 with an
index of 0,180. The annual mean of the Interdunes is listed with 0,109.
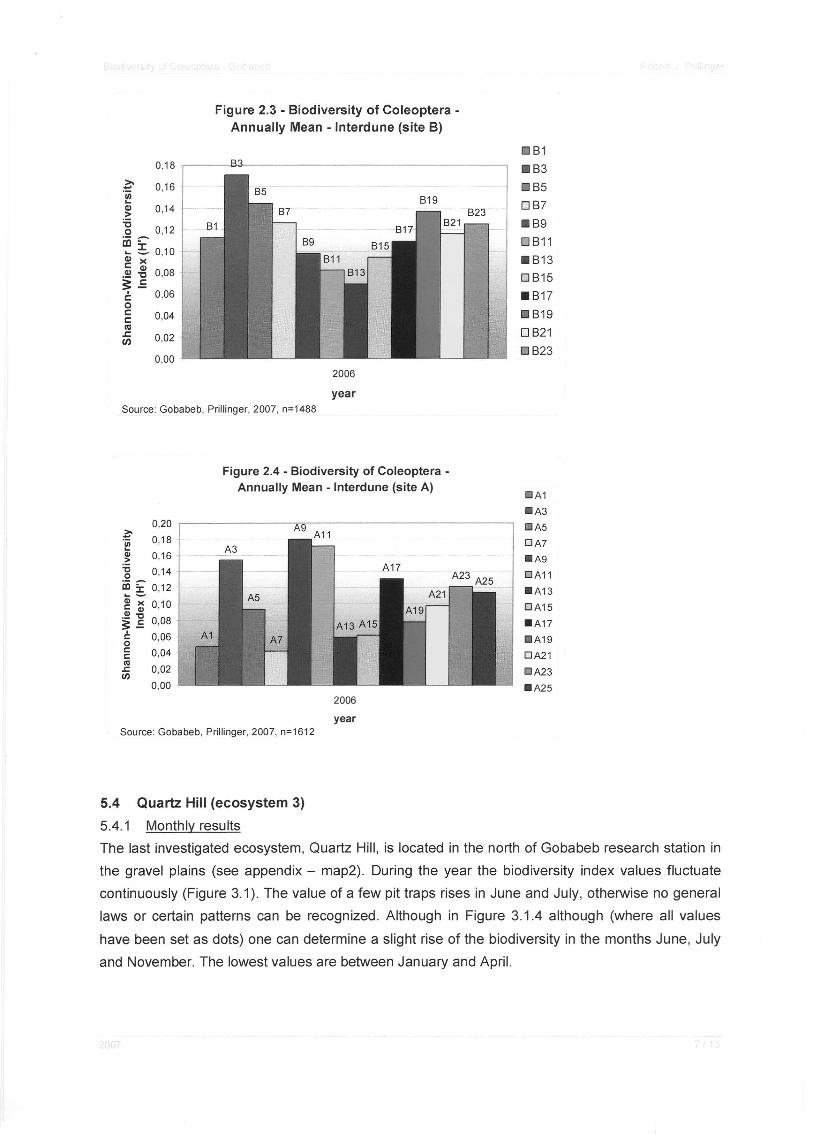
Figure 2.3 - Biodiversity of Coleoptera -Annually Mean - Interdune (site B)
0,18 ,----~---------------___,
j!o 0,16'iii•..(1)>:co 0,12m:.-"'•.. ~ 0,10~ ~
.!!! "C 0,08~.E.: 0,06oI:I:III.J:.en
0,14 823
0,04
0,02
0,002006
yearSource: Gobabeb, Prillinger, 2007, n=1488
Figure 2.4 - Biodiversity of Coleoptera -Annually Mean - Interdune (site A)
0,20 ,--------""'--------------,~/fI 0,18
.~ 0,16-g 0,14
iD £ 0,12
~ ~ 0,10
~ ~ 0,08s:!: 006o '2 0,041\1~ 0,02·
0,002006
yearSource: Gobabeb, Prillinger, 2007, n=1612
OB1.B3[] B5OB7.B9o B11.B13OB15.B17
B19OB21OB23
OA1
-A3
A5
OA7
-A9
OA11
_A13
OA15
_A17
.A19
OA21
OA23
_A25
5.4 Quartz Hill (ecosystem 3)
5.4.1 Monthly results
The last investigated ecosystem, Quartz Hill, is located in the north of Gobabeb research station in
the gravel plains (see appendix - map2). During the year the biodiversity index values fluctuate
continuously (Figure 3.1). The value of a few pit traps rises in June and July, otherwise no general
laws or certain patterns can be recognized. Although in Figure 3.1.4 although (where all values
have been set as dots) one can determine a slight rise of the biodiversity in the months June, July
and November. The lowest values are between January and April.
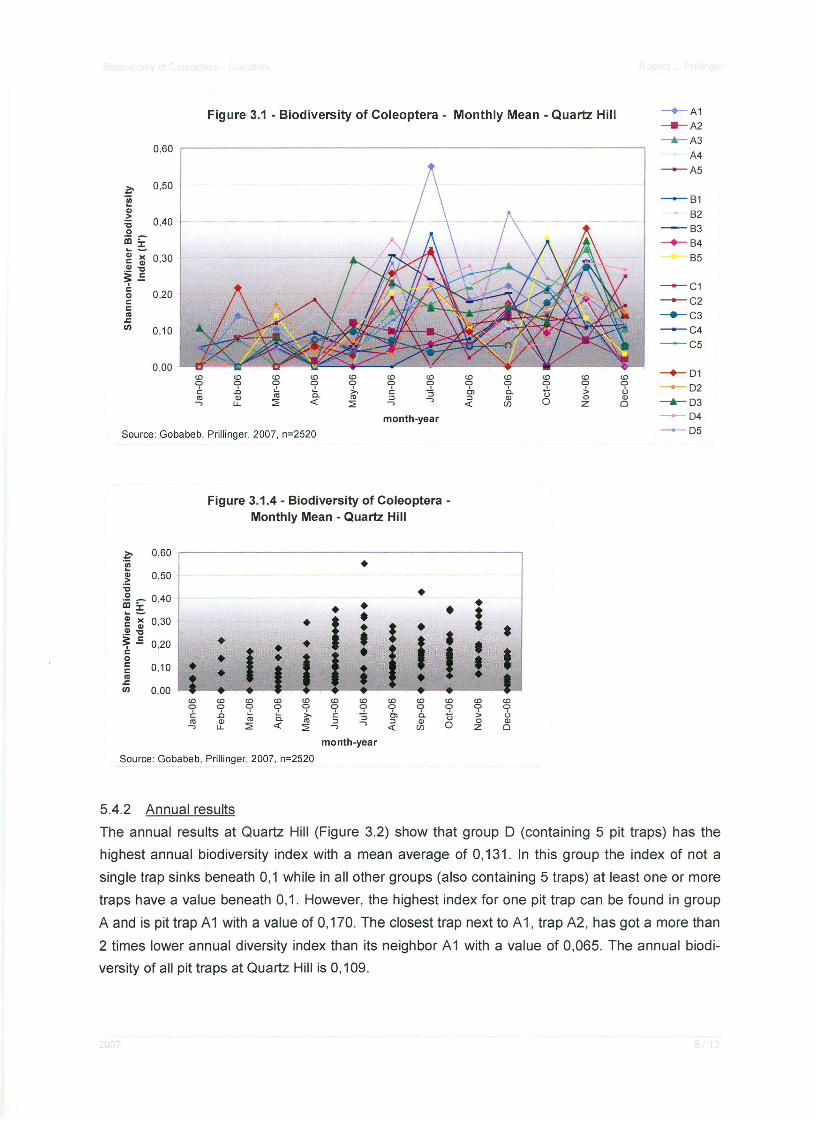
Figure 3.1 - Biodiversity of Coleoptera - Monthly Mean - Quartz Hill
0,60 ,..-----------------------------------,
0,50~.~s"Coin:=-... =.~ ~ 0,30
.~ "C;:..=C:oc:c:lG..c:
C/)
0,40
0,20
0,10
0,00 J..-i:f-- ...••'EF--i:F-"""tr-----'''t'''''--"r;.--~---- ..•.-__IF_----._ ...•CD9c'"-,
CD9.0Q)
LL
CD9c~-,
CDa6.Q)(/)
CDat>o
CDa>oZ
CDaUQ)
omonth-year
Source: Gobabeb, Prillinger, 2007, n=2520
Figure 3.1.4 - Biodiversity of Coleoptera -Monthly Mean - Quartz Hill
~ 0,60.~ •CD 0,50.~"C •~ £ 0,40 • • • •... - • I~ ~ 0,30 • I • ! • ••~ "C • •;:..= 0,20 • • I •C:
I • • I I I0 • • •c: 0,10 • •e • •lG • •..c:C/) 0,00
CD CD CD CD CD CD CD CD CD CD CD CD
9 9 a a a a 9 a a a a ac .0 ~ ~ >- C: "3 C, 6. .,!. > u'" Q) '" o,
'" ~ ~ Q) o 0 Q)-, LL ~ <{ ~ -, -,<{ (/) 0 Z 0
month-year
Source: Gobabeb, Prillinger, 2007, n=2520
-+-A1
-A2---"'-A3
A4--A5
--8182
--83-+-84
85
--C1--C2---C3--C4--C5
-+-01
-02---...- 03--04--05
5.4.2 Annual results
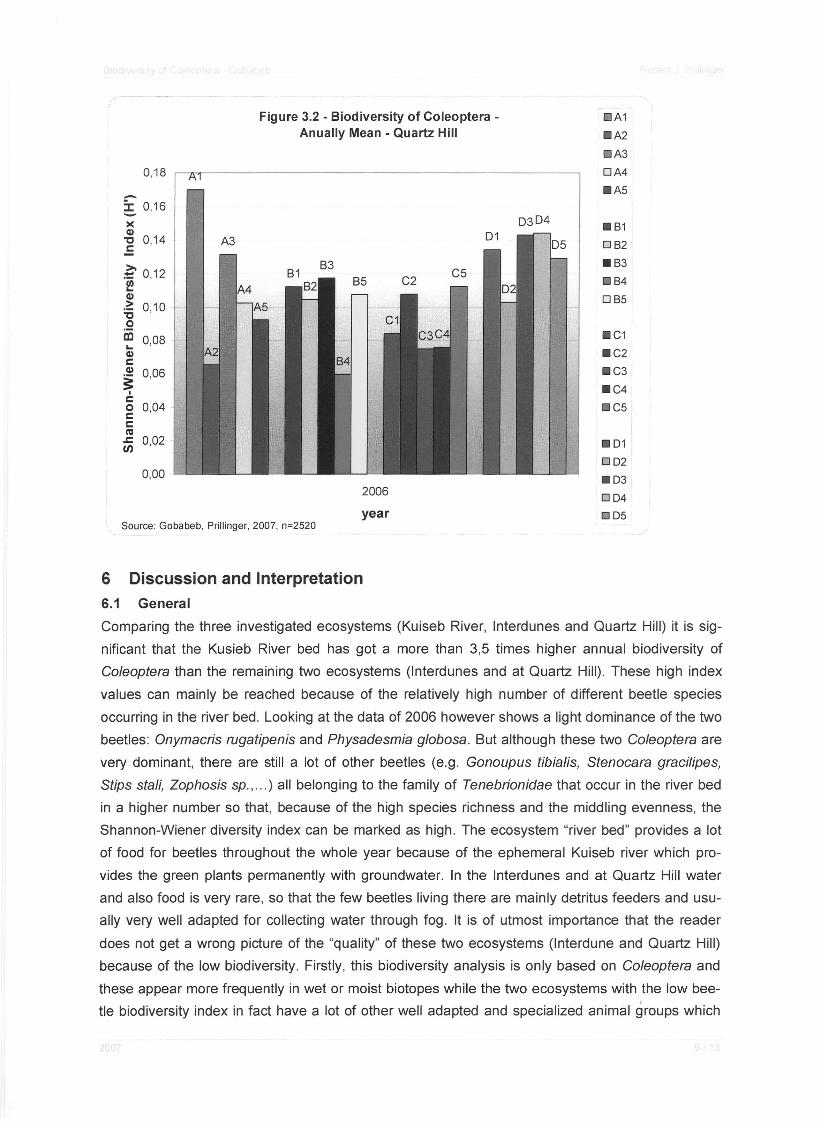
The annual results at Quartz Hill (Figure 3.2) show that group D (containing 5 pit traps) has the
highest annual biodiversity index with a mean average of 0,131. In this group the index of not a
single trap sinks beneath 0,1 while in all other groups (also containing 5 traps) at least one or more
traps have a value beneath 0,1. However, the highest index for one pit trap can be found in group
A and is pit trap A 1 with a value of 0,170. The closest trap next to A 1, trap A2, has got a more than
2 times lower annual diversity index than its neighbor A 1 with a value of 0,065. The annual biodi-versity of all pit traps at Quartz Hill is 0,109.
[!] A1
.A2
A3
DA4
.A5
.81
05 082
.83
84
085
.C1
.C2
.C3
.C4
C5
.01
002
.03
004
005
Figure 3.2 - Biodiversity of Coleoptera -Anually Mean - Quartz Hill
0,18 .--1t""'r-----------------------,
-~ 0,16><Q)
" 0,14I:
~ 0,12eQ):5 0,10
.2CD 0,08..Q)I:~ 0,06
I
I:o 0,04I:I:CGti 0,02
0,002006
yearSource: Gobabeb, Prillinger, 2007, n=2520
6 Discussion and Interpretation6.1 General
Comparing the three investigated ecosystems (Kuiseb River, Interdunes and Quartz Hill) it is sig-
nificant that the Kusieb River bed has got a more than 3,5 times higher annual biodiversity of
Coleoptera than the remaining two ecosystems (Interdunes and at Quartz Hill). These high index
values can mainly be reached because of the relatively high number of different beetle species
occurring in the river bed. Looking at the data of 2006 however shows a light dominance of the two
beetles: Onymacris rugatipenis and Physadesmia globosa. But although these two Coleoptera are
very dominant, there are still a lot of other beetles (e.g. Gonoupus tibialis, Stenocara gracilipes,
Stips stali, Zophosis sp., ... ) all belonging to the family of Tenebrionidae that occur in the river bed
in a higher number so that, because of the high species richness and the middling evenness, the
Shannon-Wiener diversity index can be marked as high. The ecosystem "river bed" provides a lot
of food for beetles throughout the whole year because of the ephemeral Kuiseb river which pro-
vides the green plants permanently with groundwater. In the Interdunes and at Quartz Hill water
and also food is very rare, so that the few beetles living there are mainly detritus feeders and usu-
ally very well adapted for collecting water through fog. It is of utmost importance that the reader
does not get a wrong picture of the "quality" of these two ecosystems (Interdune and Quartz Hill)
because of the low biodiversity. Firstly, this biodiversity analysis is only based on Coleoptera and
these appear more frequently in wet or moist biotopes while the two ecosystems with the low bee-t
tie biodiversity index in fact have a lot of other well adapted and specialized animal groups which

were caught in the traps. Different scorpions, geckos, ants, silverfish and spiders are mainly caught
at the Interdunes and Quartz Hill, while in the river bed almost only beetles occur. Considering this
fact the whole biodiversity index of the two ecosystem could be a lot higher if animal groups other
than Coleoptera would be included. Secondly, SPELLERBERG (1995, p.123) writes that: "It does
not necessarily follow that a higher species diversity is better than a lower species diversity nor
does it follow that high diversity indices can be interpreted as being a reflection of high quality habi-
tat. Some communities have a naturally low species diversity and the meaning of 'quality' needs to
be defined when using a diversity index to express some state of the habitat or environment." In
general it is therefore not easy to judge the quality of the three ecosystems and it should only be
recognized that Coleoptera in the Kuiseb River in the annual mean view (I) appear rich in species
and these are also evenly distributed while at Quartz Hill and Interdunes the conditions are too
stressful for a high beetle biodiversity.
6.2 Kuiseb River (ecosystem 1)
As already mentioned the Coleoptera biodiversity in the river bed is quite high, although the index
does differentiate a little during the year. The lowest values can be marked during the rainy season
(March, April) where a lot of traps were flooded and also the beetle movement in the whole area
was very restricted. After the flood the beetle biodiversity does increase and fluctuates until the endof the year. In general however the values stay even because the plants (supplied with the river
bed groundwater) are green over the whole year and provide food and shelter for the beetles. The
most steady (but not the highest!) values were measured in "spoon city" (pit trap group 1 to 9)
which is located furthest away from the river bed and does not get effected through the floods so
quickly.
Looking at the annual values of each trap it is significant that certain pit trap groups have high di-
versity while others have rather low values. Especially pit trap group 11 to 19 have the highest
biodiversity. These traps are located directly next to the main river bed and are the first ones to be
flooded. This area inhabits a lot of different species of trees and bushes and provides the different
beetle species with different food sources and shelter (leaves, branches, ... ) possibilities. The pit
trap group 21 to 29 (with the lowest diversity values) for example are located on the eastern river
side, a little bit farther away from the main river bed and possesses only a few large trees which
supply the beetles with much less different resources than in the first group. This allegation shows
nicely the tight connection between Flora and Fauna and the dependence of the beetles to their
natural living surrounding.
Dominant beetle species in the Kuiseb River bed are: Physadesmia globosa, Onymacris ruga-
tipenis, Zophosis sp., Stenocara gracilipes, Gonopus tibialis and Stips stali.
6.3 Interdune (ecosystem 2)
Coleoptera are in general very rarely present in the Interdunes. Only a few beetles, which are well
adapted to the dry and hot conditions, occur during the whole year in the Namib dunes. Onymacris
plana and Zophosis moralesi are two, throughout the whole year, very present beetles. "0. plana is
an extremely fast diurnal runner, and can tolerate high temperatures by sprinting from the shade of
one plant to that of another" (HOLM, 1970, p.30). Also Zophosis sp. beetles "are known to be ex-
tremely agile, and have a high tolerance for hot soil surfaces, often being seen out in the open
during the hottest parts of the day. They are extremely diverse and abundant in the Namib desert
[. ..] where they appear to thrive in spite of the adverse environmental conditions" (PARENZEE,
2001, p.33). While these two beetles appear over the whole year it comes to a significant rise of
biodiversity during the months of May and June. As recorded there were heavy rainfalls at the end
of March and also at the end of April and HOLM (1970, p.17) indicates: "As a food source, the
"rain" flora is much more important, and when present, produces the most phenomenal explosion
of arthropod populations". After the rain a high number of Onymacris rugatipenis, Zophosis orbicu-
lari, Metriopus depressus, Stenocara velox and Stenocara phalangium, mainly coming from the
Kuiseb river bed, entered the partially with grass covered dunes and the biodiversity of beetles
rose significantly for over two months because of the sufficient food and shelter supply during this
period. But not all beetles came from the river bed. A few detritus feeders (e.g. Stenocara phalan-
gium) are just present in the dunes during the winter period where detritus is brought in by the
easterly wind (see HOLM, 1970, p.29).
All traps on site 8 and 11 out of 13 traps in site A had this significant rise of biodiversity in March
and April, while only two traps (A7 and A 13) did not change their index over the whole year. Find-
ing an explanation for these two exceptions is difficult. Looking at the site one can recognize a
slight increase of stony underground by these traps. This stony area could have caused a faster
off-wash of rainwater so that fewer plants grew after the rain in this area. Furthermore the ground
could also only be a bad housing and sheltering place for the beetles so that the biodiversity
stayed low here independent from the rain.
On site A the annual biodiversity varies between the single traps. Although the interval is quitesmall some pit traps do have a 4 times lower biodiversity index than others in site A. Pit trap A 1,
A7, A13 and A15 have the lowest index and some of these sites have a stony surrounding which
could (as mentioned before) be the reason for the low biodiversity. On site 8 the diversity between
the traps is more balanced although one can recognize that the traps in the north (B1 to 87 and
819 to 823) have a higher diversity than the traps in the south (89 to 817). A possible answer for
this phenomena could be the immigration of beetles after the rain from the river bed in the north.
Dominant beetle species in the Interdunes are: Onymacris plana, Zophosis moralesi, Stenocara
sp. and Metriopus sp.
6.4 Quartz Hill (ecosystem 3)
At Quartz Hill the Coleoptera biodiversity was not only low over the year but also very unbalanced.
The monthly results seem to be chaotic and without any recognizable course or certain pattern. InFigure 3.1.4, where the values have been set as dots, a slight rise of biodiversity in June, July and
November can be registered. June and July could be the result of the rain in March and April, how-
ever the Quartz Hill can not register such a Significant rise in beetle biodiversity like at theInterdunes. This means that the ecosystem Quartz Hill seems to be in terms of Coleoptera biodi-
versity independent on the annual rainfalls or at least much more independent than the Interdunesare. In fact one beetle species, Metriopus depressus, did have a significant growth after the rain

and during wintertime, but because it was usually the only present beetle the richness and there-
fore the biodiversity was near to zero. During the year a few other beetles like Eostolopus
octoseriatus and Onymacris rugatipenis occurred for a short while, but usually only one dominant
species at a time, so that the richness and the resulting biodiversity was low here too.
The annual results indicate that especially pit trap group D possesses a higher diversity in all traps
without any exception while in other groups at least a few pit traps have a very low index. The pit
trap group D is located in the gravel plain surrounded by higher stones while pit trap group A is on
a quartz hill mountain and group Band C are in the open dry grass plains. The site with pit trap
group D (as mentioned with higher stones around) has randomly got small plants in the area which
are also green during summer time. These plants and the stones seem to be an important biotic
and abiotic factor for the beetles. In the open dry grass plains (with pit trap group Band C) the en-
vironment is very harsh and nearly no Coleoptera (however several scorpions, lizards, silverfish
and ants) can be found there.Dominant beetle species at Quartz Hill are: Zophosis sp. (amabilis, moralesi, obiculari) (description
of Zophosis see number 6.3 "Interdune") and Metriopus depressus.
6.5 Problems which could falsify resultsA very general problem using the pitfall traps regularly is that because of the monitoring the sur-rounding gets disturbed continuously by walking towards the pit traps and back again. To minimize
this impact all pit traps in Gobabeb are only allowed to be approached by certain tracks. Another
factor of disturbance is the wind, which casually blows in already dead insects and also digs out
the pit traps partially so that no animals can fall in any more. Especially in the Kuiseb river bed the
flood during wintertime disturbed the recording of the pit falls and sometimes certain pitfall trap
groups could not be reached at all. In this analysis these (flood) zero values were not included in
the calculation. A very specific problem in Gobabeb is that interns monitor the pit traps during the
year. Sometimes a few interns cannot identify the animals correctly or sum them up to a single
group. When doing research on biodiversity a summed up group (containing different species) can
lower the diversity dramatically. Sometimes the data was also lacunar or inaccurate. Another diffi-
culty is the freeing of the animals, because this happens exactly next to the trap, so that the
animals can sometimes be caught in the trap again quite quickly after release. Here a marking
method and analysis of recapture could help out, however this would cost a lot of effort and time
and perhaps would not cure the problem in the end.HOLM (1970, p.6) says that: "Certain diurnal tenebrionid species (Stenocara phalangium, Onyma-
chris plana) were strongly attracted to shade, or indeed even black objects". This means that the
dark hole of the pitfall trap attracts certain beetles more than others, which could lead to an incor-
rect capture result. Especially in the Gobabeb Interdunes these two named beetles occur very
often. To prevent this attraction it would be possible to install the rim of the trap a few millimeters
above the sand surface, which however could avoid the trapping of other, smaller animals again.

7 SummaryFor the whole year 2006 the (Shannon-Wiener) biodiversity index of Coleoptera (beetles) was in-
vestigated in 3 different ecosystems (Kuiseb river bed, Interdunes and Quartz Hill) around
Gobabeb research and training centre in the central Namib desert. For the analysis, the ongoing
data monitoring of the pitfall traps were used. Comparing all biodiversity values with the literature,
they seem to be low because in most publications all animal species have been included, while this
work only includes Coleoptera (beetles) as a basis for calculation.
The ephemeral Kuiseb river has different green vegetation (trees and bushes) throughout the en-
tire year because of the groundwater level at about 5m beneath the surface. This supply of food
and shelter is provided to a lot of different beetle species and the calculated annual biodiversity
index is about 3,5 times higher than in the remaining two ecosystems. But this does not mean that
the Interdunes and Quartz Hill have a low quality habitat, because this research (as already men-
tioned) only regarded beetles, while in the Interdunes and at Quartz Hill a lot of other animals (e.g.
scorpions, lizards, geckos, ants and silverfish) can be found. However a lot of different beetle spe-
cies at the Interdunes occur rather seldom and only a few, very well adapted Coleoptera (O.plana,
Zmoreiesi; can survive in the dunes during the whole year. But after the rain in March and April
the biodiversity increased significantly for over two months which leads us to the conclusion that
according to the abundance of different beetle species, the Interdunes are very strongly dependent
on rain. In comparison to that the Quarz Hill area does not react in change of beetle diversity after
rain so intensively. Quarz Hill has rather got fluctuating but constant values over the year.Summing up high diversity of beetles is strongly connected with different varieties of flora. In
places with only one plant species, biodiversity is comparable low, whereas at places with mixedvegetation the biodiversity of Coleoptera can be very high and wonderfully diverse.
8 References• HOLM, E., 1970, The influence of climate on the activity patterns and abundance of
xerophilous Namib desert dune insects, PhD. - Pretoria
• MAPAURE, 1.,2006, Field Biology, Lecture Notes, University of Namibia. - Windhoek
• PARENZEE, L., 2001, Use of Tenebrionid Beetles as Indicators of Habitat Quality,
PhD. - Witwatersrand
• PRICE, P., 1984, Insect Ecology, second edition. - Arizona
• SPELLERBERG, I., 1995, Monitoring ecological change. - Cambridge
9 AppendixCD containing: 1 Report (1 *.doc file and 1 *.pdf file)
3 Data calculation sheets (3 *.xls files)2 Maps (2 *.doc files)