ANALYSIS OF TEMPERATURE, PRECIPITATION AND POTENTIAL ... · ANALYSIS OF TEMPERATURE, PRECIPITATION...
17
Geographia Technica, Vol. 09, Issue 2, 2014, pp 68 to 84 ANALYSIS OF TEMPERATURE, PRECIPITATION AND POTENTIAL EVAPOTRANSPIRATION TRENDS IN SOUTHERN OLTENIA IN THE CONTEXT OF CLIMATE CHANGE Remus PRĂVĂLIE 1 ABSTRACT: The analysis of a territory’s climate trends are currently major research interests, as this is a viable method for identifying changes in climatic parameters against the background of global climate change, which at the same time can provide basic support for environmental system adjustments. The present study aims to identify the temporal trends of the main climate parameters (temperature, precipitation and potential evapotranspiration) in southern Oltenia, based on climate data provided by five regional weather stations (Drobeta Turnu Severin, Calafat, Craiova, Bechet and Turnu Măgurele). The analysis covers the 1961 - 2009 period, and the nonparametric Mann-Kendall test was used as trend quantification method. The entire study was conducted on three temporal analysis scales – annual, seasonal (spring, summer, autumn and winter) and monthly. The results showed specificities for each climatic parameter on each of the three temporal scales. For the average temperature, trends are mainly upward on annual and seasonal scales (generally statistically significant), except for autumn, when a slight cooling trend lacking statistical significance was found. The same general pattern was identified for evapotranspiration, save for the fact that autumn’s negative trends are statistically relevant. For rainfall, while trends are generally decreasing annually and seasonally, except for autumn (characterized by positive trends), its dynamics status is uncertain as a result of the general lack of statistical significance. The monthly regime analysis revealed visibly more pronounced trend dynamics for all three climatic parameters. Key-words: Southern Oltenia, Climate change, Climate parameters, Trends, Mann-Kendall. 1. INTRODUCTION Presently, there is an increasingly global research concern with climate change-related issues, which is currently one of the most critical global environmental changes of the Anthropocene (Steffen et al, 2011). A large share of the studies on climate change are presently directed towards the analysis of the key climate parameters’ variability, which influences Earth’s biophysical processes, i.e. temperature, rainfall and evapotranspiration. In the last century (1906-2005), the mean global temperature increased by approximately 0.74 °C (IPCC, 2007; Sayemuzzaman, Jha & Mekonnen, 2014), and the process can be divided into two main phases – 1910-1940 (warming by 0.35 °C) and 1970- up to present day, during which a notably higher warming rate is being recorded (0.55 ° C) (IPCC, 2007). Although a general climate warming phenomenon can therefore be noticed worldwide, there are certain regional differences in terms of magnitude (global warming is particularly noticeable at high latitudes in the Northern Hemisphere, over land regions). Among the most important planetary-scale consequences, tipping points stand out (global warming effect autoacceleration mechanisms), e.g. the ongoing polar ice cap melting (albedo changes due to the disappearance of ice) (Callaghan et al, 2011; Lenton, 2012). 1 University of Bucharest, 010041 Bucharest, Romania, [email protected].
Transcript of ANALYSIS OF TEMPERATURE, PRECIPITATION AND POTENTIAL ... · ANALYSIS OF TEMPERATURE, PRECIPITATION...

Geographia Technica, Vol. 09, Issue 2, 2014, pp 68 to 84
ANALYSIS OF TEMPERATURE, PRECIPITATION AND POTENTIAL
EVAPOTRANSPIRATION TRENDS IN SOUTHERN OLTENIA
IN THE CONTEXT OF CLIMATE CHANGE
Remus PRĂVĂLIE1
ABSTRACT: The analysis of a territory’s climate trends are currently major research interests, as this is a
viable method for identifying changes in climatic parameters against the background of
global climate change, which at the same time can provide basic support for environmental
system adjustments. The present study aims to identify the temporal trends of the main
climate parameters (temperature, precipitation and potential evapotranspiration) in southern
Oltenia, based on climate data provided by five regional weather stations (Drobeta Turnu
Severin, Calafat, Craiova, Bechet and Turnu Măgurele). The analysis covers the 1961 -
2009 period, and the nonparametric Mann-Kendall test was used as trend quantification
method. The entire study was conducted on three temporal analysis scales – annual,
seasonal (spring, summer, autumn and winter) and monthly. The results showed
specificities for each climatic parameter on each of the three temporal scales. For the
average temperature, trends are mainly upward on annual and seasonal scales (generally
statistically significant), except for autumn, when a slight cooling trend lacking statistical
significance was found. The same general pattern was identified for evapotranspiration,
save for the fact that autumn’s negative trends are statistically relevant. For rainfall, while
trends are generally decreasing annually and seasonally, except for autumn (characterized
by positive trends), its dynamics status is uncertain as a result of the general lack of
statistical significance. The monthly regime analysis revealed visibly more pronounced
trend dynamics for all three climatic parameters.
Key-words: Southern Oltenia, Climate change, Climate parameters, Trends, Mann-Kendall.
1. INTRODUCTION
Presently, there is an increasingly global research concern with climate change-related
issues, which is currently one of the most critical global environmental changes of the
Anthropocene (Steffen et al, 2011). A large share of the studies on climate change are
presently directed towards the analysis of the key climate parameters’ variability, which
influences Earth’s biophysical processes, i.e. temperature, rainfall and evapotranspiration.
In the last century (1906-2005), the mean global temperature increased by
approximately 0.74 °C (IPCC, 2007; Sayemuzzaman, Jha & Mekonnen, 2014), and the
process can be divided into two main phases – 1910-1940 (warming by 0.35 °C) and 1970-
up to present day, during which a notably higher warming rate is being recorded (0.55 ° C)
(IPCC, 2007). Although a general climate warming phenomenon can therefore be noticed
worldwide, there are certain regional differences in terms of magnitude (global warming is
particularly noticeable at high latitudes in the Northern Hemisphere, over land regions).
Among the most important planetary-scale consequences, tipping points stand out (global
warming effect autoacceleration mechanisms), e.g. the ongoing polar ice cap melting
(albedo changes due to the disappearance of ice) (Callaghan et al, 2011; Lenton, 2012).
1 University of Bucharest, 010041 Bucharest, Romania, [email protected].

Remus PRĂVĂLIE / ANALYSIS OF TEMPERATURE, PRECIPITATION AND POTENTIAL … 69
Rainfall has a much higher spatial variability, and the changes are related to certain
specificities such as quantity, precipitation type, intensity and frequency. While many of the
planetary regions have been affected by significant precipitation rate decreases (southern
Europe, Africa and Asia, the Sahel), there are regions where rainfall rates have increased
over recent decades (IPCC, 2007). Northern Eurasia, northern North America, southern
South America and East Africa are the most visible examples for liquid precipitation gain,
which is largely a consequence of global climate warming (atmospheric water vapour
amount increase). Therefore, a major current change of this parameter is related to the
precipitation type (as snow falls behind liquid precipitation, especially in the northern
regions which are more heavily affected by temperature rise), with preeminent
consequences on environmental systems such as hydrological systems (Hodgkins, Dudley
& Huntington, 2003; Stewart, Cayan, & Dettinger, 2005; Bîrsan et al, 2014; Mitof &
Prăvălie, 2014).
Evapotranspiration is the third most important climate parameter, following
temperature and precipitation, and plays an essential role in mass and energy flows between
the atmospheric and terrestrial systems (Thomas, 2000; Croitoru et al, 2013). There are
numerous global regions affected by this parameter’s intensification, e.g. Mediterranean
region (Chaouche et al, 2010; Espadafor et al, 2011) and Middle East (Tabari & Marofi,
2011; Tabari, Nikbakht & Hosseinzadeh Talaee, 2012). Although evapotranspiration is
largely influenced by temperature, it was observed that, contrary to global warming, its
values decreased in recent decades in many areas in the USA, India, Thailand, Australia,
New Zealand and China (IPCC, 2007). The decreasing trends are due to a complex series of
reasons, generally of anthropogenic nature. For instance, it is highly likely that the
evapotranspiration decrease in China be due to the sunshine duration decrease resulting
from the amplification of pollution and aerosols in the atmosphere, and that of the cloud
cover (IPCC, 2007).
In Romania, studies have shown that the three climatic parameters have undergone
significant changes over the past half-century, with notable seasonal differences.
Temperature had an overall increasing trend in winter, spring and summer, and a mild
decreasing one in autumn (Busuioc et al, 2009). Rainfall generally decreased in winter and
spring, and increased in many regions of the country in summer and especially in autumn
(Busuioc et al, 2009). Evapotranspiration had a general increase in all seasons except for
autumn, when most of the weather stations recorded lower values (Croitoru et al, 2013).
This paper aims to identify spatial and temporal trends of the three climate parameters
between 1961 and 2009 in southern Oltenia with the Mann-Kendall method, which is
widely used in the international literature focusing on climate variability. This study is
relevant both in terms of climatic context (as the region has been subjected to intense
climate aridization over the past decades due to the changes in the parameters’ regimes)
(Prăvălie, 2013a), and in terms of methodology, as it tries to perform a more detailed
climatic trend analysis (such as those made at a monthly scale), compared to other country-
wide studies.
2. DATA AND METHODS
The study area covers southern Oltenia, situated in south-western Romania (Fig. 1),
and is delimited by the Danube in the west and south, by Olt River in the east, and by the
Getic Plateau in the north. It consists of 113 administrative-territorial units and,
geographically, the study area mostly overlaps the Oltenia Plain, except for its north-

70
western region which corresponds to a piedmont area (Getic Plateau). Climatically, the
region is subjected to oceanic and Mediterranean influences, which cause higher
temperatures and rainfall amounts compared to other regions in southern Romania.
Considering the values provided by regional weather stations, mean multiannual
temperatures range between 11 and 12 °C, while average multiannual rainfall amounts
approximately fall in the 500-650 mm interval (1961-2009 period).
Fig. 1 Location of the study area, southern Oltenia, in Romania.
For climate trend analysis, this paper used climate data such as mean monthly and
annual temperatures (°C), and monthly and annual amounts of rainfall (mm) and potential
evapotranspiration (mm), and the analysed period covers a 49 year-range (1961-2009). The
temperature and precipitation data were provided by five regional weather stations situated
in the area of the respective cities (Drobeta Turnu Severin, Calafat, Craiova, Bechet and
Turnu Măgurele) (Fig. 1), and were obtained through the ECA&D platform (Klein Tank et
al, 2002), for the Drobeta Turnu Severin, Craiova and Turnu Măgurele stations, and from
the National Meteorology Administration (NMA, 2014), for the remaining two stations.
Based on monthly temperature values, potential evapotranspiration (PET) was computed by
Thornthwaite’s method (Thornthwaite, 1948), which has produced satisfactory results for
Romanian territories (Păltineanu et al, 2007), although it does have certain limitations
related to the fact that it only makes use of the temperature parameter.
Based on the climate data collected from the five weather stations, annual, seasonal
and monthly temporal trends were quantified for the 1961-2009 period. This analysis
entailed the use of the Mann-Kendall nonparametric test through the Excel MAKESENS
application, developed by the Finnish Meteorological Institute (Salmi et al, 2002). The test
operates with four trend statistical significance thresholds, namely α = 0.001, α = 0.01, α =
0.05 and α = 0.1. For the graphical analysis of climate data, the vectorized grid method was
used in GIS environment (Cheval, Baciu & Breza, 2003), adapted for the present study
through the Spline point grid data interpolation method (Prăvălie, Sîrodoev & Peptenatu,
2014). Also, Office Excel was used for trend graphical rendering. The analysis of these
graphs is important because it provides additional information (compared to the table
values obtained by applying the Mann-Kendall statistical test) on the trend dynamics
interval throughout the analyzed period.
It is important however to note that between table trends and graphic trends there may
be certain discrepancies, in some cases (for stationary trends or those close to stationarity),
which is due to the slope trend computation algorithm of the Mann-Kendall test.
Remus PRĂVĂLIE / ANALYSIS OF TEMPERATURE, PRECIPITATION AND POTENTIAL … 71
3. RESULTS AND DISCUSSIONS
Temperature trends
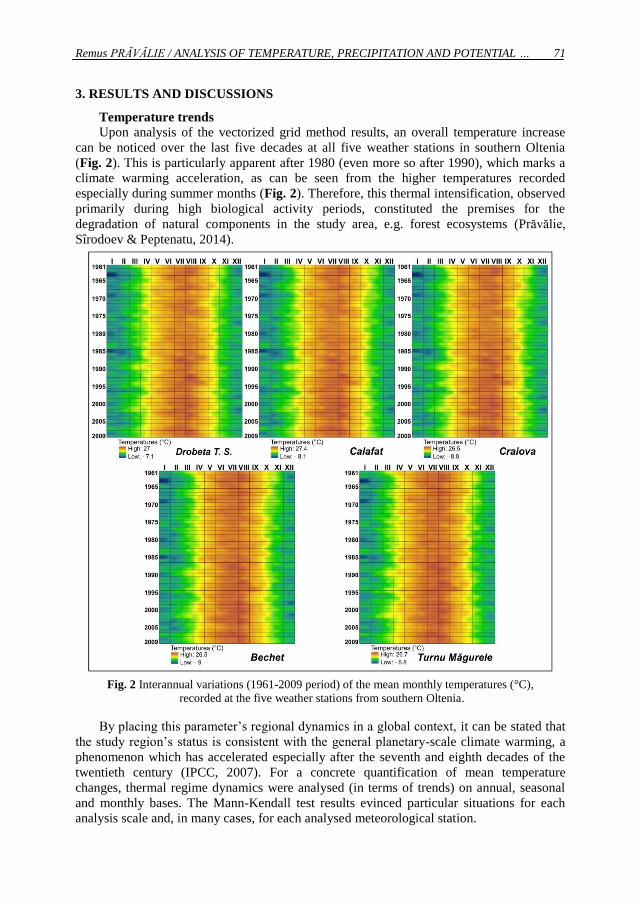
Upon analysis of the vectorized grid method results, an overall temperature increase
can be noticed over the last five decades at all five weather stations in southern Oltenia
(Fig. 2). This is particularly apparent after 1980 (even more so after 1990), which marks a
climate warming acceleration, as can be seen from the higher temperatures recorded
especially during summer months (Fig. 2). Therefore, this thermal intensification, observed
primarily during high biological activity periods, constituted the premises for the
degradation of natural components in the study area, e.g. forest ecosystems (Prăvălie,
Sîrodoev & Peptenatu, 2014).
Fig. 2 Interannual variations (1961-2009 period) of the mean monthly temperatures (°C),
recorded at the five weather stations from southern Oltenia.
By placing this parameter’s regional dynamics in a global context, it can be stated that
the study region’s status is consistent with the general planetary-scale climate warming, a
phenomenon which has accelerated especially after the seventh and eighth decades of the
twentieth century (IPCC, 2007). For a concrete quantification of mean temperature
changes, thermal regime dynamics were analysed (in terms of trends) on annual, seasonal
and monthly bases. The Mann-Kendall test results evinced particular situations for each
analysis scale and, in many cases, for each analysed meteorological station.

72
Fig. 3 Temperature (T) trends at annual, seasonal and monthly scales, recorded at the five
weather stations from southern Oltenia.

Remus PRĂVĂLIE / ANALYSIS OF TEMPERATURE, PRECIPITATION AND POTENTIAL … 73
Table 1. Temperature trend characteristics (resulting from the Mann-Kendall test) at annual,
seasonal and monthly scales, at the five weather stations from southern Oltenia.
Note: “+’’, “*’’, “**” and “***” indicate significance at α = 0.1, 0.05, 0.01 and 0.001 level,
respectively; the values without these symbols indicate lack of statistical significance.
Annually, in the 1961-2009 reference period, upward trends were recorded at all five
weather stations, statistically significant in all instances (with a significance level ranging
from 0.05 to 0.001) (Fig. 3, Table 1). The Calafat, Drobeta and Craiova stations are the
most representative for the amplified annual thermal regime, given the high rates of
temperature increase (with annual intensification values ranging from 0.21 to 0.24 °C, and
with a total increase over the entire 49-year period of more than 1 °C) (Table 1).
Seasonally, there are certain specificities for each season, related to both temporal
trend recorded values, and to their level of statistical confidence. In spring, while positive
trends were found at all stations (Fig. 3), only three were statistically significant (Drobeta,
Calafat and Craiova), where higher warming rates were identified (more than 1 °C
throughout the study period) compared to the other two stations (Table 1). This is due to
the months of March and May, as April does not influence temperature evolution in this
Temporal scale Mann-Kendall
test
Temperature (° C)
Drobeta
T.S. Calafat Craiova Bechet
Turnu
Măgurele
ANNUAL Sen’s slope (yr) 0.022*** 0.024** 0.021** 0.016* 0.019*
Sen’s slope (49 yr) 1.1 1.2 1.0 0.8 0.9
SE
AS
ON
AL
SPRING Sen’s slope (yr) 0.027* 0.032* 0.027* 0.020 0.021
Sen’s slope (49 yr) 1.3 1.6 1.3 1.0 1.0
SUMMER Sen’s slope (yr) 0.041*** 0.041*** 0.038*** 0.032** 0.035***
Sen’s slope (49 yr) 2.0 2.0 1.8 1.6 1.7
AUTUMN Sen’s slope (yr) -0.012 -0.013 -0.012 -0.011 -0.008
Sen’s slope (49 yr) -0.6 -0.7 -0.6 -0.5 -0.4
WINTER Sen’s slope (yr) 0.032* 0.033* 0.033* 0.021+ 0.021
Sen’s slope (49 yr) 1.6 1.6 1.6 1.0 1.1
MO
NT
HL
Y
January
Sen’s slope (yr) 0.05+ 0.05+ 0.05 0.033 0.04
Sen’s slope (49 yr) 2.5 2.5 2.5 1.6 2.0
February Sen’s slope (yr) 0.056+ 0.05 0.05 0.048 0.046
Sen’s slope (49 yr) 2.7 2.5 2.5 2.4 2.2
March Sen’s slope (yr) 0.041 0.056* 0.044* 0.038+ 0.039+
Sen’s slope (49 yr) 2.0 2.7 2.2 1.8 1.9
April Sen’s slope (yr) 0.013 0.009 0.012 0.000 0.009
Sen’s slope (49 yr) 0.7 0.4 0.6 0.0 0.4
May Sen’s slope (yr) 0.031* 0.033* 0.023 0.019 0.017
Sen’s slope (49 yr) 1.5 1.6 1.1 0.9 0.8
June Sen’s slope (yr) 0.036** 0.043** 0.038** 0.033* 0.033**
Sen’s slope (49 yr) 1.8 2.1 1.9 1.6 1.6
July Sen’s slope (yr) 0.043*** 0.043*** 0.039** 0.032** 0.033***
Sen’s slope (49 yr) 2.1 2.1 1.9 1.6 1.6
August Sen’s slope (yr) 0.043* 0.041* 0.036* 0.034* 0.036*
Sen’s slope (49 yr) 2.1 2.0 1.8 1.7 1.7
September Sen’s slope (yr) -0.017 -0.021 -0.021 -0.013 -0.018
Sen’s slope (49 yr) -0.8 -1.0 -1.1 -0.6 -0.9
October Sen’s slope (yr) 0.000 0.007 0.003 0.008 0.006
Sen’s slope (49 yr) 0.0 0.3 0.2 0.4 0.3
November Sen’s slope (yr) -0.021 -0.025 -0.022 -0.027 -0.020
Sen’s slope (49 yr) -1.0 -1.2 -1.1 -1.3 -1.0
December Sen’s slope (yr) 0.008 0.006 0.013 0.003 -0.005
Sen’s slope (49 yr) 0.4 0.3 0.7 0.2 -0.3

74
season (trends are almost stationary at all five stations, and are not statistically significant).
Interestingly, March has the highest statistical confidence level out of the three spring
months, and also has the maximum monthly warming rate recorded at the weather stations
in the study region (Bechet station, where the warming rate over the 49 years amounted to
2.7 °C, which was found in only one other instance – in February, at the Drobeta station)
(Table 1).
Summer is the season with the most obvious climate warming, as the positive trends
(statistically significant at high thresholds in all cases, i.e. α - 0.01 and 0.001) recorded high
warming rates (between 1.6 – 2 ° C) over the 49 years (Fig. 3, Table 1). While the highest
monthly warming values are found in July and August, all three summer months generally
show high thermal rates, at high statistical significance thresholds (Table. 1).
Autumn is an exception to the entire seasonal context due to decreasing thermal trends
(Fig. 3). While all stations detected variable climate cooling in this season, the cooling rates
did not have high values (they ranged between -0.4 and -0.7 °C / 49 years) and lacked
statistical significance at all weather stations (Table 1). This season's trend specificity is
due to September and November (cooling rates over 49 years generally exceed 1 °C), as
October is an exception (while slope values are positive, they are stationary or very close to
being stationary); however, none of the monthly trends is statistically significant (Table 1).
In winter, all stations recorded increasing trends (statistically significant, with one
exception – Turnu Măgurele station), with annual rates ranging from 0.021 to 0.033 °C, and
rates over 49 years falling in the 1 - 1.6 °C interval (Fig. 3, Table 1). January and February
had the greatest influence on the overall warming of the entire season (warming rates / 49
generally exceeding 2 °C, with a 2.7 °C peak at Drobeta station, in February), while
December trends are almost stationary, or even negative (at Turnu Măgurele).
Therefore, the trends identified in this region of south-western Romania are consistent
with the overall nation-scale temperature change pattern. A general nation-wide climate
warming was noticed in spring, summer and winter (especially outside of Carpathian
regions), and a slight cooling in autumn (lacking statistical significance, however) (Busuioc
et al, 2010), which resembles this case study’s results.
One of the main causes of these temperature dynamics in Romania is related to the
frequency and intensity amplification of high altitude anticyclone structures in recent
decades, a phenomenon which has led to the increase of air temperature at 850 mb (and,
implicitly, of that in the lower troposphere, near ground level) in winter, spring and
summer, while autumn had conflicting trends due to the decrease of these structures’
frequency at this particular atmospheric altitude (Busuioc et al, 2009).
Another important cause is linked to the North Atlantic Oscillation mechanism (NAO),
specifically to the positive phase of the phenomenon, the intensification of which has led to
an accelerated climate warming over recent decades, especially in the extra-Carpathian
regions of Romania, where the study area is located (Busuioc et al, 2009).
Precipitation trends
Upon analysis of the overall rainfall regime dynamics, the vectorized grid results
revealed a general decrease in precipitation amounts, especially after 1980, at all five
weather stations (Fig. 4). Thus, a general decrease can be noticed especially during
biologically active periods (April-October), which caused, for this climatic parameter as
well, an acceleration of climatic stress on natural components (e.g. forests) over the past
decades (Prăvălie, Sîrodoev & Peptenatu, 2014).

Remus PRĂVĂLIE / ANALYSIS OF TEMPERATURE, PRECIPITATION AND POTENTIAL … 75
Regarding the trend statistical, while results indicated specificities for each temporal
regime (annual, seasonal and monthly), it was found that this parameter generally shows
uncertain dynamics, with trends lacking statistical significance in most of the analysed
cases. Annually, trends indicated a general decrease (lacking statistical significance) of
rainfall amounts (at all stations, except for Calafat), with annual rates ranging from -0.5 to -
1.6 mm, or from -24 to -76 mm when considering the 49-year rate (Fig. 5, Table 2).
Fig. 4 Interannual variations (1961-2009 period) of the monthly amounts of rainfall (mm),
recorded at the five weather stations from southern Oltenia.
Seasonally, the spring season is generally characterized by the most apparent decreases
in precipitation amounts (Fig. 5), which come close to -70 mm over the entire analysed
period for the Drobeta Turnu Severin station. While it is the only season showing statistical
significance, it only does so at Drobeta and Calafat stations (Table 2). Spring’s status is due
to the months of March and May, as March is the only spring month with a statistically
significant decrease rate (the highest was recorded at the Drobeta station, but with a
minimum significance level) (Table 2).

76
Fig. 5 Precipitation (P) trends at annual, seasonal and monthly scales, recorded at the five
weather stations from southern Oltenia.

Remus PRĂVĂLIE / ANALYSIS OF TEMPERATURE, PRECIPITATION AND POTENTIAL … 77
Table 2. Precipitation trend characteristics (resulting from the Mann-Kendall test) at annual,
seasonal and monthly scales, at the five weather stations from southern Oltenia.
Temporal scale Mann-Kendall
test
Precipitation (mm)
Drobeta
T.S. Calafat Craiova Bechet
Turnu
Măgurele
ANNUAL Sen’s slope (yr) -1.553 0.756 -1.388 -0.483 -0.856
Sen’s slope (49 yr) -76.1 37.0 -68.0 -23.7 -41.9
SE
AS
ON
AL
SPRING Sen’s slope (yr) -1.401* -0.952* -0.751 -0.182 -0.417
Sen’s slope (49 yr) -68.7 -46.6 -36.8 -8.9 -20.4
SUMMER Sen’s slope (yr) 0.015 1.049 -0.146 -0.170 -0.154
Sen’s slope (49 yr) 0.7 51.4 -7.2 -8.3 -7.5
AUTUMN Sen’s slope (yr) 0.069 0.775 0.600 0.323 0.746
Sen’s slope (49 yr) 3.4 38.0 29.4 15.8 36.6
WINTER Sen’s slope (yr) -0.628 -0.324 -0.346 -0.423 -0.395
Sen’s slope (49 yr) -30.7 -15.9 -16.9 -20.7 -19.4
MO
NT
HL
Y
January
Sen’s slope (yr) -0.100 -0.081 0.010 0.036 0.064
Sen’s slope (49 yr) -4.9 -4.0 0.5 1.8 3.1
February Sen’s slope (yr) -0.568+ -0.415+ -0.365+ -0.185 -0.300
Sen’s slope (49 yr) -27.8 -20.4 -17.9 -9.0 -14.7
March Sen’s slope (yr) -0.543+ -0.360 -0.053 -0.072 -0.008
Sen’s slope (49 yr) -26.6 -17.7 -2.6 -3.5 -0.4
April Sen’s slope (yr) -0.142 -0.210 -0.290 -0.172 -0.149
Sen’s slope (49 yr) -7.0 -10.3 -14.2 -8.4 -7.3
May Sen’s slope (yr) -0.540 -0.265 -0.323 -0.110 -0.160
Sen’s slope (49 yr) -26.5 -13.0 -15.9 -5.4 -7.9
June Sen’s slope (yr) 0.180 -0.028 -0.132 -0.227 -0.314
Sen’s slope (49 yr) 8.8 -1.4 -6.5 -11.1 -15.4
July Sen’s slope (yr) -0.200 0.322 -0.225 0.112 0.147
Sen’s slope (49 yr) -9.8 15.8 -11.0 5.5 7.2
August Sen’s slope (yr) 0.064 0.693* -0.087 -0.105 -0.112
Sen’s slope (49 yr) 3.1 34.0 -4.3 -5.1 -5.5
September Sen’s slope (yr) 0.451 0.532* 0.301 0.307 0.426
Sen’s slope (49 yr) 22.1 26.1 14.7 15.0 20.9
October Sen’s slope (yr) -0.002 0.364 0.412+ 0.446 0.426
Sen’s slope (49 yr) -0.1 17.8 20.2 21.8 20.9
November Sen’s slope (yr) -0.244 -0.195 -0.348+ -0.420 -0.244
Sen’s slope (49 yr) -11.9 -9.5 -17.0 -20.6 -12.0
December Sen’s slope (yr) -0.063 0.087 0.028+ -0.137 -0.111
Sen’s slope (49 yr) -3.1 4.3 1.3 -6.7 -5.4
Note: “+’’, “*’’, “**” and “***” indicate significance at α = 0.1, 0.05, 0.01 and 0.001 level,
respectively; the values without these symbols indicate lack of statistical significance.
In summer, in three of the five cases, slightly decreasing precipitation trends were
detected (Craiova, Bechet and Turnu Măgurele), while at the Drobeta and Calafat stations
positive trends were identified (evident at Calafat, with a rate of 51.4 mm / 49 years);
however, all instances lacked statistical significance. In the three summer months, trend
slope values are generally relatively low, except for August, at the Calafat station (Fig. 5,
Table 2), where a pronounced variability rate was recorded, the only statistically significant
one out of all summer months.
Autumn represents a particular case in the rainfall seasonal variability analysis, as it is
the only season with precipitation amount increases recorded at all the weather stations.
Although these increases are evident (in terms of trend slope value) in four of the five cases
(except for the Drobeta station, which has an almost stationary trend) (Fig. 5), none of the
stations shows statistically significant trends. While the largest contribution to precipitation

78
increase, typical for this season, is attributed to the months of September and October (as
November is characterized by contrary, negative trends, statistically significant only at the
Craiova station), the two months do not generally show statistical significance (except for
the Calafat station in September, and Craiova in October) (Table 2).
Winter trend analysis reveals declines at all five weather stations, with rates ranging
from -15.9 to -30.7 mm over the 49 years (Table 2). This situation is due for the most part
to February, which is characterized by high trend slope values, statistically significant (at a
minimal threshold of α = 0.1) at three of the five weather stations in the study region
(Table 2).
By placing this analysis in the general precipitation dynamics context over the past five
decades in Romania, a certain level of similarity can be noticed between results for this
climatic parameter as well. Therefore, nationally, an overall precipitation decrease was
recorded in winter, spring and, partially, in summer, while in autumn significant increases
were detected over large areas, of which the most pronounced were found in south-eastern
and north-western regions of Romania (Busuioc et al, 2009; Busuioc et al, 2010). However,
regardless of the trends identified nationally or regionally (such as this study), an important
feature of precipitation is related to the temporal variability’s uncertainty, which means
that, in Romania at least, it is generally difficult to detect clear, statistically significant
trends of temporal and spatial changes for this climatic parameter.
Regarding the causes of these dynamics in recent decades, they are related to the
general increase in the frequency of anticyclonic structures over Romanian territory in
winter, spring and summer, which determined an overall rainfall amount decrease, as well
as an amplification of cyclonic structures in autumn, thus causing a precipitation increase in
this season (Busuioc et al, 2010). A particular situation can be noticed in summer, when in
addition to the amplified anticyclonic structures which played an essential role in reducing
rainfall over large areas in Romania, there was also an increase in the specific humidity of
air at 850 mb, responsible for precipitation increase in numerous regions throughout the
country (Busuioc et al, 2009). This study’s results’ status, in terms of summer trends
(precipitation decreases and increases) (Table 2), can be explained by these contrary effects
mechanisms of rainfall regimes. Other causes may be related to oscillations of the NAO
index, the positive phase of which, having accelerated after 1980, caused declines in
precipitation amounts in Romania in certain times of the year, e.g. winter season
(Tomozeiu, Stefan, & Busuioc, 2005), which means it is very likely for this phenomenon to
have influenced rainfall variability in the analysed region in south-western Romania, at
least in this season.
Potential evapotranspiration trends
The overall assessment of the temporal dynamics of this study’s last parameter reveals
a value increase roughly after 1985, especially in the warm season (the grid method
indicated obviously higher PET values mainly in July and August) (Fig. 6). This is largely
influenced by temperature dynamics, given the methodology for computing potential
evapotranspiration.
A detailed three-scale trend analysis revealed peculiarities for this parameter as well.
Annually, the five weather stations recorded apparent upward PET rate trends (high and
very high statistical confidence thresholds) ranging from 0.68 to 0.92 mm / year, or from
33.3 to 45.2 mm / 49 years (Fig. 7, Table 3). Seasonally, it can be noticed that spring is
characterized by relatively low variability rates (increase), reaching up to a maximum of
13.8 mm / 49 years at Calafat station. However, one of this season’s main features is having

Remus PRĂVĂLIE / ANALYSIS OF TEMPERATURE, PRECIPITATION AND POTENTIAL … 79
the lowest rate statistical confidence level (Table 3). Its rate values are mainly due to
March (Fig. 7, Table 3), which generally had the highest trend slope values, but with lack
of statistical significance (except for Calafat station in this month, April and May lacked
statistical significance in all considered cases).
Fig. 6 Interannual variations (1961-2009 period) of the monthly amounts of potential
evapotranspiration (mm), recorded at the five weather stations from southern Oltenia.
Summer is characterized by clear PET value increasing trends, ranging from 31.9 to
42.5 mm / 49 years, with a high degree of statistical confidence for all weather stations
(Table 3). Although PET increase values show statistical significance for all summer
months, July is the most evident by having both the highest positive rates, and the highest
degree of statistical significance.
Autumn is an exception, similarly to the temperature parameter, due to the negative
trends it recorded. These trends have relatively constant values, given that the rate interval
is limited, and ranges from -12 to -18 mm over the 49 years (Table 3). Also, statistical
significance is found in all cases, and falls in the α range 0.1 - 0.01. Of all autumn months,
September stands out, due to the higher trend slope values, and the statistical confidence
found at all five weather stations (Table 3).

80
Fig. 7 Potential evapotranspiration (PET) trends at annual, seasonal and monthly scales, recorded at
the five weather stations from southern Oltenia.

Remus PRĂVĂLIE / ANALYSIS OF TEMPERATURE, PRECIPITATION AND POTENTIAL … 81
Table 3. Potential evapotranspiration trend characteristics (resulting from the Mann-
Kendall test) at annual, seasonal and monthly scales, at the five weather stations from southern
Oltenia.
Temporal scale Mann-Kendall
test
Potential evapotranspiration (mm)
Drobeta
T.S. Calafat Craiova Bechet
Turnu
Măgurele
ANNUAL Sen’s slope (yr) 0.854*** 0.922*** 0.850** 0.765** 0.681**
Sen’s slope (49 yr) 41.9 45.2 41.6 37.5 33.3
SE
AS
ON
AL
SPRING Sen’s slope (yr) 0.267+ 0.282+ 0.254+ 0.155 0.201
Sen’s slope (49 yr) 13.1 13.8 12.5 7.6 9.9
SUMMER Sen’s slope (yr) 0.867*** 0.828*** 0.721*** 0.651** 0.740***
Sen’s slope (49 yr) 42.5 40.6 35.3 31.9 36.2
AUTUMN Sen’s slope (yr) -0.367** -0.373* -0.329* -0.271+ -0.251+
Sen’s slope (49 yr) -18.0 -18.3 -16.1 -13.3 -12.3
WINTER Sen’s slope (yr) 0.151* 0.146* 0.122* 0.101* 0.054
Sen’s slope (49 yr) 7.4 7.2 6.0 4.9 2.7
MO
NT
HL
Y
January
Sen’s slope (yr) 0.000 0.000 0.000 0.000 0.000
Sen’s slope (49 yr) 0.0 0.0 0.0 0.0 0.0
February Sen’s slope (yr) 0.075 0.000 0.006+ 0.008+ 0.007
Sen’s slope (49 yr) 3.7 0.0 0.3 0.4 0.4
March Sen’s slope (yr) 0.110 0.164+ 0.140 0.120 0.125
Sen’s slope (49 yr) 5.4 8.1 6.9 5.9 6.1
April Sen’s slope (yr) -0.002 -0.010 0.017 -0.041 -0.015
Sen’s slope (49 yr) -0.1 -0.5 0.8 -2.0 -0.8
May Sen’s slope (yr) 0.149 0.164 0.100 0.119 0.073
Sen’s slope (49 yr) 7.3 8.0 4.9 5.8 3.6
June Sen’s slope (yr) 0.259* 0.299** 0.249* 0.191* 0.225*
Sen’s slope (49 yr) 12.7 14.7 12.2 9.3 11.0
July Sen’s slope (yr) 0.299*** 0.306*** 0.246** 0.213** 0.237***
Sen’s slope (49 yr) 14.7 15.0 12.1 10.5 11.6
August Sen’s slope (yr) 0.274* 0.251* 0.242* 0.213* 0.240*
Sen’s slope (49 yr) 13.4 12.3 11.9 10.5 11.7
September Sen’s slope (yr) -0.147+ -0.173* -0.157* -0.125+ -0.141*
Sen’s slope (49 yr) -7.2 -8.5 -7.7 -6.1 -6.9
October Sen’s slope (yr) -0.065 -0.038 -0.052 -0.013 -0.010
Sen’s slope (49 yr) -3.2 -1.8 -2.6 -0.6 -0.5
November Sen’s slope (yr) -0.104+ -0.116+ -0.093 -0.118 -0.107
Sen’s slope (49 yr) -5.1 -5.7 -4.5 -5.8 -5.2
December Sen’s slope (yr) 0.000 0.000 0.000 0.000 0.000
Sen’s slope (49 yr) 0.0 0.0 0.0 0.0 0.0
Note: “+’’, “*’’, “**” and “***” indicate significance at α = 0.1, 0.05, 0.01 and 0.001 level,
respectively; the values without these symbols indicate lack of statistical significance.
The last season, winter, has slight increasing PET trends (Fig. 7), with rate values
which did not exceed 7.4 mm over the entire period (but generally statistically significant).
This season’s trends are due solely to February, as the other two months were stationary
(Table 3).
Following this parameter’s trend assessment and analysis, it can be stated that the
results are generally in accordance with certain country-wide studies (Croitoru et al, 2013),
which detected an overall increase in PET values both annually and seasonally, except for
autumn, similarly to the present study. However, in some cases certain differences arise
from potential evapotranspiration values obtained through different computation methods.
For the country-wide analysis made in Romania (Croitoru et al, 2013), trend results were
obtained based on PET values computed with the FAO Penman-Monteith method (Allen et
al, 1998), which is widely used in specialized studies - this is the main cause for any

82
potential discrepancies (especially with regard to statistical significance and, in very few
cases, to trend type) between the two studies. Moreover, upon analysis of this parameter’s
entire temporal dynamics and after having compared the results to rainfall variation, it can
be noticed that potential evapotranspiration trends generally showed clearly higher rates,
which means that the climatic water deficit has increased over the five-decade study period.
Autumn is an exception, as this season is representative for the excess climatic water
recorded between 1961 and 2009, which resulted from increased rainfall amounts and lower
evapotranspiration rates.
With regard to agricultural systems, as their dependence on climatic conditions has
increased significantly over recent decades, against the background of the general collapse
of irrigation systems (Prăvălie, 2013b), the climatic water deficit had a real impact on the
fluctuations (decrease) of agricultural yields (Bălteanu et al, 2013). Upon a separate
analysis of evapotranspiration, it was found that the general increasing trend of the 1961-
2009 period had an indirect impact on yield decline for southern Oltenia’s main crops
(wheat, corn, sunflower), by influencing (decreasing) groundwater levels (Prăvălie,
Peptenatu & Sîrodoev, 2013a). The ecological component is noteworthy as well, as it has
also been subjected to climate change-induced pressure. For instance, forest ecosystems
have degraded (withering) due to the region’s climate aridization (especially during
summer months), against the background of temperature rise (and implicitly potential
evapotranspiration increase) and rainfall decrease (Prăvălie, Sîrodoev & Peptenatu, 2013b;
Prăvălie, Sîrodoev & Peptenatu, 2014).
4. CONCLUSIONS
The present study aims to thoroughly analyse the dynamics (annual, seasonal and
monthly) of the main climatic parameters (mean temperatures, and precipitation and
potential evapotranspiration amounts) in south-western Romania, between 1961 and 2009.
To this end, climate data provided by five regional weather stations were analysed using the
Mann-Kendall statistical test as main trend quantification and analysis method. The results
revealed the following features of each climate parameter’s dynamics:
- the mean annual temperature had positive annual and seasonal trends (statistically
significant for the most part), except for autumn (cooling trends ranging from 0.4 to 0.7 °C
/ 49 years, lacking statistical significance); while annual warming rates / 49 years were
roughly situated around 1 °C, seasonal values were twice as high, e.g. summer (2 °C / 49
years or close to this threshold for all weather stations); almost all monthly instances had
positive trends (statistically significant especially in summer months), except for September
and November, characterized by decreasing temperatures;
- while rainfall had more acute dynamics, the identified trends show uncertainty due to
the general lack of statistical significance; an overall decrease was observed in precipitation
annually (with a maximum value of 76 mm / 49 years) and seasonally (the maximum value
close to -70 mm / 49 was recorded in spring), except for autumn (increase rates of up to 38
mm / 49 years) and, in part, summer (increases in two cases, with a maximum value of 51
mm / 49 years); monthly, generally negative trends were recorded, with clear exceptions in
January, July, September and October (months with increasing trends at at least three out of
five analysed weather stations);
- the last parameter, potential evapotranspiration, had relatively similar dynamics to
temperature; the trends identified between 1961 and 2009 are positive annually and
seasonally (except for autumn), and are generally statistically significant (the annual regime
Remus PRĂVĂLIE / ANALYSIS OF TEMPERATURE, PRECIPITATION AND POTENTIAL … 83
and summer are the most representative for high and very high levels of statistical
confidence); in terms of PET increase rates, it was found that, in some cases, they exceeded
40 mm / 49 years both annually and seasonally (summer); monthly, mostly positive trends
were observed, except for April, September, October and November, representative for
negative trends, but also except for December and January, which had stationary trends.
AKNOWLEDGEMENTS
The article has enjoyed the support of the Pluri and interdisciplinarity in doctoral and postdoctoral
program cofinanced by Ministry of National Education – OIR POSDRU, contract no.
POSDRU/159/1.5/S/141086.
R E F E R E N C E S
Allen, R. G., Pereira, L. S., Raes, D. & Smith, M. (1998) Crop evapotranspiration: guidelines for computing
crop water requirements. FAO Irrigation and Drainage Paper 56. Rome: FAO.
Bălteanu, D., Dragotă, C. S., Popovici, A., Dumitrașcu, M., Kucsicsa, Gh. & Grigorescu, I. (2013) Land use
and crop dynamics related to climate change signals during the post-communist period in the south
Oltenia, Romania. Proc. Rom. Acad., Series B, 15(3), 265–278.
Bîrsan, M. V., Zaharia, L., Chendes, V. & Branescu E. (2014) Seasonal trends in Romanian streamflow.
Hydrol. Process, 28, 4496-4505.
Busuioc, A., Caian, M., Bojariu, R., Boroneant, C., Cheval, S., Baciu, M. & Dumitrescu, A. (2009) Scenarii
de schimbare a regimului climatic în România în perioada 2001 – 2030. Administraţia Naţională de
Meteorologie.
Busuioc, A., Caian, M., Cheval, S., Bojariu, R., Boroneant, C., Baciu, M. & Dumitrescu A. (2010)
Variabilitatea si schimbarea climei in Romania. Pro Universitaria: Bucharest. ISBN: 978-973-129-
549-7.
Callaghan, T. V., Johansson, M., Key, J., Prowse, T., Ananicheva, M & Klepikov, A. (2011) Feedbacks and
Interactions: From the Arctic Cryosphere to the Climate System. AMBIO, 40, 75–86.
Chaouche, K., Neppel, L., Dieulin, C., Pujol, N., Ladouche, B., Martin, E., Salas, D. & Caballero Y. (2010)
Analyses of precipitation, temperature and evapotranspiration in a French Mediterranean region in the
context of climate change. Comptes Rendus Geosci., 342 (3), 234–243.
Cheval, S., Baciu, M. & Breza, T. (2003) An investigation into the precipitation conditions in Romania
using a GIS-based method. Theoretical and Applied Climatology, 76, 77–88.
Croitoru, A. E., Piticar, A., Dragotă, C. S. & Burada, D. C. (2013) Recent changes in reference
evapotranspiration in Romania. Global and Planetary Change, 111, 127–137.
Espadafor, M., Lorite, I. J., Gavilán, P. & Berengena J. (2011) An analysis of the tendency of reference
evapotranspiration estimates and other climate variables during the last 45 years in Southern Spain.
Agric. Water Manag., 98, 1045–1061.
Hodgkins, G. A., Dudley, R. W. & Huntington, T. G. (2003) Changes in the timing of high river flows in
New England over the 20th century. J. Hydrol., 278, 244–252.
IPCC. (2007) Climate Change 2007: The Physical Science Basis. Contribution of Working Group I to the
Fourth Assessment Report of the Intergovernmental Panel on Climate Change (Chapter 3:
Observations: Surface and Atmospheric Climate Change), Cambridge University Press, Cambridge,
UK, p 996.
Klein Tank, A. M. G., Wijngaard, J. B., Konnen, G. P., Bohm, R., Demarée, G., Gocheva, A., Mileta, M.,
Pashiardis, S., Hejkrlik, L., Kern-Hansen, C., Heino, R., Bessemoulin, P., Muller-Westermeier, G.,
Tzanakou, M., Szalai, S., Palsdottir, T., Fitzgerald, D., Rubin, S., Capaldo, M., Maugeri, M., Leitass,
A., Bukantis, A., Aberfeld, R., Van Engelen, A. F. V., Forland, E., Mietus, M., Coelho, F., Mares, C.,
Razuvaev, V., Nieplova, E., Cegnar, T., Antonio Lopez, J., Dahlstrom, B., Moberg, A., Kirchhofer,
W., Ceylan, A., Pachaliuk, O., Alexander, L.V. & Petrovic, P. (2002) Daily dataset of 20th-century
surface air temperature and precipitation series for the European Climate Assessment. Int. J. of
Climatol., 22, 1441-1453. [Online] Available from : http://eca.knmi.nl.

84
Lenton, T. M. (2012) Arctic Climate Tipping Points. AMBIO, 41,10–22.
Mitof, I. & Prăvălie, R. (2014) Temporal trends of hydroclimatic variability in the lower Buzău catchment.
Geographia Technica, 9(1), 87-100.
Păltineanu, C., Mihailescu, I. F., Seceleanu, I., Dragotă, C. & Vasenciuc, F. (2007) Using aridity indexes to
describe some climate and soil features in Eastern Europe: a Romanian case study. Theoretical and
Applied Climatology, 90, 263–274.
Prăvălie, R. (2013a) Climate issues on aridity trends of Southern Oltenia in the last five decades.
Geographia Technica, 1, 70-79.
Prăvălie, R. (2013b) Aspects regarding spatial and temporal dynamic of irrigated agricultural areas from
Southern Oltenia in the last two decades. Present Environment and Sustainable Development, 7 (2),
133-143.
Prăvălie, R., Peptenatu, D. & Sîrodoev, I. (2013a) The impact of climate change on the dynamics of
agricultural systems in South-Western Romania. Carpathian Journal of Earth and Environmental
Sciences, 8(3), 175 – 186.
Prăvălie, R., Sîrodoev, I. & Peptenatu D. (2013b) Changes in the forest ecosystems in areas impacted by
aridization in south-western Romania. Journal of Environmental Health Science and Engineering, 12,
2.
Prăvălie, R., Sîrodoev, I. & Peptenatu, D. (2014) Detecting climate change effects on forest ecosystems in
South-Western Romania using Landsat TM NDVI data. Journal of Geographical Sciences, 24 (5),
815–832.
Salmi, T., Määttä, A., Anttila, P., Ruoho-Airola, T. & Amnell T. (2002) Detecting trends of annual values
of atmospheric pollutants by the Mann-Kendall test and Sen’s slope estimates - the Excel template
application MAKESENS. ISBN 951-697-563-1, Finnish Meteorological Institute, Helsinki, Finlanda.
Sayemuzzaman, M., Jha, M. K. & Mekonnen, A. (2014) Spatio-temporal long-term (1950–2009)
temperature trend analysis in North Carolina, United States. Theoretical and Applied Climatology.
Available from: doi:10.1007/s00704-014-1147-6.
Steffen, W., Persson, A., Deutsch, L., Zalasiewicz, J., Williams, M., Richardson, K., Crumley, C., Crutzen,
P., Folke, C., Gordon, L., Molina, M., Ramanathan, V., Rockstrom, J., Scheffer, M., Schellnhuber,
H.J. & Svedin, U. (2011) The Anthropocene: From Global Change to Planetary Stewardship. AMBIO,
40, 739–761.
Stewart, I. T., Cayan, D. R. & Dettinger, M. D. (2005) Changes toward Earlier Streamflow Timing across
Western North America. Journal of Climate, 18, 1136-1155.
Tabari, H. & Marofi S. (2011) Changes of Pan Evaporation in the West of Iran. Water Resources
Management, 25 (1), 97-111.
Tabari, H., Nikbakht, J. & Hosseinzadeh Talaee, P. (2012) Identification of trend in reference
evapotranspiration series with serial dependence in Iran. Water Resour Manage, 26, 2219–2232.
Thomas, A. (2000) Spatial and temporal characteristics of potential evapotranspiration trends over China.
Int. J. Climatol., 20, 381–396.
Thornthwaite, C. W. (1948) An approach toward a rational classification of climate. The Geographical Rev,
38 (1), 55–94.
Tomozeiu, R., Stefan, S. & Busuioc A. (2005) Winter precipitation variability and large-scale circulation
patterns in Romania. Theoretical and Applied Climatology, 81, 193–201.
*** 2014, NMA (National Meteorological Administration), data series regarding average monthly
temperatures and monthly precipitation amounts at the Calafat and Bechet weather stations (1961-
2009).