Analysis of SWAT Simulated Soil Moisture with the MODIS ...
32
Geun Ae PARK / Alan F. HAMLET Department of Civil and Environmental Engineering, University of Washington, USA Woo Yong HONG / Ji Wan LEE / Hyung Jin SHIN / Cheol Hee Jang / Department of Civil & Environmental System Eng., Konkuk University, South Korea Seong Joon KIM Professor, Dept. of Civil & Environmental System Eng., Konkuk University, South Korea Analysis of SWAT Simulated Soil Moisture with the MODIS Land Surface Temperature and Vegetation Index for Soyanggang Dam Watershed of South Korea
Transcript of Analysis of SWAT Simulated Soil Moisture with the MODIS ...
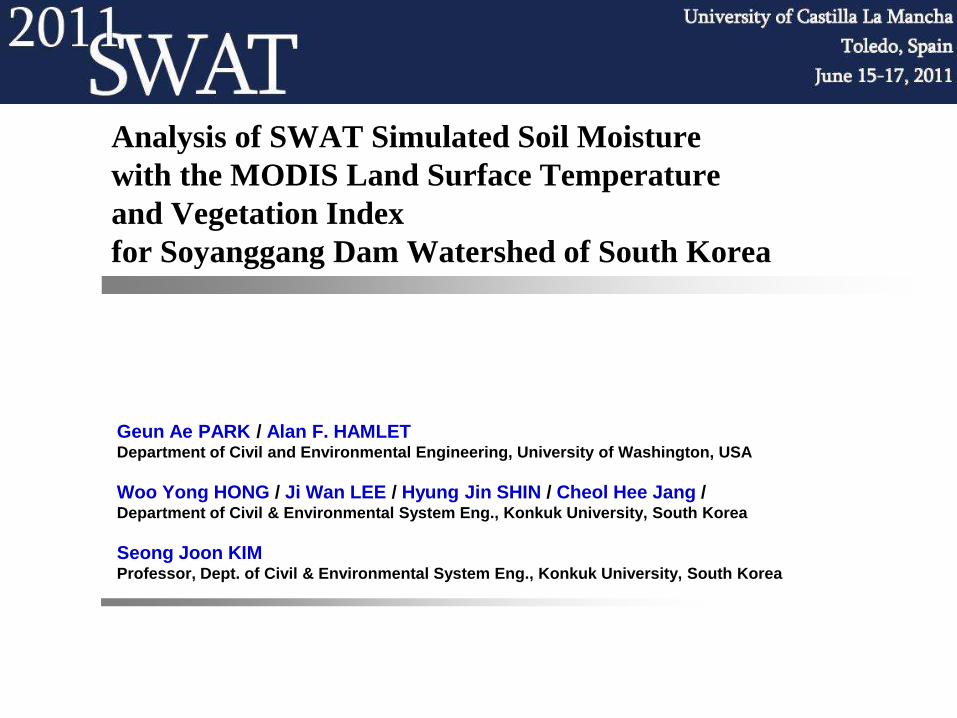
Geun Ae PARK / Alan F. HAMLET Department of Civil and Environmental Engineering, University of Washington, USA
Woo Yong HONG / Ji Wan LEE / Hyung Jin SHIN / Cheol Hee Jang / Department of Civil & Environmental System Eng., Konkuk University, South Korea
Seong Joon KIM Professor, Dept. of Civil & Environmental System Eng., Konkuk University, South Korea
Analysis of SWAT Simulated Soil Moisture
with the MODIS Land Surface Temperature
and Vegetation Index
for Soyanggang Dam Watershed of South Korea

I. Introduction
II. Process of This Study
III. Material and Method
A. Study Watershed
B. SWAT Model Description
C. Input Datasets for Calibration and Validation of the SWAT Model
D. MODIS NDVI & LST
IV. Result and Discussion
A. Model Calibration and Validation for the Streamflow
B. Model Calibration and Validation for the Soil Moisture
C. The Correlation Analysis
D. The Multiple Regression Analysis
V. Summary and Conclusion
Contents

Introduction
Soil moisture is an important hydrologic component of water balance, and
highly dependent on the surface temperature and vegetation vitality under
the spatial land cover condition.
Recently, researches to evaluate the watershed scale soil moisture have been
attempted by using satellite products to overcome the limited information of
field scale soil moisture. The monitoring and modelling of land surface and/or
vegetation processes by using satellite images viz. NOAA AVHRR and Terra
and Aqua MODIS is now popular.
MODIS NDVI and LST can be a useful indicator to analyze the soil moisture
during the active growing of crop or plant, and to determine the soil moisture
condition for drought monitoring (Narasimhan et al., 2005).
This study is to identify how much MODIS NDVI and LST products can explain
soil moisture of forest area by using SWAT simulated soil moisture results.

Process of This Study
SWAT Model
SWAT Input Data
DEM, Land Use, Soil, Meteorological Data
Calibration & Validation
(Streamflow, Soil Moisture)
Simulated Soil Moisture
by Forest Land Use
Terra and Aqua MODIS
MODIS/Terra Vegetation Indices 16-days Global L3
250m
MODIS NDVI
(Normalized Distributed
Vegetation Index)
by Forest Land Use
Correlation Analysis and Multiple Regression Analysis
between SM and NDVI, LST
MODIS/Terra and Aqua Temperature
Indices 8-days Global L3 1km
MODIS LST
(Land Surface
Temperature)
by Forest Land Use

Material and Method
Study Watershed
Study area: 2,694.4 km2
forest-dominant (93 %) watershed
The watershed was subdivided into 3 sub-watersheds, which the division locations are Wontong, Naerincheon, and SoyanggangDam water level gauging stations.
The annual average precipitation is 1,359.5 mm, and the mean temperature is 9.4 ℃ over the last 30 years (1977 - 2006).
In the watershed, three measured soil moisture stations(Inje, Chuncheon1, Chuncheon2) was located.

Material and Method
SWAT Model Description
)(1
0 gwseepasurf
t
i
dayt QWEQRSWSW
SWt = Final soil water content (mm)
SW0 = Initial soil water content on day i (mm)
Rday = Amount of precipitation on day i (mm)
Qsurf = Amount of surface runoff on day i (mm)
Ea = Amount of evapotranspiration on day i (mm)
Wseep = Amount of water entering the vadose zone from the soil profile on day i (mm)
Qgw = Amount of return flow on day i (mm)
Soil and Water Assessment Tool (SWAT, developed by Arnold et al. in 1998)

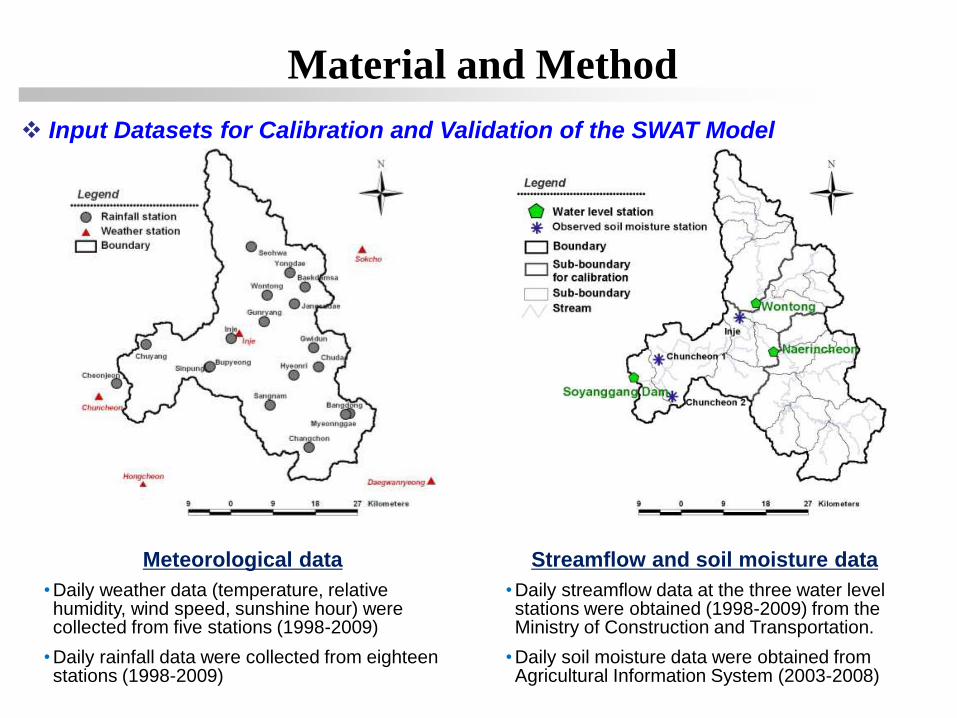
Material and Method
Input Datasets for Calibration and Validation of the SWAT Model
Land use
• the 9 categories
•prepared by 2000 Landsat TM (Thematic Mapper) supervised classification with NOAA NDVI
Elevation
• range : 155 - 1,639 m
•average : 643.9 m
Soil
• loam (52.4 %), and loamy sand (42.4 %)
Material and Method
Input Datasets for Calibration and Validation of the SWAT Model
Meteorological data
•Daily weather data (temperature, relative humidity, wind speed, sunshine hour) were collected from five stations (1998-2009)
•Daily rainfall data were collected from eighteen stations (1998-2009)
Streamflow and soil moisture data
•Daily streamflow data at the three water level stations were obtained (1998-2009) from the Ministry of Construction and Transportation.
•Daily soil moisture data were obtained from Agricultural Information System (2003-2008)
Material and Method
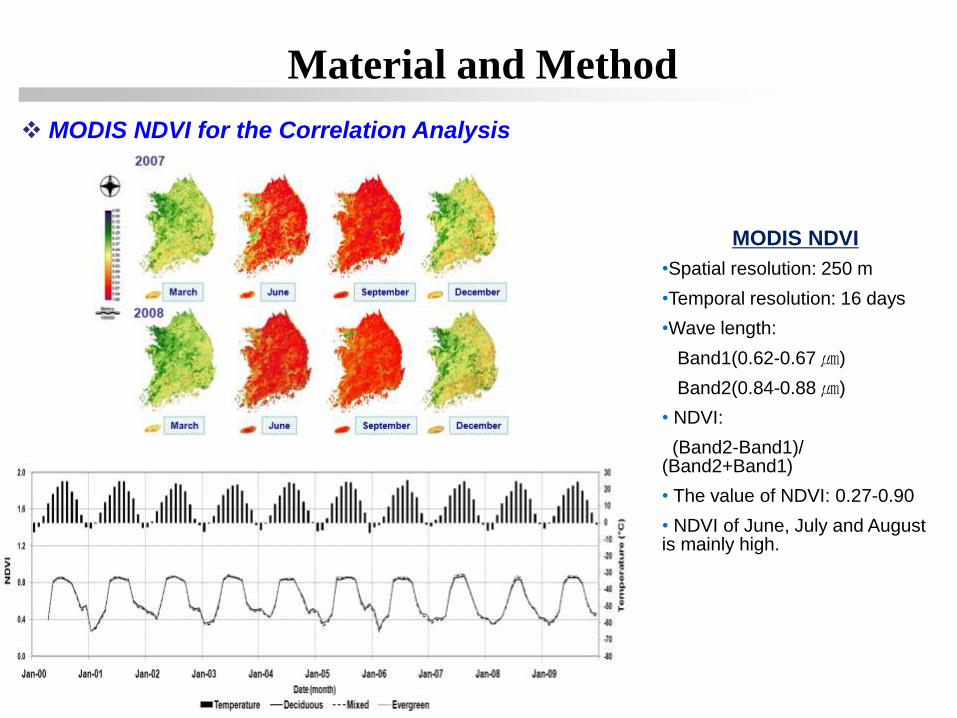
MODIS NDVI for the Correlation Analysis
MODIS NDVI
•Spatial resolution: 250 m
•Temporal resolution: 16 days
•Wave length:
Band1(0.62-0.67 ㎛)
Band2(0.84-0.88 ㎛)
• NDVI:
(Band2-Band1)/ (Band2+Band1)
• The value of NDVI: 0.27-0.90
• NDVI of June, July and August is mainly high.
Material and Method
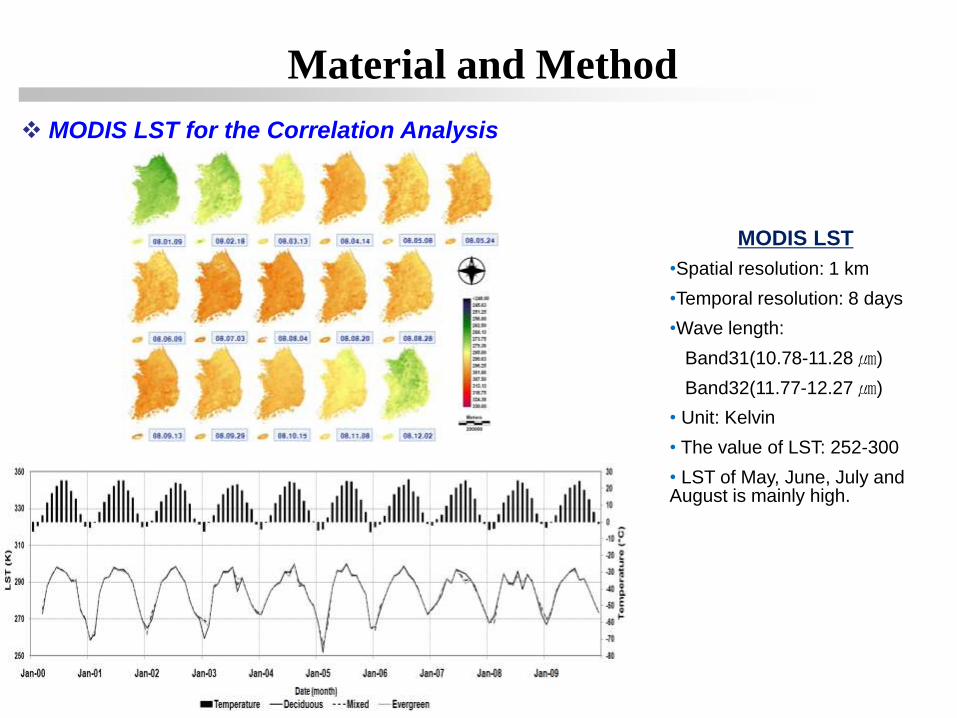
MODIS LST for the Correlation Analysis
MODIS LST
•Spatial resolution: 1 km
•Temporal resolution: 8 days
•Wave length:
Band31(10.78-11.28 ㎛)
Band32(11.77-12.27 ㎛)
• Unit: Kelvin
• The value of LST: 252-300
• LST of May, June, July and August is mainly high.
Result and Discussion
Model Calibration and Validation
for the Streamflow

Result and Discussion
The Descriptions
Parameter Description Calibration
Range
Wontong
Optimal value
Naerincheon
Optimal value
Soyanggang Dam
Optimal value
CN2 Curve number adjustment ratio ± 20% 0 10 10
ESCO Soil evaporation compensation 0.01 - 1 0.5 0.3 0.02
SOL_AWC Available water capacity ± 20% 10 - 10 5
SFTMP Snowfall temperature (℃) - 5 - 5 1 1 1
SMTMP Snow melt base temperature (℃) - 5 - 5 0.5 0.5 0.5
SMFMX Maximum snow melt factor (mm
H2O/ºC-day) 0 - 10 4.5 4.5 4.5
SMFMN Minimum snow melt factor (mm
H2O/ºC-day) 0 - 10 4.5 4.5 4.5
TIMP Snow pack temperature lag factor 0 - 1 1 1 1
LAT_TTIME Lateral flow travel time (days) - 3 3 2
GW_DELAY Groundwater delay time (days) 0 - 500 180 150 180
CH_K2 Effective hydraulic conductivity of
main channel 0 - 150 70 20 20
SWAT model setup process
No. of Subbasin : 20
No. of HRU : 348
The calibrated model parameters at 3 sub-watersheds
Result and Discussion
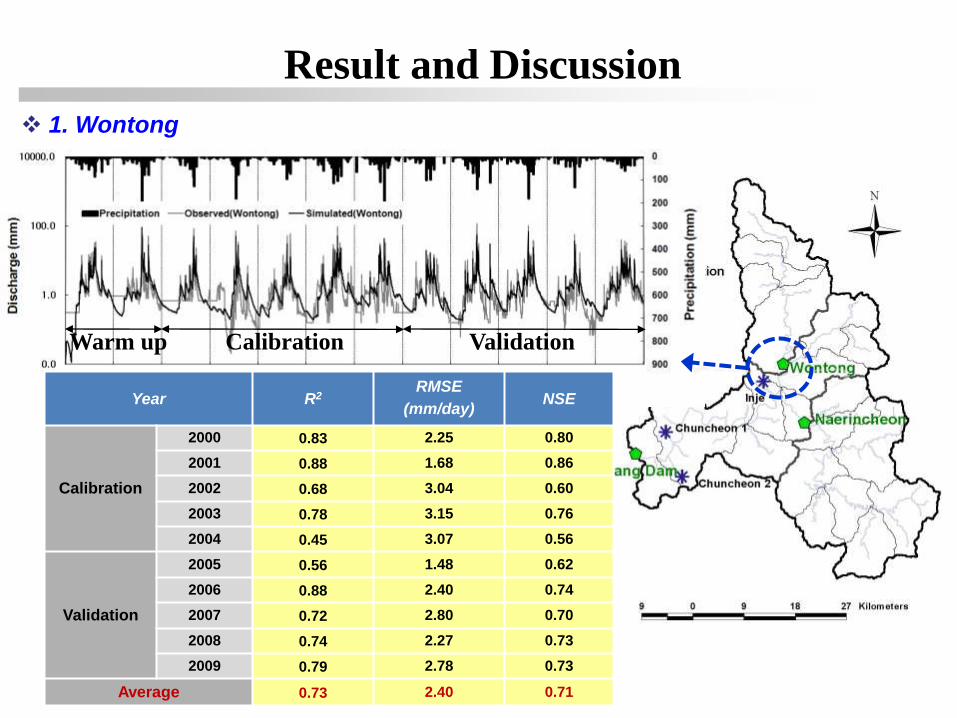
1. Wontong
Year R2 RMSE
(mm/day) NSE
Calibration
2000 0.83 2.25 0.80
2001 0.88 1.68 0.86
2002 0.68 3.04 0.60
2003 0.78 3.15 0.76
2004 0.45 3.07 0.56
Validation
2005 0.56 1.48 0.62
2006 0.88 2.40 0.74
2007 0.72 2.80 0.70
2008 0.74 2.27 0.73
2009 0.79 2.78 0.73
Average 0.73 2.40 0.71
Warm up Calibration Validation

Result and Discussion
Year R2 RMSE
(mm/day) NSE
Calibration
2000 0.82 2.68 0.74
2001 0.66 1.78 0.65
2002 0.70 3.52 0.70
2003 0.70 2.72 0.54
2004 0.94 3.13 0.94
Validation
2005 0.64 2.91 0.63
2006 0.84 3.44 0.78
2007 0.82 2.08 0.75
2008 0.78 3.53 0.72
2009 0.79 2.75 0.69
Average 0.77 2.85 0.71
Warm up Calibration Validation
2. Naerincheon

Result and Discussion
Year R2 RMSE
(mm/day) NSE
Calibration
2000 0.70 1.91 0.68
2001 0.86 3.06 0.77
2002 0.82 2.09 0.70
2003 0.80 2.72 0.71
2004 0.70 1.91 0.68
Validation
2005 0.70 1.91 0.68
2006 0.86 3.06 0.77
2007 0.82 2.09 0.70
2008 0.80 2.72 0.71
2009 0.83 2.62 0.73
Average 0.79 2.41 0.71
Warm up Calibration Validation
3. Soyanggang Dam
Result and Discussion
Model Calibration and Validation
for the Soil Moisture

Result and Discussion
1. InJe
Year Observed
(%)
Simulated
(%) R2
Calibration 2003 17.3 18.7 0.60
2004 15.6 19.0 0.60
Validation
2005 - - -
2006 14.4 12.8 0.72
2007 19.8 17.5 0.60
2008 18.9 17.4 0.64
Average 17.2 17.0 0.63
Result and Discussion
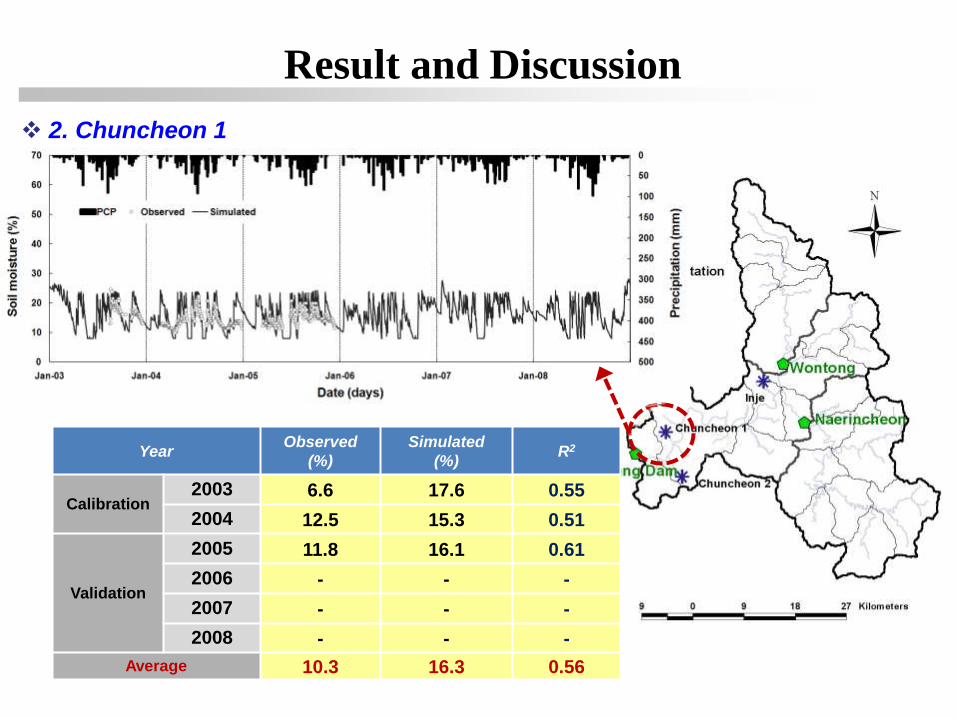
2. Chuncheon 1
Year Observed
(%)
Simulated
(%) R2
Calibration 2003 6.6 17.6 0.55
2004 12.5 15.3 0.51
Validation
2005 11.8 16.1 0.61
2006 - - -
2007 - - -
2008 - - -
Average 10.3 16.3 0.56
Result and Discussion
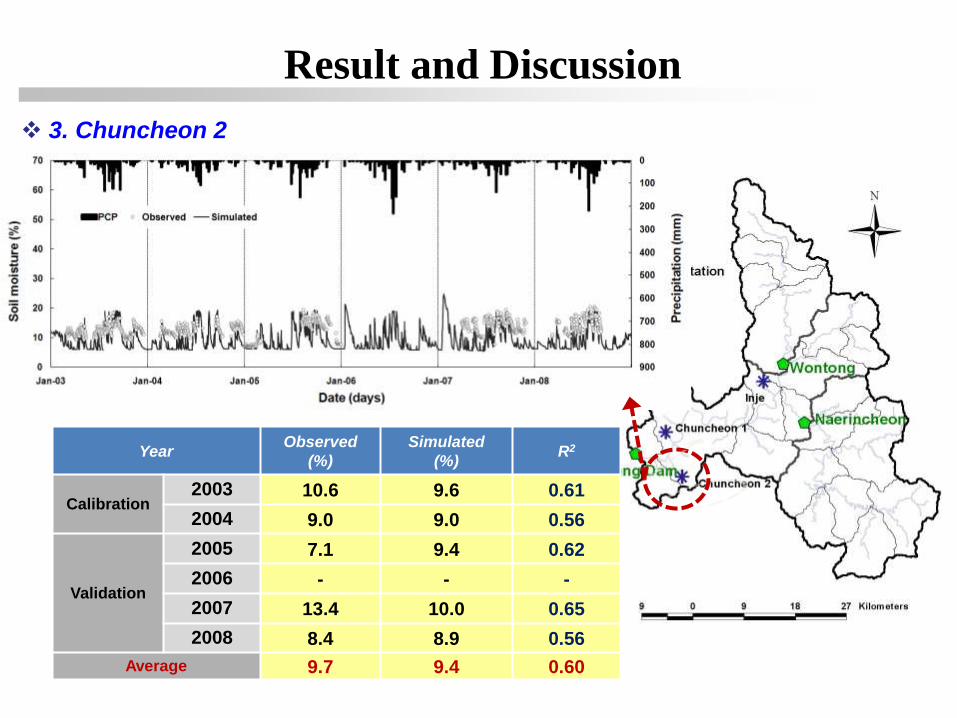
3. Chuncheon 2
Year Observed
(%)
Simulated
(%) R2
Calibration 2003 10.6 9.6 0.61
2004 9.0 9.0 0.56
Validation
2005 7.1 9.4 0.62
2006 - - -
2007 13.4 10.0 0.65
2008 8.4 8.9 0.56
Average 9.7 9.4 0.60
Result and Discussion
The Correlation Analysis

Result and Discussion
Between SWAT Soil Moisture and MODIS NDVI
Forest leaf growing period (March – June)
Coefficient of determination Precipitation, Temperature and Soil moisture
Result and Discussion
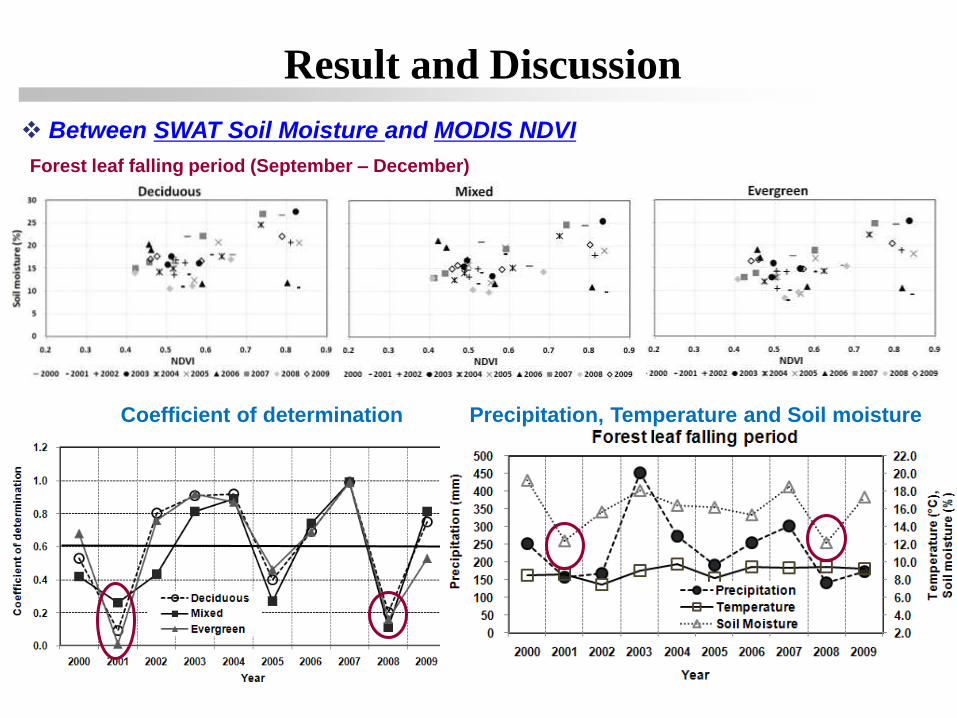
Between SWAT Soil Moisture and MODIS NDVI
Forest leaf falling period (September – December)
Coefficient of determination Precipitation, Temperature and Soil moisture
Result and Discussion
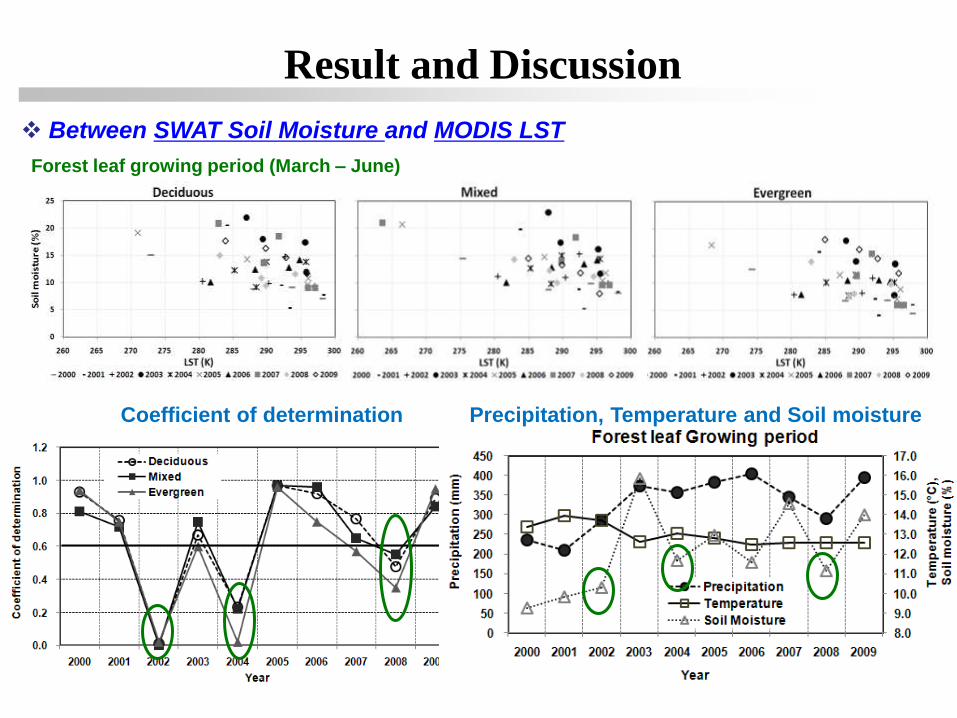
Between SWAT Soil Moisture and MODIS LST
Forest leaf growing period (March – June)
Coefficient of determination Precipitation, Temperature and Soil moisture

Result and Discussion
Between SWAT Soil Moisture and MODIS LST
Forest leaf falling period (September – December)
Coefficient of determination Precipitation, Temperature and Soil moisture
Result and Discussion
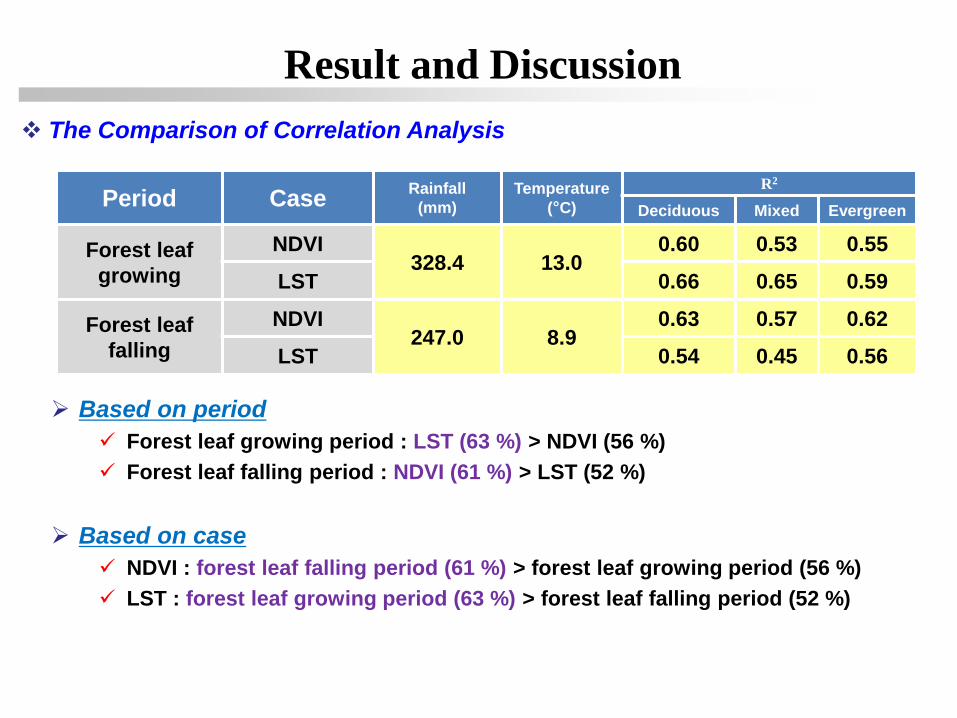
The Comparison of Correlation Analysis
Period Case Rainfall
(mm)
Temperature
(°C)
R2
Deciduous Mixed Evergreen
Forest leaf
growing
NDVI 328.4 13.0
0.60 0.53 0.55
LST 0.66 0.65 0.59
Forest leaf
falling
NDVI 247.0 8.9
0.63 0.57 0.62
LST 0.54 0.45 0.56
Based on period
Forest leaf growing period : LST (63 %) > NDVI (56 %)
Forest leaf falling period : NDVI (61 %) > LST (52 %)
Based on case
NDVI : forest leaf falling period (61 %) > forest leaf growing period (56 %)
LST : forest leaf growing period (63 %) > forest leaf falling period (52 %)

Result and Discussion
The Multiple Regression Analysis
Result and Discussion
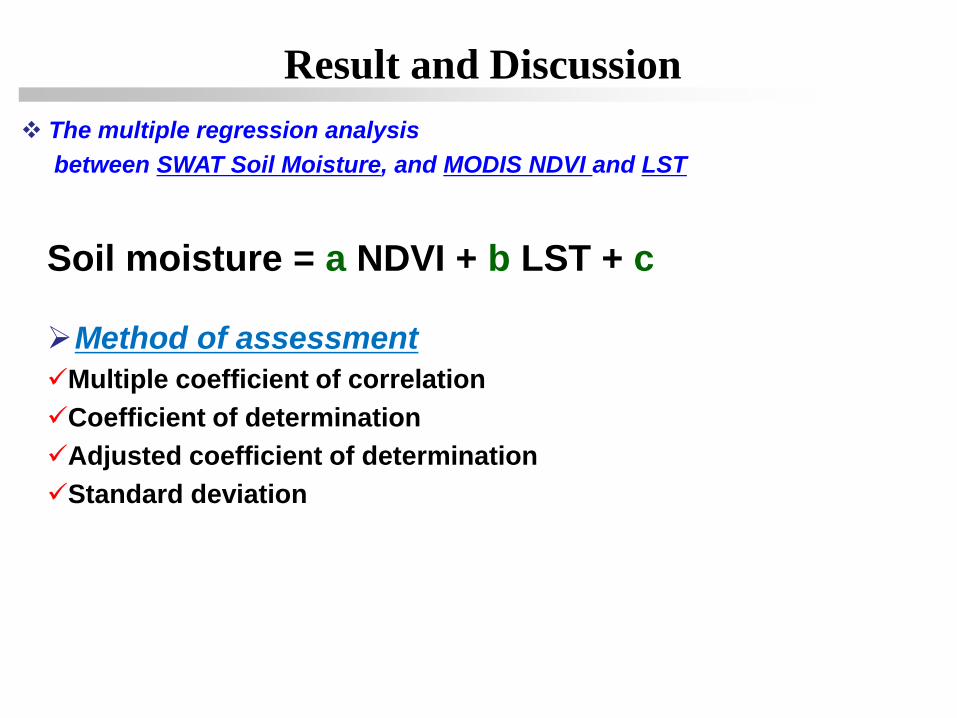
The multiple regression analysis
between SWAT Soil Moisture, and MODIS NDVI and LST
Soil moisture = a NDVI + b LST + c
Method of assessment
Multiple coefficient of correlation
Coefficient of determination
Adjusted coefficient of determination
Standard deviation
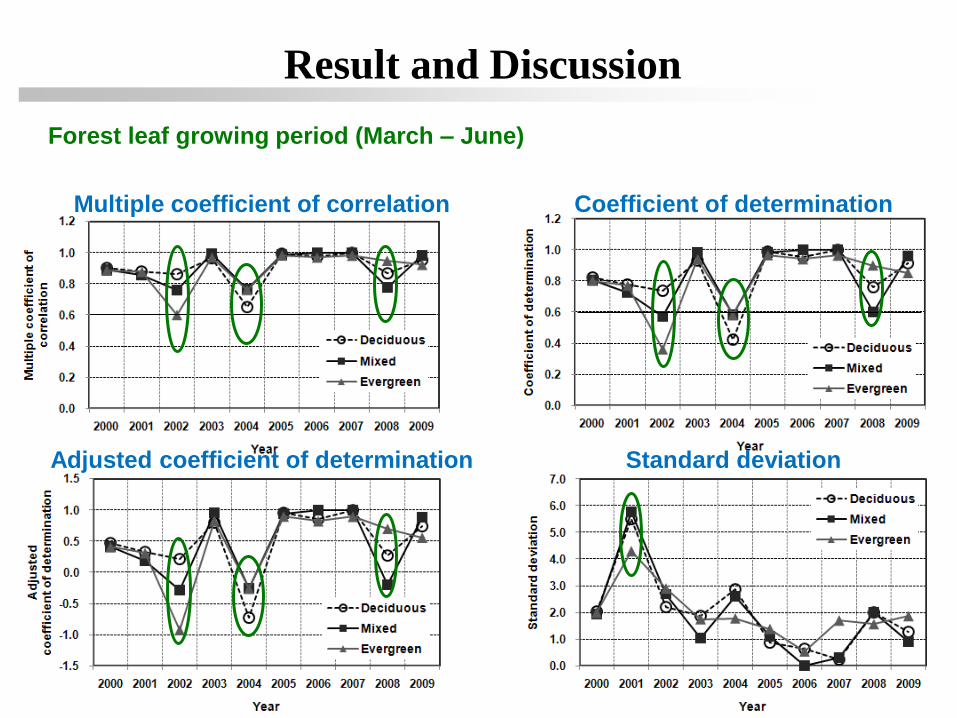
Result and Discussion
Forest leaf growing period (March – June)
Multiple coefficient of correlation Coefficient of determination
Adjusted coefficient of determination Standard deviation
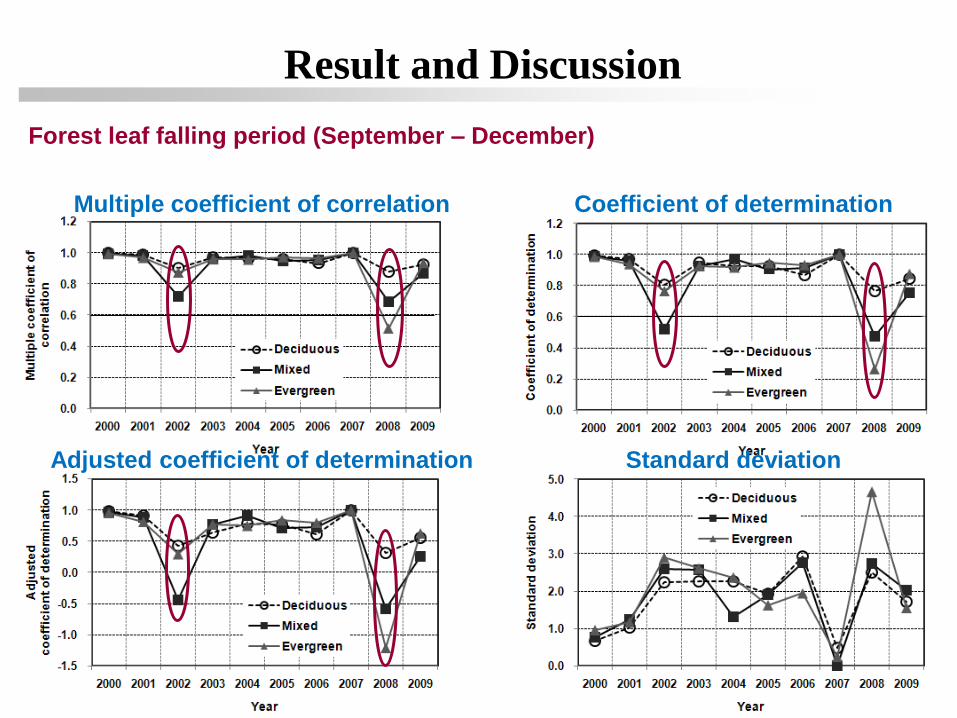
Result and Discussion
Forest leaf falling period (September – December)
Multiple coefficient of correlation Coefficient of determination
Adjusted coefficient of determination Standard deviation
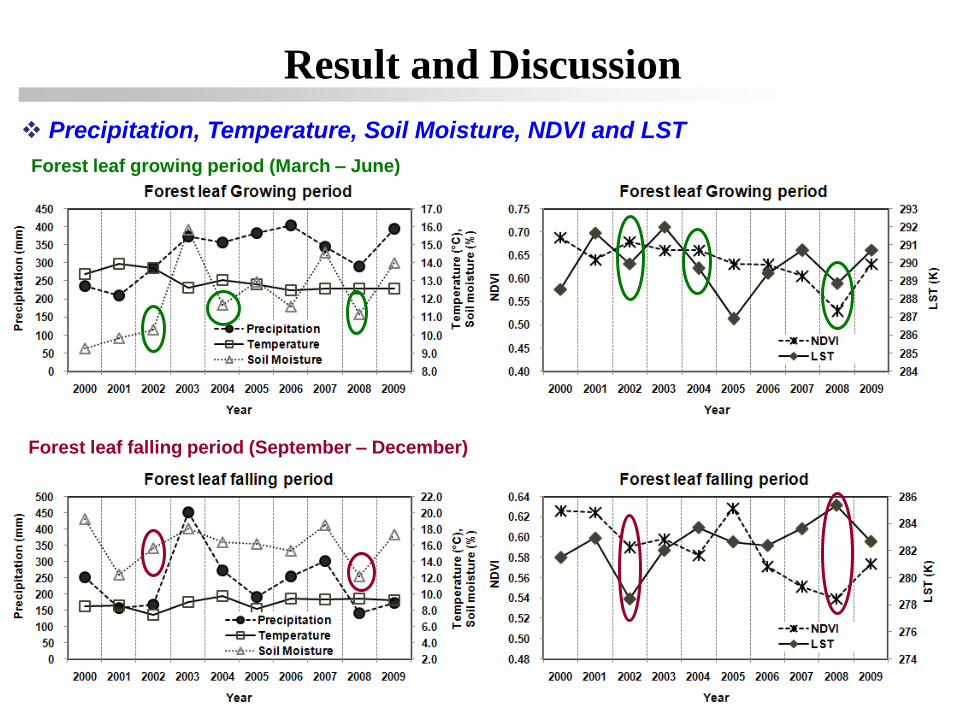
Result and Discussion
Precipitation, Temperature, Soil Moisture, NDVI and LST
Forest leaf falling period (September – December)
Forest leaf growing period (March – June)
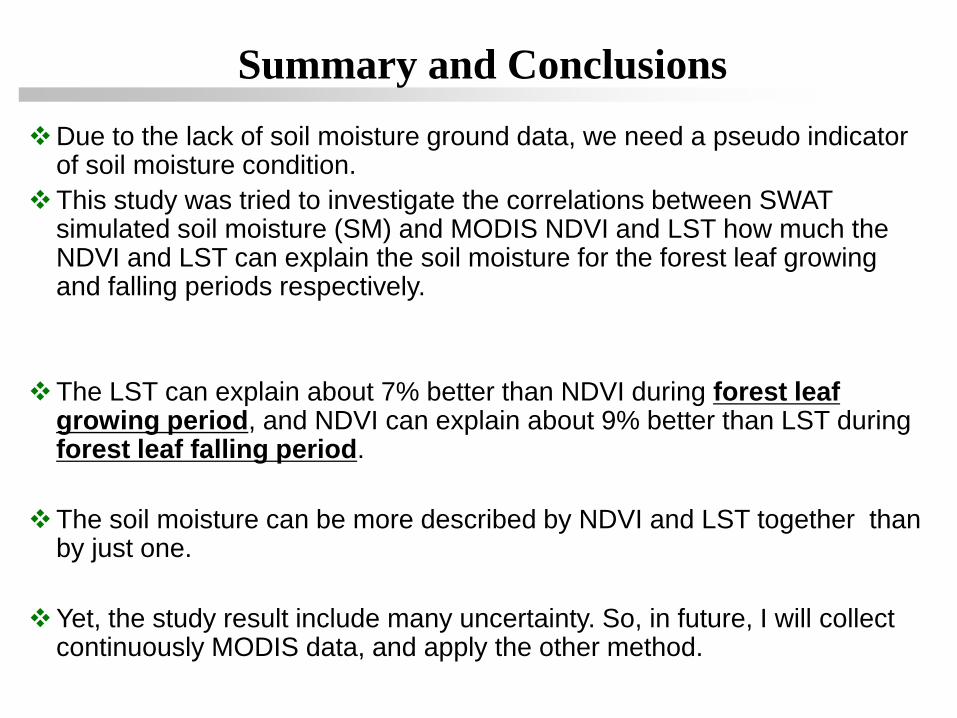
Due to the lack of soil moisture ground data, we need a pseudo indicator of soil moisture condition.
This study was tried to investigate the correlations between SWAT simulated soil moisture (SM) and MODIS NDVI and LST how much the NDVI and LST can explain the soil moisture for the forest leaf growing and falling periods respectively.
The LST can explain about 7% better than NDVI during forest leaf growing period, and NDVI can explain about 9% better than LST during forest leaf falling period.
The soil moisture can be more described by NDVI and LST together than by just one.
Yet, the study result include many uncertainty. So, in future, I will collect continuously MODIS data, and apply the other method.
Summary and Conclusions

Thank you for
your attention!