Analysis of Supercritical CO2 Brayton Cycle...
18
1 Paper # 165 The 6th International Supercritical CO2 Power Cycles Symposium March 27 - 29, 2018, Pittsburgh, Pennsylvania Analysis of Supercritical CO2 Brayton Cycle Recuperative Heat Exchanger Size and Capital Cost with Variation of Layout Design Kyle R. Zada* Thermal Design Engineer Vacuum Process Engineering, Inc. Sacramento, CA USA Ryan Kim Engineering Assistant Vacuum Process Engineering, Inc. Sacramento, CA USA Aaron Wildberger Chief Senior Project and Business Development Engineer Vacuum Process Engineering, Inc. Sacramento, CA USA Carl P. Schalansky CEO Vacuum Process Engineering, Inc. Sacramento, CA USA *Corresponding Author: [email protected], +1-916-925-6100 Kyle R. Zada is a Thermal Design Engineer in the Microchannel Heat Exchanger (MCHE) group at Vacuum Process Engineering, Inc. Kyle joined VPE, Inc. in early 2017 after completing his Master’s Degree in Mechanical Engineering, with an emphasis in thermal-fluid sciences, from Oregon State University. His graduate work focused on fundamental sCO2 heat transfer in microchannel thermal systems. He currently develops heat transfer solutions for high pressure and temperature applications, utilizing diffusion bonding fabrication techniques. ABSTRACT In the past decade, multiple studies (both experimentally and computationally at National Laboratories and other research facilities) have been performed to recognize potential improvements to increase overall efficiency for the supercritical carbon dioxide (sCO2) Brayton power cycle. These studies suggest that to achieve substantial improvements in total cycle efficiencies from traditional steam-power, high performance exchangers are required such as compact printed-circuit heat exchangers (PCHEs). To achieve significant recuperation and yield high cycle efficiency, these heat exchangers must be designed to have high effectiveness (e.g. very close approach temperatures). As the heat transfer effectiveness nears a value of one (100%), the required heat transfer area increases exponentially, which directly translates into an increase in capital cost of these heat exchangers. In this paper, the effect of recuperative heat exchanger capital cost is investigated as a function of different supercritical CO2 Brayton power cycle layouts (Simple Recuperation, Recompression, and the Cascaded Reheat Brayton power cycles). For a proper comparison of heat exchanger capital cost, each power cycle layout is designed to achieve 50 MWth turbine expansion work, with equivalent state points at the turbine and compressor inlet and a constant cycle compression ratio. The recuperative heat exchangers are discussed based upon the UA, thermal duty, and temperature approach for the different layouts. Capital investments are projected from heat exchanger UA. High efficient power cycles do not inherently yield cost-effective solutions as is demonstrated in this study. Discussion of these projected costs are also based upon fabrication capabilities and previous experience of heat exchanger manufacturers. It is important for cycle designers to understand the investments of heat exchangers depends on the cycle layout being utilized, even with the same power output.
Transcript of Analysis of Supercritical CO2 Brayton Cycle...

1 Paper # 165
The 6th International Supercritical CO2 Power Cycles Symposium March 27 - 29, 2018, Pittsburgh, Pennsylvania
Analysis of Supercritical CO2 Brayton Cycle Recuperative Heat Exchanger Size and Capital Cost
with Variation of Layout Design
Kyle R. Zada* Thermal Design Engineer
Vacuum Process Engineering, Inc. Sacramento, CA USA
Ryan Kim Engineering Assistant
Vacuum Process Engineering, Inc. Sacramento, CA USA
Aaron Wildberger
Chief Senior Project and Business Development Engineer Vacuum Process Engineering, Inc.
Sacramento, CA USA
Carl P. Schalansky CEO
Vacuum Process Engineering, Inc. Sacramento, CA USA
*Corresponding Author: [email protected], +1-916-925-6100
Kyle R. Zada is a Thermal Design Engineer in the Microchannel Heat Exchanger (MCHE) group at Vacuum Process Engineering, Inc. Kyle joined VPE, Inc. in early 2017 after completing his Master’s Degree in Mechanical Engineering, with an emphasis in thermal-fluid sciences, from Oregon State University. His graduate work focused on fundamental sCO2 heat transfer in microchannel thermal systems. He currently develops heat transfer solutions for high pressure and temperature applications, utilizing diffusion bonding fabrication techniques.
ABSTRACT In the past decade, multiple studies (both experimentally and computationally at National Laboratories and other research facilities) have been performed to recognize potential improvements to increase overall efficiency for the supercritical carbon dioxide (sCO2) Brayton power cycle.
These studies suggest that to achieve substantial improvements in total cycle efficiencies from traditional steam-power, high performance exchangers are required such as compact printed-circuit heat exchangers (PCHEs). To achieve significant recuperation and yield high cycle efficiency, these heat exchangers must be designed to have high effectiveness (e.g. very close approach temperatures). As the heat transfer effectiveness nears a value of one (100%), the required heat transfer area increases exponentially, which directly translates into an increase in capital cost of these heat exchangers. In this paper, the effect of recuperative heat exchanger capital cost is investigated as a function of different supercritical CO2 Brayton power cycle layouts (Simple Recuperation, Recompression, and the Cascaded Reheat Brayton power cycles). For a proper comparison of heat exchanger capital cost, each power cycle layout is designed to achieve 50 MWth turbine expansion work, with equivalent state points at the turbine and compressor inlet and a constant cycle compression ratio. The recuperative heat exchangers are discussed based upon the UA, thermal duty, and temperature approach for the different layouts. Capital investments are projected from heat exchanger UA. High efficient power cycles do not inherently yield cost-effective solutions as is demonstrated in this study. Discussion of these projected costs are also based upon fabrication capabilities and previous experience of heat exchanger manufacturers. It is important for cycle designers to understand the investments of heat exchangers depends on the cycle layout being utilized, even with the same power output.

2 Paper # 165
INTRODUCTION To mitigate the reliance on non-renewable energy resources and the global environmental impact of using such fuels, advancements in technology for thermal energy systems and components is a necessity. The components used in these power systems need to be clean, efficient, compact, and cost effective. Even small increases in efficiency can dramatically alter the energy landscape by reducing the size and capital cost of equipment (turbines, compressors, heat exchangers, etc.) while also increasing the energy produced per unit fuel (Chacartegui et al. 2011, Iverson et al. 2013). Since the mid-1900s, increases in thermal efficiency in power cycles has been a motivation of the power industry. Electricity at the utility scale is usually generated from power plants based upon the Rankine or Brayton power cycles where the thermal sources vary from fossil fuels, solar thermal, and nuclear fission. According to Carnot, an increase in the temperature difference between the thermal source and thermal sink yields a similar increase in the maximum potential thermal efficiency of any heat engine,
𝜂𝑐𝑦𝑐𝑙𝑒 = 1 − 𝑇𝑐𝑇ℎ
(1)
When able to sustain a low temperature source, an increase in turbine inlet temperature will yield an increase in the total cycle thermal efficiency. Steam cycles in particular will increase in pressure with the increase in heat addition temperature. At large enough temperatures, use of high pressure water (supercritical or ultra-supercritical) cycles are used. Use of supercritical water in the nuclear industry as a coolant has been found to increase thermal efficiency, decrease pumping power, and eliminate critical heat flux and dryout (Pioro et al. 2004; Corradini 2009). Unfortunately, plant reliability issues due to the high pressure and temperature, as well as cost of state-of-the-art materials for power piping, limits the implementation of heat exchangers and other components in the near term. Supercritical carbon dioxide (sCO2) Brayton power cycles have recently been discussed as a competitive technology in comparison to other power cycle configurations and fluids (Wright et al. 2010; Conboy et al. 2012; Iverson et al. 2013, Singh et al. 2013). With low sCO2 critical temperature and pressure (Tcrit = 30.98oC, Pcrit = 7.38 MPa) coupled with favorable heat transfer properties, this working fluid and cycle combination is promising, as it will be able to reduce size of turbomachinery and heat exchangers while enabling an increase in heat transfer per unit volumetric flow rate. This can lead to potentially simplified loops with a reduction in size, capital cost, and increases in cycle thermal efficiency (Turchi et al. 2013; Garg et al.2013, Dunham & Iverson 2014). Unlike traditional power cycles, such as the Rankine power block, a Brayton cycle utilizing carbon dioxide above the supercritical point (Tcrit , Pcrit) will cause the transition from liquid-like to gas-like state (or vice-versa) during the non-isothermal heat absorption (or rejection) processes involved in the power cycle loop. A steep and continuous gradient in density and other thermophysical properties exist, presenting difficult component design and cycle control scheme strategies. Variations of sCO2 Brayton power cycle layouts and analyses have been presented by many authors in the literature, starting with Angelino (1969). These alternatives are generally the same as they use the same basic components (turbine, compressor, heat exchangers, etc.); however, the configuration of the layouts affect the performance and ultimately thermal efficiency. Cycle modeling and experimental testing have shown that compact, high effectiveness heat exchangers, with low temperature approaches are required to achieve these gains in efficiencies (Wright et al., 2010; Conboy et al., 2012;

3 Paper # 165
Iverson et al., 2013; Ahn et al., 2015). At the recent 2017 SCO2 Power Cycle Summit in Albuquerque, NM, a recurring statement was made by fellow power cycle component manufacturers and developers: with the current state-of-the-art of these systems, the capital cost of highly effective heat exchangers utilized in the power cycles, particularly the printed-circuit heat exchangers (PCHEs) used in recuperation, is a significant cost to the total cycle. Printed-circuit heat exchangers (PCHEs) are monolithic, high integrity structures fabricated using diffusion bonding technology. Diffusion bonding is a solid-state welding process between two or more layers of material without the addition of interlayers or brazing materials. Each layer of material is chemically etched to create individual flow paths for the given fluid circuit. Stacking these layers and applying a dynamic load at elevated temperatures promotes grain growth across the intimate material surface contact. The interface strength between the material layers is similar to that of the parent material. Clever circuit layouts and configuration designs produce high effectiveness and compact envelopes for these heat exchangers. In the present study, the effect of recuperative heat exchanger size and capital cost is demonstrated as a function of the Simple Recuperative, Recompression, and Cascaded reheat Brayton power cycles. The estimated size and capital investments associated with the recuperative heat exchangers is discussed. Since these heat exchangers are a substantial portion of the total investment for an overall power plant, it is important to understand the balance between capital cost and cycle efficiency. The effects of these sizes will be shown with variable temperature approaches and desired cycle thermal efficiencies with a constant 50 MWth output from the turbine(s) between these cycle layouts. POWER CYCLE LAYOUTS In reality, power cycles are not like Carnot’s heat engine. They are not ideal systems and therefore are not reversible, nor is the heat transfer to or from the system isothermal. Consequently, the actual
thermal efficiency of a power cycle is based upon the net power produced between the turbine (��𝑇𝑈𝑅𝐵)
and compressor (��𝐶𝑂𝑀𝑃) versus the thermal input to the cycle (��𝐼𝐻𝑋). There are many alternative cycle layouts that include different combinations of intercooling, reheating, recompression, recuperation, and fluid bypass (Dostal et al. 2004; Mecheri & Moulec 2016). These alternatives increase both cost and complexity, but also increase the thermal efficiency and ultimately electrical power output, thereby decreasing the cost/kWe at the utility scale.
A closed-loop Brayton power cycle operates by means of the working fluid not experiencing isothermal heat addition or expansion since the working pressures are either in the gaseous or supercritical region. A portion of the energy produced by the turbine is required to drive the compressor in the cycle. The basic Brayton cycle loop consists of a turbine, compressor, pre-cooler, and intermediate heat exchanger (IHX) to transfer energy from the thermal source. This loop differs from that of the Simple Recuperative Brayton cycle loop because the fluid from the compressor is pre-heated from the hot fluid exiting from the turbine in a recuperator: this ultimately increases the cycle efficiency by reducing the thermal input required by the intermediate heat exchanger (IHX). This cycle can be used with latent-heat heat sources or heat flux heat sources. The layout and T-s diagram for this power cycle using a representative dataset can be found in Figure 1. The Recompression Brayton power cycle consists of a main compressor, recompression compressor, turbine, intermediate heat exchanger (IHX), low-temperature recuperator (LTR), high-temperature recuperator (HTR), and a pre-cooler (PC) heat exchanger. The fluid is split between the main and recompressing compressor, where it is further cooled by the pre-cooling heat exchanger before

4 Paper # 165
entering the main compressor. This layout splits the working fluid between the high-and low-temperature recuperators, maximizing the heat recovery through the compensation of vastly different specific heat capacities of the fluid. The recompressing sCO2 cycle layout has been generally agreed to be the most efficient, as noted by Ahn et al. (2015), Dostal et al. (2004), and Kulhanek & Dostal (2007). With a high efficiency design, it is a good candidate for using nuclear and solar thermal heat flux based heat sources. This cycle layout and T-s diagram using a representative dataset are in Figure 2.
The Cascaded Reheat Brayton power cycle consists of a main compressor, high-temperature turbine, low-temperature turbine, intermediate heat exchanger (IHX), high-temperature recuperator, low-temperature recuperator, and a pre-cooler heat exchanger. Instead of compressing the working fluid twice, as is the case in the Recompression loop, the working fluid expands twice in order to complete the expansion in stages as opposed through a single component. This loop attempts to use all the heat that is in the heat source, with sources stemming from fossil fuel or waste heat recovery applications. This cycle layout and T-s diagram for a representative dataset are in Figure 3. The exact layout design for maximum efficiency is directly dependent upon the type of application and associated thermal source temperatures (fossil, nuclear, solar, waste-heat etc). However, the three different layouts above in this study assume, regardless of the thermal sources and sinks, they can achieve the same main turbine and main compressor inlet temperature.
Figure 2: Recompression Brayton cycle layout with T-s diagram with representative data. (ηcycle = 45%, ��𝑇𝑈𝑅𝐵 = 50 MWth, �� = 278.1 kg-s-1, TTURB,i = 650 oC, TCOMP,i = 35 oC, X = 0.50, RCOMP = 3.0)
Figure 1: Simple Recuperative Brayton cycle layout with T-s diagram with representative data.
(ηcycle = 45%, ��𝑇𝑈𝑅𝐵 = 50 MWth, �� = 278.1 kg-s-1, TTURB,i = 650 oC, TCOMP,i = 35 oC, RCOMP = 3.0)

5 Paper # 165
MODELING APPROACH AND METHODOLOGY The present study utilizes basic thermodynamic analyses to demonstrate the effects of capital costs (based on UA requirements, temperature approach, and effectiveness) of high-and low-temperature recuperative heat exchangers as a function of three different supercritical CO2 Brayton power cycle layouts. The basics of the Simple Recuperative, Recompression, and Cascaded Reheat power cycles layouts were discussed in the previous section. This modeling approach analyzes each cycle component on a single control volume basis and assumes a steady-state operation, with negligible frictional pressure drop or changes in kinetic and potential energy through each component. Heat transfer into the environment is considered negligible, except in the case of the pre-cooler and intermediate heat exchanger, which are not fully analyzed. The intermediate heat exchanger is an important component in understanding the cost of heat exchangers in these cycle layouts, a full analysis i not conducted as it is out of the scope of this paper. Though unrealistic, the isentropic efficiency for each component (turbine and compressor) is assumed to be at 100%, therefore demonstrating an idealized performance. For a proper comparison of each of the three different cycles, certain aspects of the systems need to be constrained. The system parameters used in this study are in Table 1. Representative results are presented in this section for a Recompression cycle, with a split flow value of 50%, inlet turbine temperature of 650 oC, inlet compressor temperature of 35 oC, compression ratio of 3.0, and a cycle thermal efficiency of 45%. The compression ratio is defined as the compressor inlet pressure versus the compressor outlet pressure,
𝑅𝐶𝑂𝑀𝑃 =𝑃𝐶𝑂𝑀𝑃,𝑖𝑃𝐶𝑂𝑀𝑃,𝑜
(2)
With an outlet pressure of the compressor(s) (or turbine inlet pressure) of 25 MPa and a RCOMP of 3.0, the turbine exit pressure (or compressor inlet pressure) is 8.33 MPa, fixing the pressure at each of the state points through the cycle. The cycle thermal efficiency (45%) is defined by the net
Figure 3: Cascaded Reheat Brayton cycle layout with T-s diagram with representative data. (ηcycle = 45%, ��𝑇𝑈𝑅𝐵 = 50 MWth, �� = 278.1 kg-s-1, TTURB,i = 650 oC, TCOMP,i = 35 oC, X = 0.50, RCOMP = 3.0)

6 Paper # 165
thermal power produced (50 MWth, -3.4 MWth, and -13.4 MWth, for the turbine, main compressor and recompression compressor, respectively) versus the thermal input to the system from the intermediate heat exchanger (IHX) (73.7 MWth),
𝜂𝑐𝑦𝑐𝑙𝑒 = 100 × (��𝑇𝑈𝑅𝐵 + ��𝐶𝑂𝑀𝑃,𝑀 + ��𝐶𝑂𝑀𝑃,𝑅𝐶
��𝐼𝐻𝑋) (3)
With the knowledge of the IHX thermal duty and the expansion work through the turbine, a relationship between the main and recompression compressor and the thermal duty requirement from the IHX is made. Starting at state point 1 (inlet of the main compressor), the first law of thermodynamics, with proper assumptions outlined above, is applied to calculate the work output produced from the turbine based upon the specific enthalpy difference between the inlet and exit of the turbine,
��𝑇𝑈𝑅𝐵,𝑀 = 𝑚 × (ℎ[5] − ℎ[6]) (4)
Similarly, the work required by the main and recompression compressor is calculated, accounting for the split flow percentage,
��𝐶𝑂𝑀𝑃,𝑀 = 𝑚 × (1 − 𝑋) × (ℎ[1] − ℎ[2]) (5)
��𝐶𝑂𝑀𝑃,𝑅𝐶 = 𝑚 × (𝑋) × (ℎ[8] − ℎ[3]) (6)
The IHX thermal duty requirement is calculated again using the simplified form of the first law of thermodynamics,
��𝐼𝐻𝑋 = 𝑚 × (ℎ[5] − ℎ[4]) (7) The pre-cooler heat exchanger is not analyzed in this study since it is beyond the scope of the present study: this heat exchanger is ultimately used to cool the sCO2 from the exit of the low-temperature recuperator (on the hot circuit) to the inlet of the main compressor. The main compressor inlet temperature is defined as 35 oC (~4 oC above the critical temperature of carbon dioxide).
Table 1: Summary of the Simple, Recompression, and Cascaded Reheat sCO2 cycle conditions.
Variable Simple Recompression Cascaded Reheat
Power Output (MWth) 50 MWth 50 MWth 50 MWth
Turbine Power Percentage (%) 100% 100% Split & Varied Thermal Efficiency (%) 40 – 47% 34 – 56% 33 – 45% sCO2 Flow Rate (kg-s-1) 278 kg-s-1 278 kg-s-1 219 – 490 kg-s-1
Turbine Inlet Temperature (oC) 650 oC 650 oC 650 oC
Compressor Inlet Temperature (oC) 35 oC 35 oC 35 oC ∆T Between HTR/LTR or after REC 10 – 50 K 1 – 72 K 10 – 50 K Compressor Outlet Pressure (MPa) 25 MPa 25 MPa 25 MPa Compressor Ratio (-) 3.0 3.0 3.0

7 Paper # 165
The high- and low-temperature printed-circuit recuperative heat exchangers are analyzed using a terminal-to-terminal heat exchanger analysis approach as shown in Figure 4. Therefore, the heat exchanger units are not discretized into ‘sub’ heat exchanger models to determine the actual heat release curves. This type of heat exchanger analysis approach would provide a more accurate understanding of thermal performance internal to the heat exchanger. The specific heat capacity changes as a function of the heat exchanger temperature distribution would be captured. This type of analysis is outside the scope of the current study.
The pinch points and close-approach temperatures are assumed to be associated with the temperature differences between the terminal hot/cold circuits. Though pinch points may be present within the heat exchanger, it is instead assumed the heat release curve is linear along the heat exchanger length. Since the heat loss to the environment is assumed negligible, the thermal duty between the hot and cold circuits of these heat exchangers are equivalent. Therefore, the thermal duty found from applying the first law of thermodynamics on both the hot and cold circuits can be set equal to one another for
the high-temperature recuprator (��𝐻𝑇𝑅 = 52.9 MWth),
��𝐻𝑇𝑅,ℎ = 𝑚 × (ℎ[6] − ℎ[7]) (8)
��𝐻𝑇𝑅,𝑐 = 𝑚 × (ℎ[4] − ℎ[3]) (9)
��𝐻𝑇𝑅,𝑐 = ��𝐻𝑇𝑅,ℎ = ��𝐻𝑇𝑅 (10)
The above approach can also be applied for the low-temperature recuperator (��𝐿𝑇𝑅 = 50.5 MWth),
��𝐿𝑇𝑅,ℎ = 𝑚 × (ℎ[7] − ℎ[8]) (11)
��𝐿𝑇𝑅,𝑐 = 𝑚 × (1 − 𝑋) × (ℎ[3] − ℎ[2]) (12)
��𝐿𝑇𝑅,𝑐 = ��𝐿𝑇𝑅,ℎ = ��𝐿𝑇𝑅 (13)
The overall heat transfer coefficient (UA) is an important parameter to define the size and capital cost of the heat exchangers as it is a function of both the approach temperatures and the thermal duty requirement. This is calculated using an energy balance for both the high- and low-temperature recuperators with the counter flow configuration of the log-mean-temperature difference (LMTD),
��𝑅𝐸𝐶 = 𝑈𝐴𝑅𝐸𝐶 × 𝐿𝑀𝑇𝐷 = 𝑈𝐴𝑅𝐸𝐶 ×
(
(𝑇ℎ,𝑜 − 𝑇𝑐,𝑖) − (𝑇ℎ,𝑖 − 𝑇𝑐,𝑜)
ln ((𝑇ℎ,𝑜 − 𝑇𝑐,𝑖)
(𝑇ℎ,𝑖 − 𝑇𝑐,𝑜))
)
(14)
Figure 4: Recuperator heat exchanger analysis using terminal-to-terminal approach.
8 Paper # 165
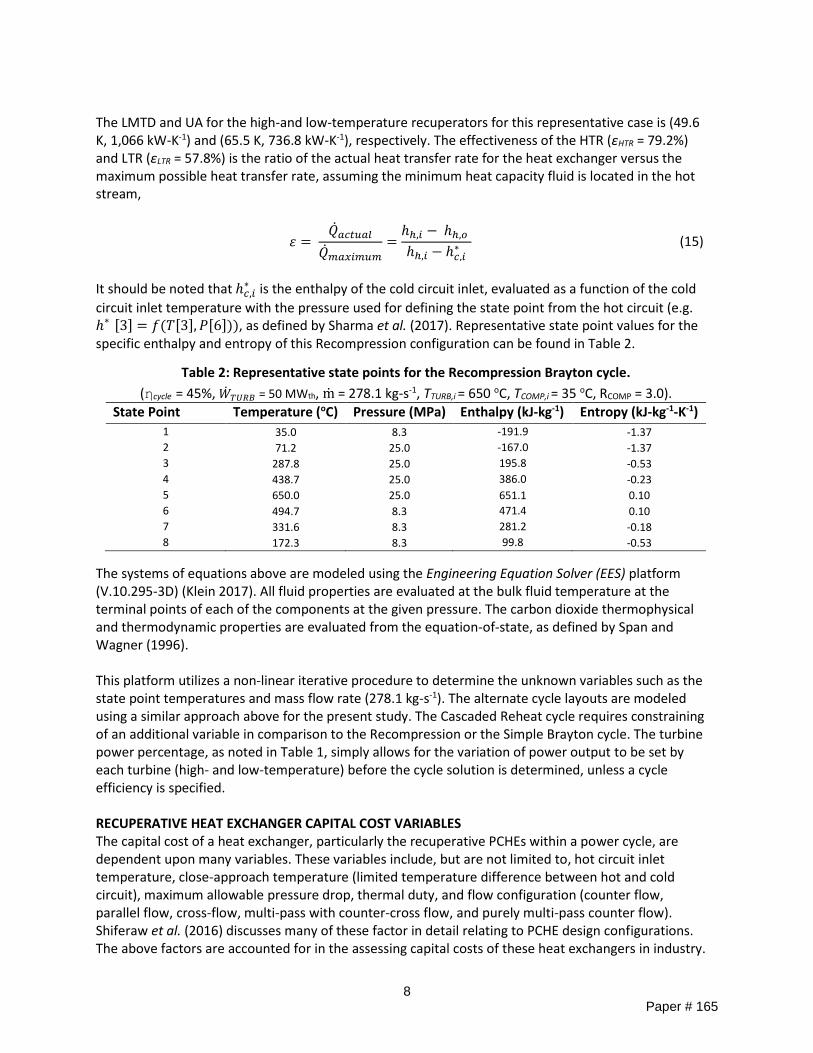
The LMTD and UA for the high-and low-temperature recuperators for this representative case is (49.6 K, 1,066 kW-K-1) and (65.5 K, 736.8 kW-K-1), respectively. The effectiveness of the HTR (εHTR = 79.2%) and LTR (εLTR = 57.8%) is the ratio of the actual heat transfer rate for the heat exchanger versus the maximum possible heat transfer rate, assuming the minimum heat capacity fluid is located in the hot stream,
𝜀 = ��𝑎𝑐𝑡𝑢𝑎𝑙
��𝑚𝑎𝑥𝑖𝑚𝑢𝑚=ℎℎ,𝑖 − ℎℎ,𝑜
ℎℎ,𝑖 − ℎ𝑐,𝑖∗ (15)
It should be noted that ℎ𝑐,𝑖
∗ is the enthalpy of the cold circuit inlet, evaluated as a function of the cold
circuit inlet temperature with the pressure used for defining the state point from the hot circuit (e.g. ℎ∗ [3] = 𝑓(𝑇[3], 𝑃[6])), as defined by Sharma et al. (2017). Representative state point values for the specific enthalpy and entropy of this Recompression configuration can be found in Table 2.
The systems of equations above are modeled using the Engineering Equation Solver (EES) platform (V.10.295-3D) (Klein 2017). All fluid properties are evaluated at the bulk fluid temperature at the terminal points of each of the components at the given pressure. The carbon dioxide thermophysical and thermodynamic properties are evaluated from the equation-of-state, as defined by Span and Wagner (1996). This platform utilizes a non-linear iterative procedure to determine the unknown variables such as the state point temperatures and mass flow rate (278.1 kg-s-1). The alternate cycle layouts are modeled using a similar approach above for the present study. The Cascaded Reheat cycle requires constraining of an additional variable in comparison to the Recompression or the Simple Brayton cycle. The turbine power percentage, as noted in Table 1, simply allows for the variation of power output to be set by each turbine (high- and low-temperature) before the cycle solution is determined, unless a cycle efficiency is specified. RECUPERATIVE HEAT EXCHANGER CAPITAL COST VARIABLES The capital cost of a heat exchanger, particularly the recuperative PCHEs within a power cycle, are dependent upon many variables. These variables include, but are not limited to, hot circuit inlet temperature, close-approach temperature (limited temperature difference between hot and cold circuit), maximum allowable pressure drop, thermal duty, and flow configuration (counter flow, parallel flow, cross-flow, multi-pass with counter-cross flow, and purely multi-pass counter flow). Shiferaw et al. (2016) discusses many of these factor in detail relating to PCHE design configurations. The above factors are accounted for in the assessing capital costs of these heat exchangers in industry.
Table 2: Representative state points for the Recompression Brayton cycle.
(ηcycle = 45%, ��𝑇𝑈𝑅𝐵 = 50 MWth, m = 278.1 kg-s-1, TTURB,i = 650 oC, TCOMP,i = 35 oC, RCOMP = 3.0).
State Point Temperature (oC) Pressure (MPa) Enthalpy (kJ-kg-1) Entropy (kJ-kg-1-K-1)
1 35.0 8.3 -191.9 -1.37
2 71.2 25.0 -167.0 -1.37
3 287.8 25.0 195.8 -0.53
4 438.7 25.0 386.0 -0.23
5 650.0 25.0 651.1 0.10
6 494.7 8.3 471.4 0.10
7 331.6 8.3 281.2 -0.18
8 172.3 8.3 99.8 -0.53

9 Paper # 165
Inlet temperature is particularly important as it tends to govern the base material used in fabrication of the heat exchanger and is directly related to the limits on the turbine exit temperature. Inlet temperatures yielding a mean metal temperature exceeding 649 oC requires the material to be a high-temperature nickel-based alloy such as 617, 625, or 800-H as opposed to 316L stainless steel materials to meet ASME BPVC, Div. I, Sect. VIII, per code case 2577. To achieve high cycle efficiency, a significant amount of recuperation is required, which increases the effectiveness of the recuperative heat exchangers. The caveat with high effectiveness is that the approach temperatures must be close: approaching a value of 1 will yield an exponential increase in the UA requirement and likewise increase the cost of the heat exchanger. Thermal duty is another important consideration as it drives the UA requirement; however, it is not a satisfactory stand-alone pricing metric for heat exchanger costs. For instance, decreasing in thermal duty does not inherently mean a decrease in UA requirement. The effectiveness and LMTD can adjust to the process condition requirement, yielding a larger UA for the heat exchanger. Pressure drop is a function of many factors including the flow velocity, channel flow area, channel flow length, minor losses (e.g. expansions, contractions, zig-zags), core material roughness, and fluid thermophysical properties. A strict low pressure drop requires an increase in the flow area to decrease the flow velocity and likewise pressure drop. This directly relates to the UA requirement as this will yield smaller heat transfer coefficients (lower turbulence due to smaller flow velocity), but will require larger heat transfer surface area to achieve the desired temperature difference and thermal duty. Clever flow configurations can be utilized to minimize the heat exchanger envelope (L x W x H) which relates to the amount of material required. It should be noted that this is directly affected by the heat transfer coefficient, pressure drop requirements, and likewise amount of material used in the heat exchanger fabrication.
Many power cycle designers want a pricing metric so that cost comparison between efficiency gains on capital cost of cycle components can be easily determined. Unfortunately, these are not simple calculations, as it is difficult to price heat exchangers strictly on the basis of $/kW or $/UA or $/lb. Each of the above variables provide insight on the heat exchanger capital cost. Although not a perfect metric, the UA value, in combination with heat exchanger effectiveness and approach temperature, are satisfactory starting points for estimating heat exchanger capital cost.
Figure 5: Power cycle application heat exchanger cost ratio versus UA for (a.) 51 selected designs
(b.) 39 selected designs with a UA of less than 3.5 MW-K-1 from red circle in (a.). *NOTE: these cost metrics are a function of a limited range of process conditions and should not be universally applied to all heat exchangers
design.

10 Paper # 165
In Figure 5, a select quantity of heat exchanger designs are compared with thermal duties exceeding least 1 MWth, fabricated purely using printed-circuit heat exchanger technology with stainless steel base material (e.g. no fin-formed material or hybrid designs), and are to be used in the power cycle industry or research for power cycles. On average, the cost per UA is found to be on the order of $1.19/UA to $2.21/UA (UA in units of W/K) based on an average of $1.70/UA from the data above with an estimated uncertainty upwards of approximately ±30. The cost increases approximately linearly with respect to the heat exchanger UA. Based upon previous designs, the LTR is estimated to have a reduction of approximately 20% in cost per UA since the material used in the construction will have larger stress allowables due to a reduction in design temperature in comparison to the HTR. This will allow for incorporating smaller manifolds/headering while using smaller side-margins and thicknesses, reducing the overall capital cost/UA. Therefore, the cost per UA assumes a range of $1.49 to 2.21/UA for the HTR and $1.19 to 1.77/UA for the LTR. RESULTS AND DISCUSSION The analytical modeling for this study explored the effects of cycle efficiency and recuperator performance (UA, temperature approach, effectiveness) with a constant turbine power output, inlet conditions for the main turbine and compressors, and compression ratio. The three Brayton cycles (Simple, Recompression, and Cascaded Reheat) were first analyzed together with respect to the approach temperature, as shown in Figure 6. This approach temperature is the temperature difference between the hot and cold circuits between the high- and low temperature recuperators. The approach temperature for the Simple cycle is defined as the temperature difference between the hot circuit exit and cold circuit inlet. The Recompression and Cascaded Reheat cycles were set with a split flow ratio of 50% and the turbine power output for the Cascaded Reheat cycle was defined at 50% for the high- and low-temperature turbines to constrain the cycle parameters, thereby allowing the cycle efficiency to be a floating variable. Based upon the defined cycle parameters, each of the cycles yielded the same mass flow rate.
The Cascaded Reheat cycle was constrained with a constant thermal cycle efficiency at approximately 38% regardless of the change in approach temperature. However, with the Simple and Recompression cycle layouts, when the approach temperature decreases from 50 K to 10 K, the cycle efficiency increased, and the total UA for recuperation increased by 150% and 280%, respectively. The effectiveness, though not plotted, also increased with a decrease in approach temperature.
Figure 6: Power cycle efficiency (a.) and total recuperator UA (b.) versus the intermediate
temperature approach after the HTR for the Recompresssion and Cascaded Reheat or exit of the recuperator for the Simple cycle.
(��𝑇𝑈𝑅𝐵 = 50 MWth, �� = 278.1 kg-s-1, TTURB,i = 650 oC, TCOMP,i = 35 oC, X = 0.50, RCOMP = 3.0)

11 Paper # 165
Interestingly, since the Cascaded Reheat cycle was significantly constrained (e.g. turbine output split of 50%), it yielded the same duty for the IHX and work input from the compressor; likewise, the cycle efficiency was not impacted, though the UA requirement increased. The temperature approaches at each of the terminal points of the recuperators in fact decreased; this minimizes the thermal stress due to variation in temperatures, though it would require an increase in UA and capital cost with a constant cycle efficiency. Overall, the Cascaded Reheat cycle in this configuration would require the lowest cost HTR and LTR with a temperature approach above 10 K, but it achieved the lowest efficiency, regardless of the intermediate temperature approach between the HTR and LTR. The main difference between the Recompression and Cascaded Reheat cycles versus the Simple Recuperative Brayton cycle, besides the number of turbomachinery components and recuperators, is the ability to split the flow into different portions of the cycle. As previous noted, this allows for the split of vastly different specific heats of the fluid streams while reducing the work in and out between the compressors and turbines, respectively. Since the Simple Brayton cycle does not allow for splitting of the flow, this portion of analysis was only conducted for the Recompression and Cascaded Reheat Brayton cycles. The effect of the split flow magnitude versus the performance of the recuperative heat exchangers is illustrated in Figure 7, with calculated cycle parameter ranges in Table 3.
The approach temperature between the high- and low-temperature recuperators were defined at 10 K, power output from the Cascaded Reheat turbines was again split 50% between each turbine, with the main turbine and compressor inlet conditions and compressor ratio set per Table 1. The figure representing temperature approach is associated with the remaining hot/cold terminals not specified on the recuperators. With an increase in the split flow magnitude, less flow is passing through the main compressor and the high-temperature turbine for the Recompression and Cascaded Reheat cycles, respectively. This requires the recompression compressor and low-temperature turbine to account for the remainder of the power. The trend for variation of recuperator UA, temperature approach, and effectiveness is similar for the HTR/LTR of the Cascaded Reheat and the LTR of the Recompression. The HTR for the Recompression cycle requirement for UA did not appear to change in requirement significantly between 0.3 and 0.6 for split flow magnitude. After a value of 0.6, the UA requirement dropped significantly, which follows the same trend of the cycle thermal efficiency (not shown). This may be a factor of mass flow rate since the flow rate in the Recompression cycle is fixed given the cycle parameters regardless of the change in split flow, while the flow rate varies as a function of split flow for the Cascaded Reheat cycle. With a higher split flow magnitude, the required flow rate increased for the Cascaded Reheat cycle, which in turn required a larger thermal duty for the recuperation. However, although the HTR duty increased, the UA requirement decreased: this yielded a very high (nearly 100%) effectiveness with a relatively large LMTD. With a decrease in split flow, the opposite occurs, with a decrease in thermal duty, total mass flow, and a smaller LMTD. This yielded an increase in UA with a drop in effectiveness by ~9% points. The difficulty in using a single factor of the heat exchanger to yield an accurate understanding of capital cost over a range of system parameters is demonstrated here.
Table 3: Cycle parameter quantities for Recompression and Cascaded Reheat Brayton cycle. (��𝑇𝑈𝑅𝐵 = 50 MWth, TTURB,i = 650 oC, TCOMP,i = 35 oC, RCOMP = 3.0)
Cycle ηcycle (%) IHX Duty (MWth) Compressor Work (MWth)
Recompression 34% to 56% 58 MW to 72 MW -98 MW to -305 MW Cascaded Reheat 33% to 38% 114 MW -6.4 MW to -12 MW

12 Paper # 165
Figure 7: Recuperator (a.) UA, (b.) temperature approach, and (c.) effectiveness versus the split
flow magnitude for the Recompression and Cascaded Reheat Brayton Cycle. (��𝑇𝑈𝑅𝐵 = 50 MWth, TTURB,i = 650 oC, TCOMP,i = 35 oC, RCOMP = 3.0, ∆T HTR/LTR = 10 K)

13 Paper # 165
Fixing the thermal efficiency, turbine power, intermediate HTR/LTR temperature approach, and main turbine and compressor inlet conditions allows for a comparison of the HTR and LTR performance while keeping the main requirements the same between the cycles. By allowing the percentage of turbine work to float, the variation of HTR and LTR performance of the Cascaded Reheat cycle is shown as a function of the split flow magnitude in Figure 8.
The split flow magnitude varied between 0.448 and 0.515, but shows a significant change in recuperator performance, particularly with the HTR. Unlike when the efficiency of the cycle was not constrained, when it is fixed the UA requirements increased with opposing trends. Also, with the decrease in split flow, flow rate requirement decreases but shows a slight increase in the high-temperature turbine versus low-temperature turbine work (42.9% to 43.5% of 50 MWth). As indicated by the figure above, simply because the thermal duty is decreasing does not necessarily mean the cost of the unit will be too. As illustrated, the HTR duty decreases but increases in UA requirement significantly to achieve the cycle efficiency of 45%. The comparison between the Recompression and Cascaded Reheat cycle can be found in Table 4. The split flow value for the Recompression cycle was determined through the calculation of the state points given the cycle parameter for the turbine, compressor, cycle efficiency, and approach temperature between the HTR and LTR. The split flow value for the Cascaded Reheat cycle was chosen with a value associated with the minimum UA for the HTR and LTR, as shown in Figure 8. Holding the main cycle parameters constant between the cycles shows that the HTR UA is able to be reduced by 66% with a nearly equivalent LTR UA (8% reduction) from Recompression to Cascaded. The total UA required for the recuperators in the Cascaded Reheat cycle decreases by approximately 55% with the same turbine output and cycle efficiency in comparison to the Recompression cycle. Also, with a lower mass flow rate for the Cascaded Reheat cycle, the pressure drops through the system will be lower if both cycles consider similar recuperator flow geometries and power piping. Even though the overall UA requirement for the total HTR and LTR in the Cascaded Reheat cycle decreases at the same cycle parameters, the significant increase in IHX thermal duty (+60%) cannot be ignored. A full cycle analysis would need to be completed as a function of the compressors, turbines, pre-cooler, and IHX units to truly understand the capital cost benefits between the cycles which is out of the scope for the current study.
Figure 8: Power performance versus the split flow magnitude for Cascaded Reheat cycle.
(��𝑇𝑈𝑅𝐵 = 50 MWth, 𝜂𝑐𝑦𝑐𝑙𝑒 = 45%, TTURB,i = 650 oC, TCOMP,i = 35 oC, RCOMP = 3.0, ∆T HTR/LTR = 10 K)

14 Paper # 165
From the perspective of the recuperators, the capital cost for the Cascaded Reheat cycle HTR should be less expensive as it has larger approach temperatures (other than the 10 K constraint between HTR and LTR), smaller duty by 2.2%, and smaller UA by 66%. The LTR has a tighter, but not exceedingly small approach temperature (44 K vs. 152 K), with a reduction in thermal duty and UA by 59.7% and 2.2%, respectively. Based on the cost metric range provided earlier for the HTR and LTR, the total capital cost of the HTR and LTR for the Cascaded Reheat cycle would be 56% smaller in comparison to the Recompression Brayton cycle. The cost ratio (normalized by the Recompression heat exchanger cost) shows the HTR of the Recompression cycle is almost 3X that of the cascaded reheat while the LTR is nearly the same (~8% difference). This of course is ignoring many factors that do influence the cost of the exchanger such as pressure drop requirements, flow distribution and manifolding/headering complexity, and shim circuit design layouts which are all important considerations when costing such a heat exchanger. Recuperator costs for Cascaded Reheat cycle are less expensive than the Recompression cycle on the basis of $/UA, however, the current study does not look into the other heat exchanger components of the cycle such as IHX and PC. At the set-points noted in Table 4, the IHX temperature difference across the Cascaded Reheat Cycle is 578.2 °C while the Recompression IHX is 174.3 °C, which is much more
manageable with respect to thermal stress and likewise complexity and cost. Without completing a full circuit shim design for each heat exchanger, it would be difficult to gauge which system would ultimately be more costly. This would require defining the pressure drop for each component and completing the heat exchanger design using algorithms used internally by heat exchanger manufacturers to properly cost each unit. During the design process, the specifics of the circuit layout will be determined, likewise revealing the enhancements used (zig zags) or ways to achieve small envelopes (counter+cross-flow to purely multi-pass counter flow). These would affect the heat transfer coefficient and likewise total heat exchanger size. Therefore, calculating the capital costs of recuperative heat exchangers is difficult if it is solely
Table 4: Cycle parameter comparison between Recompression and Cascaded Reheat Brayton cycle with constrained overall cycle thermal efficiency.
(50 MWth Power Output, TTURB,i = 650 oC, TCOMP,i = 35 oC, RCOMP = 3.0, 𝜂𝑐𝑦𝑐𝑙𝑒 = 45%, ∆T HTR/LTR = 10 K).
Parameter Recompression Cascaded Reheat Recomp. vs. Cascade
IHX Duty (MW) 60.9 MW 97.5 MW +60% Comp. Work (MW); MC, RC -2.4 MW, -20.2 MW -6.1 MW -73% Turb. Work (MW); HT, LT 50 MW 21.4 MW, 28.6 MW 0% X (-) 0.6558 0.5148 -21.5% Mass Flow (kg-s-1) 278.1 kg-s-1 245.7 kg-s-1 -11.7%
HTR Duty (MW) 45.4 MW 44.4 MW -2.2% HTR UA (kW-K-1) 3,235 kW-K-1 1,099 kW-K-1 -66% HTR Effectiveness (%) 93.4% 90.2% -3.4% HTR LMTD (K) 14.0 K 40.4 K +186% HTR Cost Ratio (-) 1.00 0.34 -66%
LTR Duty (MW) 41.7 MW 16.8 MW -59.7% LTR UA (kW-K-1) 799 kW-K-1 734 kW-K-1 -8.1% LTR Effectiveness (%) 44% 68% +54.5% LTR LMTD (K) 52.2 K 23.0 K -56% LTR Cost Ratio (-) 1.00 0.92 -8.1%

15 Paper # 165
based upon a single pricing metric.
CONCLUSIONS In the present study, the effect of heat exchanger capital cost is investigated as a function of the Simple Recuperative, Recompression, and Cascaded Reheat Brayton power cycles. Each cycle layout was designed to achieve a 50 MWth turbine expansion work, with equivalent state points at the turbine and compressor inlet and constant cycle compression ratio. An analytical model using Engineering Equation Solver was developed to simulate the three different cycle layouts. This model explored the effects of the cycle efficiency and recuperator performance, noting the UA, temperature approach, effectiveness, and thermal duty. Varying the approach temperature for the three cycles illustrated the limitation of the Cascaded reheat cycle efficiency without properly looking into the effects of split flow magnitude and turbine percent work since the thermal efficiency was constant as a function of changes in heat exchanger temperature approach. The Simple and Recompression revealed cycle thermal efficiency increased, but required an increase in recuperation (likewise an increase in UA) with a decrease in recuperator temperature approach. Varying the split flow magnitude showed the differences in heat exchanger performance depending on the cycle type. As the split flow decreased the magnitude of power consumption of the main compressor and recompressing compressor became approximately equivalent for the Recompression cycle. This yielded an interesting variation of UA requirements (exponential increase in HTR with flattening of the LTR), while the HTR and LTR for the Cascading Reheat cycle required UA increased exponentially. Finally, the Recompression and Cascaded Reheat cycle were analyzed assuming the same required thermal efficiency. The Cascaded Reheat cycle HTR would yield a more cost-effective solution for the given cycle requirements due to the moderate temperature approach, smaller thermal duty, and smaller UA with a larger LMTD. The LTR cost-effectiveness between the cycles is more complex, as certain aspects of the heat exchanger increase (effectiveness) while others decrease (duty and LMTD) between the Recompression and Cascaded Reheat. This requires a more rigorous analysis involving a complete PCHE design due to the similarities in UA requirements. Overall, the difficulty in using a single factor of a heat exchanger performance (UA, duty, temperature approach, LMTD) to use as a cost estimate/metric was demonstrated. From this analysis, however, the recuperator costs are reduced by approximately 56% by using a Cascaded cycle. As noted previously, the balance of plant would need to be accounted for to determine overall costs. Heat exchanger companies with the knowledge and expertise in thermal-hydraulic design and diffusion bonding fabrication techniques can develop cost-effective, compact, and highly efficient heat exchangers for sCO2 power cycle industry. To improve upon this analysis and insights made from this study, a full economic demonstration of each type of heat exchanger can be compared. This would require a complete PCHE design for each configuration. Also, each heat exchanger would be analyzed using a discretized methodology as opposed to a terminal-to-terminal analysis. This would increase the accuracy of the UA values by accounting for changes in specific heat capacity due to the temperature distribution within the heat exchanger, which can affect the UA requirements.

16 Paper # 165
REFERENCES Ahn, Y. et al., 2015. Review of Supercritical CO2 Power Cycle Technology and Current Status of Research and Development. Nucl. Eng. Technol., 47(6), pp.647–661. Angelino, G., 1969. Real Gas Effects in Carbon Dioxide Cycles. ASME Paper No. 68-GT-23, pp. 1-12. Chacartegui, R. et al., 2011. Alternative Cycles Based on Carbon Dioxide for Central Receiver Solar Power Plants. Appl. Therm. Eng., 31(5), pp.872–879. Conboy, T. et al., 2012. Performance Characteristics of an Operating Supercritical CO2 Brayton Cycle. J. Eng. Gas Turb. Power, 134(11), pp.1–12. Corradini, M.L., 2009. Transport Phenomena in Supercritical Fluids in Gen-IV Reactor Designs. Nucl. Technol., 167(1), pp. 145–156. Dostal, V., Driscoll, M.J., Hejzlar, P., 2004. A Supercritical Carbon Dioxide Cycle for Next Generation Nuclear Reactors. Advanced Nuclear Power Technology Program, MIT-ANP-TR-100, pp. 1-307. Dunham, M.T. & Iverson, B.D., 2014. High-Efficiency Thermodynamic Power Cycles for Concentrated Solar Powers. Renew. Sust. Energ. Rev., 30, pp.758–770. Garg, P., Kumar, P. & Srinivasan, K., 2013. Supercritical Carbon Dioxide Brayton Cycle for Concentrated Solar Power. J. Supercrit. Fluids, 76, pp.54–60. Iverson, B.D. et al., 2013. Supercritical CO2 Brayton Cycles for Solar-Thermal Energy. Appl. Energ., 111, pp.957–970. doi:10.1016/j.apenergy.2013.06.02 Klein, S.A., 2017. F-Chart Software: EES, V.10.295-3D. Kulhanek, M., and Dostal, V., 2007. Supercritical Carbon Dioxide Cycles: Thermodynamic Analysis and Comparison. Czech Technical University Prague, Prague, Czech Republic. Mecheri, M. & Moullec, Y. Le, 2016. Supercritical CO2 Brayton Cycles for Coal-Fired Power Plants. Energy, 103, pp.758–771. Pioro, I.L., Khartabil, H.F. & Duffey, R.B., 2004. Heat Transfer to Supercritical Fluids Flowing in Channels - Empirical Correlations (Survey). Nucl. Eng. Des., 230(1-3), pp.69–91. Sharma, O.P., Kaushik, S.C., Manjunath, K., 2017. Thermodynamic Analysis and Optimization of a Supercritical CO2 Regenerative Recompression Brayton Cycle Coupled with a Marine Gas Turbine for Shipboard Waste Heat Recovery. Therm. Sci. Eng. Prog., 3(1), pp. 62-74. Singh, R. et al., 2013. Dynamic Characteristics of a Direct-Heated Supercritical Carbon Dioxide Brayton Cycle in a Solar Thermal Power Plant. Energy, 50(1), pp.194–204. Shiferaw, D. et al., 2016. Economic analysis of SCO2 cycles with PCHE Recuperator design optimization. In 5th International Symposium – Supercritical CO2 Power Cycles. San Antonio, TX, pp. 1-13.

17 Paper # 165
Span, R. & Wagner, W., 1996. A New Equation of State for Carbon Dioxide Covering the Fluid Region from the Triple-Point Temperature of 1100 K at Pressure up to 800 MPa. J. Phys Chem. Ref. Data, 25(6), pp.1509–1596. Turchi, C.S. et al., 2013. Thermodynamic Study of Advanced Supercritical Carbon Dioxide Power Cycles for Concentrating Solar Power Systems. ASME J. Sol. Energ., 135(4), pp.1–7. Wright, S.A. et al., 2010. Operation and Analysis of a Supercritical CO 2 Brayton Cycle. Albuquerque, NM. and Livermore, CA., Sandia National Laboratories. SANDIA REPORT, SAND2010-0171. ACKNOWLEDGEMENTS Financial support for completion of this work by Vacuum Process Engineering, Inc. is gratefully acknowledged. NOMENCLATURE
1,2,3,… - State points in cycle H m Height h J-kg-1 or kJ-kg-1 Specific Enthalpy HX - Heat exchanger L m Length LMTD K Log-mean-temperature difference �� kg-s-1 Mass flow rate P kPa, MPa Pressure
�� Watts Thermal duty
RCOMP - Compression ratio S J-kg-1-K-1 or kJ-kg-1-K-1 Entropy
T °C or K Temperature
UA W-K-1 Overall heat transfer coefficient W m Width
�� Watts Thermal work X - Split flow ratio
GREEK
ε - Effectiveness ∆ - Change 𝜂 - Thermal efficiency
SUBSCRIPTS
c Cold COMP Compressor crit Critical cycle Power cycle e Electric i Inlet IHX Intermediate heat exchanger h Hot

18 Paper # 165
HT High-temperature HTR High-temperature recuperator LT Low-temperature LTR Low-temperature recuperator M Main o Outlet PC Pre-cooler RC Recompression REC Recuperator th Thermal TURB Turbine