Application of remote sensing technology in crop acreage and yield statistical survey in China

ANALYSIS OF SUGARCANE ACREAGE AND YIELD ESTIMATES DERIVED FROM REMOTE SENSING DATA AND OTHER HYBRID APPROACHES UNDER FASAL
PROJECT
Neha Sharma*, Shalini Saxena, Sunil Dubey, K. Choudhary, Seema Sehgal, Neetu and S. S. Ray
Mahalanobis National Crop Forecast Centre, DAC & FW, New Delhi- (nehagbpuat1791, seemasehgal93)@gmail.com, (shalini.85, sunil.dubey86,karan.c)@gov.in, (neetu.ncfc, shibendu.ncfc)@nic.in
Commission III, WG III/10
Keywords: FASAL, Remote sensing, Sugarcane, Crop Acreage, Yield estimation, Accuracy Assessment
ABSTRACT:
Sugarcane (Saccharum spp.) is a most important cash crop of India. India has the largest area under sugarcane cultivation in the world and is the world’s second largest producer of sugarcane next to Brazil. Uttar Pradesh stands as the leading producer of sugarcane in India followed by Maharashtra. Under FASAL project, the crop acreage and yield forecasts at National/State/District level, is issued at two levels. This study was carried out to analyze under FASAL Project at Mahalanobis National Crop Forecast Centre, New Delhi during year 2018. Five-year state and district level area, yield and production estimates were observed and analyzed using different approaches in 6 major sugarcane producing states of India. The state and district-wise sugarcane area yield and production estimates of MNCFC were compared with the DES Data of the corresponding year. Two statistical parameters were computed namely, Root Mean Square Error RMSE (%) and correlation coefficient (R). The results when compared to the DES statistics revealed that the RMSE (%) for district level analysis were 23.4%, 30% and 18.35%, while the correlation coefficient (R) between the DES and FASAL estimates was computed 0.94, 0.95 and 0.60 for area, production and yield respectively. These results revealed that RS based technique can be effectively used for state level acreage, yield and production estimation. The national level statistics revealed that the correlation of FASAL sugarcane area and production is in good agreement with the DES estimates as compared to Yield estimates.
1. INTRODUCTION
Sugarcane (Saccharum spp.) is a most important cash crop of India. It provides raw material for the second largest agro-based industry after textile. India occupies second position in the world, both in area and production, next to Brazil (DES, 2017). Largest sugarcane producing state of India is Uttar Pradesh, which has 47% and 44% share in overall sugarcane area and production (DES 2015-17 figures). The second and third largest states are Maharashtra and Karnataka.
It needs hot and humid climate with an average temperature of 21°C to 27°C (Das, 2007). 75-150 cm rainfall is favorable for sugarcane cultivation. Its water requirement generally ranges from 1500-2500 mm over the entire growing season. Heavy soils with good drainage are preferred for sugarcane cultivation, though it grows well on medium & light-textured soils also with assured irrigation. The crop requires about 8-10 irrigations depending upon the intensity of rainfall in that area.
Forecasting Agricultural output using Space, Agro-meteorology and Land based observations (FASAL) is a scheme of Department of Agriculture, Cooperation and Farmers’ Welfare, under which satellite, meteorological and field data are used for district-state-national pre-harvest crop production forecasting (Ray, et al., 2016; Ray and Neetu, 2017). Operational forecasts are generated by Mahalanobis National Crop Forecast Centre (MNCFC), in collaboration with India Meteorological Department, State Agriculture Departments and State Remote Sensing Centres by using the procedures developed by the Space Applications Centre of ISRO (Parihar and Oza, 2006). The first forecast for sugarcane crop is given in June end, which is national and state forecast (F1) using multi-date AWiFS data (56m spatial resolution).
The second forecast is given in November end, which is State and District forecast (F2) using single date LISS III data (23m spatial resolution), Sentinel-2A MSI (10m spatial resolution) and Landsat-8 OLI (30m spatial resolution) acquired near peak vegetation growth stage. Crop yield are generated using correlation weighted Agromet modelling with weather data, i.e. rainfall, temperature maximum and minimum. Remote sensing indices-based yield is also given at district level for sugarcane.
State-wise and district-wise area, yield and production estimates of sugarcane crop (2014-18), under FASAL project, were compared statistically with Directorate of Economics and Statistics (DES) estimates. Two statistical parameters were computed namely, Root Mean Square Error RMSE (%) and correlation coefficient (R). While RMSE showed the differences between two estimates, the correlation coefficient showed the agreement between the patterns of two estimates.
2. STUDY AREA
The district level area and production estimation is carried out in 6 major sugarcane growing states of India.
The states are Gujarat, Haryana, Karnataka, Maharashtra, Uttar Pradesh and Uttarakhand (Figure 1). In each state, the major districts growing sugarcane crop are selected for the analysis. The study states receives annual rainfall more than 75-150 mm which suits the sugarcane cultivation in that area. Also, the optimum temperature requirement of 21-27°C for the crop is met satisfactorily by the study states
* Corresponding author
The International Archives of the Photogrammetry, Remote Sensing and Spatial Information Sciences, Volume XLII-3/W6, 2019 ISPRS-GEOGLAM-ISRS Joint Int. Workshop on “Earth Observations for Agricultural Monitoring”, 18–20 February 2019, New Delhi, India
This contribution has been peer-reviewed. https://doi.org/10.5194/isprs-archives-XLII-3-W6-157-2019 | © Authors 2019. CC BY 4.0 License.
157
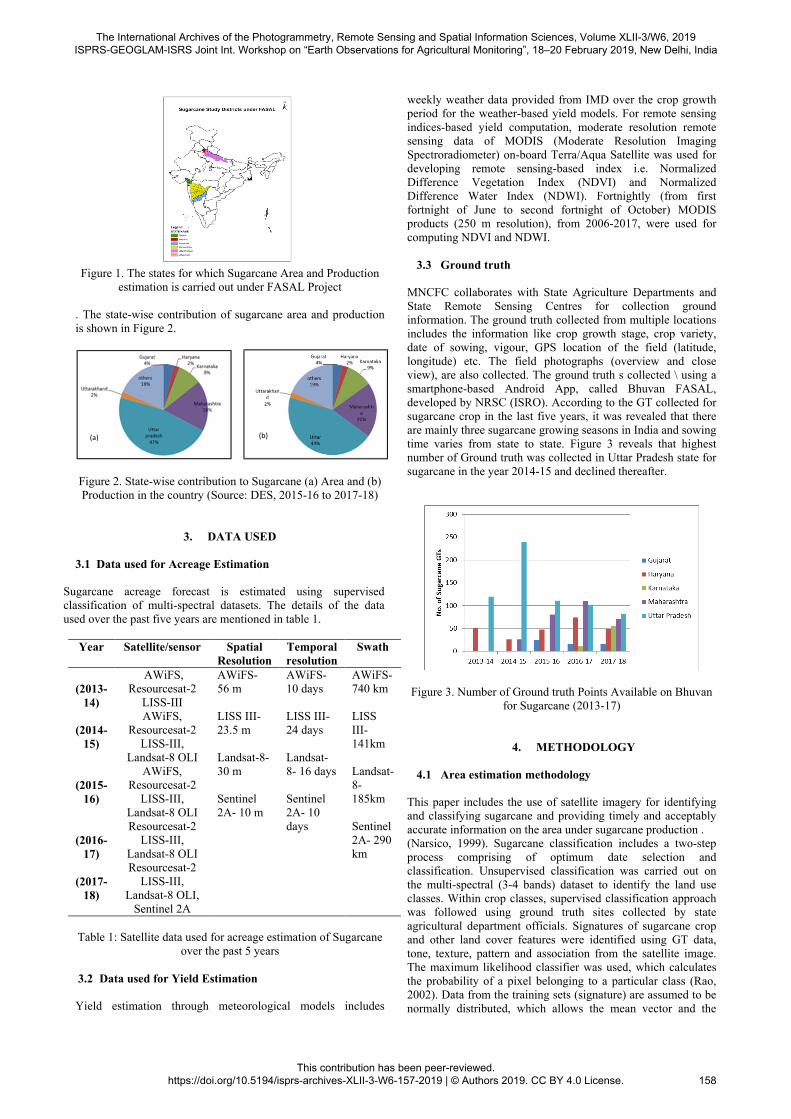
Figure 1. The states for which Sugarcane Area and Production
estimation is carried out under FASAL Project
. The state-wise contribution of sugarcane area and production is shown in Figure 2.
Figure 2. State-wise contribution to Sugarcane (a) Area and (b) Production in the country (Source: DES, 2015-16 to 2017-18)
3. DATA USED
3.1 Data used for Acreage Estimation
Sugarcane acreage forecast is estimated using supervised classification of multi-spectral datasets. The details of the data used over the past five years are mentioned in table 1.
Year Satellite/sensor Spatial Resolution
Temporal resolution
Swath
(2013-
14)
AWiFS, Resourcesat-2
LISS-III
AWiFS- 56 m LISS III- 23.5 m Landsat-8- 30 m Sentinel 2A- 10 m
AWiFS- 10 days LISS III- 24 days Landsat-8- 16 days Sentinel 2A- 10 days
AWiFS- 740 km LISS III- 141km Landsat-8- 185km Sentinel 2A- 290 km
(2014-
15)
AWiFS, Resourcesat-2
LISS-III, Landsat-8 OLI
(2015-
16)
AWiFS, Resourcesat-2
LISS-III, Landsat-8 OLI
(2016-
17)
Resourcesat-2 LISS-III,
Landsat-8 OLI
(2017-18)
Resourcesat-2 LISS-III,
Landsat-8 OLI, Sentinel 2A
Table 1: Satellite data used for acreage estimation of Sugarcane
over the past 5 years 3.2 Data used for Yield Estimation
Yield estimation through meteorological models includes
weekly weather data provided from IMD over the crop growth period for the weather-based yield models. For remote sensing indices-based yield computation, moderate resolution remote sensing data of MODIS (Moderate Resolution Imaging Spectroradiometer) on-board Terra/Aqua Satellite was used for developing remote sensing-based index i.e. Normalized Difference Vegetation Index (NDVI) and Normalized Difference Water Index (NDWI). Fortnightly (from first fortnight of June to second fortnight of October) MODIS products (250 m resolution), from 2006-2017, were used for computing NDVI and NDWI.
3.3 Ground truth
MNCFC collaborates with State Agriculture Departments and State Remote Sensing Centres for collection ground information. The ground truth collected from multiple locations includes the information like crop growth stage, crop variety, date of sowing, vigour, GPS location of the field (latitude, longitude) etc. The field photographs (overview and close view), are also collected. The ground truth s collected \ using a smartphone-based Android App, called Bhuvan FASAL, developed by NRSC (ISRO). According to the GT collected for sugarcane crop in the last five years, it was revealed that there are mainly three sugarcane growing seasons in India and sowing time varies from state to state. Figure 3 reveals that highest number of Ground truth was collected in Uttar Pradesh state for sugarcane in the year 2014-15 and declined thereafter.
Figure 3. Number of Ground truth Points Available on Bhuvan
for Sugarcane (2013-17)
4. METHODOLOGY
4.1 Area estimation methodology
This paper includes the use of satellite imagery for identifying and classifying sugarcane and providing timely and acceptably accurate information on the area under sugarcane production . (Narsico, 1999). Sugarcane classification includes a two-step process comprising of optimum date selection and classification. Unsupervised classification was carried out on the multi-spectral (3-4 bands) dataset to identify the land use classes. Within crop classes, supervised classification approach was followed using ground truth sites collected by state agricultural department officials. Signatures of sugarcane crop and other land cover features were identified using GT data, tone, texture, pattern and association from the satellite image. The maximum likelihood classifier was used, which calculates the probability of a pixel belonging to a particular class (Rao, 2002). Data from the training sets (signature) are assumed to be normally distributed, which allows the mean vector and the
(a) (b)
The International Archives of the Photogrammetry, Remote Sensing and Spatial Information Sciences, Volume XLII-3/W6, 2019 ISPRS-GEOGLAM-ISRS Joint Int. Workshop on “Earth Observations for Agricultural Monitoring”, 18–20 February 2019, New Delhi, India
This contribution has been peer-reviewed. https://doi.org/10.5194/isprs-archives-XLII-3-W6-157-2019 | © Authors 2019. CC BY 4.0 License.
158

covariance matrix of the spectral cluster of each category of brightness values to be calculated (Lillesand and Kiefer, 2000). Based on these concepts, the statistical probability of pixel’s DN value consisting to each category of land use/cover was calculated. Each pixel was assigned to the category/class with the highest probability value.
Figure 4. Classification methodology for sugarcane using multi spectral data
Figure 5. Satellite image (LISS-III) showing Sugarcane area in Uttar Pradesh
After the classification sugarcane crop mask was generated and accuracy of the classified results verified using GT data.
Class Name
Referen
ce
Classified
Number
Correct
Producers
Accuracy
Users Accura
cy
Unclassifi
ed 0 11 0 Bajra 6 6 3 50 50
Sugarcane 50 49 41 83.7 82 Maize 10 8 7 87.5 70 Paddy 110 102 97 95.1 88.2 Total 176 176 148
Overall Classification Accuracy 84.1
Overall Kappa 0.713
Table 2. Accuracy Assessment of sugarcane classification The classification accuracy (%) and Kappa coefficient (Cohen, 1960) for a selected scene is presented in Table 2. Overall accuracy is computed by dividing the total number of correctly classified pixels by the total number of pixels used in the classification (Congalton, 1991). Kappa coefficient reflects the difference between actual agreement and the agreement expected by chance. Kappa of 0.713 means there is 71.3% better agreement than by chance alone. Figure 6, elaborates the sugarcane classified image of Yamunanagar district of Haryana. Furthermore, the sugarcane classified image was used to give the acreage estimation, by overlaying the district boundary. Additional data used for crop classification include agricultural crop mask, collected from LULC mapping programme of NRSC (NRSC, 2006).
Figure 6. Satellite image showing Sugarcane FCC and Classified area in Yamunanagar district of Haryana
Figure 7. Crop map of the sugarcane growing states under FASAL Project
4.2 YIELD ESTIMATION METHODOLOGY
4.2.1 Agrometeorological regression models: District level Sugarcane yield estimation is done using Agro-meteorological regression models (Ghosh et al., 2014) utilizing the weekly weather data of last 20 years and using data from June to November. Daily weather data comprising of Maximum
The International Archives of the Photogrammetry, Remote Sensing and Spatial Information Sciences, Volume XLII-3/W6, 2019 ISPRS-GEOGLAM-ISRS Joint Int. Workshop on “Earth Observations for Agricultural Monitoring”, 18–20 February 2019, New Delhi, India
This contribution has been peer-reviewed. https://doi.org/10.5194/isprs-archives-XLII-3-W6-157-2019 | © Authors 2019. CC BY 4.0 License.
159

and Minimum Temperature, Rainfall and Morning & Evening Relative Humidity were downloaded from IMD website (http://imdagrimet.gov.in/imd_datalist/form) and pre-processed to obtain weekly observations. The historical weather data from 1995-2018 and yield data from 1995 to recent available is acquired and arranged to prepare district-wise templates. Initially, trend yield was calculated to obtain adjusted yield which is the difference of actual and trend yield. The weighted and non-weighted Z-parameters were calculated using weather data and adjusted yield. Non-weighted parameters (Z10, Z20…., Z50) were calculated taking the season-wise sum of weekly observations where 1 to 5 are parameters namely Maximum Temperature, Minimum Temperature, Rainfall, Morning RH and Evening RH respectively. Weighted parameters (Z11, Z21…., Z51) were calculated taking season-wise sum product of correlation coefficient (correlation between adjusted yield and every week’s observations in all the years) and weekly observations. The weighted and non-weighted combination parameters (Z120, Z121, Z130 etc.) were calculated taking the product of two individual above mentioned weather parameters. The data was further analyzed in SPSS for yield estimation for current year. Step-wise linear regression method has been used for developing yield models at 5% level of significance. 4.2.2 Remote sensing indices (NDVI and NDWI) based empirical models:
Various techniques and remote sensing products had been used for sugarcane yield forecasting (Mulianga et al. 2013, Morel et al. 2014, Rahman and Robson, 2016). Remote sensing-based sugarcane yield was estimated using MODIS (MOD13Q1A V006, 250m resolution) vegetation index product. Vegetation Indices, such as NDVI and NDWI, were computed fortnightly (first fortnight of June to second fortnight of October) basis for the period 2006-2017. Step-wise regression was carried out between DES yield and Remote sensing indices. The flow diagram of the methodology is presented in Figure 7.
Figure 8: Flow diagram for calculation of sugarcane yield using
RS indices District level yield estimates, derived from the above two approaches, were combined statistically, giving weightage to respective models’ F values, to get the final yield estimate.
4.2.3 Statistical comparison of FASAL and DES Estimates
State-wise area, yield and production estimates of sugarcane crop (2013-17), under FASAL project, were compared statistically with Directorate of Economics and Statistics (DES) estimates. The Map shown in figure 9 describes the average area and production estimates of the districts under FASAL at the National level.
a.
b.
Figure 9: District- wise DES estimates of Sugarcane (a) Area (000 ha) and (b) Production (000 tons) based on 3 years
average (2014-17) The district-wise area, yield and production estimates of sugarcane were compared with the DES Data of the corresponding year. Two statistical parameters were computed namely, Root Mean Square Error RMSE (%) and correlation coefficient (R). RMSE showed the differences between two estimates, The smaller the error, the better the forecasting ability of that model according to the RMSE criterion (Hyndman & Koehler, 2006). The correlation coefficient showed the agreement between the patterns of two estimates and varies between -1 and +1. Correlation coefficient of 0
The International Archives of the Photogrammetry, Remote Sensing and Spatial Information Sciences, Volume XLII-3/W6, 2019 ISPRS-GEOGLAM-ISRS Joint Int. Workshop on “Earth Observations for Agricultural Monitoring”, 18–20 February 2019, New Delhi, India
This contribution has been peer-reviewed. https://doi.org/10.5194/isprs-archives-XLII-3-W6-157-2019 | © Authors 2019. CC BY 4.0 License.
160

implies there is no linear relationship between the variables (Gomez and Gomez, 1984).
5. RESULTS AND DISCUSSION
State-wise area, yield and production FASAL estimates (2014-18) were analysed statistically with DES estimates of the corresponding year. The statistical parameters were computed and it was evident from Figure 11 that the RMSE (%) was highest for the state-level production estimates in 2016-17. Reason maybe the drop-in sugarcane production up to 25% in Maharashtra and 15% in Karnataka as listed by Indian Sugar Mills Association in its First Advance Estimation of 2016-17. Also, the shift of farmers from sugarcane cultivation to pulses and oilseeds cultivation was enlisted as an aspect for decreased production of the crop in Maharashtra. The correlation coefficient (R) was also computed and it was revealed that the FASAL estimates were in good agreement with the DES estimates. These results reveal that RS based technique can be effectively used for state level acreage, yield and production estimation.
(a)
(b)
Figure 10: Year-wise (a) RMSE (%) and (b) Correlation coefficient computed for the comparison of sugarcane FASAL
and DES estimates at State-level (2014-15 to 2017-18)
Figure 11: State-wise statistical parameters computed for the comparison of sugarcane FASAL and DES estimates (2014-15
to 2017-18)
District-wise area, yield and production FASAL estimates (2013-17) were analysed statistically with DES estimates of the corresponding year. The district wise estimates of multiple years were pooled together for the desired districts of the study states and was analyzed statistically. RMSE values as per the analysis were found to be 23.4%, 18.35% and 30% for area, yield and production, respectively. The correlation coefficient (R) between the DES and FASAL estimates was computed as 0.95, 0.60 and 0.94 for area, yield and production respectively. The yield encounters a lower value for the correlation coefficient, which may be due to lack of the capturing ability of variation found in the sowing dates of the crop over the entire country.
Figure 12: District-wise Area (000’ ha) comparison of Sugarcane DES and FASAL estimates
Figure 13: District-wise Area (000’ ha) comparison of Sugarcane DES and FASAL estimates
The International Archives of the Photogrammetry, Remote Sensing and Spatial Information Sciences, Volume XLII-3/W6, 2019 ISPRS-GEOGLAM-ISRS Joint Int. Workshop on “Earth Observations for Agricultural Monitoring”, 18–20 February 2019, New Delhi, India
This contribution has been peer-reviewed. https://doi.org/10.5194/isprs-archives-XLII-3-W6-157-2019 | © Authors 2019. CC BY 4.0 License.
161

Figure 14: District-wise Yield (Kg/ha) comparison of Sugarcane
DES and FASAL estimates
Figure 15: Relative Deviation between DES and FASAL estimates at National Level
It was concluded from the analysis that yield values had the least correlation between the DES and FASAL estimates. The relative deviation between both the estimates have been presented in the figure 11. The Relative deviation was found to be highest in the year 2016-17, which may be due to drop in the area and production of Karnataka and Maharashtra state in the particular year.
5. CONCLUSION
The Sugarcane crop area and yield is mainly dependent on sowing pattern and duration of crop (sowing to harvesting). The RS based sugarcane area and yield estimates were observed to be higher than the DES estimates mainly in Maharashtra state. The national level statistics shows that the correlation of FASAL sugarcane area and production is in good agreement with the DES estimates as compared to Yield estimates. The yield methodology although needs improvement as is elaborated in the results discussed above.
ACKNOWLEDGEMENT
The crop estimation work has been carried out under the FASAL (Forecasting Agricultural output using Space, Agro-meteorology and Land based observations) of Department of Agriculture, Cooperation & Farmers Welfare (DAC&FW). The authors are thankful to the senior officials of DAC&FW, for their strong support and keen interest in the work. The ground truth data collected and expert knowledge provided for remote sensing data analysis by the officials of the State Agriculture
Departments and State Remote Sensing Centres, are gratefully acknowledged. The satellite data provided by ISRO (Resourcesat 2 & 2A), ESA (Sentinel 2), NASA (MODIS & Landsat-8) and the weather data provided by IMD are thankfully acknowledged. Thanks, are also due to the Analysts of FASAL team, who carried out the annual wheat crop analysis. Thanks are also due to scientists of SAC (ISRO), who developed the procedures for crop estimation under FASAL project.
REFERENCES
Cohen, Jacob (1960). A coefficient of agreement for nominal scales. Educational and Psychological Measurement. 20(1): 37–46. Congalton, R. G. (1991) A Review of Assessing the Accuracy of Classifications of Remotely Sensed Data. Remote Sens. Environ. 37:35-46 Das, N. R. (2007) Crops of India. Scientific Publishers. 334 p. DES (2017) Agricultural Statistics at a Glance 2016. Directorate of Economics and Statistics, Department of Agriculture, Cooperation & Farmers Welfare, Ministry of Agriculture & Farmers Welfare, Government of India, 489p. Dubey, S.K., Gavli, A.S., Yadav, S., Sehgal, S. and Ray, S.S. (2016). Index based approach of yield forecasting for Sugarcane (Saccharum officinarum L.) crop in India. Fourth International Agronomy Congress, Nov 22-16, 2016, New Delhi.
Ghosh, K., Balasubramanian, R., Bandopadhyay, S. Chattopadhyay, N., Singh, K.K. and Rathore, L.S., (2014), “Development of crop yield forecast models under FASAL- a case study of kharif Rice in West Bengal”. J. Agromet., 16 (1), 1-8.
Gomez, K.A. and Gomez, A.A. (1984). Statistical procedures for agricultural research (2 ed.) John Wiley and sons, New York, 680p. Hyndman, R.J., and Koehler, A.B. (2006). Another look at measures of forecast accuracy. International journal of Forecasting, 22, 679-688.
Lillesand, T.M. and Kiefer, R.W. (2000). Remote Sensing and Image Interpretation. John Wiley & Sons, New York.
Morel, J., Todoroff, P., Bégué, A., Bury, A., Martiné, J.F. and Petit, M. (2014). “Toward a satellite-based system of sugarcane yield estimation and forecasting in smallholder farming conditions: A case study on Reunion Island, Remote Sensing, 6(7), 6620-6635. Mulianga, B., Bégué, A., Simoes, M. and Todoroff, P. (2013). “Forecasting regional sugarcane yield based on time integral and spatial aggregation of MODIS NDVI” Remote Sensing, 5(5), 2184-2199. Narsico, G., Schmidt, E. (1999). Proc S Afr Sug Technol Ass (1999) 73. NRSC (2006) National Land use and Land cover mapping using multi-temporal AWiFS data. NRSA/LULC/1:250K/2006-2. National Remote Sensing Centre. 39p. Parihar, J. S. and Oza, S. R. (2006) FASAL: An integrated approach for crop assessment and production forecasting.
The International Archives of the Photogrammetry, Remote Sensing and Spatial Information Sciences, Volume XLII-3/W6, 2019 ISPRS-GEOGLAM-ISRS Joint Int. Workshop on “Earth Observations for Agricultural Monitoring”, 18–20 February 2019, New Delhi, India
This contribution has been peer-reviewed. https://doi.org/10.5194/isprs-archives-XLII-3-W6-157-2019 | © Authors 2019. CC BY 4.0 License.
162

Proceedings of SPIE - The International Society for Optical Engineering 6411. Rahman, M.M. and Robson, A.J. (2016). “A Novel Approach for Sugarcane Yield Prediction Using Landsat Time Series Imagery: A Case Study on Bundaberg Region” Advances in Remote Sensing, 5(02), 93. Rao, P.V.K., Rao, V.V. and Venkatraman, L. (2002). Remote Sensing: A Technology for Assessment of Sugarcane Crop Acreage and Yield. Sugar Tech, Society for Sugar Research and Promotion, Vol. 4 (3&4): 97 - 101 (2002).
Ray, S. S. & Neetu. 2017. Crop area estimation with Remote Sensing. In: J. Delincé (ed.), Handbook on Remote Sensing for Agricultural Statistics (Chapter 5). Handbook of the Global Strategy to improve Agricultural and Rural Statistics (GSARS): Rome. pp. 131-183. Ray, S. S., Neetu, Manjunath, K. R. and Singh, K. K. 2016 Crop Production Forecasting using Space, Agro-meteorology and Land based Observations: Indian Experience. Presented in International seminar on approaches and methodologies for crop monitoring and production forecasting.25 – 26 May 2016, Dhaka, Bangladesh.
The International Archives of the Photogrammetry, Remote Sensing and Spatial Information Sciences, Volume XLII-3/W6, 2019 ISPRS-GEOGLAM-ISRS Joint Int. Workshop on “Earth Observations for Agricultural Monitoring”, 18–20 February 2019, New Delhi, India
This contribution has been peer-reviewed. https://doi.org/10.5194/isprs-archives-XLII-3-W6-157-2019 | © Authors 2019. CC BY 4.0 License.
163