Analysis of some /?-Adrenergic Agonists in Biological ...
199
Analysis of some /?-Adrenergic Agonists in Biological Matrices after Evaluation of Various Extraction Methodologies and Determination Procedures. by Damien Thomas Boyd B.Sc. A thesis submitted for the Degree of Doctor of Philosophy Dublin City University (i) September 1994
Transcript of Analysis of some /?-Adrenergic Agonists in Biological ...

Analysis of some /?-Adrenergic Agonists in Biological Matrices
after Evaluation of Various Extraction Methodologies and
Determination Procedures.
by
Damien Thomas Boyd B.Sc.
A thesis submitted for the Degree of
Doctor of Philosophy
Dublin City University
(i)
September 1994

i
Declaration
I hereby certify that this material, which I now submit for assessment on the
programme of study leading to the award of Doctor of Philosophy is entirely
my own work and has not been taken from the work of others save and to the
extent that such work has been cited and acknowledged within the text of my
work.
Signed ^ ^ Date _____________
Candidate
( i i )

Dedicated to my parents, Cathal and Bridgeen
( i i i )

D uring my three years research period I was fortunate to be the recipient of
a great deal cf help and encouragement from a number of people.
Firstly, my industrial supervisor at the National Food Centre, Dr. Michael
O’Keeffe, for his excellent guidance and for directing me "through the deep
and intrepid waters of residue analysis":
The people in the lab at the NFC especially Sean, Paula, Paddy, Audrey,
Joan, Aodhmar, Sean, Liz and Greta:
The people in "Electroanálisis", Oviedo, especially Dr. Jose Ramon Barreira
Rodriquez and Prof. Paulino Tunon Blanco, for making my days in Spain so
memorable:
Teagasc, the Frasmus programme, the FLAIR programme and the School of
Chemical Sciences for their financial support:
Karen Williams and Prof. Dai Games at the University of Swansea (re FLAIR
project), Central Veterinary Laboratories (UK) (re supplying treated liver);
My family for their help and constant encouragement;
My fellow postgrads at DCU for keeping me in mind:
And finally to Prof. Malcolm Smyth for the constant support, advice and
supervision and for giving me the opportunity to travel.
Acknowledgements
(iv)

TABLE OF CONTENTS
1.1 INTRO DUCTIO N..................................................................... -2-
1.2 SAMPLE PREPARATION PROCEDURES ...................... -9-
1.3 SAMPLE CLEAN-UP/EXTRACTION OF 0-AGONISTS ............................................................................ -11-
1.3.1 Liquid-liquid extraction ......................................................... -11-
1.3.2 Solid phase extraction m ethodology..................................... -15-
1.3.2.1 Off-line extraction .................................................................. -15-
1.3.2.1.1 On-column liquid-liquid partitioning .................................. -15-
1.3.2.1.2 Reversed-Phase S P E ............................................................... -17-
1.3.2.1.3 Ion-exchange SPE .................................................................. -17-
1.3.2.1.4 Mixed phase interactions ...................................................... -18-
1.3.2.2 On-line solid phase extraction ............................................. -20-
1.3.3 Immunoaffinity chromatography (IA C )............................... -21-
1.4 SEPARATION OF (8-AGONISTS....................................... -22-
1.5 DETECTION OF ¡3-AGONISTS ....................................... -24-
1.5.1 Spectrometric D etection ......................................................... -25-
1.5.2 Electrochemical Detection ................................. -27-
1.5.3 Immunoassay Procedures...................................................... -28-
1.5.3.1 Radioimmunoassay.................................................................. -29-
1.5.3.2 Enzyme-immunoassay............................................................ -30-
1.5.4 Mass Spectrometric D etec tio n ............................................. -32-
CHAPTER 1 ...................................................................................................... -1-

1.6 CO NCLUSIO NS........................................................... -37-
1.7 REFERENCES.............................................................. -39-
CHAPTER 2 ................................................................................................... -49-
2.1 INTRO DUCTIO N........................................................ -50-
2.2 EXPERIM ENTAL........................................................ -56-
2.2.1 Reagents and materials ........................................................ -56-
2.2.2 Apparatus ................................................................................ -57-
2.2.3 Methods .................................................................................. -57-
2.2.3.1 Cyclic voltammetry at carbon paste e lectrod es....... -57-
2.2.3.2 Differential pulse voltammetry at Nafion-modifiedelectrodes.............................................. ......... .......................... -58-
2.2.3.3 Analysis of a pharmaceutical preparation ........................ -59-
2.2.3.4 Extraction m ethodology................................................ -59-
2.3 RESULTS AND D ISC U SSIO N ................................. -60-
2.3.1 Electrochemical behaviour at bare carbon pasteelectrodes......................................................................... -60-
2.3.2 Electrochemical studies at a Nafion-modified carbon pasteelectrode (N M C PE )..................................................... -69-
2.3.2.1 Influence of p H .............................................................. -69-
2.3.2.2 Influence of pulse height, scan rate and depositionpotential .................................................................................. -70-
2.3.2.3 Accumulation studies ............................................... -72-
2.3.2.4 Cyclic voltammetry........................................................ -76-
2.3.2.5 Medium E x ch a n g e ........................................................ -78-
2.3.2.6 Response of some endogenous neurotransmitters at theNMCPE .................................................................................. -78-
2.3.3 Application of the NMCPE to fenoterol determination inreal sa m p les ............................................................................ -80-
2.3.3.1. Effect of pH of supporting electrolyte ............................... -80-
2 .3 .3 .2 Optimisation of Nafion concentration.................................. -80-
2.3.3.3 Fenoterol accumulation studies............................................. -82-
2.3.3.4 Calibration curves .................................................................. -84-
2.3.3.5 Reproducibility ........................................................................ -85-
2.3.3.6 Choice of Nafion concentration for real sam p les -85-
2.3.4 Analysis of fenoterol in real sam p les.................................. -86-
2.4 CO NC LUSIO NS..................................................................... -90-
2.5 REFEREN CES........................................................................ -93-
CHAPTER 3 ................................................................................................... -96-
3.1 INTRODUCTION .................................................................. -97-.
3.2 EXPERIM ENTAL.................................................................... -110-
3.2.1 Reagents and Equipment ........................................................ -110- <
3.2.2 Apparatus ...................................................................................-111-
3.2.3 Methods ..................................................................................... -112-
3.2.3.1 Samples and Sample Preparation .......................................... -112-
3.2.3.2 Fortification................................................................................-112-
3.2.3.3 Extraction ...................................................................................-113-
3.2.3.4 Radioimmunoassay procedure ................................................-114-
3.2.3.5. Enzyme im m unoassay.............................................................. -114-
3.3 RESULTS AND D ISC U SSIO N .............................................-115-
3.3.1 Method optim isation.................................................................-115-

3.3.2 Method validation by radioimmunoassay............................. -117-
3.3.3 Method validation by enzyme immunoassay....................... -120-
3.3.4 Sample analyses......................................................................... -121-
3.3.5 Limit of detection...................................................................... -121-
3.4 CO NCLUSIO NS...................................................................... -124-
3.4. REFEREN CES......................................................................... -126-
CHAPTER 4 ................................................................................................... -129-
4.1 INTRODUCTION ................................................................... -130-
4.2 EXPERIM ENTAL................................................................... -137-
4.2.1 Reagents and Equipment ........................................................-137-
4.2.2 Apparatus .................................................................................. -138-
4.2.3 Methods .....................................................................................-139-
4.2.3.1 Sam ples........................................................................................-139-
4.2.3.2 Fortification............................................................................... -139-
4.2.3.3 MSPD Extraction...................................................................... -139-
4.2.3.4 Enzyme Hydrolysis................................................................... -141-
4.2.3.5 C18 SPE procedure ................................................................... -141-
4.2.3.6 Enzyme im m unoassay............................................................. -142-
4.2.3.7 Radioimmunoassay................................................................... -142-
4.3 RESULTS AND D ISC USSIO N............................................ -143-
4.3.1 Direct MSPD using a water wash clean-up step ...............-143-
4.3.1.1 Method Optimisation................................................................ -143-
4.3.1.2 Enzyme Hydrolysis................................................................... -145-

4.3.1.3 Method V alidation ....................................................................-147-
4.3.1.4 Limit of detection.......................................................................-149-
4.3.1.5 Incurred sample a n a ly ses ........................... -149-
4.3.1.6 Multiresidue analysis.................................................................-150-
4.3.2 Linkage of MSPD with a CJ8 SPE clean-up s t e p -153-
4.3.2.1 Method validation ....................................................................-153-
4.3.2.2 Limit of detection.......................................................................-157-
4.4.2.3 Incurred sample analyses ........................................................ -158-
4.5 CO NC LUSIO NS.......................................................................-160-
4.6 R EFEREN CES..........................................................................-162-
CHAPTER 5 ......................................................................................................-164-
5.1 INTRO DUCTIO N....................................................................-165-
5.2 EXPERIM ENTAL....................................................................-176-
5.2.1 Reagents and materials ........................ -176-
5.2.2 Apparatus .................................................................................. -176-
5.2.3 Methods ..................................................................................... -177-
5.2.3.1 Sam ples........................................................................................ -177-
5.2.3.2 Supercritical fluid chromatography (S F C ) ........................... -177-
5.2.3.3 Supercritical fluid extraction (S F E ) .......................................-178-
5.2.3.3.1 Extraction from filter paper..................................................... -178-
5 .2 .3 .3 .2 Extraction from liv e r .................................................................-179-
5.3 RESULTS AND DISC U SSIO N ............................................ -180-
5.4 CO NC LUSIO NS...................................................................... -184-

REFERENCES

ABSTRACT
Biological sample clean-up procedures were evaluated for the extraction of a range of /3-agonists. Once extracted the compounds were determined by immunoassay, electrochemical techniques and supercritical fluid chromatography (SFC).
Clenbuterol was isolated from liver tissue using matrix solid phase dispersion (MSPD). The technique was optimised for extract clean-up and recovery by evaluation of various wash and elution solvents using radiolabelled clenbuterol. Recovery of clenbuterol was > 90 % at three levels tested (1, 2 and 5 ng/g). MSPD was then applied to the extraction of other compounds in this class like salbutamol, mabuterol, cimaterol and terbutaline in the low ng/g range. For residues which occur as conjugates, an enzyme hydrolysis procedure was used. Sample extracts were assayed by radioimmunoassay (RIA) and enzyme immunoassay (EIA).
Cyclic voltammetry (CV) was used to study the electrooxidation of salbutamol, fenoterol and metaproterenol at unmodified and Nafion-modified carbon paste electrodes (CPE’s). All compounds were oxidised irreversibly at high positive potentials at the CPE. The Nafion-modified electrode allowed the accumulation of all compounds with time, resulting in an enhanced sensitivity. The application of the Nafion-modified electrode to the analysis of fenoterol in human urine and serum extracts was demonstrated at the 10'7 and 10'6 M level, respectively. In this case the more sensitive differential pulse voltammetric (DPV) mode of detection was chosen.
Finally, the application of supercritical fluid extraction (SFE) for the isolation of /3-agonists was investigated. Extracts of pure standards and liver samples, dispersed on support media (Celite and C18 material), were assayed by supercritical fluid chromatography (SFC) with UV detection.

CHAPTER 1
A REVIEW OF METHODS FOR THE ANALYSIS OF 0-AGONISTS IN
BIOLOGICAL MATRICES

1.1 INTRODUCTION
This chapter focusses on analytical procedures which are used for the
determination of the class of compounds known as /32-agonists. /?2-agonists are
synthetic derivatives of naturally occurring molecules (catecholamines) and,
as the name suggests, they bind to /32-receptors on nerve cells to produce
directly observable physiological effects (e.g. increase in heart rate). Their
mechanism of action follows that of norepinephrine and epinephrine which,
when released at nerve endings into the bloodstream, represent an important
aspect of the functions of the autonomic (or involuntary) nervous system. This
system controls many organs (cardiovascular, gastrointestinal etc) and
metabolic processes. The autonomic functions are divided into two main
components; the parasympathetic and sympathetic systems. The latter system
is responsible for the "fight or flight" reaction. In such situations, energy is
required immediately, and heart rate and blood flow through coronary vessels
and skeletal muscles increase. These reactions are mediated by the
catecholamines, epinephrine and norepinephrine. The structures of these two
physiologically important compounds are shown in Figure 1.1
How a /32-agonist, whether synthetic (e.g. clenbuterol) or natural (e.g.
epinephrine), actually brings about a response is dependent on a series of
biochemical reactions at the /32-receptor in the cell membrane. The /?2-
adrenergic receptor model, shown in Figure 1.2, shows how the response is
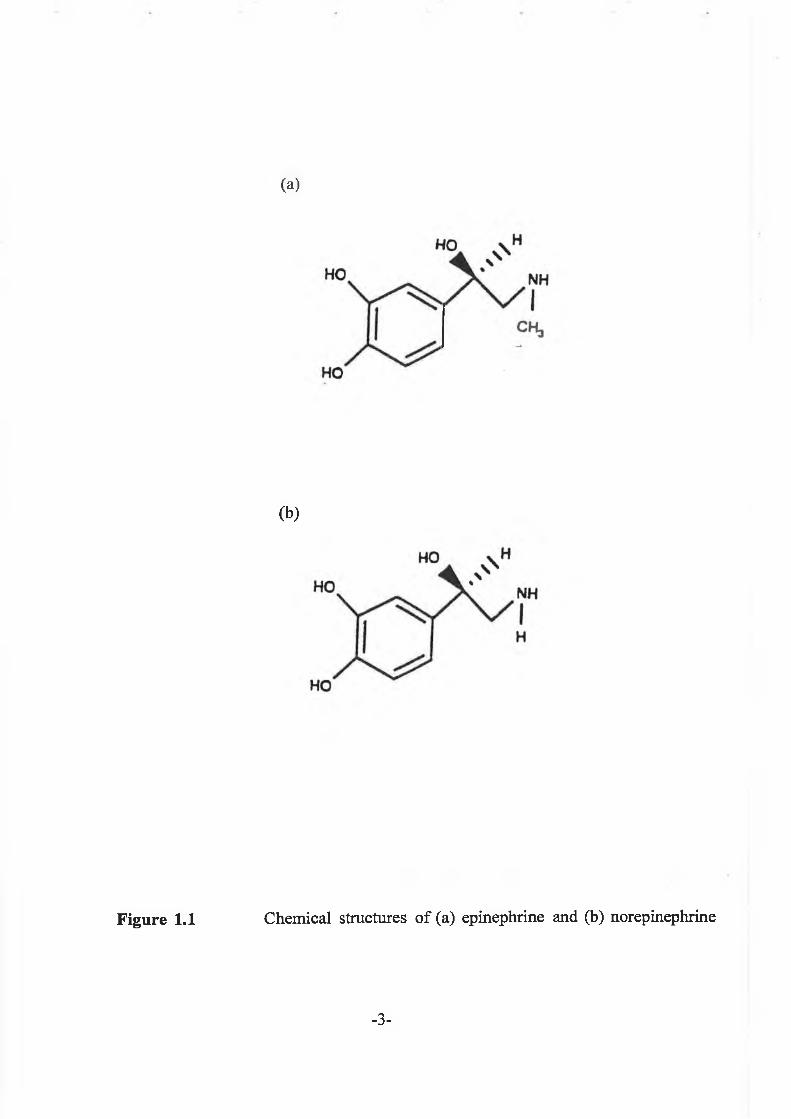
Figure 1.1
(a)
(b)
Chemical structures o f (a) epinephrine and (b) norepinephrine
-3-

Plasmamembrana
Response <----------- E*p R protein
S'AMP(inactive)
Figure 1.2 (3-adrenergic receptor model

achieved. The j82-receptor (R) is coupled via a protein (guanine-Gs) to the
enzyme, adenyl cyclase (AC). Upon /3-agonist-receptor binding, the G protein
stimulates AC, which in turn stimulates the formation of a growth factor,
cyclic adenosine 3, 5-monophosphate (cAMP). cAMP stimulates protein
kinase (PK) activity, or it can itself be inactivated by phosphodiesterase
(PDE). A regulatory protein (R protein) is split off and active PK stimulates
phosphorylation of enzymes which can trigger the response. /3-receptor
activity results in the following effects; heart-rate increase, relaxation of
muscle tissues in bronchi, uterus and intestinal wall, and the stimulation of
insulin release and glycogen breakdown. The major clinical indications for
use of /32-agonists are respiratory diseases and tocolysis. In recent years it has
been established that certain synthetic /32-agonists, when administered to farm
animals at multiples of the therapeutic dose, cause a shift in the flow of
nutrients away from adipose tissue towards muscle tissue (commonly called a
repartitioning effect) [1]. The net result of such practices is the production of
a leaner carcass. The toxicological and pharmacological implications of
residues present in edible tissues has led to the banning of these compounds
as growth enhancing agents within the EU.
j32-agonists are generally divided into two main groups, the substituted
anilines which include clenbuterol and cimaterol, and the substituted phenols
which include salbutamol and terbutaline. Figure 1.3 gives the chemical
structure of the /32-agonists studied, representing compounds from both groups.

OH C haI IOH — C H ^ H C — Cha
Ic h 3
C L E N B U T E R O L
HI
OH - CH--NH - C - CH3 1 I
c h 3
C IM A T E R O L
OH f H3
o h - CH,-NH - C -C H 3 ich3
HO.
M ABUTEROL
OH ch 3I «
O H - C H , - N H - C — CH3
/ 1S A L B U T A M O L CH3
x c h 3
cu — c h 2 - n h — c - c h 3X
c h 3TERBUTALINE
HO
HO
OH
Figure 1.3 Chemical structures o f the ß-agonists studied
-6-

The compounds possess a common /3-hydroxyamino group on the side chain,
but are differentiated from each other by varied substituents on the aryl moiety
and the terminal amino group. The hydroxyl group(s) on the aromatic ring
of the substituted phenols is a target for glucuronide or sulphate conjugate
formation [2]. Hence for determination of total residue concentration, a
deconjugation stage must be incorporated into any assay procedure.
Selection of the appropriate biological sample for analysis is an
important criterion for this type of compound. Plasma and urine may be
monitored, but the levels are usually low (ppt to low ppb) as the compounds
have short half-lives and are cleared rapidly from the body. Organs which
accumulate /32-agonists are more suitable for monitoring usage. Work by
Meyer and Rinke has shown that the liver contains detectable clenbuterol
residues for up to two weeks after withdrawal of the drug from the animals
diet [3]. More recently, several authors have reported that eye fluids and
tissue fractions may attain concentrations an order of magnitude higher than
in liver [4, 5].
The ideal determination procedure for /5-agonists would combine
efficient clean-up of sample matrix with sensitive measurement of analyte(s).
For sample clean-up, a wide range of approaches have been adopted.
Classical solvent extraction procedures have resulted in good recoveries of the
substituted anilines such as clenbuterol and mabuterol [6], but are less
effective for the more polar compounds, such as salbutamol [7]. Emphasis

has now been placed on safer and more rapid alternatives like solid phase
extraction (SPE), matrix solid phase dispersion (MSPD) and immunoaffinity
chromatography (IAC). Such techniques may be more suited, also, for a
multiresidue approach to analysis. After sample clean-up has been achieved,
the compound(s) may be detected by any one of a number of sensitive
techniques. High performance liquid chromatography (HPLC) with
fluoresence or electrochemical detection has proved sensitive for one or a
combination of /3-agonists [7-9]. Ultraviolet (UV) detection only gives
optimum sensitivity after a post-column derivatisation procedure [10].
Immunoassay techniques, such as radioimmunoassay (RIA) and enzyme
immunoassay (EIA) or radioreceptor assays are most sensitive detection
systems for 0-agonists. Procedures have been reported, for the analysis of a
/3-agonist of choice (i.e RIA) [11] or a number of /3-agonist compounds (i.e.
radioreceptor assay) [12] in this class. Mass spectrometry is the most popular
confirmation technique used in this field. Methods based on gas
chromatography-mass spectrometry (GC-MS) have been developed for many
0-agonists [13, 14] and, more recently, clenbuterol has been determined using
methods based on liquid chromatography-mass spectrometry (LC-MS) [15].
This review provides an up-to-date evaluation of the methodologies
developed to determine /3-agonists in complex biological samples. Emphasis
has been placed on sample purification procedures leading to extracts

containing one or a combination of jS-agonists which can be identified and
quantified by an appropriate detection system.
1.2 SAMPLE PREPARATION PROCEDURES
Before a clean-up procedure may be carried out the sample must be
prepared in such a way that optimised conditions for the extraction of the
analyte(s) may be used. This is particularly relevant for complex matrices like
biological samples, the nature of which determines the kind of pretreatment
step required. For liquid samples, which include urine and plasma, suspended
matter may be removed by centrifugation [13] or filtration [16]. For residues
which occur as conjugates, enzyme and acid hydrolysis procedures have been
used, prior to sample clean-up. An enzyme hydrolysis procedure on
clenbuterol-incurred urine was carried out by Hooijerink et al. but their results
showed that this compound forms relatively low levels of glucuronide (5%)
conjugates (sulphate conjugates not found) [17]. For the phenolic-type (3-
agonists conjugate formation has been reported [2, 18]. Enzyme hydrolysis
of salbutamol was carried out in urine, after the sample was adjusted to pH
5.0, by incubation with a dilute solution of enzyme (glucuronidase/sulphatase)
at 37°C for between 16-18 h [13, 19]. Acid hydrolysis has been reported for
the deconjugation of O-sulphate esters of metaproterenol in plasma samples
[20]. After protein precipitation using trichloroacetic acid, the plasma

supernatant was incubated with 0.2 ml 0.2 M hydrochloric acid at 65 °C for
90 min and free metaproterenol was extracted using C18 SPE after pH
adjustment to 10.0. Alternatively, the hydrolysis step can be omitted
altogether; incurred residues of salbutamol may be extracted from urine by
cation-exchange SPE and analysed as the conjugate by MS [21].
Solid samples, which include liver and muscle, require a more intensive
sample pretreatment stage. The analyte(s) must be exposed to extracting
solvents to optimise the conditions for extraction. This is accomplished, in
part, by mechanical dispersion using a mincer and/or a homogeniser. The
most popular approach for tissue break-up is the homogenisation of samples
in water, acid or an aqueous buffer. Following centrifugation, the supernatant
may be treated in various ways, made acidic or alkaline and extracted directly
[14, 22] or pretreated further e.g. removal of fats using solvent extraction [4].
For the phenol-type /3-agonists, a deconjugation step is required; useful
studies have been carried out which show that the main salbutamol metabolite
in calf tissue samples, including liver, is the sulphate conjugate [23].
The use of ultrasonication to extract /3-agonists from a tissue/aqueous
acid medium has also been reported [24, 25]. An extraction time of 15 min
was sufficient and the pH of the supernatant was adjusted to optimise further
clean-up steps. In order to digest proteins, enzymatic digestion at 55°C has
been described [26, 27]. Lyophilization (freeze drying) of rat tissue samples

has been carried out prior to extraction [28]. For eye tissues sample
pretreatment is analogous to that of liver and muscle samples [4].
1.3 SAMPLE CLEAN-UP/EXTRACTION OF /3-AGONISTS
The main goal of the sample pretreatment step(s) is to produce a
primary extract which can be easily cleaned-up using an appropriate extraction
procedure. Various types of sample clean-up procedures are available:
conventional liquid-liquid partitioning, solid phase extraction methodology,
matrix solid phase dispersion and immunoaffinity chromatography. In some
cases these procedures may be used in combination to obtain highly purified
extracts.
1.3.1 Liquid-liquid extraction
Originally, liquid-liquid extraction was the standard method for isolating
drug compounds from biological samples. Unfortunately, this technique is
relatively time-consuming especially for the extraction of polar compounds or
a combination of compounds with various chemical properties. The main
approach to /3-agonist extraction has been to adjust the pH of the sample above
the pKa of the compound (usually > 9.0) to achieve deprotonation, followed

by partitioning with an organic solvent. Most of the earlier methods for
clenbuterol analysis adopt this type of clean-up strategy. Diquet et al. devised
an extraction method for clenbuterol from mouse plasma, the compound being
extracted at high pH into chloroform [29]. Although the recovery of drug was
low (45%), the use of an internal standard, yohimbine, allowed reproducible
measurement of the levels present. Higher recovery, from urine, of 80% was
reported by Brunn, using dichloromethane as the extraction solvent [30].
Diethyl ether was the chosen solvent for the extraction of clenbuterol from
bovine urine [12] and rat brain tissue [8]. The latter publication focusses on
the lipophilic characteristics of clenbuterol; the drug penetrates through the
blood-brain barrier in rats at pre- or post-natal development. For the more
hydrophilic compound, salbutamol, ethyl ether was the extraction medium
chosen [31]. In our laboratory, extraction of salbutamol with diethyl ether
was found not to be possible, due presumably, to its hydrophilic character.
For sample extracts which are determined by mass spectrometry, the
clean-up step must be particularly intensive. Blanchflower and co-workers
performed multiple diethyl ether extractions in combination with acid back
extractions to achieve a purified extract suitable for GC-MS analysis of
clenbuterol [32]. Girault et al. measured clenbuterol in a wide range of
bovine biological samples; pretreated samples were extracted at high pH using
ethyl acetate, back extracted into dilute acid, before washing (ethyl acetate:
hexane, 2:1) and final re-extraction into ethyl acetate [14, 33]. Forster et al.

used a similar procedure but with tertiary butyl methyl ether (TBME) as the
main extraction solvent [34]. Fuerst et al. improved sample clean-up by
washing plasma samples with dichloromethane prior to extraction of
clenbuterol with TBME [35]. Other authors have reported extraction
procedures for clenbuterol [4, 11] and the more hydrophilic compound,
fenoterol [18], based on the use of this solvent. For the latter extraction,
adjustment of pH to exactly 9.5 allowed for the isolation of fenoterol from its
conjugates.
In some cases, more than one organic solvent is required to extract the
compound effectively. Horiba et al. studied the occurrence of mabuterol and
its metabolites in urine samples [36]. Extraction, after sample evaporation and
salting out steps, was carried out at pH 10 using ethyl acetate: acetone (3:1).
Acidic and neutral metabolites were selectively removed after pH manipulation
and further solvent extraction. A specific double extraction procedure for
salbutamol in plasma samples was reported by Loo et al. [37]. Selective
extraction of salbutamol from its main sulphate metabolite was achieved using
methyl acetate. The solvent was evaporated, washed with a
tetrahydrofuran/TBME mixture and extracted into a basic solution for analysis.
Increased recoveries have been obtained by using a more polar extraction
solvent mixture. This is achieved by the addition of a small proportion (10-
30%) of a more polar solvent such as butanol. Recoveries of > 90% were
obtained for aniline-type /3-agonists using a 9:1 mixture of diethyl ether: 2-

butanol [6] or TBME: n-butanol [38]. For the extraction of a wider range of
/3-agonists, representing compounds from both groups, t-butanol: ethyl acetate
(3:7) was the chosen medium [27]. An alternative approach is the
combination of ion pair/liquid-liquid extraction methodology for compounds
which are charged in biological matrices. Di(2-ethylhexyl)phosphate (DEHP)
has been used as an ion-pair reagent for salbutamol extraction into chloroform
from plasma samples [39]. The compound was then back extracted into dilute
acid prior to HPLC analysis. This procedure was also adopted by Wu et al.,
but with the inclusion of an internal standard, metaproterenol [40]. Tan and
Soldin carried out preliminary C,g SPE clean-up prior to ion pair extraction
using both DEHP and 1-heptane sulphonic acid for salbutamol and an internal
standard, fenoterol [41]. The extraction solvent was ethyl acetate and a
salbutamol recovery of 80% was achieved. A more rapid alternative, also
based on DEHP/ ethyl acetate extraction was described by Miller and
Greenblatt [42]. The most recently-reported work in this area, by Sagar et al.,
described the use of the ion pair reagent, sodium dodecyl sulphate, in
combination with ethyl acetate for the extraction of salbutamol from human
plasma (recovery 90%) [43].

1.3.2 Solid phase extraction methodology
In recent years, solid phase extraction (SPE) and immunoaffinity
chromatography (IAC) have superceded traditional solvent extraction
procedures for the isolation of drugs from biological matrices. These types
of techniques, which perform sample clean-up and in some cases, analyte
preconcentration, are particularly advantageous as they can be easily
automated, require low solvent usage, and are generally less time consuming
and less labour intensive. From the point of view of /3-agonists, solid phase
extraction cartridges have a variety of special properties which allow better
extraction of the more hydrophilic compounds, such as salbutamol and
terbutaline. The two main SPE approaches reported for /3-agonists have been
either off-line extraction (adsorption, reversed phase, ion-exchange and mixed
phase) or on-line extraction (reversed phase and ion exchange).
1.3.2.1 Off-line extraction
1.3.2.1.1 On-column liquid-liquid partitioning
Adsorption columns, containing hydrophilic packing material
(diatomaceous earth) have been used to adsorb and distribute urine and tissue
supernatants over a large surface area, after which the /3-agonists of interest

may be eluted from the column with a water-immiscible solvent. The columns
have a large capacity and hence are suitable for large sample volumes (up to
20 ml). Before application, the samples are pH-adjusted to 10 or greater to
render the compound uncharged and allow ease of extraction into the organic
phase. An early use of this type of column was described by Eddins et al. for
application to clenbuterol in urine samples [44]. Alkalinised urine was applied
to a "Clinelut" column and allowed to equilibrate for 10 min before elution of
clenbuterol with three column volumes of hexane. This method was modified
slightly by Degroodt et al. to include animal tissues extracts [45]. Brambilla
et al. also adopted this approach for application to the aniline-type compounds
in urine [46] and vitreous humour [47]. In this case the extraction solvent was
dichloromethane. Other elution solvents used were t-butyl methyl ether for
clenbuterol [17] and a mixture of toluene: dichloromethane (3:1) for
clenbuterol and cimaterol [10]. This adsorption mechanism has not been
extended to include the phenolic 0-agonists as they are not eluted from the
column using non-polar or semi-polar solvents. Leyssens et al. used an
alumina neutral SPE column for improved clean-up of liver homogenates: the
aniline 0-agonists were easily extracted (e.g. mabuterol recovery 85%) but for
the phenolic compounds (e.g. salbutamol and terbutaline) the recovery was
poor (< 40%) [27].
- 16-

1.3.2.1.2 Reversed-Phase SPE
0-agonists are particularly suited to reversed-phase SPE due, in part,
to their relatively non-polar aliphatic moiety which can interact on
hydrophobic (octadecyl (C18) and decyl (C8)) stationary phases. Optimum
retention is achieved by adjusting the sample pH to > 10, as for liquid
extraction. Much of the scientific literature deals specifically with C18 SPE,
with authors adopting very similar approaches for sample application, washing
and elution procedures. In most cases methanol or a solvent of similar
polarity was used to activate the column packing material prior to equilibrating
with water or an alkaline buffer. After sample application, water or
water/methanol (usually with a high water content) washed off matrix
interferences before elution of the 0-agonist(s) with methanol. The literature
is replete with examples of Clg SPE used in this way to extract clenbuterol
[48, 49], salbutamol [24, 50], terbutaline [51], fenoterol [52], cimaterol [9]
and bambuterol [53].
1.3.2.1.3 Ion-exchange SPE
Drug retention through ion-exchange mechanisms has been reported for
the more polar, ionisable 0-agonists like salbutamol and terbutaline. These
compounds have been retained on either XAD-2 cation exchange columns or

unmodified silica columns. For the former type of column, procedures for the
extraction of salbutamol [54] or salbutamol conjugates [21] have been
described. Salbutamol is charged over the entire pH range allowing a
retention mechanism with the negatively-charged resin. The drug was
removed from the column with methanol. Terbutaline was separated from
plasma on a AGX-2 resin, eluted in alkaline buffer and re-extracted into
butanol [55]. Unmodified silica, also acts as an ion-exchanger with basic
analytes. Retention occurs at pH values between 5.5 and 8.0, where the
surface hydroxyl groups on the silica become increasingly ionised and attract
the positively-charged amine on the 0-agonist molecule. SPE procedures,
based on silica retention, have been decribed for application to salbutamol [56]
and salbutamol and terbutaline [57] in plasma samples.
1.3.2.1.4 Mixed phase interactions
The SPE columns already described are suitable for individual 0-
agonists or groups of 0-agonists possessing similar chemical properties.
However, difficulties can arise when a multicomponent extraction procedure
is required. Optimisation of the residue extraction procedure for clenbuterol-
like compounds can result in a reduced recovery for salbutamol-like substances
[13]. To improve retention of the more polar compounds, some authors have
tried "mixed phase" columns which have both lipophilic and ion-exchange
properties, depending on the pH and the elution solvent. In practice, the
- 18-

sample is added to the column at a neutral pH and the drug is retained by
hydrophobic interaction. Then the column is acidified to protonate the drug
and promote its ion-exchange retention on the S 0 3" group on the resin.
Methanol serves as a broad spectrum wash solvent and the compounds of
interest are eluted in methanol containing a small percentage of concentrated
ammonia.
Dumasia et al. developed a mixed phase SPE procedure for selected /3-
agonists from horse urine [19]. In this case 1.0 M acetic acid was used to
promote ion-exchange conditions, and ethyl acetate containing 2% ammonium
hydroxide was the elution solvent. Gabiola adopted a similar procedure to
extract salbutamol, terbutaline and clenbuterol, including conjugates, from
bovine urine [58]. Leyssens et al. extended the procedure to cover seven /3-
agonists, containing compounds from both major classes [27]. The only
difference was the elution solvent, i.e. dichloromethane: isopropanol (8: 2)
containing 2% ammonia. Recoveries from urine were adequate (e.g.
clenbuterol 51%, mabuterol 82%) but liver samples required two additional
clean-up steps (liquid extraction and alumina SPE), resulting in a procedure
only suitable for the clenbuterol-type compounds. Montrade et al. improved
the recovery of the salbutamol-like compounds after optimisation of the
percentage ammonia in the elution solvent. A 3 % (v/v) concentration in ethyl
acetate resulted in good recovery of thirteen /3-agonists in urine samples [13].

1.3.2.2 On-line solid phase extraction
On-line SPE is a clean-up technique which is used in conjunction with
chromatographic procedures, principally HPLC. The analyte is retained on
a preconcentration column positioned between the injector and the analytical
column and, after a washing step, desorbed and re-routed to the analytical
column for separation and detection.
On-line methods have been reported for /3-agonist extraction based on
either reversed-phase or ion-exchange principles. With respect to the former
category, Sagar et al. described an on-line reversed-phase preconcentration
procedure for terbutaline [59] and terbutaline and salbutamol [60] from plasma
samples. Plasma was injected directly onto a small Clg column (10 cm x 1.5
mm) and, after washing with water, the /3-agonists were back-flushed with
mobile phase to the analytical column. Similar procedures for terbutaline
retention were described by Edholm et al. [61] and Berquist and Edholm [62].
Tamisier-Karolak et al. used a combination of off-line and on-line reversed-
phase SPE to produce highly purified extracts, containing both salbutamol and
fenoterol, for HPLC analysis [63]. On-line ion-exchange SPE was described
by Oosterhuis and van Boxtel [64]; salbutamol and bemathan were retained
on a cation exchange (Partisil SCX) column followed by desorption and
subsequent separation on a reversed phase column.

1.3.3 Immunoaffinity chromatography (IAC)
I AC is a SPE-type technique which relies on antigen: antibody
interactions to preconcentrate the analyte(s) of interest. The technique has only
recently been applied to the extraction of 0-agonists, but already it has found
widescale acceptance due to its high specificity and sample clean-up efficiency.
A review by van Ginkel covers many of the characteristics of the IAC
procedure [65]. To produce antibodies suitable for IAC columns, an animal
(e.g. rabbit) is immunised with the test analyte conjugated to a protein (e.g.
human serum albumin). Serum is harvested from the treated animals and
immunoglobulins with specific cross-reactivity to the analyte (and similar
compounds) is purified by ammonium sulphate precipitation. The purified
immunoglobulin is bound to a sepharose gel and incorporated into a column.
IAC may be applied either off-line as an extraction procedure or on-line as an
extraction/preconcentration procedure.
The first selective on-line extraction/concentration procedure for a 0-
agonist (clenbuterol) based on IAC was carried out by Haasnoot et al. [66,
67]. Urine or tissue supernatants were applied to the column by valve
switching and, after washing with water, clenbuterol was desorbed and flushed
to a C18 analytical column with 0.01 M acetic acid. This system, could not
be developed for multicomponent analysis because of the low cross-reactivity
shown by the antibody to other 0-agonists. Schilt et al. overcame this

problem by off-line concentration of the eluate from the the IAC column and
used GC-MS to detect the low cross-reacting compounds in the low ppb range
[68]. Other IAC methods performing in a similar way have been described
for salbutamol extraction from urine [69] and tissue [28].
van Ginkel et al. [25] explored the possibility of a less specific antibody
which could be directed against a broader range of 0-agonists. A mixture of
antibodies, cross-reacting with both the N-t-butyl and the N-iso-propyl groups
of 0-agonists, was produced. This resulted in a more robust multi-0-agonist
extraction/preconcentration procedure, and, coupled with GC-MS
determination, gave good recovery of four compounds. With further advances
in clean-up capability expected, it is likely that IAC procedures in conjunction
with HPLC and MS, will soon become the standard analytical technique for
0-agonist analysis.
1.4 SEPARATION OF 0-AGONISTS
After the extraction/clean-up step, chromatographic separation is usually
required for selective detection of 0-agonist(s). Reversed-phase HPLC has
been the most popular separation technique for 0-agonists, due to the
hydrophobic interaction of the molecules with C18 or C8 stationary phases.
Separation methods based on these principles has been reported for clenbuterol
[8], salbutamol [42] and a mixture of 0-agonists [9]. For compounds which

are charged (salbutamol, terbutaline), ion-pair chromatography has been used.
Typical ion-pair reagents are heptane sulphonic acid [41] and sodium dodecyl
sulphate [10]. Alternatively, charged compounds can interact on a cation
exchange column [57, 64]. Because the /3-agonist molecule contains a chiral
centre, enantiomers have been separated by chiral HPLC [70, 71]. In this
case the stationary phase is made up of /3-cyclodextrins or glycoproteins bound
to silica. Normal phase HPLC has been less popular. One reported normal
phase method for the separation of salbutamol involved a silica column and a
mobile phase of 0.25% acetate buffer in methanol [56].
Separation of /3-agonists by gas chromatography (GC) is not ideal as
these relatively polar compounds must first be derivatized. However, the
main advantage of using GC for separation purposes is the choice of very
sensitive detectors, including mass spectrometers. The separation may be
carried out using the classical packed column [72] or, for improved efficiency
and better applicability to multiresidue analysis, use of a capillary column is
the preferred option [19, 27, 58].
High performance thin layer chromatography (HPTLC) may be used,
but generally this technique has been applied only as a qualitative technique.
Extracts are spotted onto silica plates and compounds of interest are separated
as bands by the mobile phase. Henion et al. reported the separation of
clenbuterol from its urine matrix on a HPTLC plate [73]. The compound was
converted to an azo dye for visual confirmation prior to removal of the

developed spot for tandem mass spectrometric analysis. Similar procedures
were carried out for other aniline-type /3-agonists in a variety of matrices [10,
30, 46]. Methods have been reported for the separation of salbutamol
followed by conversion to its indoaniline dye and detection by absorption
microdensitometry [24, 54],
Capillary zone electrophoresis (CZE) and related methods have also
appeared in the literature, but only for measurement of relatively high
concentrations of /3-agonists [74-76], Whether or not they can be applied to
biological sample extracts at the ppb level remains to be seen.
1.5 DETECTION OF /3-AGONISTS
After a suitable extraction/clean-up procedure has been carried out, the
/3-agonists may be detected by spectrometric, electrochemical, immunological
or mass spectrometric techniques, the choice of which depends on the required
sensitivity. Published methods for /3-agonists in biological samples have
focussed on either measurement of drug levels after therapeutic dosing or after
illegal (growth enhancing) use. In general, the HPLC-based detector options
have been suitable for measuring /3-agonists in the range 1 to 15 ng/ml, the
plasma concentrations which occur following therapeutic doses [56]. Residue
testing, however, requires detection systems which can detect /3-agonists at sub
ng/g level (0.5 ng/g is the maximum residue limit (MRL) set in the UK for

clenbuterol in edible tissues) [77]. For this purpose the more sensitive
immunoassay or mass spectrometric methods are used and, in the case of the
latter technique, additional information concerning the structure of the /13-
agonist molecule(s) may be obtained which allows for confirmation of the
presence of specific residues.
1.5.1 Spectrometric Detection
Measurement of /3-agonists by HPLC with UV spectrometric detection
has resulted in low detection limits due to the presence of strong
chromophores. Methods have been reported for clenbuterol at wavelengths
between 222-245 nm [8, 44, 66], and a mixture of 0-agonists (clenbuterol,
cimaterol, salbutamol) at a compromise wavelength of 260 nm [9]. In the
case of the method reported by Botterblom et al. [8], the method was limited
by the detector sensitivity (limit of detection 33 ng/ml), a problem which may
be overcome by using a post-column derivatization procedure. In this
procedure, reagents (consisting of sodium nitrite and nitric acid to cause
diazotization, ammonium amidosulphonate to remove excess nitric acid and N-
(l-naphtyl)ethylenediamine which binds to the diazonium salt to form a light-
absorbing product) are introduced into the mobile phase, post-column, to
derivatise the 0-agonists into diazo dyes. The absorbance for the products
(derivatized clenbuterol; Xmax = 493 nm and derivatized cimaterol \ max =

537 nm) was higher and resulted in limits of detection for the compounds in
liquid and solid samples of 0.1 ng/1 and 0.2 ng/g, respectively [10, 78]. A
combination of UV and electrochemical detection has recently been shown to
result in unequivocal confirmation of residue-positive samples [17].
An alternative detector option, fluoresence detection, confers the
additional advantage of selectivity to the detection of /3-agonists. This type of
detection is particularly suitable for the resorcinol and catechol /3-agonists due
to the intrinsic fluoresence of the aromatic phenolic structure. Many methods
have been reported for salbutamol detection, with typical excitation and
emission wavelengths at 225 nm and 310 nm, respectively [7, 39, 42]. These
wavelengths are suitable for the detection of other related compounds like
metaproterenol [20, 40] and terbutaline [20]. The sensitivity of the detection
may vary, but detection limits of 1 ppb and lower have been reported [39,
56].
Quantification of analyte bands for HPTLC-based methods is
accomplished by visual observation or densitometric measurements. For the
latter detection mode, light of suitable wavelength is directed onto the TLC
plates and the amount of light transmitted or reflected by the band is
measured. Clenbuterol may be detected as a coloured band after reaction with
Ehrlichs reagent [45]. Salbutamol was converted to its indoaniline derivative
and quantified by absorption microdensitometry at 650 nm [24, 54].

1.5.2 Electrochemical Detection
Electrochemical detection is suited to /3-agonists due to the presence of
the oxidisable amino/hydroxyl groups on the aromatic part of the molecule and
the amino group on the aliphatic moiety. Interesting and informative
electrochemical studies have been carried out which demonstrate the behaviour
of salbutamol [80] and clenbuterol and mabuterol [6] at a glassy carbon
electrode (GCE). The studies show that 0-agonists, as a class, are oxidised
irreversibly at carbon electrodes at high positive potentials.
The bulk of the literature reports HPLC linked with electrochemical
detector methods for detection of therapeutic levels of 0-agonists in urine and
plasma. Hauck and Brugger described the detection of clenbuterol (at + 1 .2
V vs Ag/AgCl reference) above 10 ng/ml using a GCE [48], A more
sensitive electrochemical detection method, also employing a GCE (set at
+ 1.15 V vs the reference electrode), reported clenbuterol determination as
low as 1 ng/ml [29]. Qureshi and Eriksson developed a method based on
either GCE or carbon paste electrode (CPE) detection of aniline type
compounds at +0.75 V [6]. Limits of detection of 0.5 ng/ml (clenbuterol)
and 2.0 ng/ml (mabuterol) were achieved and an electrode pretreatment step
(oxidation of electrode at high positive potentials) was described. A GCE
detector was used to measure salbutamol and fenoterol [41] and salbutamol
enantiomers [70]. Other forms of the carbon electrode used in this field were
the carbon paste rotating electrode for salbutamol [64] and the vitreous carbon
electrode for terbutaline [81]. Sagar et al. developed methods based on
detection of the phenolic /3-agonists (salbutamol, terbutaline) using a micro
carbon fibre electrode [43, 59-60]. Advantages of this type of approach
include low charging current and increased mass transport. The electrode
potential used was + 1.3 V and electrode pretreatment procedures were
described. A novel two-GCE detector approach for salbutamol and fenoterol
was reported by Tamisier-Karolak et al. [63]. The operating potentials of the
two electrodes were set at +0 .5 V (the potential where no oxidation occurred)
and + 0 .9 V (optimum oxidation) and the difference in signals was recorded.
A limit of detection of 0.5 ng/ml was reported.
1.5.3 Immunoassay Procedures
Immunoassays, including radioimmunoassay (RIA) and enzyme
immunoassay (EIA), are highly favoured procedures due to their low detection
capability, allowing the measurement of residues at 0.5 ng/g and lower. The
EIA option has proved more popular in recent years but both techniques can
handle large sample numbers and may require less sample clean-up than for
other techniques. The procedures leading to the production of antibodies
(described in section 1.3.3), are relevant also for immunoassay techniques.
Commercial kits for both techniques are available for single or multianalyte
determination.
1.5.3.1 Radioimmunoassay
The first RIA procedure for a /3-agonist compound was reported by
Kopitar and Zimmer for the pharmacological studies on clenbuterol in animal
tissue [82]. Delahaut et al. described the development of a more specific RIA
method for the determination of clenbuterol after its administration to animals
as a growth enhancing agent [11]. The antiserum had 100% cross-reactivity
to clenbuterol and lower cross-reactivity to other /3-agonists (< 10%), and
was applicable to extracts from plasma, urine and faeces containing less than
0.5 ng/g (ml) level. A kit has been produced for measurement of salbutamol
using an anti-salbutamol antiserum [69]. A method by Loo et al. [37]
described the use of a specific RIA for the detection of free forms of
salbutamol after the conjugates were removed from plasma by liquid-liquid
extraction. Adam et al. reported an interesting RIA procedure for the
determination of salbutamol using a monoclonal antibody [83]. The antibody
was synthesized in mice against the 0-(3-carboxypropionyl) derivative of
salbutamol linked to bovine serum albumin. Moreover, the antibody showed
a high cross-reactivity (75%) to clenbuterol. Rominger et al. developed a
specific RIA procedure for fenoterol which consisted of an antibody cross

reacting with the different sterioisomers of fenoterol and radiolabelled [125I]-
fenoterol [18]. The procedure measured fenoterol at the low pg/ml level in
biological fluid extracts.
Radioreceptor assays have been developed which are similar to RIA but
which use the binding of /3-agonists by receptors, instead of antibodies, as the
analytical principle [12]. The method was based on competition between a
radioactive tracer (3H-dihydroalprenolol) and aniline-type /3-agonists for
binding to receptors (plasma membranes). Although the limit of detection
reported, 2.4 ppb, was relatively high, this approach merits further
investigation.
1.5.3.2 Enzyme-immunoassay
EIA has progressed in the last decade as a sensitive and reliable
determination procedure in residue analysis. The first EIA for clenbuterol was
developed by Yamamoto and co-workers [84], a selective double antibody and
heterogenous immunoassay based on competition for binding between
clenbuterol and its /3-D-galactosidase-labelled analogue to a clenbuterol
specific antibody, followed by selective binding of the antibody-bound enzyme
hapten with a second, immobilised antibody. The activity of the enzyme was
determined fluorometrically after addition of substrate. Many of the principles
developed in this procedure have been incorporated into EIA procedures

presently being used. The EIA procedure developed by Degand et al. was
based on the competition between clenbuterol and diazo-clenbuterol-
horseradish peroxidase (HPO) for the antiserum [22]. The procedure had the
capability of determining clenbuterol at levels below 0.5 ppb. An EIA
procedure, containing an antiserum specific for clenbuterol and also utilising
a HPO-based enzyme conjugate, was developed to monitor urine and tissues
from clenbuterol-medicated farm animals [85]. The antiserum had cross
reactivities to salbutamol and cimaterol of 26.3% and 1.3%, respectively.
EIA kits containing a salbutamol-based enzyme conjugates, either salbutamol-
4-carboxymethylether-HPO [4] or salbutamol hemisuccinate-HPO [86-88] were
used to determine clenbuterol in urine and tissue extracts. Angeletti et al. [89]
and Paleologo-Oriundi [90] reported EIA assays which could determine four
/3-agonists (clenbuterol, mabuterol, salbutamol and terbutaline) in biological
samples (urine, serum), using anti-0-agonist and anti-clenbuterol antisera,
respectively. The latter assay was advantageous as no sample clean-up step
was required.
An EIA kit with a hydroxyclenbuterol-alkaline phosphatase enzyme
conjugate and an anti-clenbuterol antiserum (produced as described by
Yamamoto and Iwata [84]) was used to measure clenbuterol [91] and
salbutamol [26] in urine and tissues, respectively. An EIA procedure which
contained an anti-salbutamol antiserum was developed and described by
Degand et al. [92]. The antiserum showed principal cross-reactivities relative

to salbutamol (100%) of 115% (clenbuterol), 65% (mabuterol), 31%
(terbutaline) and 13 % (cimaterol), and the procedure required mimimal sample
clean-up step and could be used to determine conjugated residues qualitatively
without a prior hydrolysis step. A novel and rapid approach, developed by
Ploum et al. [93], was the use of test-strip enzyme immunoassays for the
direct detection of clenbuterol in urine. The antiserum was prepared as
described previously by Yamamoto and Iwata [84] and the clenbuterol
conjugate was clenbuterol horseradish peroxidase. Indication of clenbuterol
presence, down to 5 ng/ml, was achieved visually, by the appearance of a blue
colour on the strip.
1.5 .4 Mass Spectrometric Detection
Mass spectrometric (MS) detection, above all other techniques, provides
unequivocal identification of drugs and metabolites. With respect to (3-
agonists, the EC has stated that for confirmatory analysis of veterinary drug
residues, identification of the analyte must be based on at least four
characteristic fragment ions. To satisfy this criterion it may be necessary to
combine the data from two MS ionisation techniques, for example electron
impact (El) and chemical ionisation (Cl) mass spectrometry. In the El mode,
the (derivatised) /3-agonist molecule is volatilised and bombarded by energetic
electrons, to produce a protonated molecular ion (M+). In the Cl mode, a

reactant gas (e.g. ammonia) is bombarded with electrons to become ionised
and collides with the /3-agonist molecule thereby ionising it. The spectrum is
then scanned for molecular ion and fragment ions, after which the MS may be
set to monitor the most abundant ions (selected ion monitoring; SIM). The
peak area measured is proportional to the concentration of analyte.
A prerequisite of 0-agonist analysis by GC-MS is the derivatisation of
the polar groups (hydroxyls, amino) on the molecule. The silyl derivatives are
most commonly used; a typical silylation procedure was described by Fuerst
et al. [35] whereby sample extracts containing clenbuterol were treated with
hexamethyldisilazane (HMDS) in acetonitrile at 30°C. Garcia-Regueiro et al
extracted salbutamol, using the method of Fuerst et al. [35], and clenbuterol
from urine by adsorption SPE to produce extracts for GC-MS. The compounds
were derivatised with bis(trimethylsilyl)trifluoracetamide and separated on a
capillary column (100 jum). Detection limits of 1.5 ng/ml in urine were
reported [94]. Girault and Fourtillan found that trimethylsilyl (TMS)
derivatives were problematic; the derivatisation step resulted in low sensitivity
and poor reproducibility and the O-TMS derivative was prone to hydrolysis.
They proposed the use of a dipentafluoropropionyl derivative [14]. The
clenbuterol perfluoracyl derivative was scanned in the Cl mode and the ion at
m/z 368 was monitored resulting in detection limits as low as 10 pg/g in tissue
samples. Several authors have reported the use of two derivatives and two
detection modes for a more reliable confirmation. Montrade and co-workers

described a procedure applicable to thirteen /3-agonists in urine samples [13].
The extracted analytes were derivatised to either their TMS or cyclic-2-
dimethylsilamorpholine (DMS) derivative, van Rhijn et al. carried out similar
studies on clenbuterol [95]. This paper described the application of TMS and
DMS derivatives for the identification of clenbuterol from urine extracts. The
derivatives were ionised in both El and Cl modes, and the combination gave
high-intensity diagnostic ions; m/z 86 for both derivatives in the El mode and
m/z 349 and 351 (TMS derivative) and 391 and 393 (DMS derivative) in the
Cl mode. Dumasia et al. [19] carried out a multicomponent analysis
procedure based also on the use of the TMS and DMS derivatives of ¡3-
agonists using the El mode. The spectra of the TMS derivative showed a base
peak at m/z 86 (tertiary butyl amino compounds) or 72 (isopropylamine
compounds). For the cyclic DMS derivatives, the molecular ion peak was
dominant at m/z 346, as well as two fragment ions at (M-15)+ and (M-43 or
57)+ for the loss of the isopropyl or t-butyl groups, respectively. Boronic acid
derivatives have also been used to improve the abundance of high mass ions.
Blanchflower et al. scanned a methylboronic acid derivative of clenbuterol in
the El mode [32]. The resulting spectra showed three prominant peaks (m/z
243, 285 and 300), and using SIM, levels of clenbuterol in urine extracts was
determined. In the procedure of Polettini et al. [38], a comparative study of
different derivatising reagents for clenbuterol was carried out. The TMS
derivative showed a major response at m/z = 86, but limited abundance for

all other ions. The trifluoroacetic anhydride (TFAA) derivative led to the
formation of three or more different products, resulting in spectra difficult to
interpret. The boronic acid derivatives (phenylboronic acid and 1-
butaneboronic acid) showed the most abundant ions in the high mass range (at
m/z 243, 327, 342 and at 243, 347, 362, respectively). The 1-butaneboronic
acid derivative was chosen as optimum for the further development of a GC-
MS method for clenbuterol (limit of detection, 0.5 ppb).
For additional information and improved confirmation of /3-agonists by
scanning daughter ions, GC-tandem MS (GC-MS-MS) has been used [27, 73].
A recent development to provide complementary results from GC-MS analysis
is cryotrapping GC-fourier transform-infra-red spectrometry [96]. Sample
extracts are derivatised as for GC-MS and the spectra obtained are compared
to standards for positive identification.
Coupling of liquid chromatography with mass spectrometry (LC-MS or
LC-MS-MS) has been more difficult due to the need to remove the liquid
mobile phase prior to entering the MS. However, the advantage of this type
of determination is that its more suited to polar compounds and hence
derivatisation procedures are not necessary. Thermospray LC-MS was
described by Blanchflower and Kennedy [97] for the identification of
clenbuterol; the m/z 277 fragment ion was monitored (by SIM) in urine
extracts. Thermospray LC-MS was also suitable for measuring the sulphate
ester of salbutamol which shows a prominant peak at the m/z 318 ion [21].

Thermospray LC-MS-MS was used to monitor seven 0-agonists [98]; the
compounds all exhibited the loss of 74 mass units from the molecular ion or
from prominant fragment ions, thought to be due to the loss o f water and
methylpropene. A recent development, electrospray ionisation MS, has been
used to monitor various 0-agonists in aqueous-based standards [15] and for
clenbuterol in urine extracts [99].

1.6 CONCLUSIONS
0-agonists are relatively polar compounds which can be extracted from
biological matrices using the more conventional solvent extraction procedures
or by some form of column chromatography (SPE, IAC). Liver or eye are
the preferred sample types to monitor illegal usage, but for monitoring levels
following therapeutic use plasma or urine may be analysed. For tissue
samples procedures are required to homogenise the sample, followed by
digestion and extraction of the compound(s).
As clenbuterol has been the most effective repartitioning agent, the bulk
of the literature has reported determination procedures for its analysis in
various biological samples. However, with the introduction as growth
enhancing agents of other compounds in this class, such as salbutamol and
cimaterol, and the possibility of new chemically-designed 0-agonists, multi
residue methods are now required. The most effective means of extracting 0-
agonists of both groups (i.e. aniline-type and the more hydrophilic phenolic-
type) is achieved through the use of IAC or "mixed phase" SPE cartridges.
The main criterion for the selection of a detection system for illegal 0-agonist
use is sensitivity. The two most used techniques have been immunoassay and
GC-MS. The main advantages of the former technique have been high
sensitivity and specificity for the test analyte. The vast majority of the
published immunoassay procedures detect the analytes below 1 ppb.

Procedures based on GC-MS detection reach the sensitivity of immunoassay
but usually require larger sample sizes (e.g. 5-10 g liver). This technique can
provide unequivocal confirmation of the jQ-agonist(s). The procedure adopted
by Montrade et al. [13], for instance, satisfies the EC criteria and allows for
identification of thirteen /3-agonists in urine extracts at the low ppb level. LC-
MS has great potential to become a confirmation technique in the field of /3-
agonists due to its applicability to polar analytes. However, as yet, it has not
challenged GC-MS in terms of sensitivity.
The most active phase of /3-agonist research for human therapeutic use
seems to be past, as selective and effective compounds are now readily
available for asthma or other bronchial diseases. /3-agonists are still being
administered illicitly as feed additives in animal production and hence
development of analytical procedures for their detection must continue. The
reported cases of intoxication in humans following consumption of clenbuterol-
incurred liver serves as a strong reminder of such abuse [100, 101]. The
development of suitable methodology with the required sensitivity and
specificity will help to ensure the safety of edible tissues and protect the health
of the consumer.

1.7 REFERENCES
1. P.J. Buttery and J.M. Dawson, in J.P. Hanrahan (ed.), Beta-agonists
and Their Effects on Animal Growth and Carcass Quality, Elsevier,
London, 1987, p.20.
2. R.F. Witkamp and A.S.J.P.A.M. van Miert, in Proceedings of the
FLAIR Workshop, Thessaloniki, Greece, (eds: H.A. Kuiper and
L.A.P. Hoogenboom), Oct 30-31, 1992, p .75.
3. H.H.D. Meyer and L. Rinke, in Proceedings of the 51st Easter School
in Agricultural Science: The Control of Fat and Lean Deposition,
University of Nottingham, Sutton Bomington, April 1991, p .61.
4. H.H.D. Meyer and L.M. Rinke, J. Anim. Sei., 69, 1991, 4538.
5. I. Dursch, H.H.D. Meyer and S. Jager, Anal. Chim. Acta, 275, 1993,
189.
6. G. Ali Qureshi and A. Eriksson, J. Chromatogr., 441, 1988, 197.
7. N. Kurosawa, S. Morishima, E. Owada and K. Ito, J. Chromatogr.
(Biomed. Applic.), 305, 1984, 485.
8. M.H.A. Botterblom, M.G.P. Feenstra and E.B.H.W. Erdtsieck-Ernste,
J. Chromatogr. (Biomed Applic.), 613, 1993, 121.
9. H.H.D. Meyer, L. Rinke and I. Dursch, J. Chromatogr. (Biomed.
Applic.), 564, 1991, 551.
10 D. Courtheyn, C. Desaever and R. Verhe, J. Chromatogr. (Biomed.
Applic.), 564, 1991, 537.
11. Ph. Delahaut, M. Dubois, I. Pri-bar, O. Buchman, G. Degand and F.
Ectors, Food Addit. Contam., 8, 1991, 43.
12. V. Helbo, M. Vandenbroeck and G. Maghuin-Rogister, in Proceedings
EuroResidue 2 Conference, Veldhoven, The Netherlands, May 3-5,
1993, 362.
13. M.-P Montrade, B. Le Bizec, F. Monteau, B. Siliart and F. Andre,
Anal. Chim. Acta, 275, 1993, 253.
14. J. Girault and J.B. Fourtillan, J. Chromatogr., 518, 1990, 41.
15. L. Debrauwer and G. Bories, Rapid Comm. Mass Spectrom., 6, 1992,
382.
16. R.J.H. Pickett and M J. Sauer, Anal. Chim. Acta, 275, 1993, 269.
17. H. Hooijerink, R. Schilt, W. Haasnoot and D. Courtheijn, J. Pharm.
Biomed. Anal., 9, 1991, 485.
18. K.L. Rominger, A. Mentrup and M. Stiasni, Arzneim.-Forsch/Drug
Res., 40, 1990, 887.
19. M.C. Dumasia and E. Houghton, J. Chromatogr. (Biomed. Applic.),
564, 1991, 503.
20. K. Selinger, H.M. Hill, D. Matheou and L. Dehelean, J. Chromatogr.
(Biomed. Applic.), 493, 1989, 230.
- 40 -
21. G.D. Bowers, D.M. Higton, G.R. Manchee, J. Oxford and D.A.
Saynor, J. Chromatogr., 554, 1991, 175.
22. G. Degand, A. Bernes-Duyckaerts and G. Maghuin-Rogister, J. Agric.
Food Chem., 40, 1992, 70.
23. M.-P. Montrade, S. Riverain, B. Le Bizec and F. Andre, in
Proceedings of the FLAIR Workshop, Thessaloniki, Greece (eds; H.A.
Kuiper and L.A.P. Hoogenboom), Oct 30-31, 1992, p.143
24. J. De Groof, J.-M. Degroodt, B. W. de Bukanski and H. Beernaert, Z.
Lebensm. Forsch., 193, 1991, 126.
25. L.A. van Ginkel, R.W. Stephany and H.J. Van Rossum, J. Assoc. Off.
Anal. Chem., 75, 1992, 554,
26. L. Howells, M. Sauer, R. Sayer and D. Clark, Anal Chim. Acta, 275,
1993, 275.
27. L. Leyssens, C. Driessen, A. Jacobs, J. Czech and J. Raus, J.
Chromatogr. (Biomed.Applic.), 564, 1991, 515.
28. F. Ramos, M.C. Castilho, M.I.N. da Silveira, J.A.M. Prates and
J.A.R. Dias Correia, Anal. Chim. Acta, 275, 1993, 279.
29. B. Diquet, L. Doare and P. Simon, J. Chromatogr., 336, 1984, 415.
30. H. Brunn, Fleischwirtsch., 68, 1988, 1476.
31. M. Weisberger, J.E. Patrick and M.L. Powell, Biomed. Mass
Spectrom., 10, 1983, 556.
- 41 -

32. W J . Blanchflower, S.A. Hewitt, A.Cannavan, C.T. Elliot and D. G.
Kennedy, Biol. Mass Spectrom., 22, 1993, 326.
33. J. Girault, J. Gobin and J.B. Fourtillan, Biomed. Environ. Mass
Spectrom., 19, 1990, 80.
34. H.J. Forster, K.L. Rominger, E. Ecker, H. Peil and A. Wittrock,
Biomed. Environ. Mass Spectrom., 17, 1988, 417.
35. P. Fuerst, C. Fuerst and W. Groebel, Dtsch. Lebensm. Rundsch, 85,
1989, 35.
36. M. Horiba, T. Murai, K. Nomura, T. Yuge, K. Sanai and E. Osada,
Arzneim.-Forsch/Drug Res., 34, 1984, 1668.
37. J.C.K. Loo, N. Beaulieu, N. Jordan, R. Brien and I.J. Mc Gilveray,
Res. Comm. Chem. Path. Pharm., 55, 1987, 283.
38. A. Polettini, M.C. Ricossa, A. Groppi and M. Montagna, J.
Chromatogr. ßiom ed. Applic.), 564, 1991, 529.
39. M.J. Hutchings, J.D. Pauli and D.J. Morgan, J. Chromatogr. (Biomed.
Applic.), 277, 1983, 423.
40. Y.Q. Wu, R. Shi, R.L. Williams and E.T. Lin, J. Liq. Chromatogr.,
14, 1991, 253.
41. Y.K. Tan and S.J. Soldin, J. Chromatogr. (Biomed. Applic.), 311,
1984 , 311 .
- 42 -

42. L.G. Miller and D.J. Greenblatt, J. Chromatogr. , 381, 1986, 205.
43. K.A. Sagar, C. Hua, M.T. Kelly and M.R. Smyth, Electroanalysis. ,
4, 1992, 481.
44. C. Eddins, J. Hamann and K. Johnson, J. Chromatogr. Sei., 23, 1985,
308.
45. J.-M. Degroodt, B.W. de Bukanski, H. Beernaert and D. Courtheyn,
Z. Lebensm. Unters. Forsch., 189, 1989, 128.
46. G.F. Brambilla, S. Castelli, A. Riberzani, M. Montana and F. Manca,
Indust. Aliment., 29, 1990, 674.
47. G.F. Brambilla, U. Agrimi and E. Pierdominici, Ital. J. Food Sei., 3,
1991, 303.
48. M. Hauck and E. Brugger, Deutsche Lebensm.-Rundschau., 85, 1989,
178.
49. C. Presa, M. Ramos and T. Reuvers, Alimentaria, 27, 1990, 85.
50. T. Emm, L.J. Lesco, J. Leslie and M.B. Perkal, J. Chromatogr.
(Biomed. Applic.), 427, 1988, 188.
51. H J. Leis, H. Gleispach, V. Nitsche and E. Malle, Biomed. Environ.
Mass Spectrom., 19, 1990, 382.
52. J.G. Leferink, J. Dankers and R.A.A. Maes, J. Chromatogr. Biomed.
Applic.), 229, 1982, 217.
53. C. Lindberg, S. Jonsson, J. Paulson, and A. Tunek, Biomed. Environ.
Mass Spectrom., 19, 1990, 218.
- 43 -

54. P.V. Colthup, F.A.A. Dallas, D.A. Saynor, P.F. Carey, L.F.
Skidmore and L.E. Martin, J. Chromatogr. , 345, 1985, 111.
55. S.E. Jacobsson, S. Jonsson, C. Lindberg and L.A. Svensson, Biomed.
Mass Spectrom., 7, 1980, 265.
56. R.E. Bland, R.J.N. Tanner, W.H. Chern, J.R. Lang and J.R. Powell,
J. Pharm. Biomed. Anal., 8, 1990, 591.
57. P.T. M° Carthy, S. Atwal, A.P. Sykes, J.G. Ayres, Biomed
Chromatogr., 7, 1993, 25.
58. C. Gabiola, in Proceedings of EuroResidue 2 Conference, Veldhoven,
The Netherlands, May 3-5, 1993, 289.
59. K. Sagar, M.T. Kelly and M.R. Smyth, J. Chromatogr. (Biomed
Applic.), 115, 1992, 109.
60. K. Sagar, M.T. Kelly and M.R. Smyth, Biomed. Chromatogr., 7,
1993, 29.
61. L.E. Edholin, B.M. Kennedy and S. Berquist, Chromatographia, 16,
1982, 341.
62. S. Berquist and L.E. Edholm, J. Liq. Chromatogr., 6, 1983, 559.
63. T. Tamisier-Karolak, B. Delhotal-Landes, P. Jolliet-Riant, J. Milliez,
D. Jannet, J. Barre and B. Flouvat, Thera. Drug Monit., 14, 1992,
243.
64. B. Oosterhuis and C.J. Van Boxtel, / . Chromatogr. (Biomed. Applic.),
232, 1982, 327.
- 44 -

65. L.A. van Ginkel, J. Chromatogr (Biomed. Applic.), 564, 1991, 363.
66. W. Haasnoot, M.E. Ploum, R.J. A. Paulussen, R. Schilt and F.A. Huf,
J. Chromatogr., 519, 1990, 323.
67. W. Haasnoot, A.R.M. Hamers, R. Schilt and C.A. Kan, in M.R.A.
Morgan, C.J. Smith and P.A. Williams (eds.), Food Safety and Quality
Assurance-Applications o f Immunoassay Systems, Elsevier, London,
1992, 185.
68. R. Schilt, W. Haasnoot, M.A. Jonker, H. Hooijerink and R.J.A.
Paulussen, in N. Haagsma, A. Ruiter and P.B. Czedik-Eysenberg
(eds.), Proceedings of the EuroResidue Conference, Noordwijkerhout,
The Netherlands, May 21-23, 1990, 320.
69. Ph. Delahaut, M. Dubois, Y. Colemonts, A. Boenke and G. Maghuin-
Rogister, in Proceedings of the EuroResidue 2 Conference, Veldhoven,
The Netherlands, May 3-5, 1993, 257.
70. Y.K. Tan, S.J. Soldin, J. Chromatogr. (Biomed. Applic.), 66, 1987,
187.
71. A. Walhagen, L.E. Edholm, B.M. Kennedy and L.C. Xiao, Chirality,
1, 1989, 20.
72. C. Lindberg, S. Jonsson, J. Paulson and A. Tunek, Biomed. Environ.
Mass Spectrom., 19, 1990, 218.
73. J. Henion, G.A. Maylin and B.A. Thompson, J. Chromatogr., 271,
1983, 107.
- 45 -

74. W. Schmollack, M. Tkaczyk and J. Koerbl, Zentralbl. Pharm.
Pharmakother. Laboratoriumsdiagn., 126, 1987, 1.
75. M.T. Ackermans, J.L. Beckers, F.M. Everaerts and I.G.J.A. Seelen,
J. Chromatogr., 590, 1992, 341.
76. S. Fanali, J. Chromatogr., 545, 1991, 437.
77. B. Boenisch and J.F. Quirke, in Procceedings of the FLAIR Workshop,
Thessaloniki, Greece, (eds: H.A. Kuiper and L.A.P. Hoogenboom),
Oct 30-31, 1992, p. 102.
78. J.-M. Degroodt, B.W. de Bukanski, J. de Groof and H. Beernaert, Z.
Lebensm. Unters. Forsch., 192, 1991, 430.
79. P.T. Me Carthy, S. Atwal, A.P. Sykes, J.G. Ayres, Biomed.
Chromatogr., 7, 1993, 25.
80. K.A. Sagar, M.R. Smyth and R. Munden, J. Pharm. Biomed. Anal.,
11, 1993, 533.
81. B.M. Kennedy, A. Blomgren, L.E. Edholm and C. Roos,
Chromatographia, 24, 1987, 895.
82. Z. Kopitar, A. Zimmer, Arzeimittel-Forschung, 26, 1976, 1450.
83. A. Adam, H. Ong, D. Sontag and A. Rapaille, J. Immunoassay, 11,
1990, 329.
84. I. Yamamoto and K. Iwata, J. Immunoassay, 3, 1982, 155.
85. C.T. Elliot, W.J. McCaughey and H.D. Shortt, FoodAddit. Contam.,
10, 1993, 231.
- 46 -

86. W. Haasnoot, A.R.M. Hamers, G.D. van Bruchem, R. Schilt and
L.M.H. Frijns, in M.R.A. Morgan, C.J. Smith and P.A. Williams
(eds.), Food Safety And Quality Assurance-Applications o f Immunoassay
Systems, Elsevier, London, 1992, p. 237.
87. W. Haasnoot, S.M. Ezkerro and H. Keukens, in Proceedings of the
EuroResidue 2 Conference, Veldhoven, The Netherlands, May 3-5,
1993, 347.
88. S.D. Bucknall, A.L. MacKensie, M.J. Sauer, D.J. Everest, R.
Newman and R. Jackman, Anal. Chim. Acta, 275, 1993, 227.
89. R. Angeletti, M. Paleologo Oriundi, R. Piro and R. Bagnati, Anal.
Chim. Acta, 275, 1993, 215.
90. M. Paleologo-Oriundi, G. Giacomini, F. Ballaben, F. Berti, F.
Benedetti, R. Bagnati and E. Bastiani, FoodAgric. Immunol., 4, 1992,
73.
91. M.J. Sauer, R.J.H. Pickett and A.L. MacKensie, Anal. Chim. Acta,
275, 1993, 195.
92. G. Degand, A. Bernes-Duyckaerts, Ph. Delahaut and G. Maghuin-
Rogister, Anal. Chim. Acta, 275, 1993, 241.
93. M.E. Ploum, W. Haasnoot, R.J.A. Paulussen, G.D. van Bruchem,
A.R.M. Hamers, R. Schilt and F.A. Huf, J. Chromatogr. (Biomed.
Applic.), 102, 1991, 413.
- 47 -

94. J.A. Garcia-Regueiro, B. Perez and G. Casademont, J. Chromatogr.,
655, 1993, 73.
95. J.A. van Rhijn, W.A. Traag and H.H. Heskamp, J. Chromatogr.
(Biomed. Applic.), 619, 1993, 243.
96. T. Visser, M.J. Vredenbregt, A.P.J.M. de Jong, L. A. van Ginkel, H.J.
van Rossum and R.W. Stephany, Anal. Chim. Acta, 275, 1993, 205.
97. W.J. Blanchflower and D.G. Kennedy, Biomed. Environ. Mass
Spectrom., 18, 1989, 935.
98. J.A. van Rhijn, W.A. Traag, H.H. Heskamp and T. Zuidema, in
Proceedings of the EuroResidue 2 Conference, Veldhoven, The
Netherlands, May 3-5, 1993, 572.
99. L. Debrauwer and G. Bories, Anal. Chim. Acta, 275, 1993, 231.
100. J.F Martinez-Navarro, Lancet , 336, 1990, 1311.
101. C. Pulce, D. Lamaison, G. Keck, G. Bostvironnois, J. Nicholas and
J. Descortes, Vet. Human Toxicol., 33, 1991, 480.
- 48 -

CHAPTER 2
VOLTAMMETRIC STUDY OF SELECTED /3-AGONISTS AT
UNMODIFIED AND NAFION-MODIFIED ELECTRODES WITH
APPLICATION TO THE ANALYSIS OF REAL SAMPLES

2.1 INTRODUCTION
As discussed in chapter 1 (section 1.5.2), the electrochemical approach
to the analysis of /3-agonists is highly advantageous due to the presence of
oxidisable substituents (amino, hydroxyl) on the aromatic ring. The primary
electrode reaction is the oxidation of the hydroxyl moietie(s), the mechanism
involving a one electron/one proton process. In the case of the catechol /3-
agonists (e.g. isoprenaline, rimiterol), the highly reactive o-quinone is formed.
Aniline-type /3-agonists, containing an oxidisable amino group on the aromatic
ring, are also readily oxidised by a suitable electrode. The secondary amino
group on the aliphatic part of the molecule also becomes electroactive when
deprotonated; for the electrooxidation of methadone at a carbon paste
electrode (CPE), the amino group becomes electroactive at pH values > 5
[1]. Carbon-based electrodes have been the most suitable for oxidation of
these moieties and many authors have used them to investigate the
electrochemical behaviour of selected /3-agonists. Clenbuterol and mabuterol,
two stucturally-similar /3-agonists, were oxidised irreversibly at high positive
potentials (+ 0 .75 V vs the saturated calomel electrode (SCE)) at both glassy
carbon electrodes (GCEs) and CPEs [2]. The large positive potentials
required were due to the electrophilic substituents (Cl, CF3) on the aromatic
ring. The irreversible oxidation of the compounds, i.e. absence of reductive
waves on the reverse scan, is a consequence of a chemical follow-up reaction

of the oxidation products. This was supported by the appearance of small
reduction/oxidation waves in subsequent scans at considerably lower positive
or negative potentials at the carbon electrodes. The compounds and their
products adsorbed on the electrode surface causing inhibition of the current
response. This was remedied by addition of 30-40% acetonitrile or by using
an electrochemical cleaning step i.e. holding the potential at -1.5 V for 5 min.
From this study the authors then developed a sensitive HPLC-ED method for
the separation and detection of the two compounds in plasma extracts at the
low ppb level. Hooijerink et al. developed a similar HPLC-ED method for
the detection of clenbuterol only, using a GCE set at a potential of +1.25 V
vs the Ag/AgCl reference electrode [3]. The detector signal was found to
deteriorate due to the adsorption of oxidation products and/or matrix
components present in the urine extracts. This led to the development of an
electrochemical cleaning procedure; oxidation of the electrode at high positive
potentials. The oxidative voltammetric behaviour of salbutamol at the GCE
was also studied using cyclic voltammetry (CV) and differential pulse
voltammetry (DPV) [4]. A pH study (half wave potential (EP/2) vs pH) using
CV revealed that the oxidation of the compound was strongly influenced by
pH. The phenolic hydroxyl group oxidation gave rise to a single peak in the
pH range studied. The peak shifted towards negative potentials as the pH
increased in such a way that two different lines with different slopes were
observed. The two lines intersected at pH 9.0 which is the expected pKj, value
of salbutamol [5]. Coulometric analysis of the compound showed that two
electrons were involved in the oxidation process. The compound was
subsequently determined in tablet formulations by DPV (at optimum pH of
5.0) giving rise to a peak at +0.75 V vs the SCE reference electrode. Tan
et al. carried out a hydrodynamic study (i.e. profiles of current vs potential)
for salbutamol and internal standard, fenoterol at the GCE [6]. An applied
potential of +0 .60 V was required to initiate an electrochemical response for
salbutamol whereas for fenoterol a response was initiated at considerably
lower potentials. Furthermore, the detection limit for fenoterol was found to
be lower due to a larger signal being generated by the oxidation of the three
hydroxyl groups. Sagar et al. developed HPLC-ED methods for phenolic ¡3-
agonists (salbutamol, terbutaline) using a micro carbon fibre electrode [7-9].
Hydrodynamic studies for salbutamol [7, 9] showed that the optimum response
occurred at very high positive potentials ( +1.3 V vs the Ag/Ag3P 0 4 reference
electrode). The carbon fibre electrode, when compared to the macro-GCE,
was more advantageous both in terms of lower detection limits (1 ng/ml
compared to 3 ng/ml) and a less troublesome electrochemical cleaning
procedure. For the purposes of understanding the processes occurring at the
electrode surfaces, the use of a CPE is particularly advantageous. The
benefits gained from using CPEs, i.e. ease and speed of fabrication and low
background currents, have been previously demonstrated for methadone
electrooxidation [1]. Moreover this present work shows that CPE’s may be

more suitable than GCE’s for electrochemical studies involving /3-agonists due
to their greater discriminating power for secondary processes. The
electrochemical response of the CPE was investigated for three selected /3-
agonists possessing catechol (salbutamol) or resorcinol (metaproterenol,
fenoterol) ring structures.
To understand the electrochemical process occurring on carbon paste
electrodes, both pH and scan rate studies were carried out. The regeneration
of the carbon paste activity is essential for reproducible analyte response.
Loss of electrode activity has been attributed to adsorption of reaction
products, of the analyte itself or other electroactive organic surfactants. Use
of high anodic potential activation procedures as suggested by Adams and co
workers [10], and effectively demonstrated by Tunon and co-workers [1],
results in a very reproducible response with relative standard deviations of less
than 1 %. For this work, electrochemical pretreatment steps were optimised
for the three compounds studied.
Chemically-modified electrodes have received a great deal of attention
in recent years. By concentrating the analyte in the modified layer of the
electrode, voltammetric determinations can be greatly improved with respect
to sensitivity and selectivity. Modification of the electrode with
electrocatalytic moieties or specially functionalized polymers provides
conventional electrochemical electrodes with a significant functional
enhancement for analytical applications. One such polymer, i.e. Nafion,

possesses almost ideal properties for preparation of chemically modified
electrodes. Nafion is chemically inert, non-electroactive, hydrophilic,
thermally stable and insoluble in water [11]. Studies by Martin’s group [11]
and [12], have shown that the polymer’s sulphonated (S03 ) moiety shows a
remarkably high affinity for hydrophobic cations. This has led to the
development of various carbon-based electrodes modified with the Nafion
polymer.
The Nafion-modified glassy carbon electrode (NMGCE) has been used
in flow analysis for the determination of cationic drugs and neurotransmittors
[13, 14]. Results show that Nafion favours cations considerably over neutral
species while exhibiting a shielding effect for anions. Further modifications
of the electrode has resulted in the combination of Nafion with other materials
such as mercury thin films [15], platinum particles [16], methylene blue dye
[17] and solvents (for example, tributylphosphate) [18]. A Nafion-modified
graphite electrode incorporating viologens has been developed for catalytic
purposes [19]. A recent development is the use of a polyaniline-Nafion thin
film on a platinum electrode. Polyaniline contains oxidisable groups which
form positive charge sites on electrooxidation. Current flows if anionic
species "move into" the polymer and counterbalance the positive charge.
Nafion, containing negatively-charged S 0 3' groups, can take on this role, and
together with the polyaniline, attract positively-charged groups like alkali and
alkaline earth metal ions [20]. Nafion-modified carbon fibre

ultramicroelectrodes have been applied to the analysis of neurotransmitters and
metal ions [21, 22]. A recent article by Litong et al. reported a
chronopotentiometric stripping analysis method for adenosine with a NMGCE
[23]. Gao et al. reported the use of a Nafion-l,10-phenanthroline-modified
CPE for the determination of Fe(II) [24]. The purpose of the Nafion was two
fold in this application: firstly to immobilise the complexing agent on the
electrode surface, and secondly to act as an ion-exchanger for the positively-
charged iron complex. The design of the electrode is quite different to the
Nafion-modified CPE used for /3-agonist accumulation. In the paper of Gao
et al., the Nafion was incorporated into the graphite-nujol paste mixture. For
the fabrication of the electrode described in this present study, an aliquot of
Nafion solution was simply added to the surface of a prepared CPE. A thin
film, formed after drying, was sufficient to act as an ion-exchanger for various
/3-agonists at optimum pH and Nafion film conditions.

2.2 EXPERIMENTAL
2.2.1 Reagents and materials
A Britton-Robinson (BR) buffer solution was prepared containing 11.48
ml acetic acid (99.7%), 13.5 ml phosphoric acid (85 %) and 12.44 g boric acid
per litre. The pH (range varying from 2 to 12) was adjusted using 2 M
sodium hydroxide. Carbon paste was prepared containing 5 g carbon (Spectro
pure grade, Fluka Chemical Co.) and 1.8 ml Nujol oil. Lauryl sulphate,
Triton-X, fenoterol hydrobromide, metaproterenol hemisulphate, salbutamol
and isoproterenol were purchased from Sigma (St.Louis, MO). L(-)-
epinephrine was purchased from Janssen Chemica (Beere, Belgium).
Terbutaline was a gift from The National Food Centre, Ireland. The
pharmaceutical preparation (Berotec) was prepared by Boehringer Ingelheim,
(Barcelona). All standard solutions were prepared using deionised water
(obtained by passing distilled water through a Milli-Q water purification
system) and stored in the dark at 5°C. Chemicals obtained from Aldrich
Chemicals were cholic acid (Milwaukee, USA), Amberlite-XAD-2 (Steinheim,
Germany) and Nafion (Gillingham, UK). Dilutions of the Nafion stock
solution were prepared using water: isopropanol (1:1). Asolectin soyabean
(phospholipids) was received from Fluka Biochemika (Switzerland), and
silicon OV17 was purchased from Merck (Darmstadt, Germany). The

extraction solvent mixture consisted of ethyl acetate (Farmitalia Earlo Erba,
Milan) and amyl alcohol (Panreac, Barcelona) (9:1).
2.2.2 Apparatus
The experiments were carried out in an all-glass cell designed for a
three-electrode potentiostatic circuit. Cyclic voltammetric experiments were
carried out using a VA Scanner E612 and VA detector E611 (both Metrohm)
coupled to a Graphtec WX4421 recorder. Differential pulse voltammetric
experiments were carried out using a Model 663-VA stand (Metrohm)
equipped with a rotating carbon paste disc electrode (18 mm2) and coupled to
a Model 626 Polarecord (Metrohm). The reference electrode was a Ag/AgCl
electrode, whereas the counter electrode was a platinum electrode.
2.2.3 Methods
2 .2.3.1 Cyclic voltammetry at carbon paste electrodes
Studies on the effect of pH, using BR buffer pH 2-12, were carried out
at concentrations of lxlO'4 M (salbutamol) and lxlO'5 M (fenoterol and
metaproterenol). Scan rate studies, electrochemical activation procedures and
calibration curves were carried out in the optimum pH. Selected modifying

compounds were evaluated for their capacity to promote an adsorption-type
process for salbutamol and fenoterol. The modifier was either added to the
electrolyte solution (cholic acid, lauryl sulphate, Triton X), incorporated into
the carbon paste (silicon OV17, phospholipids, Amberlite XAD-2) or applied
in the form of a film on the electrode surface (Nafion).
2.2.3.2 Differential pulse voltammetry at Nafion-modified electrodes
The Nafion-modified electrode was prepared by pipetting 0.01 ml of an
appropriate concentration of Nafion solution onto the surface of a previously
prepared CPE. The resulting film was air-dried using a domestic hair-dryer.
All stripping analyses were carried out in 20 ml BR buffer, pH 2.0. In
operation, the CPE was immersed in the buffer solution and rotated at a
constant speed (accumulation times typically 10-60 s, depending on the
compound concentration) with electrolysis at 0 V. After a 5 s rest period, the
compound was removed by stripping anodically from 0 V to + 1 .2 V and the
peak current measured.

2.2.3.3 Analysis o f a pharmaceutical preparation
The pharmaceutical preparation was diluted 1: 500 with deionised water
and a 0.05 ml aliquot was injected into the cell. 0.05 ml aliquots of fenoterol
solution (2x1 O'5 M) were added and a 30 s accumulation time was employed.
2.2 .3 .4 Extraction methodology
Urine and serum samples obtained from healthy individuals, were
stored frozen until assay. After thawing, 5 ml aliquots of urine were fortified
with an appropriate fenoterol concentration and 2.0 ml of 0.2 M sodium
hydroxide solution was added. After vortexing, 20 ml of solvent mixture was
added and the flask shaken by hand for 7 min. The layers were then allowed
to separate for 15 min. 18 ml of the upper organic layer was removed using
a glass pipette, evaporated to dryness under a stream of nitrogen at 70°C, and
redissolved in 2 ml BR buffer, pH 3.0. Differential pulse voltammetry at a
Nafion-modified electrode was undertaken as described in section 2.2.3.2
using an accumulation time of 45 s.
For serum, a similar procedure was adopted, but using only 1.0 ml
aliquots of sample and appropriately-reduced volumes of extraction solvent (10
ml) and sodium hydroxide (1 ml) solutions. In this case, for improved
sensitivity, the extract was injected into a reduced volume of BR buffer (10
ml).
2.3 RESULTS AND DISCUSSION
2.3.1 Electrochemical behaviour at bare carbon paste electrodes
The cyclic voltammetric behaviour of salbutamol, fenoterol and
metaproterenol at bare carbon paste electrodes in BR buffer, pH 8.0, is shown
in Figure 2.1. The electrochemical behaviour of the three compounds at these
electrodes over the pH range 2-12 in all cases yields one main irreversible
oxidation process, which shifts towards more negative potentials as the pH
increases. The presence of a very distinct secondary process was also
observed for salbutamol. In the case of fenoterol and metaproterenol, this
secondary process was also observed but was less distinct and appeared only
in the pH range 6-10. For salbutamol this process appears in the pH range 6-
12 and becomes more pronounced as the pH increases.
Figure 2.2 shows the relationship between half-peak potential and pH
for the two processes of salbutamol at bare CPEs. Linearity for the first
process was observed in the pH range 1-11, giving a negative slope of 50.7

Figure 2.1
Ep (V) vs SCE
Cyclic voltammograms of (a) salbutamol (concentration lxlO'4 M), (b) fenoterol and (c) metaproterenol (concentration lxlO'5 M) at carbon paste electrodes (pH=8.0, Scan rate 70 mVs'1, background scan shown below each compound.).
- 61 -

PH
Figure 2.2 The relationship between half-peak potential and pH in cyclicvoltammetry for lx l O'4 M salbutamol (■) and lx l O'5 M fenoterol (A) at bare carbon paste electrodes (Scan rate=70 mVs'1. — indicates main process, — indicates secondary process.)
- 62 -
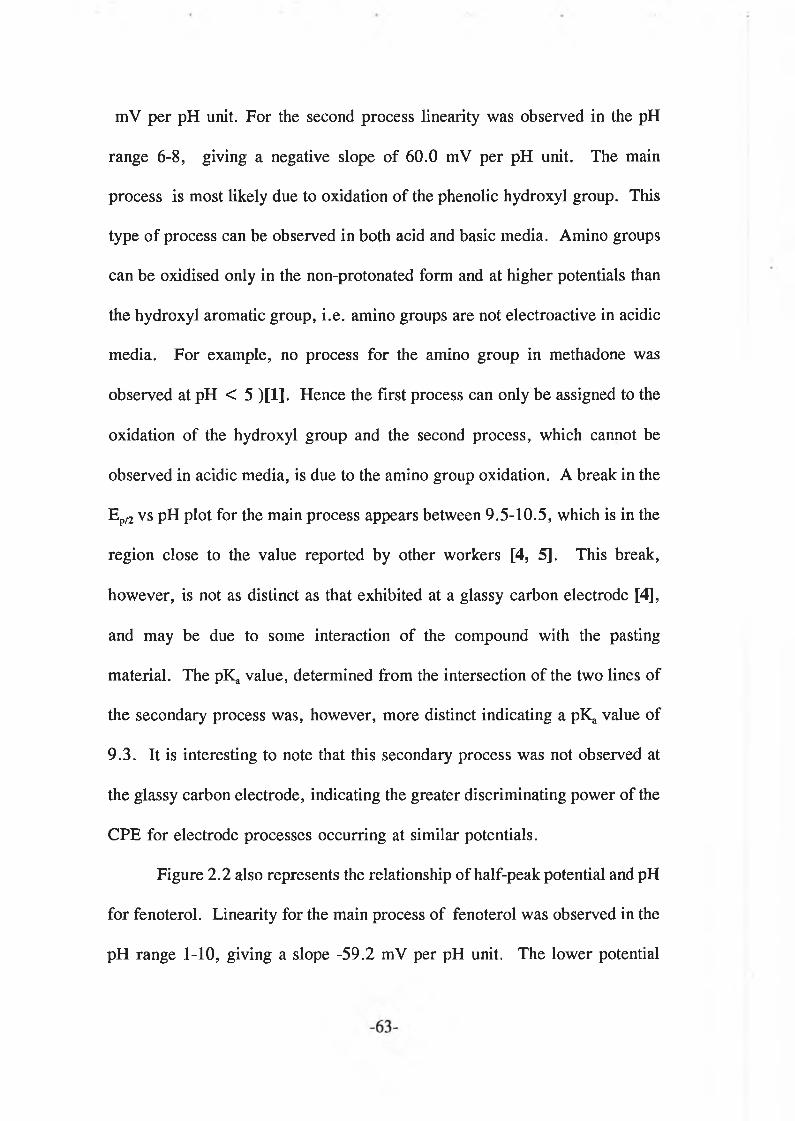
mV per pH unit. For the second process linearity was observed in the pH
range 6-8, giving a negative slope of 60.0 mV per pH unit. The main
process is most likely due to oxidation of the phenolic hydroxyl group. This
type of process can be observed in both acid and basic media. Amino groups
can be oxidised only in the non-protonated form and at higher potentials than
the hydroxyl aromatic group, i.e. amino groups are not electroactive in acidic
media. For example, no process for the amino group in methadone was
observed at pH < 5 )[1]. Hence the first process can only be assigned to the
oxidation of the hydroxyl group and the second process, which cannot be
observed in acidic media, is due to the amino group oxidation. A break in the
Ep/2 v s pH plot for the main process appears between 9.5-10.5, which is in the
region close to the value reported by other workers [4, 5]. This break,
however, is not as distinct as that exhibited at a glassy carbon electrode [4],
and may be due to some interaction of the compound with the pasting
material. The pKa value, determined from the intersection of the two lines of
the secondary process was, however, more distinct indicating a pKa value of
9.3. It is interesting to note that this secondary process was not observed at
the glassy carbon electrode, indicating the greater discriminating power of the
CPE for electrode processes occurring at similar potentials.
Figure 2.2 also represents the relationship of half-peak potential and pH
for fenoterol. Linearity for the main process of fenoterol was observed in the
pH range 1-10, giving a slope -59.2 mV per pH unit. The lower potential

required to oxidise fenoterol compared to salbutamol is due to the nature of
the hydroxyl substituents in the molecule. Coulometric studies aimed at
finding the number of electrons involved in the processes proved fruitless
owing to adsorption effects. Both fenoterol and metaproterenol are likely to
exhibit several electron transfer reactions due to the hydroxyl groups in the
structure. In the case of metaproterenol (results not shown), linearity was
observed in the pH range 2-6, giving a slope of -60 mV per pH unit. A
change in the slope occurs after pH 6, and at pH 10 the process is independent
of pH. The presence of small reduction waves, which move to more negative
potentials as the pH increased, was seen for salbutamol and fenoterol and may
be due to products formed after oxidation. Such behaviour was reported also
for the oxidation of other related compounds, i.e. clenbuterol and mabuterol,
at CPE’s [2], The relationship of peak current with pH for salbutamol showed
a decrease in current for the first process as the pH increases, after which the
second process appears and subsequently the current for this process increases
with the pH. A similar behaviour was observed for fenoterol. For
metaproterenol, the peak current decreased with increasing pH. The optimum
pH for further study, based on obtaining a good signal coupled with adequate
separation from the background discharge, was in the range 4-5 for all the
compounds studied.
Scan rate studies were then carried out to assess whether the processes
at carbon paste electrodes were under diffusion or adsorption control. Table

2.1 gives a summary of results, indicating the concentrations tested, the
relationship of peak current with scan rate/square root of scan rate, and
whether the process was diffusion or adsorption controlled. From the results
one can see that for all three compounds, at high concentrations, a diffusion-
controlled process occurs. However, at low concentrations, close to the limit
of detection of the technique, an adsorption process was observed for both
salbutamol and metaproterenol while for fenoterol a diffusion process was
found at low concentrations.
Electrode pretreatment procedures based on activation at high anodic
potentials were then developed for the three compounds. For salbutamol
analysis, the electrode was kept in a quiescent solution for 30 s under
electrolysis at +1.55 V. The electrolysis was then switched off and the
solution stirred for 15 s. For fenoterol and metaproterenol the activation
potential used was lower, i.e. +1.3 V, and the activation and stirring times
were 20 s and 30 s, respectively. Using such activation procedures, relative
standard deviations of < 0.5% (n = 5) were achieved. Using the activation
procedure, calibration ranges were established for the three compounds. For
salbutamol, a linear response was obtained in BR buffer, pH 4.0, in the range
2.5xl0'6 to 4.75xl0'5 M according to the following equation:
ip [nA] = 1.37xlO+7 .C [M ] -1.46 (n=10, r=0.9994)

COMPOUND pH CONCENTRATION(M)
RANGE(mVs-1)
EQUATION PROCESSCONTROL
Salbutamol 4.02x10 s 2-90 ip/nA=0.83 v+8.99
r=0.999n=llAdsorption
lxlO'3 2-100 ip/nA= 19.60 v1/2+ 9.29 r=0.999n=ll
Diffusion
Fenoterol 5.03.3x1 O'7 2-40 ip /nA= 4.58 v in - 2.29
r=0.998 n=6Diffusion
lxlO5 2-90 ip /nA= 74.23 vw- 36.61 r=0.998 n=9
Diffusion
Metaproterenol 5.05xl0'7 2-100 ip/nA= 0.23 v -36.61
r=0.998 n=8Adsorption
5x10⁶ 2-100 ip/nA= 15.16 vlfl+ 8.36 r=0.998 n=8
Diffusion
Table 2.1 Characterisation of the rate-controlling step for the selected phenolic p-agonists using cyclic voltammetry at bare carbon paste electrodes.

For fenoterol a linear response was established in acetate buffer pH 5.0, in the
range 5.0xl0'8 to 1.6xl0'6 M according to the equation:
ip [nA ]=6.01xl0+7 .C [M ] +2.28 (n= 9, r=0.9994)
Linearity for metaproterenol was achieved also in acetate buffer, pH 5.0, in
the range 4.0xl0"7 to 4.25xl0'5 M giving the following equation:
ip [nA] = 1 .71xl0+7 .C [M ] +8 .00 (n=10, r =0.9991)

2.3.2 Electrochemical studies at a Nafion-modified carbon paste electrode
(NMCPE)
None of the modifiers tested, with the exception of lauryl sulphate and
Nafion, showed higher faradaic currents than those achieved at a bare CPE.
In some cases (in particular with cholic acid, Amberlite XAD-2 and Triton X),
very high capacitative currents were recorded. Lauryl sulphate gave almost
a three-fold increase in peak current for fenoterol (using 2x1 O'4 M lauryl
sulphate), but an accumulation process did not occur with time. Results
obtained from using a Nafion-modified electrode for both salbutamol and
fenoterol showed large increases in peak current as the accumulation time
increased. Differential pulse voltammetry was performed to obtain
accumulation curves for the compounds and hence to ascertain their linear
range. Moreover, cyclic voltammetry with the modified electrode permitted
determination of the rate-controlling step within the Nafion layer itself. The
remainder of this work concentrated on studying Nafion-modified electrodes
in more detail.
2.3.2.1 Influence o f pH
A pH study, using BR buffer of pH 2-8, was used to evaluate the
accumulation behaviour of the three compounds at Nafion-modified CPE

surfaces (compound concentration 2.5x1 O'7 M, 0.5% Nafion film and
accumulation time 30 s). Figure 2.3 shows that the best accumulation of all
three compounds occurred at pH 2.0, and decreased rapidly as the pH is
increased. Of the three compounds studied, salbutamol showed considerably
lower peak currents under the same conditions. In conclusion, it appears that
for optimum analytical conditions, a pH value of 2.0 would be the most
suitable. However, the effect of the background current, which is more
pronounced at lower pH values, must also be considered. pH values between
2.0 and 3.0 are therefore the best compromise for analyte selectivity.
2.3.2.2 Influence o f pulse height. scan rate and deposition potential
The pulse height was varied over the range 10 to 100 mV in optimum
buffer conditions and a 0.5% Nafion-modified electrode. The analyte peak
current increased significantly with pulse height up to 50 mV, after which
further increase in pulse height resulted only in a small increase in peak
current. Hence a pulse height of 50 mV was used for all further work.
The influence of scan rate on the peak current was studied in the range
2-25 mVs'1- The optimum scan rate was either 5 or 10 m V s1, both of which
gave similar peak currents. However, a scan rate of 10 mVs'1 was chosen for
all further work due to the shorter analysis times achieved. The response of
the stripping peak at various initial accumulation potentials was also carried
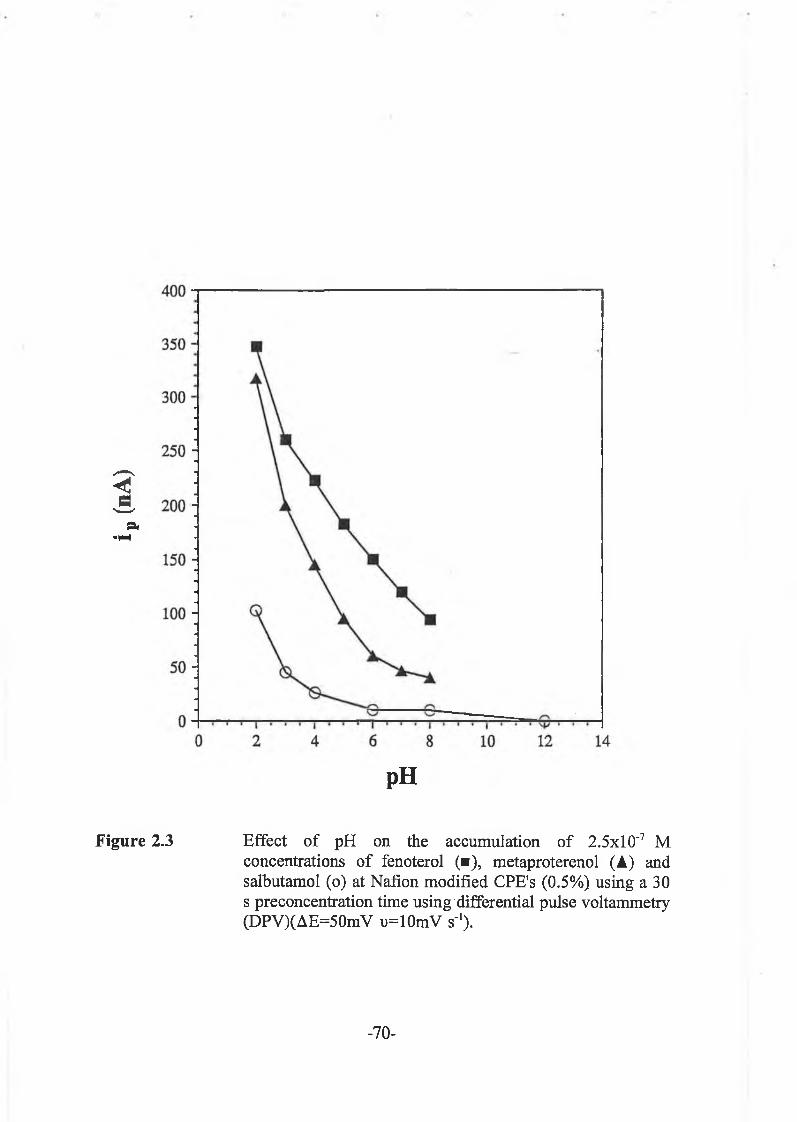
ip(n
A)
pH
Figure 2.3 Effect of pH on the accumulation of 2.5x1 O'7 Mconcentrations of fenoterol (■), metaproterenol (A) and salbutamol (o) at Nafion modified CPE's (0.5%) using a 30 s preconcentration time using differential pulse voltammetry (DPV)(AE=50mV u=10mV s'1).
- 70 -
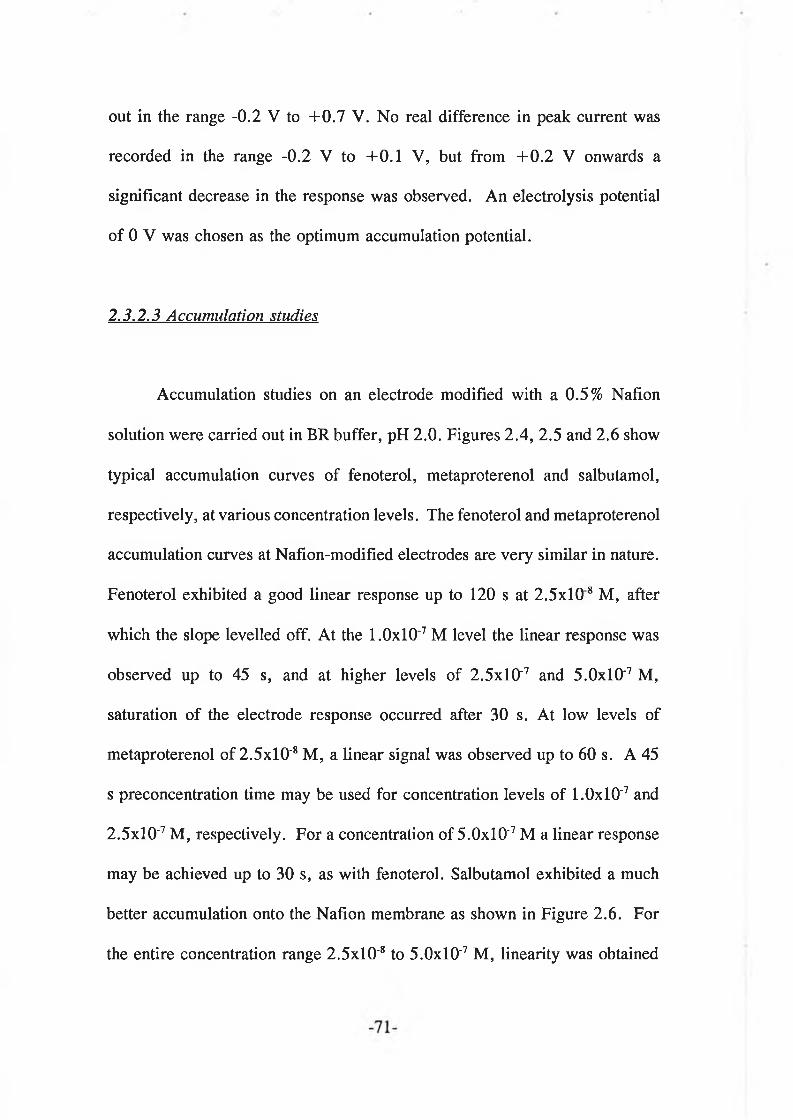
out in the range -0.2 V to + 0 .7 V. No real difference in peak current was
recorded in the range -0.2 V to +0.1 V, but from + 0 .2 V onwards a
significant decrease in the response was observed. An electrolysis potential
of 0 V was chosen as the optimum accumulation potential.
2.3.2.3 Accumulation studies
Accumulation studies on an electrode modified with a 0.5% Nafion
solution were carried out in BR buffer, pH 2.0. Figures 2.4, 2.5 and 2.6 show
typical accumulation curves of fenoterol, metaproterenol and salbutamol,
respectively, at various concentration levels. The fenoterol and metaproterenol
accumulation curves at Nafion-modified electrodes are very similar in nature.
Fenoterol exhibited a good linear response up to 120 s at 2 .5x108 M, after
which the slope levelled off. At the 1.0x10'7 M level the linear response was
observed up to 45 s, and at higher levels of 2.5xl0'7 and 5 .0xl0‘7 M,
saturation of the electrode response occurred after 30 s. At low levels of
metaproterenol of 2.5xl0'8 M, a linear signal was observed up to 60 s. A 45
s preconcentration time may be used for concentration levels of 1.0x1 O'7 and
2.5xl0"7 M, respectively. For a concentration of 5.0xl0'7 M a linear response
may be achieved up to 30 s, as with fenoterol. Salbutamol exhibited a much
better accumulation onto the Nafion membrane as shown in Figure 2.6. For
the entire concentration range 2.5x10‘8 to 5.0x1 O'7 M, linearity was obtained

(n A
)
time (s)
Figure 2.4 Accumulation curves of fenoterol using differential pulsevoltammetry (DPV) with a 0.5% Nafion modified CPE in BR buffer, pH 2.0; 2 .5xl0‘8 M (o), l.OxlO'7 M (A), 2.5xlO'7M (+ ) and 5.0xl0~7M (□ ) (experimental conditions as in figure 2.3)
- 72 -
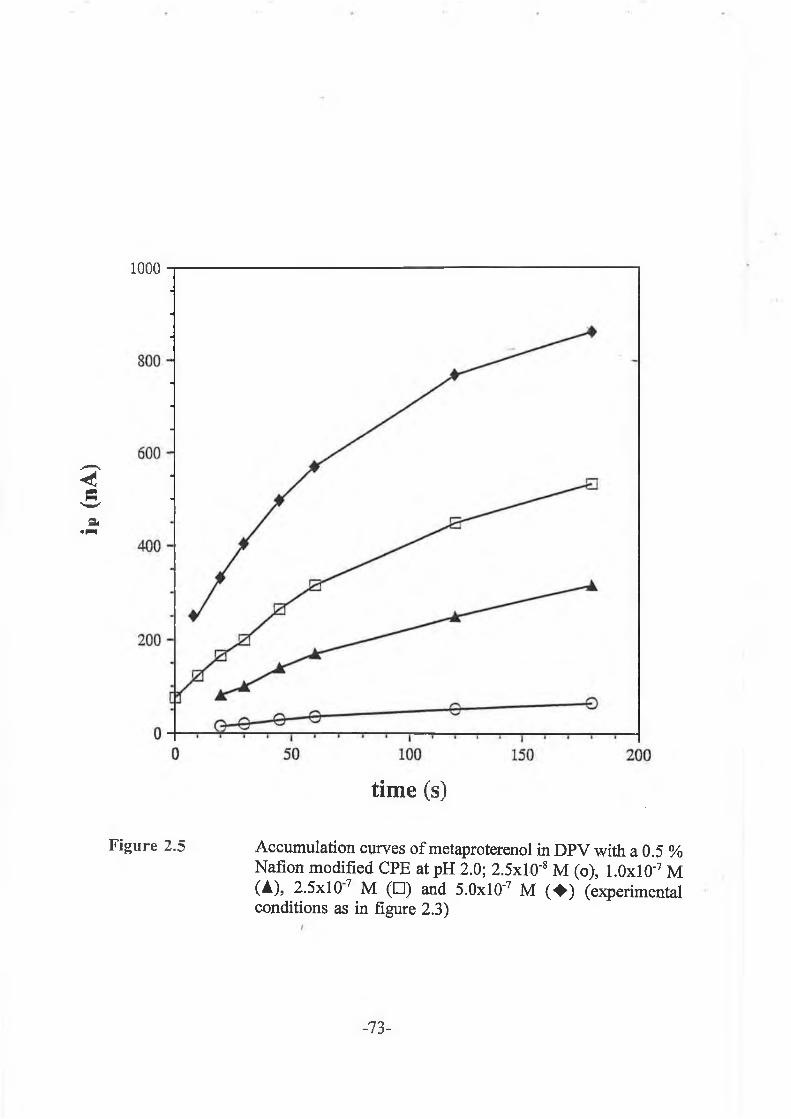
ip (n
A)
1000
time (s)
Figure 2.5 Accumulation curves o f metaproterenol in DPV with a 0.5 %Nafion modified CPE at pH 2.0; 2.5xl0'8 M (o), l.OxlO'7 M (A), 2.5x10⁷ M (□ ) and 5.0xl0‘7 M ( ♦ ) (experimental conditions as in figure 2.3)
- 73 -

tíme (s)
Figure 2.6 Accumulation curves o f salbutamol in DPV with a 0.5%Nafion modified CPE at pH 2.0: 2.5xlO'8M (o) l.OxlO'7 M (A), 2.5x10"7 M (■), 5.0xl0'7M ( ♦ ) and l.Ox 10‘7 M (□) (experimental conditions as in Figure 2.3)
- 74 -
up to 180 s. Higher accumulation times of 240 s at low compound
concentrations resulted in a change of slope of the line. At high levels of
l.OxlO'6 M a linear response was observed up to 60 s. This means that, due
to a structural difference in the salbutamol molecule to that of fenoterol and
metaproterenol, longer accumulation times and higher concentrations may be
used. However, for the same concentration level and accumulation time the
peak currents obtained for fenoterol and metaproterenol are almost twice that
of salbutamol.
2.3.2.4 Cyclic voltammetry
To understand the rate-controlling step of the process at the Nafion
membrane, scan rate dependency studies were carried out. For both films
studied (using 0.5% and 2.0% Nafion solutions), the dependence of the peak
current (ip) on the scan rate (v) was found to be non-linear. When the peak
current was plotted versus the square root of the scan rate, a linear response
was recorded for all three compounds, indicative of a diffusion-controlled
process. The results are summarised in Table 2.2. The main conclusion to
be drawn from these results is that the rate-controlling process is the diffusion
of the compounds from one part of the Nafion layer to another.
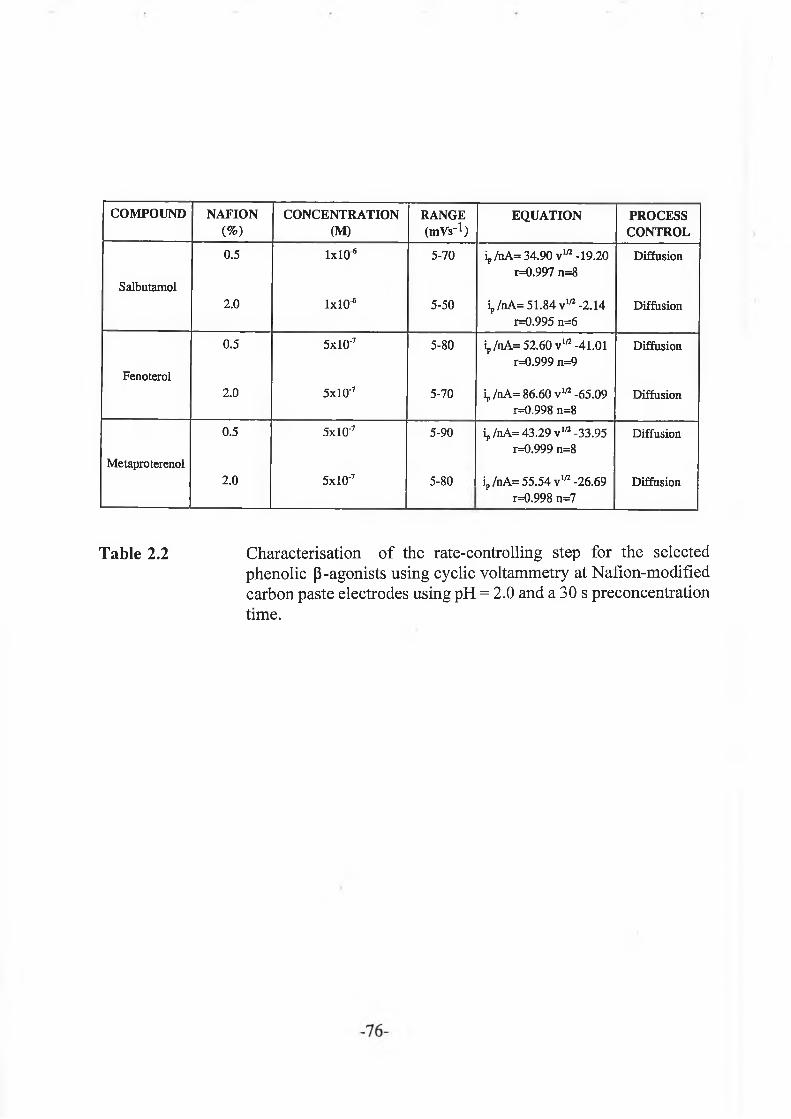
COMPOUND NAFION(%)
CONCENTRATION(M)
RANGE(mVs'1)
EQUATION PROCESSCONTROL
Salbutamol
0.5 1x10 s 5-70 ip /nA= 34.90 vin -19.20 r=0.997 n=8
Diffusion
2.0 lxlO"6 5-50 ip/nA= 51.84 via -2.14 r=0.995 n=6
Diffusion
Fenoterol
0.5 5xl0'7 5-80 ip/nA= 52.60 vw -41.01 r=0.999 n=9
Diffusion
2.0 5xl0‘7 5-70 ip/nA= 86.60v1'2 -65.09 r=0.998 n=8
Diffusion
Metaproterenol
0.5
2.0
5x1 O'7
5xl0'7
5-90
5-80
ip/nA= 43.29 vw -33.95 r=0.999 n=8
ip /nA= 55.54 vw -26.69 r=0.998 n=7
Diffusion
Diffusion
Table 2.2 Characterisation of the rate-controlling step for the selectedphenolic P-agonists using cyclic voltammetry at Nafion-modified carbon paste electrodes using pH = 2.0 and a 30 s preconcentration time.

2.3.2.5 Medium Exchange
Medium exchange experiments were then carried out, using fenoterol
as a model for the other compounds, on unmodified and modified carbon paste
electrodes. At a modified electrode a medium exchange experiment resulted
in a peak (compound concentration; 2.5xl0'7 M, tacc; 30s) which was 76% in
height with respect to that of the original (n = 5, CV = 2.8%).
Incorporating medium exchange and a 30 s stirring step, a peak 57.9% in
height of the original was obtained (n = 5, CV = 3.1%). No peak was
recorded after medium exchange using an unmodified surface. These
experiments demonstrate clearly that a strong attraction exists between this
class of compound and the Nafion polymer.
2 .3 .2 .6 Response o f some endogenous neurotransmitters at the NMCPE
Epinephrine and isoproterenol, two naturally-occurring catecholamines
with hydroxyl groups at positions 3 and 4 on the aromatic ring were also
evaluated for their electrooxidation at the NMCPE. In a BR buffer pH 2.0,
both compounds gave rise to a peak at + 0 .62 V (using the optimum
conditions already described), but no accumulation occurred with time. Figure
2.7 shows a voltammogram of a mixture of epinephrine (+ 0 .62 V) and
fenoterol (+ 0 .92 V) at a common concentration of 2.5x10"7 M, showing the

Figure 2.7 Differential pulse voltammograms o f 2.5x1 O'7 Mconcentrations of (A) epinephrine and (B) fenoterol using a 0.5% Nafion electrode in BR buffer, pH 2.0. (pulse height 50 mV, scan rate 10 mV s'1)
-78-

good selectivity of the voltammetric method.
2.3.3 Application o f the NMCPE to fenoterol determination in real
samples
2.3.3.1. Effect o f pH o f supporting electrolyte
The results obtained in section 2.3.2.1, indicate that a solution of low
pH favours high accumulation of the phenolic-type /3-agonists. Although BR
buffer of pH 2.0 gave rise to higher peak current the effect of background
current became more pronounced at such low pH values. A BR buffer of pH
3.0 combined good analyte response with satisfactory separation from the
background current and hence was used for all further work.
2.3.3.2 Optimisation o f Nafion concentration
The effect of increasing the concentration of Nafion at the CPE surface
was investigated. Figure 2.8 shows the accumulation profile of 5xl0'7 M
fenoterol on unmodified and modified surfaces. No preconcentration of
fenoterol occurred with the unmodified electrode. Using Nafion films,
however, a preconcentration process was observed resulting in large increases
in current up until 0.5% Nafion. Further increases in Nafion concentration

200
time (s)
F ig u re 2.8 Comparison of the DPV responses o f fenoterol at a barecarbon paste electrode and at various Nafion-modified CPE's for 5.0x1 O'7 M fenoterol in pH 3.0 BR buffer; Unmodified CPE ( • ) ; 0.1% Nafion electrode (A); 0.2% Nafion Electrode (□); 0.5% Nafion electrode (o); 0.8% Nafion electrode (♦ ) ; 2.0% Nafion electrode (■). experimental conditions as for figure 2.7
- 8 0 -
(up to 2.0%) resulted in insignificant increases in peak current, suggesting that
0.5% may be the optimum concentration of Nafion required. Moreover, a
lower current was obtained for higher % Nafion films at low accumulation
times, most likely due to resistance of the diffusion of the compound by a
thicker layer. From this study, two Nafion concentrations (0.5% and 2.0%)
were selected; accumulation studies, calibration curves and reproducibility
studies were carried out to investigate whether there is any advantage in using
thicker films to enhance the accumulation process.
2.3.3.3 Fenoterol accumulation studies
Accumulation curves, on electrodes modified with 0.5% and 2.0%
Nafion, were carried out at four concentration levels of fenoterol. Figure 2.9
(0.5% Nafion) shows the preconcentration of the compound with time. This
Figure demonstrates that at low concentrations of fenoterol (2.5xl0 8 and
5.0x10⁸ M) there was a linear response up to 90 s after which the slope
changes (r = 0.998, n = 5 and r =0.999, n = 5 , respectively). For higher
concentrations, i.e. 1.0x10⁷ and 5.0xl0"7 M, linearity was observed up to 60
s and 30 s, respectively (r = 0.999, n = 5 and r = 0.999, n = 3,
respectively). For all the concentrations studied there were non-zero
intercepts, indicating accumulation of fenoterol during scanning. Accumulation
studies with 2.0% Nafion films (results not shown) revealed longer linearity

(nA)
t a n t ( s )
F ig u r e 2.9 Accumulation curves of fenoterol obtained with a 0.5%Nafion electrode using DPV at pH 3.0 and using the same experimental conditions as for figure 2.7: 2.5x10‘8 M (©), 5.0xl0‘8 M (A); l.OxlO'7 M (■) and 5.0xl0'7 M ( ♦ ) .
-82-

(180 s) at low concentrations of 2.5xl0'8 M. For concentrations above this
level the linear profile was the same as for 0.5 % Nafion. Overall the
currents obtained using the higher Nafion concentration were greater but only
by a relatively small amount. Non-zero intercepts were obtained as for 0.5%
Nafion.
2.3 .3 .4 Calibration curves
For both Nafion concentrations there was good linearity for all
concentrations studied, up to and including 30 s. Using this preconcentration
time and a 0.5% Nafion film a calibration curve covering one order of
magnitude, 5.0x10'8 to 5.0x1 O'7 M, was observed. The following calibration
equation was obtained:
i/nA = 4 .08xl0+8 C/M +6.61 (n = 9, r =0.9990)
Using the same preconcentration time and a 2.0% Nafion film, a linear
calibration curve covering one order of magnitude, 2.5xl0'8 to 6 .0 x l0 7 M,
was observed. The following equation was obtained:
i/nA = 3 .45xl0+8 C/M +3.33 (n = 9, r = 0.9994)

It was possible to measure concentrations of the drug compound below
2.5xl0'8 M by applying longer accumulation times, but co-adsorption of
interferences was observed. The limit of detection of fenoterol using a 45 s
preconcentration time (calculated using a signal-to-noise ratio of 3) was 9xl0'9
2.3.3.5 Reproducibility
The reproducibility of the Nafion-modified electrode was evaluated at
two concentration levels of fenoterol (l.OxlO 7 Mand 5.0x1 O'7 M); acceptable
coefficients of variation, for ten consecutive runs, of 2.21 and 5.25% (0.5%
Nafion film) and 3.52% and 4.95% (2.0% Nafion film) respectively, were
obtained. The higher variation observed at higher concentrations of compound
may be due to modification of the electrode surface by a higher proportion of
adsorption products. A fresh NMCPE was fabricated for each study. The
electrode may be prepared reproducibly in a reasonably short period of time
(typically 20 min).
2.3 .3 .6 Choice o f Nafion concentration for real samples
Apart from the slightly higher faradaic current obtained with a 2.0%
Nafion film, no real advantages were derived from its use over the 0.5 % film.

Results from cyclic voltammetry (section 2.3.2.4) show that higher capacitance
currents are present for thicker films. Moreover, other authors have reported
that thicker films retain a more powerful barrier to the diffusion of the analyte
[13, 24]. Hence, for these reasons, a 0.5% Nafion film was chosen for
application to real samples.
2.3.4 Analysis o f fenoterol in real samples
The level of fenoterol determined directly in a commercially available
pharmaceutical product was 4.78 mg/ml fenoterol hydrobromide (n = 4, CV
= 3.81 %). This compares reasonably well with the stated level of 5.0 mg/ml.
At the 95 % confidence level, the value of t (experimental) was less than that
of t (theoretical) showing that the method has no systematic error.
For biological matrices, fenoterol was added in the following manner;
urine samples were fortified with fenoterol to achieve final concentrations of
2.5xlO'7M and 5 .0x l0 ‘7M, and serum samples were fortified with fenoterol
to achieve final concentrations of l.OxlO'6M and 5.0xl0'6 M. Figure 2.10
shows typical voltammograms of fenoterol in a serum extract and subsequent
standard additions. The results of these analyses are summarized in Table 2.3.
Good recovery was achieved from both sample types.
A paper by Rominger et al. indicates that urine samples containing
incurred residues of fenoterol (the availability of which were outside the scope

F
Figure 2.10 Differential pulse voltammograms o f fenoterol in BR buffer,pH 3.0 using a 0.5% Nafion electrode and the same experimental conditions as figure 2.7: (A) blank serum extract, (B) extract containing 5x1 O'6 M fenoterol and (C)-(F) additions of 6 (J,l of 1.0x1 O'4 M fenoterol (cell volume 20 ml)
-86-

SampleFenoterol added
(M) nlevel determined
(M) CV (%)Average %
recovery
Urine2.5xl0‘7 3 2.30xl0'7 11.3 91.8
5.0x1 O'7 3 4.62x1 O'7 2.95 92.4
Serum
1.0x10* 3 8.72xl0'7 3.05 87.2
5.0xl0‘6 3 3.92x1 O'6 6.41 78.3
Table 2.3 Results obtained for fenoterol-fortified urine and serum samplesafter using the extraction procedure and differential pulse voltammetry (conditions: 0.5% Nafion electrode, pH 3.0, pulse height 50 mV, scan rate 10 mV s'1, tacc 45 s ) .

of this project) are almost completely conjugated [25]. To ensure
determination of total fenoterol (i.e. free and conjugated), a deconjugation
procedure was recommended. A publication by van Ginkel et al. used sue
d’helix pomatia juice (enzyme solution) for the hydrolysis of glucuronide and
sulphate conjugates in urine samples [26]; samples were incubated with
buffer, pH 5.2 overnight (18 h) at 37°C. Such a procedure may be carried
out in fenoterol-incurred urine prior to extraction and the free form of the
compound analysed using the technique developed in this study.

2.4 CONCLUSIONS
The electrochemical behaviour of three /32-agonists on unmodified and
modified carbon paste electrodes has been reported. The compounds are
oxidised at high positive potentials on CPE’s (at pH 4.0, salbutamol +0.84
V, fenoterol +0.78 V, metaproterenol +0.89 V), giving rise to two
processes. The rate-controlling step is mainly diffusion controlled, although
adsorption processes are present for salbutamol and metaproterenol in low
concentrations, close to the limit of detection of the technique.
Application of a thin film of Nafion on the electrode surface allows the
preconcentration of the three compounds and increases the sensitivity of the
technique over bare carbon paste electrodes. An ion-exchange mechanism
between the protonated (positively charged) compounds and the negatively
charged Nafion membrane is observed in the pH range studied. Enhanced
signal at low pH values may be explained by a partition equilibrium (Donnan
equilibrium) which occurs when the Nafion membrane, saturated with protons,
remains neutral (S03'H +) and the analyte forms an ion-pair with a background
electrolyte anion. Cyclic voltammetry results show that the oxidation process
on Nafion films is diffusion-controlled. Such a phenomenon was also reported
by Hoyer et. al. in relation to metal ions on Nafion-modified glassy carbon
electrodes [15].

Epinephrine and isoproterenol, two compounds in this class posessing
an aromatic ring structure with two hydroxyl groups, were also evaluated for
their ability to adhere to Nafion films. However, results from these
experiments, using the same conditions described above, showed that both
compounds did not accumulate with time. A possible explanation for the non
accumulation for these compounds may be that only substances with an
aromatic ring which has three carbon atoms between the hydroxyl groups can
bind to the Nafion film (i.e. the S 03H group). The compounds studied have
this structural characteristic, whereas epinephrine and isoproterenol, possessing
only two carbon atoms between the hydroxyl groups, do not. To further
check on this theory, another /3-agonist, terbutaline, which has this three
carbon atom difference, was evaluated for its performance on the Nafion film.
This compound also accumulated with a response similar to that of fenoterol.
It is postulated therefore, that the Nafion electrode will accumulate those
compounds with the hydroxyl groups placed three carbon atoms apart on the
aromatic ring.
The higher affinity of salbutamol to Nafion films is an interesting
finding. While this compound has three carbon atoms between the hydroxyl
groups, it differs structurally from fenoterol and metaproterenol in the
positioning of one hydroxyl group on the aromatic ring and the other hydroxyl
group as a methanolic side-chain. It was postulated that this difference caused
higher accumulation of compound without saturating the electrode.

The NMCPE has been used successfully to determine fenoterol in
complex matrices. Optimum conditions were achieved with a BR buffer, pH
3.0 and a 0.5% Nafion film. Application of the electrode to a pharmaceutical
preparations was possible after a suitable dilution of the sample was made.
The solvent extraction procedure, developed for biological samples, proved to
be selective for fenoterol with good recoveries obtained at the levels tested.
This extraction procedure may be suitable for other resorcinol-type 0-agonists.
2.5 REFERENCES
1. J.R. Barrierra Rodriguez, A. Costa Garcia and P. Tunon Blanco,
Electrochim. Acta, 34 , 1989, 957.
2. G.A. Qureshi and A. Eriksson, J. Chromatogr., 4 4 1 , 1988, 205.
3. H. Hoojerink, R. Schilt, W . Haasnoot and D. Courtheijn, J. Pharm.
Biomed. Anal., 9, 1991, 485.
4. K.A. Sagar, M.R. Smyth and R. Munden, J. Pharm. Biomed Anal.,
11, 1993, 533.
5. B.G. Katzung, Basic and Clinical Pharmacology, Prentice Hall
International Ltd, London, 1989, p.3.
6. Y.K. Tan and S.J. Soldin, J. Chromatogr. (Biomed Applic.), 311,
1984, 311.
7. K.A. Sagar, C. Hua, M.T. Kelly and M.R. Smyth, Electroanalysis, 4 ,
1992, 481.
8. K.A. Sagar, M.T. Kelly and M.R. Smyth, J. Chromatogr. (Biomed.
Applic.), 115 , 1992, 109.
9. K.A. Sagar, M.T. Kelly and M.R. Smyth, Biomed. Chromatogr., 7,
1993, 29.
10. M.E. Rice, Z. Galus and R.N. Adams, J. Electroanal. Chem, 143,
1983, 89.
11. M.N. Szentirmay and C.R. Martin, Anal. Chem., 56 , 1984, 1898.

12. R.B. Moore, J.E. Wilkerson and C.R. Martin, Anal. Chem., 56,
1984, 2572.
13. J. Zhou and E. Wang, Anal. Chim. Acta, 249, 1991, 489.
14. J. Wang, P. Tuzhi and T. Golden, Anal. Chim. Acta, 194, 1987, 129.
15. B. Hoyer, T.M. Florence and G.E. Batley, Anal Chem., 59, 1987,
1608.
16. K. Itaya, H. Takahashi and I. Uchida, J. Electroanal. Chem., 208,
1986, 373.
17. Z. Lu and S. Dong, J. Chem. Soc. Faraday Trans., 84, 1988, 2979.
18. P. Audebert, B. Divisia-Blohorn, P. Aldebert and F. Michalak, J.
Electroanal. Chem., 322, 1992, 301.
19. K. Shigehara, E. Tsuchida and F.C. Anson, J. Electroanal. Chem.,
175, 1984, 291.
20. J.-Y. Sung and H.-J. Huang, Anal. Chim. Acta, 246, 1991, 275.
21. P. Capella, B. Ghasemzadeh, K. Mitchell and R.N. Adams,
Electroanalysis., 2, 1990, 175.
22. H. Huiliang, D. Jagner and L. Renman, Anal. Chim. Acta, 207, 1988,
17.
23. J. Litong, L.Shenghui, B. Zhuping and F. Yuzhi, Electroanalysis., 5,
1993, 611.
24. Z. Gao, P. Li, G. Wang and Z. Zhao, Anal. Chim. Acta., 241, 1990,
137.
-93-

25. K.L. Rominger, A. Mentrup and M. Stiasni, Arzneim.-Forsch Drug
Res., 40, 1990, 887.
26. L.A. van Ginkel, R.W. Stephany and H.J. Van Rossum, J. Assoc. Off.
Anal. Chem., 75, 1992, 554.
-94-

CHAPTER 3
DEVELOPMENT AND VALIDATION OF CLENBUTEROL
EXTRACTION FROM LIVER USING MATRIX SOLID PHASE
DISPERSION (MSPD) WITH DETERMINATION BY IMMUNOASSAY

3.1 INTRODUCTION
The /3-adrenergic agonist, clenbuterol, has been widely (but illegally)
used in beef production due to its growth enhancing capability when
administered to animals at multiple concentrations of the therapeutic dose.
Work by Meyer and Rinke has shown that liver tissue contains detectable
residues for 2 weeks after withdrawal of clenbuterol from the animals diet [1].
Rapid and efficient extraction techniques are essential, therefore, to control
illegal usage of clenbuterol and to ensure the safety of meat.
Current methodology for the extraction of clenbuterol residues in tissues
has been extensively reviewed in Chapter 1. To produce a sample extract
sufficiently purified for a chromatographic or immunological determination,
the analyst must perform extensive sample homogenisation, solvent extractions
and column chromatography. In addition to the obvious disadvantage of the
length of time required to perform these analyses, the methods require the
excessive use of hazardous organic solvents. Extractions based on solid phase
extraction (SPE) overcome the problems associated with large solvent usage.
For this technique a homogenised tissue sample is added to a suitable SPE
column and the compounds of interest are isolated from the other sample
components based on interactions with the column polymer phase.

This approach, while it leads to a reduction in the use of organic solvents,
does not eliminate labour-intensive steps such as sample homogenisation,
centrifugation and enzyme digestion.
Alternatives to the above approach have been investigated by Barker,
Long and co-workers at the Louisiana State University, USA. Their initial
research focussed on finding suitable tissue-adsorbing solid supports which
could retain the bulk of the sample matrix but expose the test analyte for
subsequent elution. They first evaluated the performance of diatomaceous
earth as a tissue dispersant; the sample was mixed with diatomaceous earth to
obtain a semi-dry column packing material from which drug compounds, e.g.
benzimidazole anthelmintics [2], were eluted. Further developments, based
on the same concept, were carried out using octadecylsilane (C18) material as
the tissue dispersant. The C18 material acts as both a solid support (the silica
base) and as a tissue solubiliser (the non-polar C18 moieties). Samples which
are mixed or blended with this material would be expected to disperse in such
a manner that the more neutral or lipophilic compounds would solubilise in the
polymer phase. Thus, triglycerides and the less polar ends of phospholipids,
steroids and other tissue components, would be expected to insert into the
phase that is bonded to the surface and pores of the silica particles (i.e. the C18
phase). More polar components would associate through hydrophilic
interactions with themselves and with the more polar ends of the compounds
already inserted in the polymer.

Scanning and transmission electron microscopy studies of the uncoated
and tissue-coated C18 material surface showed that the mechanical blending
action disrupts the organelle structure within the tissue. This allows the more
hydrophilic regions of proteins and moderate to polar drugs to extend
outwards away from the non-polar C18/lipid region. Water also associates
with these hydrophilic ends. In practice, tissue sample (0.5 g) and C18
material (2.0 g) are blended, using a mortar and pestle, for between 30 and
40 seconds. The resulting mixture is packed into a plastic column to a volume
of 4.5 ml and wash/elution solvents are added to separate the analyte(s) from
sample components. Figure 3.1. illustrates the structure of a prepared
column.
Barker and co-workers have published a wide range of extractions
based on MSPD methodology. In many cases an assay was developed for the
isolation of a single compound (e.g. ivermectin [3], chloramphenicol [4]). In
others, the methods were developed to isolate a class of compounds
(benzimidazoles [5], halogenated pesticides [6]) or several compound classes
(organophosphates and beta-lactams [5]) from a sample. The versatility of the
procedure to isolate a wide range of unrelated compounds is best demonstrated
in reference [5]. Residues (pesticides, anthelmintics and antibiotics in order
of increasing polarity) were fractionated using an non-polar solvent (hexane),
a semi-polar solvent (ethyl acetate) or a solvent of high polarity (methanol).
Extracts were determined by GC-nitrogen phosphorus detection or HPLC

1
Syringe barrel
C18 Tissue blend
Figure 3.1 A prepared MSPD column.
-99-

-photo diode array detection. A similar procedure was used to extract eight
sulphonamides from pork tissue [7]. In this case hexane was used as a wash
solvent and sulphonamides were eluted with dichloromethane. Small
modifications in the MSPD procedure were reported by Long et al. [8], who
proposed the addition of activated florisil to the MSPD column to adsorb fats
and water, and Schenk et al. [3], who introduced a post-MSPD alumina SPE
step for improved sample clean-up. The tissue disruption and distribution and
the subsequent elution profile from an MSPD column may be influenced by
blending the sample in the presence of acids, bases, salts, chelators or other
modifiers. For example, tetracyclines are obtained in higher recovery by
incorporating oxalic acid and other chelating agents (such as EDTA) into the
MSPD column [9, 10]. Thus, the polarity of the target compound may be
altered by protonation or deprotonation so as to cause a drug or metabolite to
be retained longer or eluted earlier. MSPD methodology is not reserved
solely for tissue samples; some publications report MSPD extraction of
antibiotics [4], benzimidazoles [11] and the herbicide, chlorosulfuron, [12],
from milk samples. Work at the National Food Centre (Dublin) has extended
the application of MSPD for sulphonamide analysis through its linkage with
a TLC determination step to provide a kit method for use in industry [13, 14].
Other applications developed by the NFC and associated laboratories have
been for ivermectin in fish [15] and gestagens in tissue [16]. A general
summary of the applications of MSPD for a range of analytes, based on their

polarity, is shown in Figure 3.2. This study demonstrates the extension of the
MSPD method to the extraction of (8-agonists from liver samples. Residues
extracted by MSPD are normally determined by chromatographic-based
techniques like HPLC and GC. This is due, mainly, to the multianalyte
detection capability of these techniques, and also because the detection limits
required are relatively high (10-100 ppb). To monitor clenbuterol, in the
context of illegal usage, such detection limits are unsuitable (the MRL for
clenbuterol set by the UK is 0.5 ppb). Immunoassays are commonly used to
determine residues of banned substances (e.g. steroids). Coupled with an
efficient extraction procedure, immunoassay techniques have the capability to
measure residues as low as 10 ppt [17]. The two immunoassay procedures
most used in the field of drug residue analysis have been radioimmunoassay
(RIA) and enzyme immunoassay (EIA).
Radioimmunoassays for the quantitative detection of small molecular
analytes such as veterinary drugs generally employ tritiated antigens and
specific antibodies. A fixed amount of radiolabelled antigen is added to the
sample extract and following competitive binding by an antibody, the bound
complex is separated (demonstrated in Figure 3.3). The level of radioactivity
is determined in the bound complex. To quantify the level of unlabelled
antigen (the analyte) in the sample extract, a calibration curve is prepared
using a range of standards which compete with the radiolabelled antigen for
binding to the antibody. Fewer radiolabelled molecules are bound to the

MATRIX SOLID PHASE DISPERSION
F ig u re 3.2
SUITABLE APPLICATIONS
TISSUE/C1a
t
HEXANE
DICHLOROMETHANE
ETHYL ACETATE
ACETONITRILE
METHANOL
WATER
BLEND
ORGANOPHOSPHORUS
PESTICIDES
SULPHONAMIDE
ANTIBIOTICS
CHLORAMPHENICOL
ANTIBIOTIC
BENZ1MIDAZOLE
ANTHELMINTICS
ORGANOCHLORIDE
PESTICIDES
CLENBUTEROUSALBUTAMOL
PENICILLIN, AMPICILLIN
The extraction of an analyte from an MSPD column depends on the selection of an organic solvent o f similar polarity.
-102-

Ag
Ag
F igu re 3.3
+ Ab At
equilibrium
AgAb Ag
+
Ag*Ab Ag*
Boundfraction
▼Free
fraction
Principle o f radioimmunoassay: Ag = unlabelled antigen; Ag = radiolabelled antigen; Ab = antibody; AgAb = antigen-antibody complex.
-103-

antibody as the concentration of the unlabelled antigen increases and
consequently, a lower signal (i.e. radioactivity) is counted. The resulting
standard curve between antibody-bound radiolabelled antigen (%) against
concentration of unlabelled antigen is sigmoid in nature. The procedures
leading to the production of antiserum have been discussed in Chapter 1
(section 1.3.3). The antiserum is then tested for titre (a measure of the
concentration of cross-reacting antibodies in the serum) and specificity (the
measure of the exclusiveness of cross-reactivity to the analyte(s) of interest).
In addition to polyclonal antiserum (i.e. antibodies derived from several clones
of lymphocytes) as described in Chapter 1, monoclonal antiserum (i.e.
antibodies derived from a single clone of lymphocyte) may be prepared and
used in the RIA procedure.
The labelling of antigens is generally accomplished by the replacement
of carbon, hydrogen or iodine with 14C, 3H or 125I, respectively. For RIA
procedures for the determination of small molecules, however, labelling with
tritium [3H] is most common as Iodine [125I] is a large molecule which can
interfere with antibody binding. It is essential for efficient RIA that the
radiolabelled and unlabelled antigen have equal affinity for the antibody. One
particular RIA procedure which utilises the [125I] -analyte tracer is that
described by Rominger et al. for the determination of fenoterol [17]. For
radioimmunoassay, the antisera is diluted to a concentration where it binds
with 50% of the selected concentration of radiolabelled antigen. This situation

represents the optimum for competition when the standards or sample extracts
are introduced into the RIA procedure.
The first RIA procedure, prepared for determination of clenbuterol
residues (in the context of illegal usage) was developed by Delahaut et al.
[18]. As in other immunoassay procedures (both RIA and EIA), the
immunogen was prepared by the method of Yamamoto and Iwata [19]. The
antiserum was specific for clenbuterol with lower cross-reactivity to
salbutamol, terbutaline and cimaterol (< 10% relative to clenbuterol). Loo
and co-workers developed a RIA procedure, using a radiolabelled [3H]-
salbutamol antigen, specific only for salbutamol (but not salbutamol
conjugates) in plasma extracts [20]. Adam et al. also reported a RIA
procedure for salbutamol, but using a monoclonal antibody [21].
Interestingly, the antibody showed a high cross-reactivity to clenbuterol
(75 %). Rominger et al. used an RIA procedure which had an antibody cross
reacting with the different sterioisomers of fenoterol; this compound was
detected in biological fluid extracts at the sub ppb level [17].
Enzyme-linked immunosorbent assay (ELISA) provides an alternative
to the RIA procedure and has become the more favoured technique in the field
of residue analysis. There are advantages in using ELISA over RIA; the
availability of cheap and commonly available equipment and the absence of
radiolabelled compounds and scintillation solvents. Figure 3.4 shows different
types of ELISA’s applied in residue analysis. The choice of enzyme and its
-105-

B/ / // / / / / / / / / / /
[>--
S x l> '<iv
O'".
kD
s
/ / / / / / / / /
Q
0
solid phase - { e} : enzyme label
analyte (macromolecule) S : substrate
\ i /
analyte (hapten) : co*our development/ 1 *
analyte (hapten) coupled : competitionto carrier protein
YY=antibodies
F igure 3 .4 Schematic presentation of different ELISA systems applied infood/residue analysis: A: sandwich ELISA, B: competetive ELISA using enzyme-labelled analyte, C: competetive enzyme-labelled antibody.

specific activity are primary considerations in relation to assay sensitivity as
it will determine the strength of the signal at the assay end-point. Typical
enzymes used are /3-galactosidase, alkaline phosphatase and peroxidase. The
enzyme is conjugated to either the antigen or antibody through a lysine amino
group of the enzyme or, where glycoprotein enzymes such as peroxidase are
used, through carbohydrate groups.
The first EIA for clenbuterol was developed by Yamamoto and Iwata
[19], a double-antibody and heterogenous immunoassay based on competition
for binding between clenbuterol and its /3-D-galactosidase-labelled analogue for
a limited amount of antibody, followed by binding of the enzyme-labelled
analogue and a second antibody. The activity of the bound enzyme was
determined fluorometrically after addition of substrate. Degand et al. used an
EIA procedure with a clenbuterol-horseradish peroxidase (HPO) enzyme
conjugate to measure clenbuterol in bovine tissues at less than 1 ppb [22].
EIA kits containing salbutamol-based enzyme conjugates, salbutamol-4-
carboxymethylether-HPO [23] or salbutamol hemisuccinate-HPO [24,25] were
used to determine clenbuterol in urine and tissue samples. Multi-/3-agonist
EIA kits containing antiserum directed against a number of compounds have
also been developed [26, 27]. A more rapid approach to /3-agonist testing may
be achieved using an "on-site" test strip enzyme immunoassay. The antibodies
were prepared as previously described [19] and the clenbuterol conjugate was
clenbuterol horseradish peroxidase. Determination of clenbuterol in urine
-107-

samples down to 5 ng/ml, was achieved by the visual appearance of a blue
colour on the strip [28], In this following study, a competitive double
antibody ELISA was used to determine clenbuterol after MSPD extraction
from liver. The ELISA kit contained an anti-immunoglobulin (IgG) antibody,
immobilised on the surface of the microtiter wells. When the anti-clenbuterol
antibody, the clenbuterol standard (or sample extracts) and the clenbuterol
enzyme substrate were added to the wells, two mechanisms occurred;
competition between the clenbuterol and enzyme-labelled clenbuterol for
binding to the anti-clenbuterol antibody and binding of this antibody by the
immobilised anti-IgG antibody. After washing, to remove unbound material,
a substrate was added to produce a coloured product which was measured
spectrometrically.
For the work carried out in this study, both RIA and EIA
(commercially available as kits) were employed to detect clenbuterol in liver
extracts produced by MSPD. Both techniques report determination limits of
less than 1 ng clenbuterol per gram of liver.

3.2 EXPERIMENTAL
3.2.1 Reagents and Equipment
Hexane (’extra pure’ grade) and ethanol (absolute) from Merck
(Darmstadt, Germany), dichloromethane and methanol (’Hypersolv’ grade)
from BDH (Poole, UK) and double-distilled water were used. Other
chemicals used were Analar grade from BDH, or equivalent. Clenbuterol
hydrochloride from Sigma (St. Louis, MO, USA) was used for fortification
of samples.
Immunoassay kits used for determination of clenbuterol were the
following: (a) Radioimmunoassay kit, supplied by Laboratoire
d’Hormonologie (Marloie, Belgium) was used for determination of
clenbuterol. The [3H]-clenbuterol in this kit, with a specific activity of 13
Ci/mmol (481 GBq/mmol), was used for method optimisation. The
clenbuterol antiserum in the kit has principal cross-reactivities (relative to
100% for clenbuterol) of 9% (terbutaline), 7.7% (salbutamol, free base),
6.8% (salbutamol, sulphate salt), 2.75% (cimaterol) and 0.11% (pirbuterol).
(b) Enzyme-immunoassay kit supplied by R-Biopharm (Germany) with
antiserum which had been raised against clenbuterol and had principal cross
reactivities relative to 100% for clenbuterol of 71% (mabuterol), 11%
(salbutamol), 6% (terbutaline) and 6% (cimaterol).
-109-

For the radioimmunoassay 0.01 M phosphate buffer (pH 7.0),
containing 1 g/1 gelatin and 0.1 g/1 thiomersal, was used. Dextran-coated
charcoal was prepared by adding 2 g activated charcoal (Sigma) and 0.25 g
dextran T70 (Pharmacia, Uppsala, Sweden) to 500 ml double-distilled water.
The scintillation cocktail was Cocktail T (BDH). Preparative grade Bondesil
Cjg (40 jum) packing material, supplied by Analytichem International (Harbor
City, CA, USA) was used for the extraction procedure. This material was
prepared by placing it in a plastic syringe barrel (50 ml) and washing
sequentially with two column volumes each of hexane, dichloromethane and
methanol and drying by vacuum aspiration [6]. Extraction columns were
prepared in prewashed plastic syringe barrels (10 ml) and qualitative filter
paper discs (No. 1, Whatman, Maidstone, UK) were used as frits.
3.2.2 Apparatus
A LKB Wallac 1219 Rackbeta liquid scintillation counter was used to
count the radioactivity present in extracts from the MSPD procedure.
Absorbance measurements on samples determined by EIA were carried out
using a Dynatech Minireader with a 410 nm filter.
-110-

3.2.3 Methods
3.2.3.1 Samples and Sample Preparation
All samples of bovine liver were stored frozen, until assay. Liver
samples from animals certified as not treated with clenbuterol were
homogenised for use in fortification studies and for production of liver extract
to be used in the standard curve.
3.2.3.2 Fortification
The method was optimised by extraction of samples fortified with 193
Bq [3H]-clenbuterol per 0.5 g tissue. The method was validated by analysis
of samples fortified with clenbuterol; levels of 0.5, 1.0 and 2.5 ng clenbuterol
in 10 fi 1 ethanol, were added to 0.5 g tissue prior to extraction. Fortification
was carried out by pipetting the material on to the surface of the sample and
leaving for 10 minutes prior to extraction.

3 .2 .3 .3 Extraction
0.5 g liver was weighed into a glass mortar and 10 fA ethanol or an
appropriate clenbuterol solution added. 2 g of the C18 packing material was
added to the mortar and blended with the tissue by mixing with a pestle for 40
seconds. The mixture was removed from the mortar and transferred to a 10
ml syringe barrel containing two filter paper discs and with a 100 ¡A pipette
tip attached to its outlet. The syringe barrel was tapped to settle the mixture
and two filter paper discs were placed on top of the mixture. The mixture
was compressed to a volume of 4.5 ml with a syringe plunger (from which the
rubber seal and pointed plastic retainer had been removed). The column was
washed with 8 ml of hexane and 8 ml of double-distilled water. After each
wash solvent had flowed through the column, positive pressure was applied to
the top of the syringe barrel with a pipette bulb to remove surplus solvent.
8 ml of methanol was then added to the column, the first 1 ml of eluate
(mainly water) was discarded and the remaining eluate collected. This eluate
was evaporated to dryness under a stream of nitrogen, at 55°C on a sample
concentrator, and redissolved in 0.5 ml of ethanol (for RIA procedure) or 1.0
ml of water (for EIA procedure).

3 .2 .3 .4 Radioimmunoassay procedure
Standard curves (10 to 1000 pg clenbuterol per tube) were prepared
both with and without tissue extract. The extract-containing curve was
prepared by the addition of 0.1 ml of a pooled extract of control tissue
samples to each standard tube. 0.1 ml of sample extracts were assayed, in
duplicate. The contents of all tubes were evaporated to dryness under a
stream of nitrogen at 40°C and 0.5 ml of phosphate gelatin buffer was added.
After vortexing and incubation for 15 minutes at 37°C, 0.1 ml [3H]-clenbuterol
and 0.1 ml antiserum were added. The tubes were incubated at 37°C for 15
minutes and overnight at 4°C. 0.5 ml of dextran-coated charcoal suspension
was added to separate bound from free clenbuterol and the tubes were
centrifuged at 2000 rpm for 10 minutes. The supernatant was decanted into
scintillation vials, 10 ml of scintillation cocktail was added and the
radioactivity counted.
3.2.3.5. Enzyme immunoassay
The following solutions were added to the wells of the microtiter plate;
0.1 ml of enzyme conjugate, 0.020 ml of standard clenbuterol (0-162 ng/ well)
or sample extract and 0.1 ml of antiserum. The microtiter plate was
subsequently vortexed and incubated overnight at 5°C. After emptying and

washing the wells, 0.050 ml aliquots of substrate and chromogen were added
and the microtiter plate incubated at room temperature for 30 minutes.
Finally, 0.1 ml of stop solution (1.0 M sulphuric acid) was added and the
absorbance measured using a 410 nm filter.
3.3 RESULTS AND DISCUSSION
3.3.1 Method optimisation
A range of solvents of differing polarities were evaluated for their
capacity to elute [3H]-clenbuterol from the MSPD column. 8 ml volumes of
each solvent were used as such a volume has been found suitable in previous
studies with the MSPD technique [5, 7]. The [3H]-clenbuterol was not
removed from the column by non-polar solvents, such as hexane, and was
only partially removed by solvents of intermediate polarity, such as
dichloromethane and diethyl ether. Polar solvents, such as methanol, were
found to give almost complete recovery of added [3H]-clenbuterol. The [3H]-
clenbuterol was not removed from the column with water. Figure 3.5 shows
elution profiles for [3H]-clenbuterol from the columns, obtained by counting
0.5 ml fractions of the methanol eluate. Most of the [3H]-clenbuterol is
recovered in the second to fourth ml of the methanol eluate and the first ml,

RADI
OA
CTIV
ITY
(cp
m)
(Th
ou
san
ds)
0.5 1 1.5 2 2.5 3 3.5 4 4.5 5 5.5 6 6.5 7 7.5 8
METHANOL ELUATE (m l)
Figure 3.5 Elution o f tritiated clenbuterol from the MSPDcolumn.
-115-
which is mostly water retained from the aqueous wash step, can be
discarded. A suitable clean-up and extraction procedure was the following:
the column was washed with 8 ml hexane (to remove non-polar interferences)
and 8 ml water (to remove polar interferences) prior to elution with 8 ml
methanol. Using these conditions, recovery of [3H]-clenbuterol in the
methanol fraction was 101.9% (± 6 .0 % , n = 6).
3.3.2 Method validation by radioimmunoassay
Standard curves for radioimmunoassay were prepared both with and
without tissue extract. For the extract-containing curves, sufficient 0.5 g
aliquots of a control liver sample were extracted by the MSPD procedure to
give a pool of liver extract for the curve. 0.1 g equivalent of control sample
extract was added to each standard tube. Figure 3.6 shows the standard
curves (calculated from 8 separate assays) prepared with and without tissue
extract. Good parallelism between the curves was found, indicating that a
curve without tissue extract may be used. The value for the control liver
extract in standard curves without extract was 23.6 pg/tube ( + 3 .4 pg, n =
The inter- and intra-assay variations of the method are shown in Tables
3.1 and 3.2, respectively. Results are presented for radioimmunoassay
standard curves both with and without tissue extract. Good recovery of

■BO
UND
RAD
IOAC
TIVI
TY
(cp
m)
(Th
ou
san
ds)
Figure 3.6 Radioimmunoassay standard curves; □ = with extract; + = without extract.

Clenbuterol determined (ng/g)Clenbuterol .___ ____________________
added n (a) (b)(ng/g) ------------------------------------ ----------------------------------
mean ± SD CV (%) mean ± SD CV (%)
1
2
5
6 0.98 ±0.12
6 1.94 ±0 .26
6 4.99 + 0.84
12.3
13.2
16.9
0.93 ±0.18
1.71 ± 0.32
3.70 ± 0.60
19.3
18.8
16.1
Inter-assay variation for MSPD/RIA determination of clenbuterol in liver; results are calculated on standard curves with (a) and without (b) tissue extract.
ClenbuterolClenbuterol determined (ng/g)
added(ng/g)
n (a) (b)
mean ± SD CV (%) mean ± SD CV (%)
1 6 1,16 ± 0.07 5.9 0.91 ± 0.05 4.9
5 6 4.69 ± 0.60 12.7 3.88 ± 0.35 8.9
T ab le 3.2 Intra-assay variation for MSPD/RIA determination o f clenbuterol,in liver; results are calculated on standard curves with (a) and without (b) tissue extract.
-118-

clenbuterol (97%-99%) was achieved for extracts measured against the
standard curve containing extract (Table 3.1). For extracts measured against
an external standard curve, good recovery of residue was obtained for 1 ng/g
(93%) and 2 ng/g (86%), but lower recovery was determined for the 5 ng/g
(74%) level. This apparent low recovery is due to inaccuracy of the
radioimmunoassay rather than to losses in the extraction procedure; a
relatively high non-specific binding (NSB) value occurs in extracts prepared
by the MSPD procedure and its negative influence on quantitation increases
with concentration of analyte in the extract. The intra-assay results (Table
3.2) show acceptable variation within a single assay for samples fortified at 1
and 5 ng/g.
Overall, high recovery of clenbuterol is obtained from the MSPD
column and may be determined in a standard curve prepared with or without
tissue extract addition. Use of a standard curve without tissue extract is
normally preferred due to the decreased number of tissue samples required to
be processed by MSPD and, hence, the reduced time and cost of the assay.
3.3.3 Method validation by enzyme immunoassay
Fortified sample extracts containing 1, 2 and 5 ng/g clenbuterol were
determined by EIA and results are shown in Table 3.3. The clenbuterol
content in the extracts was measured using a clenbuterol standard curve

without tissue extract and, overall, the estimation of clenbuterol recovery
(84% -96%) was higher than that obtained by an equivalent RIA measurement
(74%-93% , see Table 3.1).
3.3.4 Sample analyses
Table 3.4 shows the results for analysis of samples containing incurred
clenbuterol. The levels determined by the MSPD procedure, using standard
curves with and without tissue extract, are compared with results obtained by
a solvent extraction method [29]. This method consists of protease digestion
of the sample (55 °C for 2 h), multiple extractions with diethyl ether and
determination of the clenbuterol in the extract by radioimmunoassay. Good
comparison between the two methods was found. The coefficient of variation
(CV) for analysis of residue-positive samples by MSPD/RIA was found to be
10-11% (Table 3.4); This compares well with the solvent extraction method
for which a CV value of 17.4% was obtained for a quality control sample
(mean = 0.33 ng/g, SD = 0.058, n = 6).
3.3.5 Limit o f detection
A tentative limit of detection for the MSPD procedure was determined
by RIA analysis of liver samples free of clenbuterol residue. The mean value
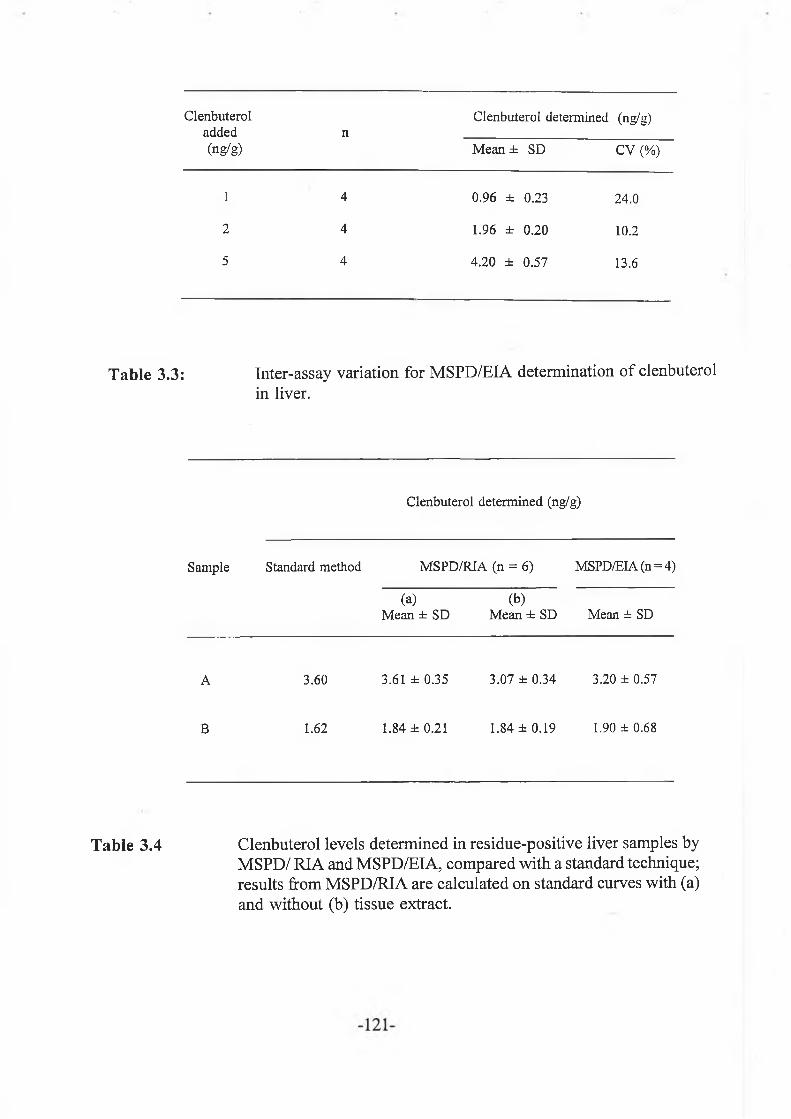
Clenbuteroladded(ng/g)
nClenbuterol determined (ng/g)
Mean ± SD CV (%)
T a b le 3.3:
Table 3.4
1 4 0.96 ± 0.23 24.0
2 4 1.96 ± 0.20 10.2
5 4 4.20 ± 0.57 13.6
Inter-assay variation for MSPD/EIA determination of clenbuterol in liver.
Clenbuterol determined (ng/g)
Sample Standard method MSPD/RIA (n = 6) MSPD/EIA (n = 4)
~ ( ¡ ) (bjMean ± SD Mean ± SD Mean ± SD
A 3.60 3.61 ± 0.35 3.07 ± 0.34 3.20 ± 0.57
B 1.62 1.84 ±0.21 1.84 ±0.19 1.90 ± 0.68
Clenbuterol levels determined in residue-positive liver samples by MSPD/ RIA and MSPD/EIA, compared with a standard technique; results from MSPD/RIA are calculated on standard curves with (a) and without (b) tissue extract.

for these samples was 0.18 ng/g (+. 0.04 ng/g, n = 8), determined in a
standard curve without tissue extract; the limit of detection, calculated as the
mean plus 3 times the standard deviation, was 0.30 ng/g. Assay of a much
larger number of clenbuterol-free samples (for example n = 50 [30]) would
be required to give a robust limit of detection for the method.

3.4 CONCLUSIONS
The MSPD technique has been developed successfully for application
to the analysis of clenbuterol in liver samples. Satisfactory results were
obtained when the determination of residue levels was by radioimmunoassay
(either with or without tissue extract) and enzyme immunoassay. In the
former case, the use of a standard curve without tissue extract is preferred
because of the reduced time and cost of the assay. Recovery of clenbuterol
from fortified samples was greater than 70% (in most cases around 90%) and
results for samples containing incurred residues compared well with a solvent
extraction method [26]. The developed technique offers a simple, rapid
procedure for assay of clenbuterol in tissue samples. The MSPD technique
can be applied to assay of residues at levels of 0.5 ppb, or lower, and suitable
extracts are produced from the technique for determination by immunoassay.
The MSPD method eliminates many of the problems associated with
classical isolation techniques. The method uses small sample sizes (0.5 g),
has a minimal number of steps, requires no chemical manipulations (such as
pH adjustments) and requires low solvent usage (16 ml). Conversely, a
typical solvent extraction method used requires 5.0 g of sample,
homogenisation of the sample, protease digestion, a minimum of 30 ml of
diethyl ether, pH adjustments and multiple extractions. For a typical
analytical run of 10 to 20 samples, the MSPD procedure takes slightly more

than half the operator time required for a solvent extraction procedure.
The inclusion of incurred liver samples in the study provides a better
validation of the MSPD method. The bulk of the previously reported MSPD
methods do not include such data, due mainly to the time and expense
involved in treating animals. The drawback of reporting methods based only
on fortified samples is that no account is taken of the form in which the
residue may be present in the tissue matrix. Hence there may be a different
degree of extraction between fortified and incurred samples. In the described
MSPD method for clenbuterol the combination of high analyte recovery and
good comparability with an alternative procedure for incurred samples,
suggests that both residue types (i.e. fortified and incurred) are extracted .

3.4. REFERENCES
1. H.H.D. Meyer and L. Rinke, in Proceedings of the 51st Easter School
in Agricultural Science: The Control o f Fat and Lean Deposition,
University of Nottingham, April 1991, p. 61.
2. S.A. Barker, L. Hsieh and C.R. Short, Anal. Biochem., 155, 1986,
112.
3. F.J. Schenk, S.A. Barker and A.R. Long, J. Assoc. Off. Anal. Chem.,
75, 1992, 655.
4. A.R. Long, L.C. Hsieh, A.C. Bello, M.S. Malbrough, C.R. Short and
S.A. Barker, J. Agric. Food Chem., 38, 1990, 427.
5. S.A. Barker, A.R. Long and C.R. Short, J. Chromatogr. , 475, 1989,
353.
6. A.R. Long, M.M. Soliman and S A . Barker, J. Assoc. Off. Anal.
Chem., 74, 1991, 493.
7. A.R. Long, L.C. Hsieh, M.S. Malbrough, C.R. Short and S.A.
Barker, J. Agric. Food Chem., 38, 1990, 423.
8. A.R. Long, M.D. Crouch and S.A. Barker, J. Assoc. Off. Anal.
Chem., 74, 1991, 667.
9. A.R. Long, L.C. Hsieh, M.S. Malbrough, C.R. Short and S.A.
Barker, J. Assoc. Off. Anal. Chem., 73, 1990, 379.
10. A.R. Long, L.C. Hsieh, M.S. Malbrough, C.R. Short and S.A.
Barker, J. Assoc. Off. Anal. Chem., 73, 1990, 864.

11. A.R. Long, L.C. Hsieh, M.S. Malbrough, C.R. Short and S.A.
Barker, J. Assoc. Off. Anal. Chem., 75, 1989, 739.
12. A.R. Long, L. C. Hsieh, M.S. Malbrough, C.R. Short and S.A.
Barker, J. Assoc. Off. Anal. Chem., 72, 1989, 813.
13. P. Shearan, M. O’Keeffe and M.R. Smyth, Food Addit. Contam., 11,
1994, 7.
14. P. Shearan and M. O’ Keeffe, Analyst (1994), in press.
15. E. Iosifidou, P. Shearan and M. O’Keeffe, Analyst (1994), in press.
16. J. Rosen, K.E. Hellenas, P. Tornquist and P. Shearan, Analyst (1994),
in press.
17. K.L. Rominger, A. Mentrup and M. Stiasni, Arzneim.-Forsch/Drug
Res., 40, 1990, 887.
18. Ph. Delahaut, M. Dubois, I. Pri-bar, O. Buchman, G. Degand and F.
Ectors, Food Addit. Contam., 8, 1991, 43.
19. I. Yamamoto and K. Iwata, J. Immunoassay, 3, 1982, 155.
20. J.C.K. Loo, N. Beaulieu, N. Jordan, R. Brien and I.J. Me Gilveray,
Res. Comm. Chem. Path. Pharm., 55, 1987, 283.
21. A. Adam, H. Ong, D. Sondag, A. Rapaille, S. Marleau, M. Bellemare,
Ph. Raymond, D. Giroux, J.K. Loo and N. Beaulieu, J. Immunoassay,
11, 1990, 329.
22. G. Degand, A. Bernes-Duyckaerts and G. Maghuin-Rogister, J. Agric.
Food Chem., 40, 1992, 70.
-126-

23. H.H.D. Meyer and L.M. Rinke, J. Anim. Sei., 69, 1991, 4538.
24. W. Haasnoot, A.R.M. Hamers, G.D. van Brachem, R. Schilt and
L.M.H. Frijns, in M.R.A. Morgan, C.J. Smith and P.A. Williams
(eds.), Food Safety and Quality Assurance-Applications o f Immunoassay
Systems, Elsevier, London, 1992, 237.
25. W. Haasnoot, S.M. Ezkerro and H. Keukens, in Proceedings of the
EuroResidue 2 Conference, The Netherlands, May 3-5, 1993, 347.
26. R. Angeletti, M. Paleologo Oriundi, R. Piro and R. Bagnati, Anal.
Chim Acta, 275, 1993, 215.
27. M. Paleologo-Oriundi, G. Giacomini, F. Ballaben, F. Berti, F.
Benedetti, R. Bagnati and E. Bastiani, FoodAgric. Immunol., 4, 1992,
73.
28. M.E. Ploum, W. Haasnoot, R.J.A. Paulussen, G.D. van Brachem,
A.R.M. Hamers, R. Schilt and F. A. Huf, J. Chromatogr. (Biomed.
Applic.J, 564, 1991, 413.
29. W.J. McCaughey. personnal communication.
30. C.T. Elliot, W.J. McCaughey and H.D. Shortt, Food Addit. Contam.,
10, 1993, 231.
-127-

CHAPTER 4
MATRIX SOLID PHASE DISPERSION (MSPD) AS A MULTIRESIDUE
EXTRACTION PROCEDURE FOR /3-AGONISTS IN BOVINE LIVER
WITH DETERMINATION BY IMMUNOASSAY

4.1 INTRODUCTION
The work on MSPD described in the previous chapter
demonstrated the suitability of the technique for the extraction of polar
compounds. Clenbuterol is not extracted from the MSPD column with non
polar solvents and is only partially removed with solvents of intermediate
polarity: the compound elutes fully only in methanol. Other compounds in
the /3-agonist class, with similar structures and polarity characteristics to
clenbuterol, would be expected to elute from the column in methanol; aniline-
type compounds like mabuterol and cimaterol differ only in the type of
substituents attached to positions 3 and 5 in the aromatic ring and on the
substituent attached to the iso-propyl group on the aliphatic part of the
molecule (cimaterol only). Cimaterol, in particular, needs to be monitored,
as it performs as a very efficient repartitioning agent in a similar way to
clenbuterol [1]. Salbutamol has also been administered illegally to animals;
data from Furst et al. indicates widespread use of this substance as a growth
enhancing agent in beef production [2]. Moreover, because it has a shorter
half-life than the aniline-type /3-agonists, it would be more difficult to detect.
Since the above mentioned compounds, as well as new related compounds, are
frequently detected and identified as growth enhancing agents, it appears
necessary to move away from monitoring individual compounds and develope,
as far as possible, multi-residue analysis methods.

Because /3-agonists as a class contain substances of differing chemical
properties, variable recoveries from multiresidue methods are usually reported.
Optimisation of the residue extraction procedure for clenbuterol-like /3-agonists
can result in a reduced recovery for salbutamol-like substances [3-5]. In the
paper by Leyssens et al. [3], using a combination of sample clean-up
techniques for liver, reasonable recoveries of mabuterol and clenbuterol were
achieved (85% and 60% respectively), but the recovery of salbutamol,
terbutaline and fenoterol was poor (< 35%). The method reported by van
Ginkel et al. [4], which uses adsorption column solid-phase extraction (SPE)
and immunoaffinity chromatography, gives rise to better salbutamol recovery
(40-50%), but overall it was still low compared to the aniline-type compounds
(60-70%). A recent paper by Montrade et al. which adopted a "mixed phase"
SPE clean-up of urine samples gave reasonable extractability of thirteen /3-
agonists, including some phenolic-type compounds (e.g. 65% for ractopamine
and 59% for fenoterol), but again for salbutamol, metaproterenol, and related
substances poor recoveries were obtained (< 35 %)[5].
Matrix solid phase dispersion (MSPD) provides an alternative extraction
methodology for a multi-residue analytical approach to analysis. In this
extraction method sample matrix components are dispersed over a large
surface area and, simultaneouly, lipid materials and internal membrane lipids
associate with the C18 material to essentially unfold the structural components.
This process allows the more polar compounds (including drug components)

to extend outwards and make them more extractable into organic solvents.
The majority of MSPD publications report multiresidue extraction procedures,
mostly of veterinary drugs and pesticides. Components of different classes are
fractionated from the MSPD column with different solvents depending on their
polarity. A paper by Barker and co-workers [6] demonstrates this versatility:
residues of pesticides, anthelmintics and antibiotics were fractionated from the
MSPD column (containing bovine muscle-C18 blend) with hexane/benzene,
ethyl acetate and methanol, respectively. Recovery of the components,
analysed by high performance liquid chromatography, was in most cases
greater than 70%. For the extension of MSPD methodology to /3-agonist
determinations, the water wash step used for clenbuterol extraction (see
Chapter 3) was liable to remove hydrophilic compounds, for example
salbutamol. This proved to be the case for certain brands of CIg material. An
alternative option was the linkage of MSPD and SPE, thereby avoiding the
necessity for a water wash step. Such an approach was also adopted by
Schenk et al. for the isolation of ivermectin in muscle tissue samples [7].
This chapter examines both options (with and without a water wash step), with
the ultimate aim of developing a robust and sensitive procedure with good
extraction capability for a variety of /5-agonists in liver tissue.
Procedures which aim to determine phenolic-type /3-agonists must
provide an additional hydrolysis step to deconjugate residues present in
biological samples. Compounds with a catechol structure, like rimiterol and
-131-

isoprenaline, are metabolised by an O-methylation reaction which occurs at
positions 3 and 4 on the aromatic ring (see Figure 4.1). Compounds such as
salbutamol, with a phenolic ring structure, are usually metabolised to sulphate
(and to a lesser extent, glucuronide) conjugates. The resorcinol /3-agonists,
like terbutaline and fenoterol, are also conjugated in this way, but in the case
of compounds such as clenbuterol and mabuterol sulphate conjugation cannot
take place. The effect of such conjugation means that the compounds have
very short half-lives (e.g. 0.02 h for rimiterol in man) and hence are
eliminated rapidly from the body. For the use of /3-agonists as repartitioning
agents, drugs with a long half-life are more practical as the active compound
persists longer in the treated animal. This may explain why compounds like
clenbuterol (with a half-life of 7 h in man) and cimaterol are often chosen as
growth enhancing substances in preference to salbutamol, terbutaline etc.
However there does not always seem to be a direct relationship between
duration of the effect and the half-life of the drug [8].
Conjugated residues pose particular problems in residue analysis:
(a) the conjugates may not extract as well as the free compounds due to their
increased polarity; and (b) the antiserum used in the immunoassay which is
directed against the free compound may have no (or a lower) cross-reactivity
to the conjugate. Hydrolysis studies have been carried out with aniline-type
/3-agonists to confirm that these compounds do not occur as conjugates. For
clenbuterol-incurred urine samples, the amount of drug found following

(PST)[glucuronidation] o h h 2c
^OH, — O U
CH,
NH — C — CH,
F igu re 4.1 Main metabolic pathways for (a) catechol (rimiterol) and (b)resorcinol (salbutamol) [3-agonists

hydrolysis was not significantly different to that determined without
hydrolysis. Clenbuterol is excreted mainly as the parent compound (24%),
mandelic acid metabolite (20%) and the hippuric acid metabolite (19%) and
O- and N- glucuronide formation accounted for approximately 5% of the
excreted drug [9, 10]. Similar results were reported for the structurally-
similar compound, mabuterol [11].
For the phenolic-type /3-agonists, conjugate formation has been
reported. Two main types of hydrolysis procedures, namely enzyme and acid
hydrolysis, have been used prior to sample clean-up. Enzyme hydrolysis of
salbutamol conjugates was carried out in urine and liver homogenate; the
samples were adjusted to pH 5.0 and incubated with a dilute solution of
enzyme (glucuronidase/ sulphatase) at 37°C for 16-18 h [4, 5, 12]. The
method of Montrade et al. [12] is particularly informative in this regard, as
the authors carried out hydrolysis studies on urine and a number of bovine
tissues (e.g. liver, kidney, lung and brain). Their results showed that the
sulphate conjugate occurs to a greater extent than the glucuronide conjugate.
Interestingly, no glucuronide conjugation was found in the heart tissue.
Other authors maintain that glucuronides are present in the higher
percentage (and hence only use glucuronidase for hydrolysis purposes) [13,
14]. The best compromise is to use a combination of both types of enzyme
(e.g. as contained in sue d’ helix pomatia). An EIA procedure for /3-agonists
has been described by Degand et al. [15] which by-passes both sample clean

up and enzyme hydrolysis steps; the urine samples were simply diluted to
reduce the effects of interferences, and the antibody in the kit, directed against
the aliphatic part of the molecule, did not distinguish between free and
conjugated forms of salbutamol. A method by Howells et al. for salbutamol
in liver did not use a hydrolysis procedure, and hence the results of analysis
of incurred samples (by EIA) were probably underestimated by approximately
40-50% [16]. Acid hydrolysis procedures have also been reported; Selinger
et al. found that the incubation time required for enzymatic hydrolysis of
conjugated metaproterenol was lengthy (> 180 h) and did not lead to
complete deconjugation. The alternative acid hydrolysis procedure solved both
these problems; plasma supernatants were incubated with 0.2 ml 2 M
hydrochloric acid at 65 °C for 90 min to deconjugate the O-sulphate ester of
metaproterenol [17]. A similar procedure was adopted for the hydrolysis of
isoproterenol sulphate [18].
This study describes the development of a multi-/3-agonist
extraction procedure using MSPD. Extracts from the procedure were
incubated at optimum hydrolysis conditions and the determination of the
individual /3-agonists was carried out by immunoassay.
4.2 EXPERIMENTAL
4.2.1 Reagents and Equipment
Hexane and ethanol (’Extra Pure’ grade) from Merck (Darmstadt,
Germany), dichloromethane and methanol (both ’Hypersolv’ grade) and diethyl
ether from BDH (Poole, UK) and double-distilled water were used. Other
chemicals used were Analar grade from BDH, or equivalent. Sue d’helix
pomatia (containing 100,000 units /3-glucuronidase and 1,000,000 units of
sulphatase per ml) was supplied by Sepracor (Villeneuve la Garenne, France).
Clenbuterol hydrochloride, salbutamol and terbutaline were obtained from
Sigma (St. Louis, MO, USA). Cimaterol and mabuterol were supplied by
Laboratoire d’Hormonologie (Marloie, Belgium). Bond-Elut SPE C18
cartridges (1 ml) were supplied by Analytichem International (Harbor City,
CA, USA).
Immunoassay kits used for determination of /3-agonists were the
following: (a) radioimmunoassay kit, supplied by Laboratoire
d’Hormonologie (Marloie, Belgium), with antiserum which had been raised
against salbutamol and had principal cross-reactivities relative to salbutamol
(100%) of 118% to clenbuterol, 78% to mabuterol, 29% to terbutaline and
11.6% to cimaterol and (b) enzyme immunoassay kit supplied by R-Biopharm
(Germany), with antiserum which had been raised against clenbuterol and had
-136-

principal cross-reactivities relative to clenbuterol (100%) of 71 % to mabuterol,
11% to salbutamol, 10% to terbutaline and 6% to cimaterol.
For the radioimmunoassay, 0.01 M phosphate buffer (pH 7.0),
containing 1 g/1 gelatin and 0.1 g/1 thiomersal, was used. Dextran-coated
charcoal was prepared by adding 2 g activated charcoal (Sigma) and 0.25 g
dextran T70 (Pharmacia, Uppsala, Sweden) to 500 ml double-distilled water.
The scintillation cocktail was Cocktail T (BDH). Preparative grade Sepralyte
C18 (40 /xm, irregular size) and Isolute C18 (50 /xm) packing materials were
supplied by Jones Chromatography (Mid-Glamorgan, UK). Preparative grade
Bondesil C18 (40 ¡xm) material was supplied by Analytichem (Harbor City,
CA). The C,8 material was prepared by placing it in a plastic syringe barrel
(10 ml) and washing sequentially with two column volumes each of hexane,
dichloromethane and methanol and drying by vacuum aspiration. Extraction
columns were prewashed plastic syringe barrels (10 ml) and qualitative filter
paper discs (No. 1, Whatman, Maidstone, UK) were used as frits.
4.2.2 Apparatus
A LKB Wallac 1219 Rackbeta Liquid Scintillation counter was used to
count the radioactivity present in extracts from the MSPD procedure.
Absorbance measurements on samples determined by EIA were carried out
using a Dynatech Minireader with a 410 nm filter.

4.2.3 Methods
4.2.3.1 Samples
All samples of bovine liver were stored frozen until analysis. Liver
samples from animals certified as not treated with /3-agonists were used in
fortification studies. Liver samples from salbutamol-treated animals were
provided by the Central Veterinary Laboratory, Weybridge, UK and were
used for studies on determination of conjugated residues.
4.2.3.2 Fortification
The method was validated by analysis of samples fortified with
salbutamol; levels of 0, 0.5, 1.0 and 2.5 ng of salbutamol, in 10 /xl ethanol,
were added to 0.5 g tissue. Fortification was carried out by pipetting the
material on to the tissue and leaving for 10 minutes prior to extraction.
4.2.3.3 MSPD Extraction
0.5 g liver was weighed into a glass mortar and 2 g of C18 packing
material was added to the mortar and blended with the tissue, using a glass
pestle, for 40 seconds. The mixture was removed from the mortar and

transferred to a 10 ml syringe barrel containing two filter paper discs and with
a 100 /xl pipette tip attached to its outlet. The syringe barrel was tapped to
settle the mixture and two filter paper discs were placed at the head of the
column. The mixture was compressed to a volume of 4.5 ml with a syringe
plunger (from which the rubber seal and pointed plastic retainer had been
removed). Two types of elution procedures were adopted; either: (a) water
wash clean-up prior to methanol elution; or (b) no water wash, but further
clean-up by C18 solid-phase extraction.
For (a), the column was washed with 8 ml hexane and 4 ml double
distilled water. After each wash solvent had flowed through the column,
positive pressure was applied with a pipette bulb to remove surplus solvent.
9 ml of methanol was added to the column, the first 1 ml of eluate (mainly
water) was discarded and the remaining eluate collected. For (b), the column
was washed with 8 ml hexane: diethyl ether (6: 4), after which the analytes
of interest were eluted with 12 ml of methanol and this extract was vortexed
and centrifuged (2000 rpm, 10 min) to remove precipitated proteins.
The methanolic extracts produced from (a) and (b) were both
evaporated to dryness under a stream of nitrogen at 60°C on a sample
concentrator and subjected to enzyme hydrolysis

4 .2 .3 .4 Enzyme Hydrolysis
Dried extracts from the MSPD procedure were redissolved in 0.4 ml
phosphate-gelatin buffer (pH 5.0), 0.1 ml of sue d’helix pomatia solution
(diluted to an appropriate concentration with buffer) was added, and the
solution vortexed for 60 seconds. A study was carried out to determine the
optimum and most practical hydrolysis conditions for salbutamol residues in
incurred samples. Extracts produced from the MSPD column were incubated
at 37°C for periods of 2 or 16 h and with enzyme concentrations of 500 U
glucuronidase/5000 U sulphatase or 2500 U glucuronidase/25,000 U
sulphatase. The tubes were cooled to room temperature prior to SPE clean-up
(MSPD procedure (a)) or direct analysis (MSPD procedure (b)).
4 .2 .3 .5 Cje SPE procedure
C18 cartridges were solvated with 2 ml methanol and conditioned with
2 ml water. The enzyme-treated MSPD extract, to which was added 0.5 ml
water and 0.08 ml sodium hydroxide (1 M), was added to the column and
allowed to flow under gravity. The column was washed twice with 1 ml water
and dried thoroughly under vacuum. The column was eluted with 2 ml
methanol, the extract evaporated under nitrogen at 60°C and redissolved in
0.5 ml phosphate-gelatin buffer, pH 7.0.
4 .2 .3 .6 Enzyme immunoassay
The clenbuterol standard supplied with the EIA kit (and used over the
range of 0-162 pg/well) was replaced by salbutamol, used at 0-1000 pg/well
to allow for the relatively low cross-reactivity for salbutamol. The following
solutions were added to the wells; 0.1 ml of enzyme conjugate, 0.02 ml of
standard salbutamol or prepared sample and 0.1 ml of antiserum. The
microtiter plate was shaken and incubated overnight at 5°C. After emptying
and washing the wells, 0.05 ml aliquots of substrate and chromogen were
added and the microtiter plate incubated at room temperature for 30 min.
Finally, 0.1 ml of stop solution (1.0 M sulphuric acid) was added and the
absorbance measured.
4.2.3. 7 Radioimmunoassay
0.1 ml aliquots of ethanolic standards (standard curve 0-1000 pg
salbutamol/tube) were added to culture tubes, evaporated to dryness under a
stream of nitrogen and redissolved in 0.5 ml phosphate gelatin buffer (pH
7.0). 0.1 ml of sample extracts were added to 0.4 ml of phosphate gelatin
buffer. After vortexing and incubating for 15 minutes at 37°C, 0.1 ml [3H]-
clenbuterol and 0.1 ml antiserum were added. The tubes were incubated at
37°C for 15 minutes and overnight at 4°C. 0.5 ml of dextran-coated charcoal

suspension was added and the tubes centrifuged at 2000 rpm for 10 minutes.
The supernatant was decanted into scintillation vials, 10 ml of scintillation
cocktail added and the radioactivity counted for 5 minutes.
4.3 RESULTS AND DISCUSSION
4.3.1 Direct MSPD using a water wash clean-up step
4.3.1.1 Method Optimisation
The MSPD procedure used for clenbuterol analysis (see Chapter 3)
required a water wash (8 ml) to remove polar interferences. However,
because of the hydrophilic nature of salbutamol, losses could be expected with
8 ml water; hence lower volumes were evaluated. The minimal volume of
water that could remove the red-coloured polar components from the MSPD
column was 4 ml, and this was used in all further work.
Three different C18 materials were evaluated for this modified MSPD
method, namely Bondesil, Isolute and Bondesil-Sepralyte C18 materials. Table
4.1 shows the comparison between the three C18 types at salbutamol
fortification levels of 2 and 5 ng/g. Isolute material gave rise to relatively
poor recovery of salbutamol (47-55%) followed by Bondesil (60%), but
-142-

Table 4.1
Salbutamol
added
Salbutamol determined (ng/g)
(a) (b) (c)(ng/g)
Mean ± SD Mean ± SD Mean ± SD
2 1.20 ± 0.05 1.20 ± 0.15 1.59 ± 0.08
5 2.31 ± 0.60 2.70 ± 0.19 4.32 ± 0.42
Direct MSPD of 2 and 5 ng/g salbutamol in liver with (a) Isolute, (n = 3) (b) Bondesil (n = 5) and (c) Sepralyte (n = 4) C18 materials.
-143-
extraction with Sepralyte material resulted in superior recoveries
(approximately 80%). This suggests that the drug attachment on the tissue Clg
mixture is stronger for the Sepralyte material than for the other materials, and
the water (4 ml) does not elute the compound from the column. For the other
materials there was partial elution of salbutamol in the water wash. For this
reason Sepralyte C18 material was chosen for all further work involving a
water wash step.
4.3.1.2 Enzyme Hydrolysis
Table 4.2 shows the salbutamol levels determined in incurred liver
samples extracted by the MSPD procedure and subjected to enzyme hydrolysis
under various conditions. Results for analysis by RIA showed a significant
increase in the level of drug determined after enzyme hydrolysis for 2 h with
low enzyme concentration (500/5000 U), but there was little further increase
in residue level with extended incubation and/or higher enzyme concentration
(2500/25000 U). In contrast, the salbutamol levels determined by EIA
decreased with enzyme hydrolysis, and the extent of the decrease was related
to the length of the incubation period and the enzyme concentration. The
difference in results may be explained by differences in the antisera: the
antiserum in the RIA kit, raised against salbutamol-hemisuccinate-BSA, and
the antiserum in the EIA kit, raised against clenbuterol-diazo-BSA, have lower
-144-

Enzyme hydrolysis Salbutamol (ng/g)
Glucuronidase/ Incubation periodMSPD/RIA MSPD/E1A
sulphatase(U)
(h) Mean ±SD Mean ± SD
0 0 7.5 ± 0.6 26.5 ± 6.2
500/ 2 13.5 + 1.1 19.1 ± 6.7
5000 16 15.0 ± 1.7 16.0 ±6.3
2500/ 2 15.9 ± 3.7 15.9 ± 5.5
25000 16 14.7 ± 2.2 12.6 ± 2.7
Table 4.2 Salbutamol levels determined in liver samples from treated animalsafter hydrolysis with glucuronidase/sulphatase at 37°C (n = 6)

and higher cross-reactivity, respectively, to conjugated forms of salbutamol
compared with free salbutamol. RIA provided better reproducibility (reflected
in the lower coefficients of variation obtained) and the higher cross-reactivities
of this antiserum to other /3-agonists make it more suitable for multi-residue
determination. RIA, therefore, was the technique selected for further
validation of the MSPD procedure. The final hydrolysis conditions selected
were 1000 U glucuronidase/10,000 U sulphatase per 0.5 ml final extract and
incubation for 2 h at 37°C. A more concentrated enzyme activity gave rise to
a slightly higher free salbutamol concentration, but there was a colouration of
the extract which caused a higher background signal in the immunoassay.
4.3.1.3 Method Validation
The inter- and intra-assay variations of the method are shown in Tables
4.3 and 4.4. Good recovery of residue was determined at the 1 ng/g (97%),
level but lower recoveries were determined for the 2 ng/g (87%) and the 5
ng/g (65%) levels. These apparent low recoveries are due to inaccuracy of
the radioimmunoassay procedure rather than to losses in the extraction
procedure; a relatively high non-specific binding (NSB) value occurs in
extracts prepared by the MSPD procedure and its negative influence on
quantitation increases with concentration of analyte in the extract. A similar
effect was observed for the assay of clenbuterol by MSPD (see Chapter 3),
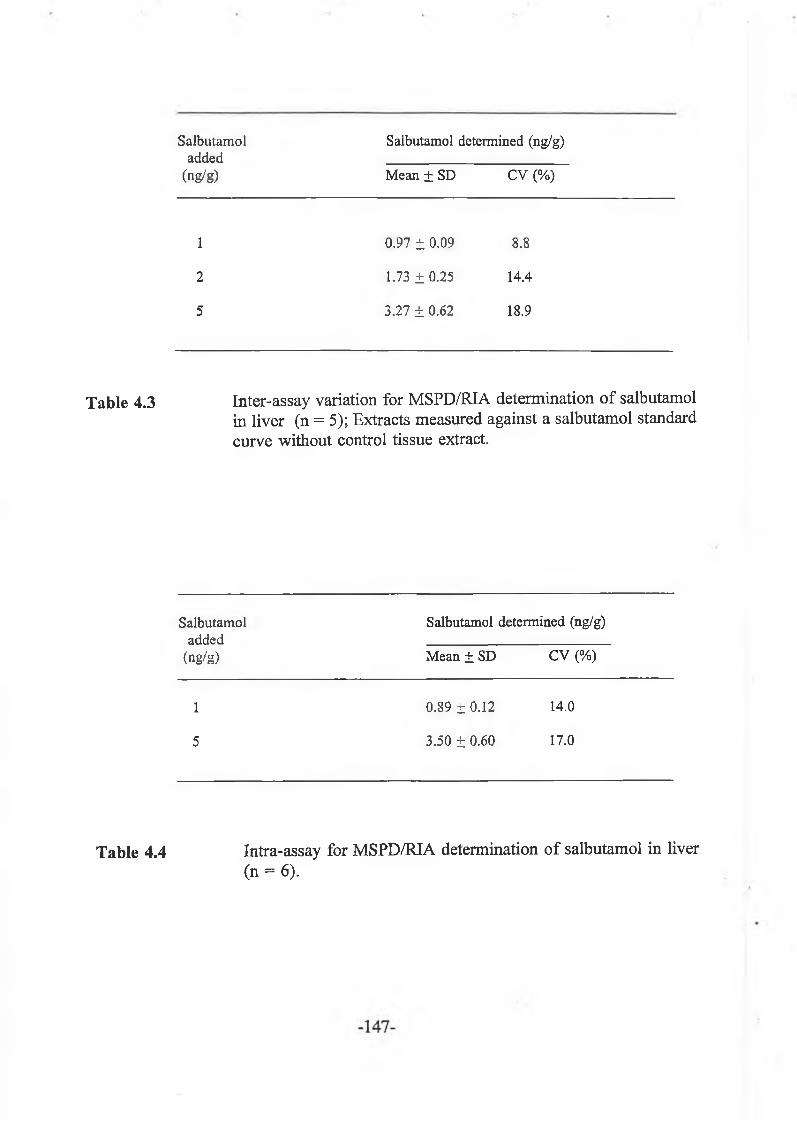
Salbutamoladded
(ng/g)
Salbutamol determined (ng/g)
Mean ± SD CV (%)
Table 4.3
1 0.97 ± 0.09 3.8
2 1.73 ± 0.25 14.4
5 3.27 ± 0.62 18.9
Inter-assay variation for MSPD/RIA determination of salbutamol in liver (n = 5); Extracts measured against a salbutamol standard curve without control tissue extract.
Salbutamoladded
(ng/g)
Salbutamol determined (ng/g)
Mean ± SD CV (%)
1 0.89 ± 0.12 14.0
5 3.50 ± 0.60 17.0
Table 4.4 Intra-assay for MSPD/RIA determination o f salbutamol in liver(n = 6).

and could be overcome by use of a standard curve containing tissue extract for
the radioimmunoassay. The intra-assay results showed acceptable variation
within a single assay for samples fortified at 1 and 5 ng/g (Table 4.4).
4.3.1.4 Limit o f detection
A tentative limit of detection for the MSPD/RIA procedure was
determined by analysis of liver samples free of salbutamol residues. The
mean value for these samples (n = 8) was 0.35 ng/g (_+ 0.11 ng/g, n = 8).
The limit of detection, calculated as the mean + 3 times the standard
deviation, was found to be 0.69 ng/g.
4.3.1.5 Incurred sample analyses
Liver samples from animals treated with salbutamol were analysed
using the developed procedure. Table 4.5 shows the salbutamol levels
determined in incurred samples before and after enzyme hydrolysis. The
results show that at the three dose levels used with a withdrawal period
selected to give residue-positive samples, 40-45% of the residue occurs in the
liver in a conjugated form. These results are consistent with a salbutamol
deconjugation study carried out by Montrade et al. [12]; using an extraction
procedure involving "mixed phase" SPE sample clean-up on a liver

Sample Treatment Salbutamol determinedfne/sf)
No. Dose (IM, Hg/kg)
Wididrawalperiod
CO(a)
Mean ± SD(b)
Mean ± SD
1 I 0.2 18 0.88 ± 0.05 1.54 ±0.18
2 1.0 18 7.95 ± 0.89 13.68 ± 1.57
3 5.0 18 26.38 ± 6.50 44.40 ± 8.74
4 II 2.01 168 0.23 ± 0.08 0.26 ± 0.17
5 2.01 168 0.16 ± 0.08 0.29 ± 0.13
1 Dose given twice daily for 4 days
4.5 Salbutamol levels determined in liver samples from treated animalsby MSPD/RIA before (a) and after (b) hydrolysis using glucuronidase/ sulphatase (n = 4).

homogenate and GC-MS analysis, these authors found that 42-50% of the
salbutamol residues occur as conjugates. Table 4.5 also shows the results for
analysis of liver samples of animals which had longer withdrawal periods of
7 days. No residues were detectable above the limit of determination of the
method. This was to be expected as salbutamol, possessing a catechol
structure, is metabolized by the COMT pathway (catechol O-methylation
transferase reaction), resulting in a short half-life [8].
4.3 .1 .6 Multiresidue analysis
The developed method was applied to the analysis of other /3-agonists.
The method was tested for clenbuterol, mabuterol, terbutaline and cimaterol
using liver samples fortified with these drugs at 2 ng/g. Samples were
fortified, also, with terbutaline and cimaterol at 10 ng/g because of their
relatively low cross-reactivities to the RIA antiserum. Table 4.6 shows results
for analysis of these fortified samples. Residue levels were determined, also,
using clenbuterol and mabuterol standard curves. Salbutamol (or mabuterol)
standard curves are most suitable for a multi-residue procedure with
clenbuterol, salbutamol and mabuterol detectable at 1 ng/g or less and
terbutaline detectable at about 2 ng/g. Cimaterol, because of its low cross
reactivity to the antiserum, gave a result below the limit of detection of the
method for fortification level of 2 ng/g. Cimaterol would be detectable at a

(3-agonist Amount Amount determined fag/g)_______added added Clenbuterol Salbutamol Mabuterol
(ng/g) standard curve standard curve standard curveMean + SD Mean ± SD Mean ± SD
Clenbuterol 2 1.36 ±0.21 2.37 ± 0.28 2.30 ± 0.10
Salbutamol 2 0.80 ±0.11 1.33 ± 0.05 1.46 ± 0.10
Mabuterol 2 0.98 ± 0.23 1.66 ± 0.28 1.73 ± 0.14
Terbutaline 2 0.38 ± 0.07 0.60 ± 0.01 0.76 ± 0.04
Cimaterol 2 0.24 ± 0.02 0.38 ± 0.08 0.51 ± 0.09
Terbutaline 10 1.32 ± 0.05 2.25 ±0.11 2.25 ± 0.34
Cimaterol 10 1.03 ±0.04 1.73 ± 0.20 1.83 ± 0.34
Table 4.6 Determination o f various (3-agonists, by MSPD/RIA using clenbuterol, salbutamol and mabuterol standard curves prepared without control tissue extract..
level of about 4 ng/g. Taking into consideration the differing cross-reactivities
of the ¡3-agonists to the assay antiserum, the MSPD extraction procedure gives
reasonable recovery for all 5 substances tested and is appropriate as a
multiresidue extraction method.
4.3.2 Linkage of MSPD with a C18 SPE clean-up step
4.3.2.1 Method validation
An inter-assay variation of salbutamol, clenbuterol and mabuterol, at
1 ng/g and 2 ng/g levels, measured using salbutamol standard curves with and
without tissue extract was carried out. Table 4.7 shows the results of the the
former option. The table also provides comparisons between the two main Clg
material brands (Bondesil and Isolute). The use of an extract containing
standard curve gives the best recovery data, as was found for the clenbuterol
assay in Chapter 3. For either C]8 material type, the measured recovery for
salbutamol is 79% or greater, for clenbuterol greater than 100% and for
mabuterol 64% or greater; these results indicate high recovery of the (3-
agonists by the MSPD/SPE procedure with the relatively high and low
recoveries obtained for clenbuterol and mabuterol, respectively, being
explained by the cross-reactivity of the antiserum towards these compounds
(for clenbuterol it is 118% and for mabuterol it is 78%).
The two grades of C18 material gave comparable results, for example
-152-

p-agonist determined (ng/g)
Table 4.7
{3 -agonist
added
(ng/g)n (a) Bondesil C,g (b) Isoiute C18
Mean ± SD CV(%) Mean ± SD CV{%)
1 (S) 5 0.79 ± 0.11 13.9 0.85 ± 0.22 26.1
2 5 1.80 ± 0.27 15.0 1.79 ± 0.21 11.7
I (C) 5 1.15 ± 0.22 19.1 1.10 ± 0.21 19.1
2 5 3.19 ± 0.82 25.7 2.42 ± 0.51 21.1
1 (M) 5 0.69 ± 0.06 8.7 0.69 ±0.11 15.9
2 5 1.32 ± 0.19 14.4 1.27 ± 0.17 13.4
Inter-assay variation o f salbutamol' (S), clenbuterol (C) and mabuterol(M) at 1 and 2 ng/g levels in liver extracts from MSPD/SPE/RIA. The performance of the two Clg brands was evaluated and the 0 -agonists were determined against a salbutamol standard graph containing tissue extract.
- 153-

0.79 ng/g (Bondesil) and 0.85 ng/g (Isolute) for salbutamol at 1 ng/g
recovery. There was a difference, however, between C18 materials for the
clenbuterol 2 ng/g level due mainly to a highly inflated result being obtained
for one sample (4.58 ng/g, Bondesil material). These results show that the
method works well for different brands of Clg material.
The inter-assay data using standard curve without tissue extract (results
not shown) demonstrates that lower recovery values were being obtained.
However, taking into account the cross-reactivity of the antiserum, the mean
measured recovery for all three compounds was > 65%. Hence, a curve
without tissue extract may be used for routine work. The intra-assay variation
data for liver samples fortified with /3-agonists at the 2 ng/g level is provided
in Tables 4.8 (salbutamol standard curve with added tissue extract). The
coefficients of variation were always less than 20%. This is considered
acceptable in view of the nature of the sample matrix. For the Isolute
material, the recovery of mabuterol was low (mean recovery, corrected for
cross-reactivity, of 52%) compared to that obtained consistently in the inter
assay study. For the other compounds the recovery was always greater 80%,
irrespective of the C18 material used.

Table 4.8
p-agonist
added
(ng/g)n
P-agonist determined (ng/g)
(a) Bondesil Cl8 (b) Isolute Cu
Mean ± SD CV(%) Mean ± SD CV(%)
2 (S) 4 2.24 ± 0.17 7.8 1.87 ±0.21 11.2
2 (C) 4 2.54 ± 0.48 18.9 1.99 ±0.17 8.5
2 (M) 4 1.51 ±0.26 17.2 0.82 ±0.12 14.6
Intra-assay variation of 2 ng/g salbutamol (S), clenbutero! (C) and mabuterol (M) in liver extracts from MSPD/SPE/RIA using either Bondesil or Isolute C18 material. The extracts were determined against a salbutamol standard curve containing tissue extract.
- 155-

4 .3 .2 .2 Limit o f detection
Limits of detection for the MSPD/RIA method were determined by
analysis of liver samples (n = 7), free of ß-agonist residues. The limits,
calculated as the mean + 3 times the standard deviation, were determined
depending on the brand of C18 material used and on the type of curve (without
or with tissue extract) used:
(a) Bondesil/with tissue extract curve:
0.17 ng/g (mean response + SD = 0.0260 ng/g + 0.048 ng/g)
(b) Bondesil/without tissue extract curve:
0.16 ng/g (mean response + SD = 0.029 ng/g + 0.045 ng/g)
(c) Isolute/with tissue extract curve:
0.57 ng/g (mean response + SD = 0.071 ng/g + 0.165 ng/g)
(d) Isolute/with out tissue extract curve:
0.28 ng/g (mean response + SD = 0.037 ng/g + 0.082 ng/g)
Apart from the results for the Isolute material determined by a curve
without tissue extract (c), the limits fall well below the maximum residue limit
(MRL) of 0.5 ng/g [10]. For (c) there was one negative control value giving
a high background level (0.4 ng/g), resulting in a high standard deviation and
consequently a high limit of detection.
-156-

4.4.2.3 Incurred sample analyses
Liver samples from animals treated with salbutamol and clenbuterol
were analysed using the developed procedure. Again, the method was
evaluated with respect to Clg material brand and curve type. Table 4.9 shows
the results of these analyses. As for the inter-assay analysis, there was no
significant difference between the results obtained using Bondesil or Isolute Clg
materials. For the incurred salbutamol sample (at approx. 1.2 ng/g) a lower
result was obtained with this method than was obtained by direct MSPD
extraction (1.54 ng/g). The values obtained for the clenbuterol incurred
sample (i.e. 4.34 and 3.96 ng/g) were somewhat inflated over that obtained
before (3.60 ng/g) using a clenbuterol standard curve containing tissue extract;
the inflated results are probably due to the higher cross-reactivity to
clenbuterol (118%) in this assay.
-157-
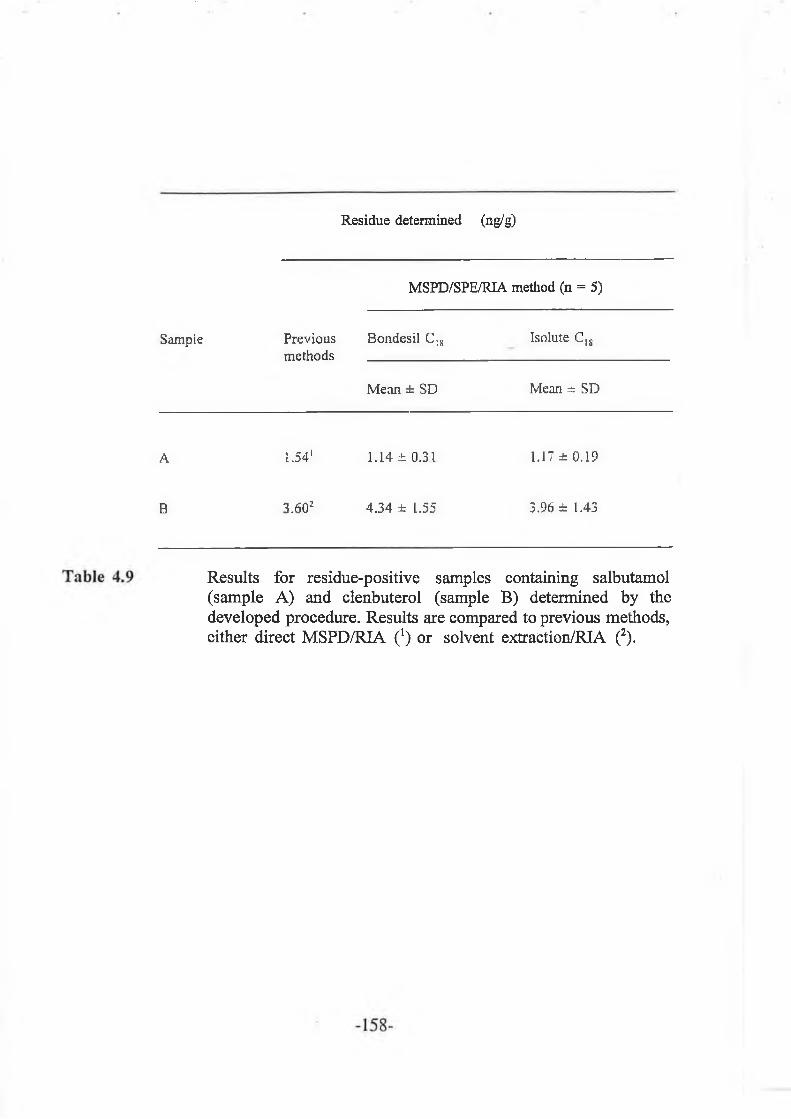
Residue determined (ng/g)
Sample
A
B
MSPD/SPE/RIA method (n = 5)
Previous Bondesil C,8 Isolute CISmethods ______________________________
Mean ± SD Mean ± SD
1.541 1.14 ±0.31 1.17 ±0.19
3.602 4.34 ± 1.55 3.96 ± 1.43
Results for residue-positive samples containing salbutamol (sample A) and clenbuterol (sample B) determined by the developed procedure. Results are compared to previous methods, either direct MSFD/RIA (') or solvent extraction/RIA (2).

4.5 CONCLUSIONS
The ease of extraction of clenbuterol by MSPD (Chapter 3) indicated
that the technique might be suitable, also, for other /3-agonist compounds;
compounds similar in structure to clenbuterol like mabuterol and cimaterol
were obvious candidates. The phenolic /3-agonists, being more polar and
ionizable were, however, liable to be removed in the water wash. The present
study demonstrates that good recovery of salbutamol may be obtained,
depending on the Clg material used. Of the three C18 materials tested
Sepralyte retains salbutamol most strongly and allows the use of a water wash.
However, to provide a more universal procedure, i.e. a procedure which could
extract a range of /3-agonists irrespective of the material brand, the water wash
step was eliminated and replaced by solid-phase extraction. Using this
purifying step, recoveries of 80% or better were achieved for all three
compounds tested. Moreover, the procedure has the capability to detect
residues below the 1 ppb level.
The inclusion of a hydrolysis step was necessary for residues which
occur as conjugates. Results from other studies show that, for salbutamol,
two main conjugates are present in liver samples, namely glucuronides and
sulphate esters [12]. The incorporation of a post-MSPD enzyme hydrolysis
step into the procedure deconjugates the residues to give an accurate value for
total /3-agonists present. A short hydrolysis time (2 h) coupled with a low

enzyme concentration was found to be sufficient to achieve deconjugation.
The results show that 40-45 % of salbutamol residues occur in the liver in a
conjugated form.
-160-

4.6 REFERENCES
1. A.P. Moloney and P. Allen, in Proceedings of the FLAIR Workshop,
Thessaloniki, Greece (Eds; H.A. Kuiper and LA.P. Hoogenboom), Oct
30-31, 1992, p. 89.
2. P. Fürst, C. Fürst and W. Groebel, Dtsch. Lebensm.-Rdsch., 85, 1989,
341.
3. L. Leyssens, C. Driessen, A. Jacobs, J. Czech and J. Raus, J.
Chromatogr (Biomed. Applic.), 564, 1991, 515.
4. L.A. van Ginkel, R.W. Stephany and H.J. van Rossum, J. Assoc. Off.
Anal. Chem., 75, 1992, 554.
5. M.-P. Montrade, B. Le Bizec, F. Montreau, B. Siliart and F. Andre,
Anal. Chim. Acta, 275, 1993, 253.
6. S.A. Barker, A.R. Long and C.R. Short, J. Chromatogr., 475, 1989,
353.
7. F.J. Schenk, S.A Barker and A.R. Long, J. Assoc. Off. Anal. Chem.,
75, 1992, 655.
8. R.F. Witkamp and A.S.J.P.A.M. van Miert, in Proceedings FLAIR
Workshop, Thessaloniki, Greece, (eds; H.A. Kuiper and L.A.P.
Hoogenboom, Oct 30-31, 1992, p.75.
9. H. Hooijerink, R. Schilt, W. Haasnoot and D. Coortheijn, J. Pharm.
Biomed. Anal., 9, 1991, 485.

10. B. Boenisch and J.F. Quirke, in Proceedings of the FLAIR Workshop,
Thessaloniki, Greece (Eds: H.A. Kuiper and L.A.P. Hoogenboom), Oct
30-31, 1992, p. 102.
11. M. Horiba, T. Murai, K.Nomura, T. Yuge, K. Sarai and E. Osada,
Arzeim. -Forschung, 34, 1984, 1668.
12. M.-P. Montrade, S. Riverain, B. Le Bizec and F. Andre, in
Proceedings FLAIR Workshop, Thessaloniki, Greece (Eds; H.A.
Kuiper and LA.P. Hoogenboom), Oct 30-31, 1992, p. 143.
13. R. Angeletti, M. Paleologo-Oriundi, R. Piro and R. Bagnati, Anal.
Chim. Acta, 275, 1993, 215.
14. Ph. Delahaut, M. Dubois, Y. Colemonts, A. Boenke and G. Maghuin-
Rogister, in Proceedings of the EuroResidue 2 Conference, Veldhoven,
The Netherlands, May 21-23, 1990, p. 257.
15. G. Degand, A. Bernes-Duyckaerts, Ph. Delahaut and G. Maghuin-
Rogister, Anal. Chim. Acta, 275, 1993, 241.
16. L. Howells, M. Sauer, R. Sayer and D. Clark, Anal. Chim. Acta, 275,
1993, 275.
17. K. Selinger, H.M. Hill, D. Matheou and L. Dehelean, J. Chromatogr.
(Biomed. Applic.), 493, 1989, 230.
18. R.C. Causon, R. Desjardins, M.J. Brown and D.S. Davies, J.
Chromatogr., 306, 1984, 257.
-162-

CHAPTER 5
SUPERCRITICAL FLUID EXTRACTION AND
CHROMATOGRAPHY OF /3-AGONISTS

5.1 INTRODUCTION
A supercritical fluid (SF) may be described as a dense gas which
possesses physico-chemical properties intermediate between those of liquids
and gases. This state is reached by bringing the substance above its critical
temperature (Tc) and pressure (Pc). A SF may be defined from the pressure-
temperature phase diagram shown Figure 5.1 (supercritical fluid, carbon
dioxide). The solvent strengths of SFs approach those of liquid solvents as
their density is increased, thereby having the capacity to dissolve a variety of
solutes, even those of high molecular weight and low volatility. In addition,
because SFs have solute diffusivities an order of magnitude higher, and
viscosities an order of magnitude lower, than liquid solvents they have much
better mass transfer characteristics. Table 5.1 shows a comparison in
properties between a gas, a SF and a liquid. The SF possesses the most ideal
properties for use as a mobile phase in chromatograpic science; its low
viscosity characteristic allows a lower pressure drop over a column than for
a liquid for a given flow rate. This low column pressure drop results in the
column having apparently more theoretical plates per meter and increased
chromatographic efficiency. Its higher analyte diffusivity causes narrower
chromatographic peaks and hence better sensitivity [1].
The solvent strength of a SF can be easily controlled, unlike a liquid
where the solvent strength is essentially constant irrespective of the

F ig u re 5.1 Pressure-temperature phase diagram for supercritical carbon dioxide.

Mobile Density Viscosity Diffusivityphase (g m l1}) (g cm 1 s'1) (cm2 s 1)
Gas 10'3 0.5-3.5 X 10'4 0 .01- 1.0
SF 0.2-0.9 0.2-1.0 X 10° 3.3-0.1 X IO’4
Liquid 0.8-1.0 0.3-2.4 X IO'2 0.5-2.0 X 10'5
T ab le 5.1 Comparison in physical properties, from a chromatographic pointof view, for gas, liquid and supercritical fluid (SF) mobile phases.
Compound Boiling point (°C)
Tcr (°C) Per (bar) Density(g/ml)
Carbon dioxide -78.5 31.3 72.9 0.45
Nitrous oxide -89.0 36.5 71.4 0.46
Ammonia -33.4 132.3 111.3 0.24
Xenon -107.3 16.6 58.4 1.10
T ab le 5.2 The physical properties, relevant to SFE and SFC, of various SF substances.

extraction conditions. The solvent strength of the SF depends upon the
temperature and pressure applied to it. At a constant temperature the
application of a low pressure produces a low density, and hence relatively
non-polar, SF and which will result in the extraction of non-polar analytes.
Increasing the pressure to different points allows the selective fractionation of
analytes according to their solubility in the SF. Figure 5.2 shows how
supercritical carbon dioxide is affected by various temperature/pressure
conditions.
A wide variety of substances may be used as SFs but, practically, only
three or four have been found suitable. Table 5.2 shows the characteristic
physical properties of these substances. Carbon dioxide is by far the most
used. It is inert, inexpensive and non-toxic and has low Tc and P0 values.
Nitrous oxide possesses similar Tc and Pc values but there have been some
serious accidents in its usage [2, 3] due to its oxidising properties. Xenon,
with Tc and Pc values of 16.6°C and 58.4 bar has almost ideal properties but
it is too expensive for routine use in analysis. Supercritical ammonia is
applicable to polar analytes but has higher Tc and Pc values and is toxic and
corrosive. Other substances have also been used (for example
chlorodifluorocarbon [4]) but the vast majority of applications report the use
of supercritical carbon dioxide (SC-C02).
The two major analytical applications which utilise SFs are supercritical
fluid extraction (SFE) and supercritical fluid chromatography (SFC). The

Temperature (°C)
Figure 5.2 Plot o f carbon dioxide density vs temperature at various pressures.

former technique may be viewed as an analyte isolation procedure analogous
to liquid-liquid extraction whereas the latter is a chromatographic technique
with the combined separation properties of both HPLC and GC. A
combination of both techniques (i.e. SFE/SFC) is a possible sample clean-up
option [5]. Extracts from SFE may be analysed by SFC but in most cases
HPLC or GC is preferred [6-8]. A SFE apparatus consists of a pump which
directs the SF through a heated sample vessel where the analytes are extracted
and then swept to a collection device via a flow restrictor from which the
depressurised SF is vented. The analytes may be rinsed from the collection
device with an organic solvent (normally methanol). SFE can be performed
in dynamic mode (continuous flow of SC-C02 through the extraction cell) or
static mode (fixed amount of SC-C02 in the extraction cell) or even a
combination of both. A schematic diagram of the SFE apparatus is shown in
Figure 5.3.
SC-C02 is relatively non-polar hence its extracting capacity for medium
to high polar analytes depends on the application of high temperature/pressure
conditions [9] or the introduction of a modifier solvent in a low percentage
[10, 11]. Many reviews have appeared which focus on the merits of SFE and
ways of optimising extraction conditions for various analytes [12 , 13]. The
bulk of the literature reporting SFE deals with SF-C02 extractions of relatively
non-polar components like pesticides [14-16], environmental contaminants
(e.g. PCBs, PCHs) [17-22] and fats/oils [23-26]. For more polar compounds

Highpressurepump
Pnmp chcck I valves
Extraction g flu id check ■ valves
CO ,
PulsedamperOverpressure ucerPrevalvefilte r
TrapNozzle
I Prenozzle filte rPressure isolation valve
Tray w itfy - ■ t vials 1 *
Control pressure 1 transducer
Preheaters
ChamberRinse pump active valve
TRinse solvent select valves
Bypass valve Chamber valve
solventpump
Rinse solvents
Figure 5.3 Schematic of the HP-7680T supercritical fluid extractor.
the addition of a modifying solvent was required; for instance Eureby et al.
found that extracting tipredane (a corticosteroid) with pure supercritical C 02
gave low recovery whereas addition of a modifier (ethanol, up to 33% v/v)
gave rise to recoveries of greater than 80% [6]. Similar experiences were
reported by other authors [10 , 11]. Although extracts from SFE need not be
confined to SFC analysis, an "in-line" SFE-SFC linkage is advantageous as the
injection solvent is the same as the mobile phase, i.e. the output characteristics
from the first instrument and the input characteristics of the second instrument
are compatible.
SFC provides an alternative to HPLC and GC techniques for the
separation and detection of analytes from sample extracts. The advantages of
using SFs for separation purposes have already been discussed. Additionally,
SFC is compatible with a wide range of detectors in use with both HPLC and
GC. The ultraviolet detection option is extremely popular and applicable to
most analytes possessing a chromophore [7], The combination of SFC with
a mass spectrometer gives additional sensitivity and provides information on
compound structure [5, 27]. Suitable stationary phases are not unlike those
used in other chromatographic techniques; packed columns (as in HPLC)
containing a range of functional groups (C18, C8, NH2, etc) bonded to silica
and open-tubular columns with stationary phases similar to those used in
capillary GC except that the inside diameter is smaller and the stationary phase
must be immobilised. A schematic diagram of a SFC apparatus is provided

in Figure 5.4. The relative non-polar nature of supercritical C 02 means that
the bulk of extractions/separations have been of relatively non-polar analytes.
For SFE/SFC to become a standard sample extraction/analysis techniques,
however, their application to polar analytes must be addressed. Most
drugs/drug metabolites contain one or more polar functional groups and the
extraction methodologies used are usually lengthy requiring for example
liquid-liquid or solid phase extraction. With certain modifications these
extractions may be performed more efficiently by SFE. Many authors have
reported methods applicable to the more polar drug compounds; for instance
Cross et al. extracted sulphonamides from liver after first dispersing the
sample on diatomaceous earth. The extraction was short (5 min) and recovery
of the various drug compounds was in the order 53-93% [28]. Khundker et
al. also extracted a drug compound, ibuprofen, using unmodified SC-C02
although high temperature (70°C) and high density (0.7 g/ml) conditions were
required [9]. A home-made SFE apparatus was described and built by
Maxwell and co-workers which could apply twice the maximum pressure of
its commercial counterpart. Methods were reported for the extraction of ten
nitrosamines from meat samples [29] and three nitrobenzamide antimicrobial
drugs from liver samples [30]. For more efficient extraction of polar drugs,
an organic modifier must be added to the supercritical fluid. Liu and co
workers found that 5 % methanol in SC-C02 was sufficiently polar to extract
flavone [10] and mebeverine [11] from blood plasma. Higher methanol
-172-
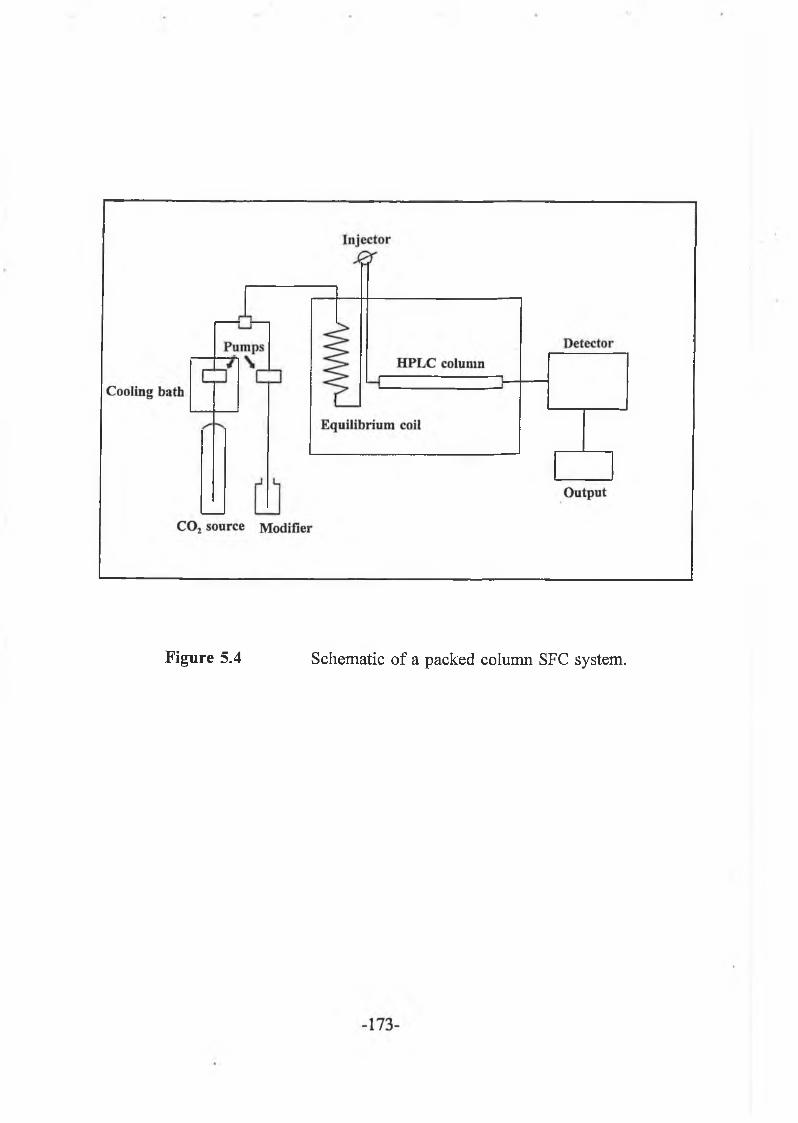
Figure 5.4 Schematic of a packed column SFC system.

concentraions (between 17 and 33%) were necessary to extract tipredane
efficiently [6]. A novel on-line SFE-SFC-MS-MS technique was described by
Ramsey et al.; the mainly non-polar components of kidney tissue were
washed from the extraction vessel with SC-C02, after which the test analytes
(hexesterol, diethylstilbesterol) were eluted and separated via gradient elution
using SFC to the mass spectrometer for detection [5]. Alternative extraction
methodologies for pharmaceuticals/polar analytes include the use of
supercritical fluid-nitrous oxide extraction [31] and in-situ chemical
derivatisation [32].
This chapter examines appropriate conditions for the extraction (using
SFE) and separation (using SFC) of /3-agonists. The /3-agonists were first
extracted from an inert matrix (filter paper) after optimisation of various
parameters. The optimised procedure was applied to the extraction of
mabuterol from liver dispersed on both Celite and C18 material. The use of
a C18/tissue blend was a novel approach to linkage of MSPD with SFE. The
extracted samples were assayed by SFC.
-174-

5.2 EXPERIMENTAL
5.2.1 Reagents and materials
HPLC-grade methanol was obtained from Rathburn (Walkerburn, UK).
Glass wool and triethylamine were obtained from Sigma (Poole, Dorset, UK).
Instrument-grade liquid carbon dioxide, supplied in a cylinder with a syphon
tube, was obtained from BOC (London, UK). Clenbuterol hydrochloride,
salbutamol and terbutaline were purchased from Sigma (St. Louis, MO, USA).
Mabuterol and cimaterol were supplied by BGA (Berlin, Germany). Solid
support materials were reagent grade Celite (Supelco, Pennsylvania, USA) and
octadecylsilane material ("Isolute" Clg end-capped, 40 ¿im), (International
Sorbent Technology (1ST), Mid Glamorgan, UK). Qualitative filter paper
(No. 1) was supplied by Whatman (Maidstone, Kent, UK).
5.2.2 Apparatus
For supercritical fluid chromatography a Hewlett Packard (HP)-SFC
system with UV detection coupled to a HP Series 1050 modifier pump was
used. A 3 fim packing, amino-bonded column, 25 cm x 4.6 mm, (Capitol
HPLC, Edinburgh, UK) was used to separate the /3-agonists. Extractions were
performed with a HP Model 7680T supercritical extraction system, also
coupled to a HP Series 1050 modifier pump.
5.2.3 Methods
5.2.3.1 Samples
Samples of bovine liver from animals certified as not treated with (3-
agonists were homogenised and stored frozen until required for assay.
5.2.3.2 Supercritical fluid chromatography (SFC)
Since previous work had shown that a high % methanol content in the
SC-C02 was required for the /5-blockers, compounds structurally-related to /5-
agonists [33], methanol-modified SC-C02 was evaluated for the /3-agonists.
A number of HPLC columns (25 cm x 4.6 mm) containing C18, -OH and -NH2
functional groups bound to silica, were tested for their capacity to separate the
compounds. Triethylamine (TEA) was added at a concentration of 1 % v/v in
methanol to block residual silanol groups and ensure good peak shape. A
column temperature of 55°C was maintained to ensure supercritical conditions.
-176-

The conditions used for SFC were as follows:
Oven temperature: 55 °C
Supercritical C 02: 250 bar
Mobile phase: SC-C02/methanol/TEA(75 % /24.75 %/0.25 %)
Flow rate: 2.0 ml/min
Detection: UV at 244 nm
Column: Amino 3 ¿im packing, 25 cm x 4.6 mm,
5.2.3.3 Supercritical fluid extraction (SFE)
5.2.3.3.1 Extraction from filter paper
100 ¡x\ aliquots of 1 mg/ml solutions of the /3-agonists (in methanol)
were added to filter paper and, after evaporation of the methanol, the filter
paper was placed into the extraction thimble. The following parameters were
optimised: fluid density, extraction temperature, extraction time and modifier
(methanol) content. The extraction was performed both in dynamic and static
modes. The extracted fluid was swept onto a metal (stainless steel) trap which
was then rinsed with methanol and the extract was analysed by SFC.

The conditions used for SFE were as follows:
Density: 0.84 g/ml
Chamber temperature: 70°C
Flow rate: 2.0 ml/min
Modifier content: 25%
Extraction time: 30 min
5.2.3.3.2 Extraction from liver
The solid support materials, Celite and C18 were evaluated for their
capacity to disperse the liver samples. Mabuterol was the test analyte. Liver
(0.5 g) was weighed into a glass mortar and fortified with 50 fxg (in 50 ¡A)
mabuterol standard. After 10 min, 2 g of C18 material or 0.9 g Celite was
added and the liver was blended until thoroughly mixed (40-60 s). The
mixture was added to the extraction thimble and both ends of the thimble were
blocked by glass wool. The extraction conditions described in section
5.2.3.3.1 were then applied.

5.3 RESULTS AND DISCUSSION
A number of stationary phases were tested, but only one, an amino
column, gave good separation of the compounds. In fact, for the bulk of
applications to pharmaceutical substances, the choice is usually between cyano
or amino types of modified silica [34]. When all five compounds were
injected onto the SFC system, the three least polar compounds (in order of
increasing polarity) mabuterol, clenbuterol and cimaterol eluted within the first
five minutes and these aniline /3-agonists were well separated from each other
(Figure 5.5). The phenolic /3-agonists, salbutamol and terbutaline did not elute
within the first 20 min. It is most likely that these compounds, which are
relatively insoluble in the supercritical fluid, are highly retained on the
stationary phase. Because of these results, further work was concentrated
solely on the separation and extraction of the aniline type compounds.
Extraction in the static mode using a long extraction time (30 min)
proved to be more efficient than its dynamic mode counterpart and was thus
chosen for all further work. Extraction of the aniline /3-agonists from filter
paper using pure supercritical C 02 was totally ineffective due to the
compounds’ high polarity. The polarity of the supercritical C 02 was increased
by addition of a modifier, methanol. Optimum extraction was achieved with
a high methanol content (25 %). A high temperature (70°C) coupled with high
density supercritical C 02 (0.84 g/ml) were also necessary conditions to extract

Figure 5.5 Supercritical fluid chromatogram of a mixture of 1 |ig (on column)o f mabuterol (a), clenbuterol (b) and cimaterol (c). Conditions as explained in text.

the compounds. Figure 5.6 shows an SFE extract from filter paper containing
mabuterol and clenbuterol (1 fxg on column) using optimum extraction
conditions. The extraction efficiency was 89% for mabuterol and 80% for
clenbuterol. For evaluation of the solid supports, Celite and Clg, mabuterol
was chosen as the test analyte. Figure 5.7 shows the chromatograms obtained
for Celite and Qg based extracts. The negative control liver extract (Figure
5.7 (a)) contains a main interferant at 3.3 min and other smaller interferants
(after 5 min) but the area around the retention time for mabuterol (3.8 min)
is free from interferences. When the mabuterol-fortified (50 ¡ig/0.5 g) extract
was injected, however, the recovery of drug was only 9% (Figure 5.7 (b)).
For C,g material better results were achieved: for the mabuterol-fortified
extract a recovery of 31 % was obtained (Figure 5.7 (c). Similar results were
obtained for a repeat of these extractions (Celite-5%, Clg-27%). These
preliminary results indicate that, with the available equipment, highly modified
supercritical fluid is required to extract some of the /3-agonists. The level of
drug used for this evaluation of SFE (100 ppm) was very high but such
fortification was used so that UV detection would not be limiting. The ideal
determination technique, in this case, would be immunoassay which could
detect /3-agonists at less than 1 ppb. When a more comprehensive study is
undertaken, in which SFE conditions would be optimised for more efficient
extraction, the SFE-immunoassay linkage would be explored.

Figure 5.6 Supercritical fluid chromatogram of an extract obtained by SFE from filter paper fortified with 100 \iglml of 1 mg/ml concentrations of mabuterol (a) and clenbuterol (b).
-182-

Figure 5.7 Supercritical fluid chromatograms of liver extracts, (a) negativecontrol liver (with Celite) fortified with methanol, (b) negative control liver (with Celite) fortified with 100 |_ig/ml mabuterol and (c) negative control liver (with C18) fortified with 100 |ig/ml mabuterol.
-183-

5.4 CONCLUSIONS
The work carried out shows that SFC is a promising technique for the
separation of aniline-type /3-agonists. The phenolic compounds which are
extremely polar, interacted with the column functional groups to the extent
that they did not elute in a reasonable analysis time. The conditions for
extraction by SFE were extremely harsh and it is questionable whether
supercritical conditions were really being applied. However, compounds like
mabuterol and clenbuterol may be extracted from an inert matrix (filter paper)
at an 80% recovery efficiency. From liver samples the recovery was much
lower; mabuterol was extracted at between 5 and 9 % when dispersed on Celite
and at 27 to 31 % when dispersed on C18 material. It is interesting to note that
samples prepared by an MSPD type procedure gave higher recovery,
especially as there are no references in the literature reporting C18 as a sample
dispersant.
The hydrophilic /3-agonists (salbutamol, terbutaline), would appear to
be unsuitable candidates for extraction in supercritical C 02 or even highly-
modified supercritical C 02. Alternative procedures which might be studied
include changing to a more polar supercritical fluid (e.g. ammonia) or in-situ
derivatisation of the compounds to make them less polar and, therefore, more
available to the supercritical fluid.

5.5 REFERENCES
1. C.M. White and R.K. Houck, J. High Res. Chromatogr. Chromatogr.
Comm., 9, 1986, 4.
2. R.E. Sievers and B. Hansen, B. Chem. Eng. News, 69, 1991, 2.
3. D.E. Raynie, Anal. Chem., 65, 1993, 3127.
4. C.P Ong, H.K. Lee and S.F.Y. Li, J. Chromatogr. Sci., 30, 1992,
319.
5. E.D. Ramsey, J.R. Perkins and D.E. Games, J. Chromatogr., 464,
1989, 353.
6. M.R. Euerby and R.J. Lewis and S.C. Nichols, Anal Proc., 28,
1991, 287.
7. L.J. Mulcahy and L.T. Taylor, Anal. Chem., 64, 1992, 981.
8. L.J. Mulcahy and L.T. Taylor, J. High Resolut. Chromatogr., 13,
1990, 393.
9. S. Khundker, J.R. Dean and S.M. Hitchen, Anal. Proc., 30, 1993,
472.
10. H. Liu and K.R. Wehmeyer, J. Chromatogr. (Biomed. Applic.), 115,
1992, 61.
11. H. Liu, L.M. Cooper, D.E. Raynie, J.D. Pinkston and K.R.
Wehmeyer, Anal. Chem., 64, 1992, 802.
12. D.R. Gere and E. M. Derrico, LC-GC Int., 6, 1994, 325.

13. D.R. Gere and E. M. Derrico, LC-GC Int., 7, 1994, 370.
14. K. Schaefer and W. Baumann, Fres. Z. Anal. Chem., 332, 1989, 884.
15. K.G. Furton and J. Rein, Anal. Chim. Acta, 236, 1990, 99.
16. M.L. Hopper and J.W. King, J. Assoc. Off. Anal. Chem., 74, 1991,
661.
17. S.B. Hawthorne, M.S. Krieger and D.J. Miller, Anal Chem., 61, 1989,
736.
18 S.B. Hawthorne, D.J. Miller and M.S. Krieger, J. Chromatogr. Sei.,
27, 1989, 347
19. S.B. Hawthorne, D.J. Miller and M.S. Krieger, J. High Resolut.
Chromatogr., 12, 1989, 714.
20. F.I. Onuska and K. A. Terry,/. High Resolut. Chromatogr., 12, 1989,
357.
21. J. Rein, C.M. Cork and K.G furton, J. Chromatogr., 545, 1991, 149.
22. F.M Lancas, M.H.R. Matta, L.J. Hayasida and E. Carrilho J. High
Resolut. Chromatogr. Chromatogr. Comm., 14, 1991, 633.
23. S.B. Hawthorne, M.L. Riekkola, K. Serenius, Y. Holm, R. Hiltunen
and K. Hartonen, J. Chromatogr., 634, 1993, 297.
24. M.K.L. Bicking, T.G. Hayes, J.C. Kiley and S.N. Deming, J.
Chromatogr. Sei. 31, 1993, 170.
25. M. Verschuere, P. Sandra and F. David, J. Chromatogr. Sei., 30,
1992, 388.
-186-

26. P. Lembke and H. Engelhardt, Chromatographia, 35, 1993, 509.
27. A.J. Berry, D.E. Games, I.C. Mylchreest, J.R. Perkins and S.
Pleasance, Biomed. Environ. Mass Spectrom., 15, 1988, 105.
28. R.F. Cross, J.L. Ezzell and B.E. Richtor, J. Chromatogr. Sei., 31,
1993, 162.
29. R.J. Maxwell, J.W. Persabene and W. Fiddler, J. Chromatogr. Sei.,
31, 1993, 212.
30. R.J. Maxwell, O.W. Parks and E.G. Piotrowski, J. High Resolut.
Chromatogr., 15, 1992, 807.
31. E. Sauvage, J.L. Rocca and G. Toussaint, J. High Resolut
Chromatogr., 16, 1993, 234.
32. S.B. Hawthorne, D.J. Miller, D.E. Nivens and D.C. White, Anal.
Chem., 64, 1992, 405.
33. P. Jackson, Ph.D Thesis, University of Swansea, 1993.
34. O. Gyllenhaal and J. Vessme, J. Chromatogr., 628, 1993, 275.
-187-

Appendix A: Publications
1. "Application o f Matrix Solid Phase Dispersion for the Determination ofClenbuterol in Liver Samples", Damien Boyd, Paula Shearan, Sean Hopkins, Michael O’ Keeffe and Malcolm R. Smyth, Analytica Chimica Acta, 275, 1993, 221.
2 "Matrix Solid Phase Dispersion linked to Immunoassay Techniques forthe Determination of Clenbuterol in Bovine Liver Samples ", Damien Boyd, Paula Shearan, Sean Hopkins, Michael O’ Keeffe and Malcolm R. Smyth, Analytical Proceedings, 30, 1993, 156. .
3. "Methodology fo r Extraction of Salbutamol from Tissue Samples with Determination by Immunoassay ”, Damien Boyd, Michael O’ Keeffe and Malcolm R. Smyth, in Proceedings of the FLAIR Workshop on ¡3- agonists and Bound Residues (eds: H.A. Kuiper and L.A.P. Hoogenboom), Thessaloniki, Greece, 1992, p. 133.
4. "Matrix Solid Phase Dispersion (MSPD) as a Multiresidue Technique for (3-Agonists in Bovine Liver Samples", Damien Boyd, Michael O’ Keeffe and Malcolm R. Smyth, Analyst, 119, 1994, 1467.
5. "A Voltammetric Study o f Salbutamol, Fenoterol and Metaproterenol at Unmodified and Nafion-modified Carbon Paste Electrodes", Damien Boyd, Jose Ramon Barrierra Rodriquez, A.J. Miranda Ordieres, Paulino Tunon Blanco and Malcolm R. Smyth, Analyst (1994), in press.
6. "Application o f a Nafion-modified Carbon Paste Electrode fo r the Adsorptive Stripping Voltammetric Determination of Fenoterol in pharmaceutical preparations and Biological Fluids", Damien Boyd, Jose Ramon Barrierra Rodriquez, Paulino Tunon Blanco and Malcolm R. Smyth, Journal of Pharmaceutical and Biomedical Analysis, (1994), in press.