ANALYSIS OF SELECTED WATER QUALITY FACTORS IN THE …
266
Special Publication SJ 83-SP1 ANALYSIS OF SELECTED WATER QUALITY FACTORS IN THE UPPER ST. JOHNS RIVER BASIN Report to the St. Johns River Water Management District, Palatka By Thomas V. Belanger Faculty Investigator and Scott D. VanVonderen and Thomas J. Carberry Graduate Research Assistants May, 1983 Depaitment of Environmental Science and Engineering Florida Institute of Technology Melbourne, Florida 32901
Transcript of ANALYSIS OF SELECTED WATER QUALITY FACTORS IN THE …

Special Publication SJ 83-SP1
ANALYSIS OF SELECTED WATER QUALITY FACTORS
IN THE
UPPER ST. JOHNS RIVER BASIN
Report to the
St. Johns River Water Management District, Palatka
By
Thomas V. Belanger
Faculty Investigator
and
Scott D. VanVonderen and Thomas J. Carberry
Graduate Research Assistants
May, 1983
Depaitment of Environmental Science and EngineeringFlorida Institute of Technology
Melbourne, Florida 32901

TABLE OF CONTENTS
ACKNOWLEDGEMENTS . . . . . . . . i i
LIST OF TABLES iii
LIST OF FIGURES v
INTRODUCTION 1
SITE DESCRIPTION 3UPPER BASIN 3SAMPLING SITES 5
METHODS 12CANALS, LAKE WASHINGTON AND AGRICULTURAL PUMPS 12
LABORATORY MEASUREMENTS . 16FIELD MEASUREMENTS ! . . 18
CORING AND BATHYMETRIC TRANSECTS 19
QUALITY CONTROL 26LABORATORY QUALITY CONTROL 26DATA HANDLING AND RECORD KEEPING 26FIELD QUALITY CONTROL 27LAKE WASHINGTON DISCHARGE CHECK . . 28SAMPLE EXCHANGE 28
RESULTS AND DISCUSSION 31LAKE WASHINGTON INLET-OUTLET 31UPPER ST. JOHNS RIVER CANALS 38DISCHARGE PATTERNS IN THE STUDY AREA 48AGRICULTURAL PUMPAGE 50
DUD A CANAL AND NORTH MORMON PUMP SITES 5.1ZIGZAG CANAL PUMP SITE 58MARY A PUMP 67DIURNAL PUMP EVENT 70
SEDIMENTATION STUDIES , 72CORING PHASE 72SUSPENDED SOLIDS LOADING DATA 84SUSPENDED SOLIDS LOADING FROM PUMPS 89WATERHYACINTH STUDIES 93SEDIMENTATION FROM WATERHYACINTHS 98SEDIMENTATION DISCUSSION 99SEDIMENTATION CONCLUSIONS 100
DIURNAL OXYGEN STUDIES 101
SUMMARY AND CONCLUSIONS . . 107AGRICULTURAL PUMPAGE . .107LAKE WASHINGTON INLET-OUTLET 1QQUPPER ST. JOHNS RIVER CANALS . . . 109DIURNAL OXYGEN STUDIES 110SEDIMENTATION • 112
LITERATURE REVIEW 113

ACKNOWLEDGEMENTS
The assistance and cooperation of several people were essential for the
successful completion of this project. Thanks are extended to Betty Fink, whose
typing of this report while under a very heavy work load permitted its' completion.
The assistance of Jim Hulbert of the FDER, Bob Byrd of the USGS and Dave Cox of
Florida GFWFC was valuable in providing access to published and unpublished data.
The complete cooperation of the SJRWMD, primarily through the efforts of Dr. Ed
Lowe and Carol Fall, was extremely helpful in terms of in-kind services and the
notification of several pump events. The efforts of Scott VanVonderen were
instrumental in completing this project. Scott was involved in all the field
work and was responsible for the bulk of the laboratory work, especially after the
other research assistant, Tom Carberry,was incapacitated for a period due to a
broken leg.
ii
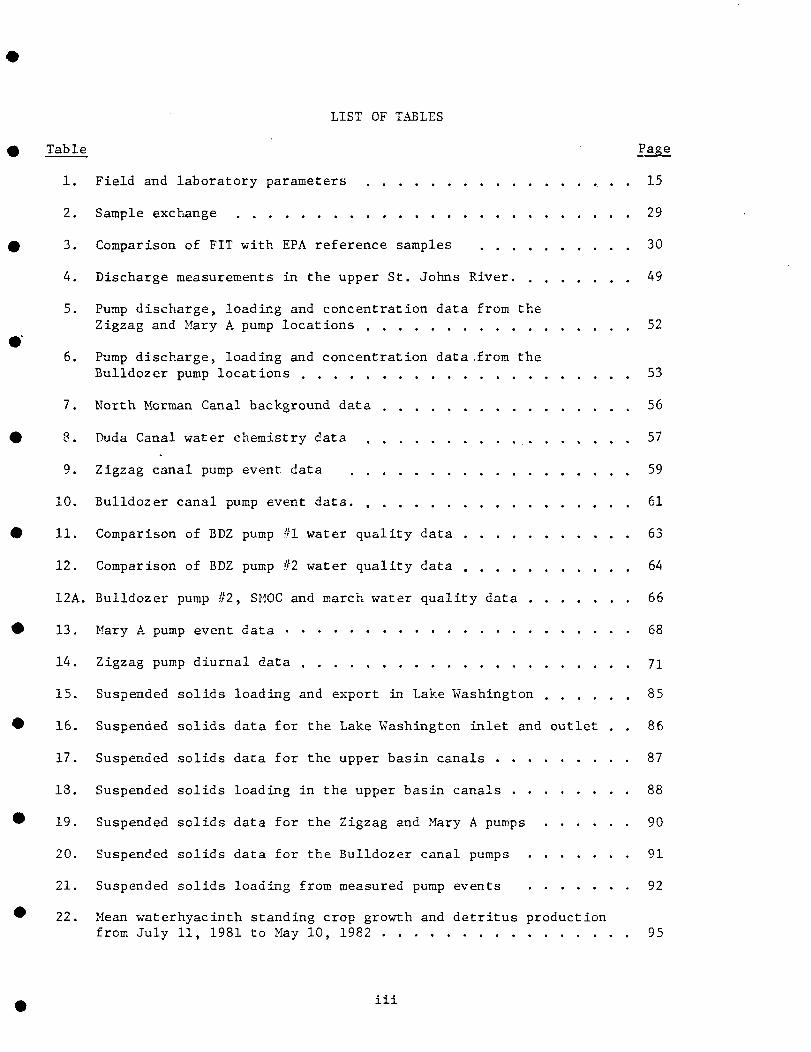
LIST OF TABLES
Table Page
1. Field and laboratory parameters . . 15
2. Sample exchange 29
3. Comparison of FIT with EPA reference samples 30
4. Discharge measurements in the upper St. Johns River 49
5. Pump discharge, loading and concentration data from theZigzag and Mary A pump locations 52
6. Pump discharge, loading and concentration data .from theBulldozer pump locations 53
7. North Morman Canal background data 56
8. Duda Canal water chemistry data 57
9. Zigzag canal pump event, data 59
10. Bulldozer canal pump event data. 61
11. Comparison of BDZ pump //I water quality data 63
12. Comparison of BDZ pump //2 water quality data 64
12A. Bulldozer pump #2, SMOG and march water quality data 66
13. Mary A pump event data 68
14. Zigzag pump diurnal data 71
15. Suspended solids loading and export in Lake Washington 85
16. Suspended solids data for the Lake Washington inlet and outlet . . 86
17. Suspended solids data for the upper basin canals 87
18. Suspended solids loading in the upper basin canals 88
19. Suspended solids data for the Zigzag and Mary A pumps 90
20. Suspended solids data for the Bulldozer canal pumps 91
21. Suspended solids loading from measured pump events 92
22. Mean waterhyacinth standing crop growth and detritus productionfrom July 11, 1981 to May 10, 1982 95
iii

Table Page
23. Average detritus production, root biomass and turnover timefor root tissues of waterhyacinths maintained under fourculture regimes from July 11, 1981 to May 10, 1982 97
24. Water chemistry and solar radition data for diurnal curvespresented in Figure 35. 103
25. Single and two station oxygen metabolism data collected nearCamp Holly r 105
IV

LIST OF FIGURES
Figure Page
1. Location map 4
2. Sampling sites 6
3. Zigzag Canal and Mary A pump sites 7
4. Bulldozer Canal pump site 9
5. North Mormon Canal pump site 10
6. Duda pump site 11
7. Transect locations in Blue Cypress Lake 20
8. Transect locations in Lake Hellen Blazes 21
9. Transect locations in Lake Sawgrass 22
10. Transect locations in Lake Washington 23
11. Transect locations in Lake Winder 24
12. Transect locations in Lake Poinsett 25
13. Discharge and total N concentrations and loading at LWI 32
14. Discharge and total N concentrations and loading at LWO 33
15. Discharge and total P concentrations and loading at LWI. . . . . . 34
16. Discharge and total P concentrations and loading at LWO 35
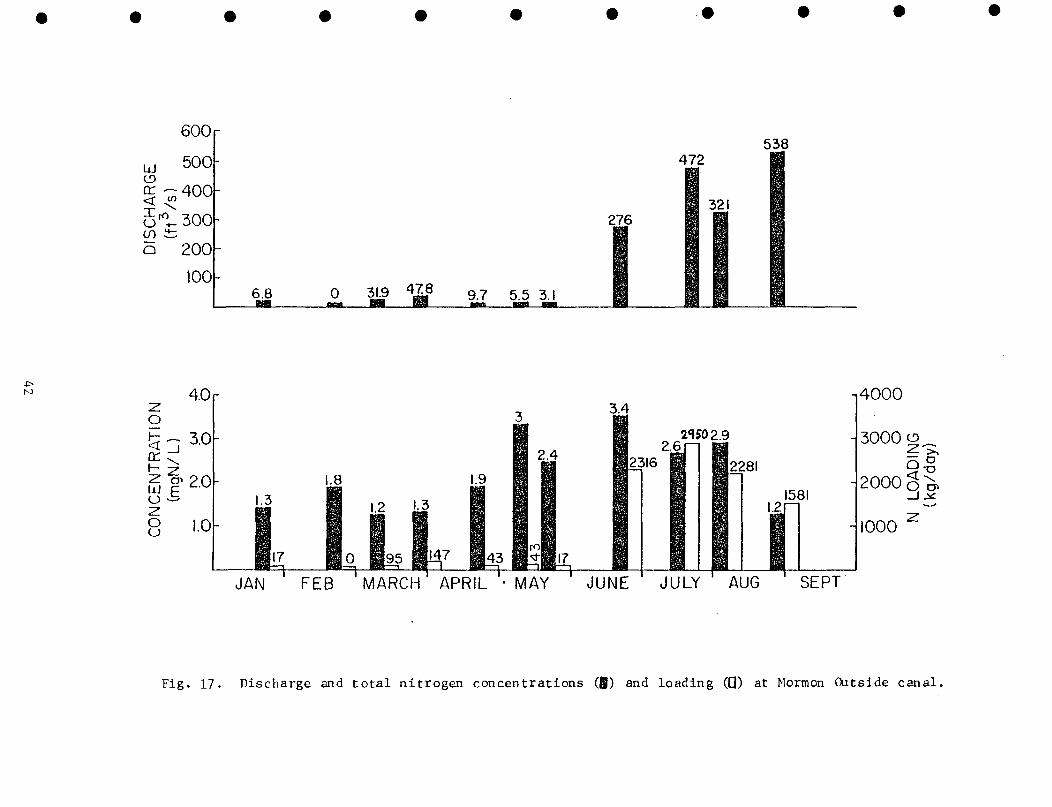
17. Discharge and total N concentrations and loading at SMOC 42
18. Discharge and total P concentrations and loading at SMOC 43
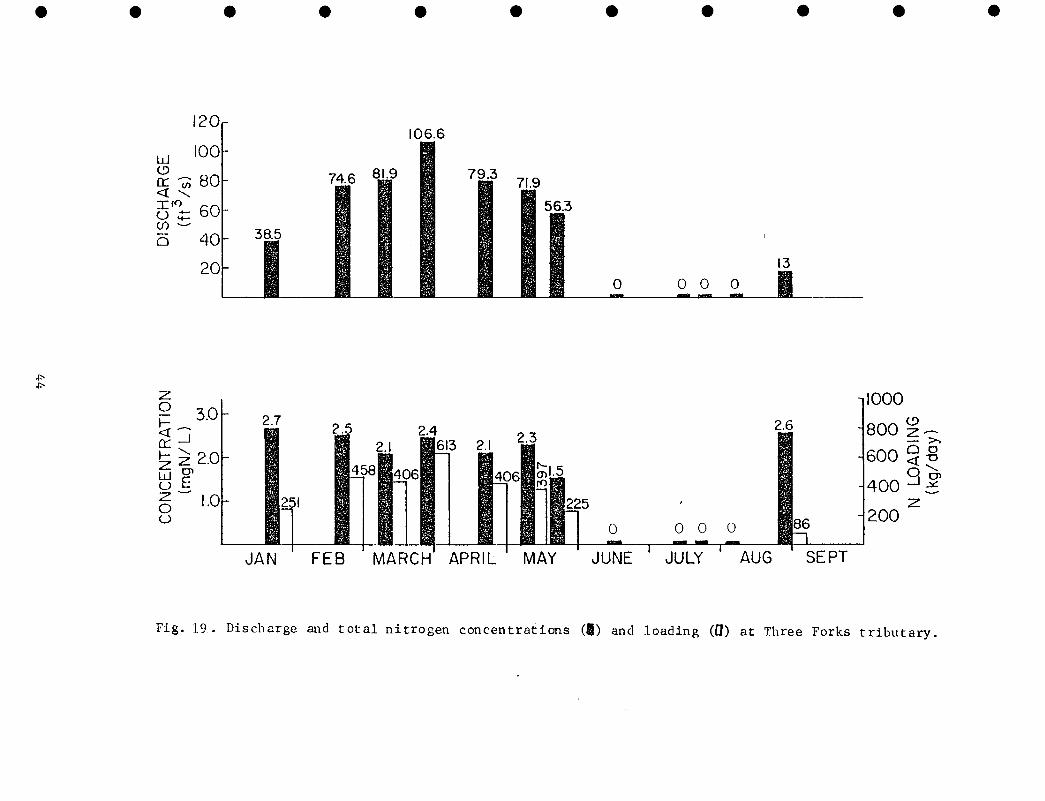
19. Discharge and total N concentrations and loading at TFR 44
20. Discharge and total P concentrations and loading at TFR 45
21. Discharge and total N concentrations and loading at BDZ canal . . 46
22. Discharge and total P concentrations and loading at BDZ canal . . 47
23. Discharge and total N concentrations from agricultural pumps . . 54
24. Discharge and total P concentrations from agricultural pumps . , 55
25. West bank, center and east bank cores in Lakes Hellen Blazes,Sawgrass and Washington 74
v
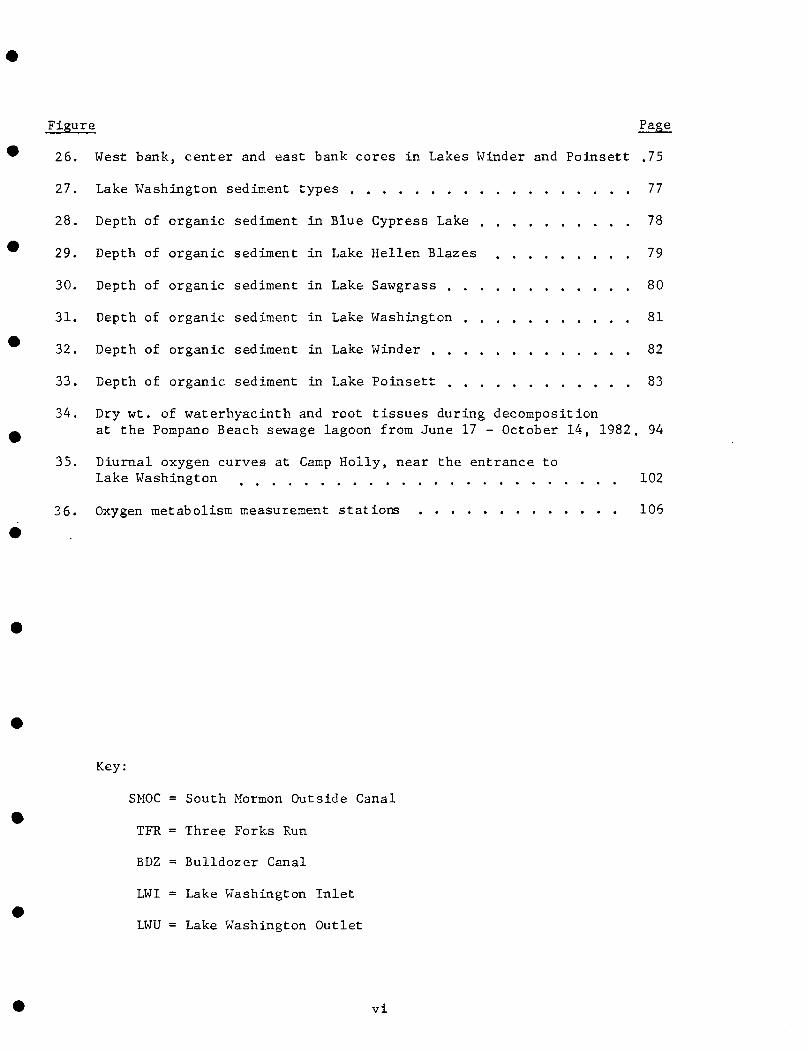
Figure Page
26. West bank, center and east bank cores in Lakes Winder and Poinsett .75
27. Lake Washington sediment types 77
28. Depth of organic sediment in Blue Cypress Lake 78
29. Depth of organic sediment in Lake Hellen Blazes 79
30. Depth of organic sediment in Lake Sawgrass 80
31. Depth of organic sediment in Lake Washington 81
32. Depth of organic sediment in Lake Winder 82
33. Depth of organic sediment in Lake Poinsett 83
34. Dry wt. of waterhyacinth and root tissues during decompositionat the Pompano Beach sewage lagoon from June 17 - October 14, 1982. 94
35. Diurnal oxygen curves at Camp Holly, near the entrance toLake Washington 102
36. Oxygen metabolism measurement stations 106
Key:
SMOC = South Mormon Outside Canal
TFR = Three Forks Run
BDZ = Bulldozer Canal
LWI = Lake Washington Inlet
LWU = Lake Washington Outlet
vi

CHAPTER I
INTRODUCTION
The upper St. Johns River basin has undergone rapid agricultural development
and urbanization in recent years, and this has affected the water quality and
reduced the storage capacity of the river and marsh. The marsh and floodplain,
necessary for natural filtration of pollutants, have bean altered and reduced
drastically due to the creation of levees and canals. Historical data indicate
that levels of dissolved solids, trace metals and various mineral and nutrient
components have been gradually increasing (Mason and Belanger, 1979) . The pumpage
of excess water from agricultural lands has also been implicated as a factor
contributing to frequent fish kills by causing dissolved oxygen sags in certain
sections of the river.
Today nearly 50 percent of the original floodplain storage of the St. Johns
River no longer exists. It appears that the delicate balance of the St. Johns
River ecosystem has been upset, particularly in the upper basin. A healthy
system requires adequate space and time to work efficiently. When channelization
and diking activities reduce the size of the marsh too much, the slow moving
sheet-flow system, that filters pollutants and provides flood protection is
disrupted. Pollutant loads are then short circuited into the system through canals
and agricultural pumps and these inputs serve as sources of point source pollution,
often resulting in fish kills and algal and aquatic plant growth.
The primary objectives of this study were twofold. These were:
(1) to monitor specific agricultural pumps in the upper basin and
determine loading rates to the canals and river, and
(2) to perform sediment coring and bathymetric transect studies en
the chain of six lakes in the upper St. Johns river basin for
comparison with previous and future studies so that sedimentation
rate estimates can be made.
The sedimentation and agricultural pumpage research was subcontracted
to Florida Institute of Technology and funded as part of an EPA Clean Lakes
Grant given to the St. Johns Water Management District for a Phase I Diagnostic
Feasibility Study of the upper St. Johns River and Lakes as provided in EPA
Regulation 40 CFR Part 25. Other phases of the Clean Lakes Phase I Study
undertaken by the SJWND include: 1) further sedimentation work; 2) water
quality studies and 3) optimum hydroperiod studies. The majority of this work
will not be presented in this report.
Secondary objectives of our research included (research not funded by the
grant) : 1) nutrient and suspended solids loading estimates from selected canals
in the upper basin, 2) nutrient and suspended solids loading estimates into
and out of Lake Washington and associated mass balance calculations, 3) Diurnal
and light-dark bottle productivity studies at U . S . 192 near the entrance of Lake
Washington so that community and phytoplankton production estimates could be made;
4) light-dark bottle in situ experiments to investigate the occurrence of a
photochemical ferrous-ferric catalytic cycle operating as an oxygen sink in the
system, and 5) water hyacinth decomposition studies in Lake Washington.
Detailed methodologies of these objectives are presented in Chapter III.
The water hyacinth decomposition studies and diurnal oxygen studies will be
discussed separately in the report.

CHAPTER II
SITE DESCRIPTION
UPPER BASIN
The upper basin of the St. Johns River is located in East Central Florida.
The location of the upper St. Johns River Basin, within the entire basin, is
shown in Figure 1. The upper basin has a length of 110 miles and an average
width of 22 miles (SJRWMD, 1979). Originally the river flowed via sheet flow
from the St. Lucie Marsh to a point just south of Lake Hellen Blazes where the
river channel begins. Due to extensive development, including highway construction
and artificial drainage canals, the area south of the Florida turnpike provides
almost no source water to the upper St. Johns River basin (SJRWKD, 1979). The
rest of the basin has not been spared either as drainage canals crisscross the
area and during normal conditions carry most of the water present to the river
channel.
Flow in the basin is generally slow as the average river gradient is only
0.20 feet per mile (SJRWMD, 1979). The gradient between U .S . 192 and Lake
Washington is only O.i)5 feet per mile (Mason and Belanger 1979) . Because of
this small gradient, runoff from heavy rainfall events often leads to localized
flooding (SJRWMD, 1979). Rainfall in the upper basin is characterized by high
intensity and short duration and averages approximately 55 inches of rainfall per
year (Cox et al. , 1976) . About 50% of this precipitation falls during the months
from June to October (SJRWMD, 1979). The climate of this area is classified as
humid subtropical and is characterized by hot, humid summers and mild dry winters.
This study does not include the entire upper basin but covers an area within
the basin that extends northward from state road 60 to state road 520 (Figure 2 ) .
Water in this area flows via sheet flow and drainage canals to a point just south
of Lake Hellen Blazes where a proper channel is formed and the St. Johns River

Jacksonville
ATLANTIC
OCEAN
LakeGeorge
^DelandUpper BasinBoundary
Orlando/
SR 520
Lake WindeT
Lake Sawgrass
Lake Apopka
Lake Helen Blazes
Blue Cypress Lake
Puzzle Lake
Lake Poinsett
Cocoa
Lake Washington
Melbourne
SR 60
•Vero Beach
Fig. 1. Location rr.an.
actually begins. The river extends northward from that point and is interrupted
only by a chain of small lakes. From south to north in order of appearance these
lakes include Lake Hellen Blazes, Sawgrass, Washington, Winder and Poinsett. Blue
Cypress Lake, located near the southern boundary of the upper basin, was also in-
cluded in the sedimentation portion of the study.
SAMPLING SITES
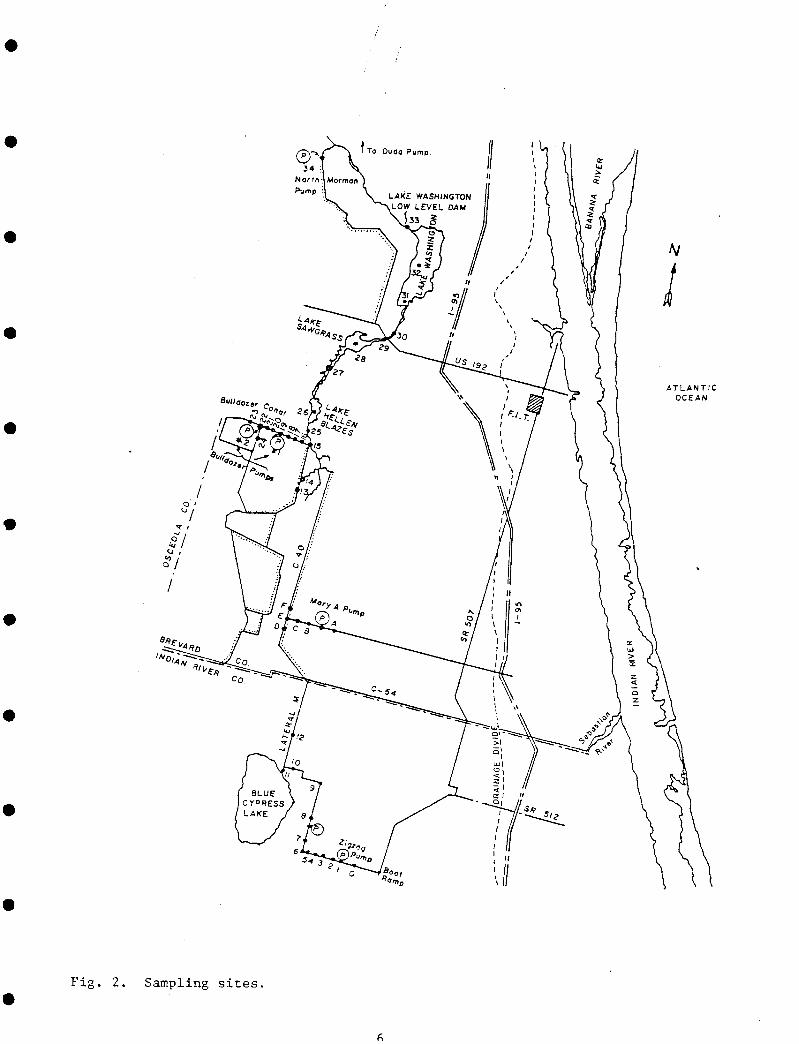
Sampling sites from Lake Washington south refer to Figure 2. The sampling
sites in Lake Washington were located- at the inlet and outlet of the lake (Figure 2) .
The inlet site, site 30, was located approximately 100 yards north of U . S . 192.
The outlet site, site 33, was located at the Lake Washington low level dam and
only water passing over the dam was sampled.
The canal sites were all located south of Lake Hellen Blazes and are shown in
Figure 2, also. Site 13 was located on South Mormon Outside Canal approximately
100 yards south of Three Forks Run. Site 14 was located about 50 yards upstream
from the mouth of Three Forks Run. Site 16 was located about 50 yards upstream
from the confluence of South Mormon Outside Canal and the St. Johns River on
Bulldozer Canal. These sites were chosen to match sampling sites used in the past
by the St. Johns River Water Management District, Florida Game and Fresh Water Fish
Commission and Florida Institute of Technology for data comparison purposes. All
other numbered sites on Figure 2 refer to water quality and field sampling sites
and were not routinely sampled. Field data at these sites are presented in Appendix A.
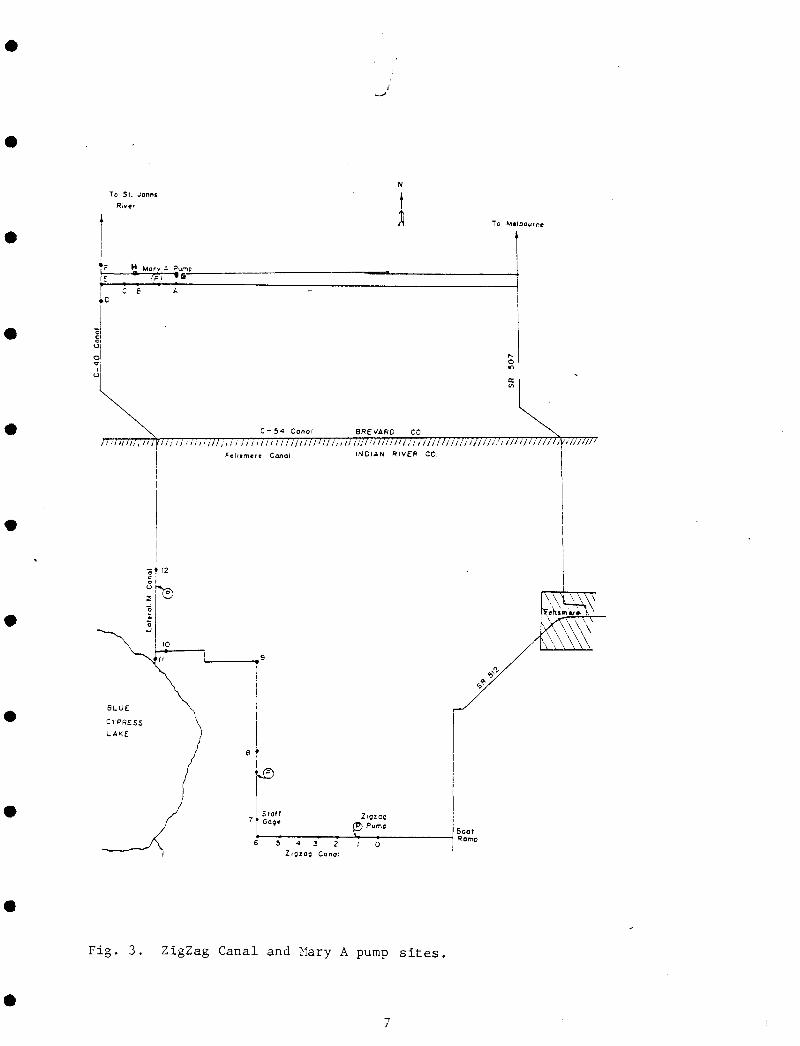
The agricultural pump sites chosen represent those selected by the SJRWMD
for the Phase I Diagnostic/Feasibility Study of the upper St. Johns River chain
of lakes. The pumps were chosen based on pump capacities, frequency of pumping
and land use types present in each specific pump drainage area. The most southern
pump is the Zig Zag pump and it is located in Indian River County on Ditch 34
which runs into Zig Zag Canal (Site #1 on Figures 2 and 3). This pump has a rated
LAKE WASHINGTONLOW LEVEL 0AM
Fig. 2. Sampling sites.
To St. JonnjRiver
To MeiDournej
c H Marv A Pumpr fpi •&
> « • ' < •
»c
C- 54 Conol BREVARD CO
i/i a /ii ii in I,: i / / / / / / / / / / / / / / / / / / / / / / / / ///'/.•/ in an: i / / / / / / / / / / / / / / / / / / / ///'///'/INOl»N RIVER CO
ZigzcgI Pump
5 4 3 2 1 0Zigzag Cana.'
BoatRamp
Fig. 3. ZigZag Canal and Mary A pump sites,

capacity of 150,000 GPM and drains primarily citrus area. North of this is the
Mary A pump, located on Old Sottile Outside Canal in South Brevard County
(Figure 3). This pump has a rated capacity of 120,000 GPM and drains improved
pasture and row crops. Just south of Lake Helien Blazes are the Bulldozer pumps,
located on the Sulldozer Canal system (Sites 22 and 19 on Figures 2 and 4 ) .
Bulldozer pump #2 is the most western pump sampled and it drains citrus and has
a rated capacity of 16,000 GPM. Bulldozer pump #1 is rated at 32,000 GPM and
drains improved pasture. The remaining pumps are located north of Lake Washington,
although they were not sampled by Florida Institute of Technology during operation
in this study, The North Mormon pump, located on North Mormon Outside Canal,
drains improved pasture and is rated at 12,000 GPM (Figure 5) . The most northern
pump is the Duda pump, located on the Duda & Sons Canal north of Lake Winder
(Figure 6) . This pump drains improved pasture area and has a rated capacity of
57,000 GPM.
Each of these sampling sites, with the exception of the Lake Washington sites,
represent a distinct point source of pollution and should provide valuable loading
information to management and enforcement agencies.

N
Bulldozer Canal23 22 19
—• « V —2120 (P)
24 W
Bul ldozerPump
ai4-1•HW
aE
p.
cmo
a)No
<f
60

N
ex3O,
coMO
Ml•H

46 45 4443 42 41• • » e •—
©DudaPump
a)•u•H
cu
an)
X)
Q
60•H

CHAPTER III
METHODS
CANALS, LAKE WASHINGTON AND AGRICULTUBAL PUMPS
We decided at the outset of this study to sample the Three Forks, South
Mormon and Bulldozer Canal sites as well as the inlet and outlet of Lake
Washington at least twice monthly. In addition, the agricultural pump sites
were to be sampled as often as possible when the pumps were operating. However,
due to mechanical boat problems and drought conditions this schedule could not
always be maintained.
The canal sites were viewed as specific point sources of discharge into the
St. Johns river; the quality of these sources reflect the individual drainage
areas. These sites and the Lake Washington sites were located so that comparisons
could be made with historical data collected by other researchers (Cox et al.,
1976; Mason and Belanger, 1979; SJKWMD, 1980). The agricultural pump station
sampling locations were chosen after consultation with the St. Johns River Water
Management District. Five pump stations were identified as high priority pumps
and the three pumps sampled during this study (Bulldozer, Mary A and Zig Zag)
were given the highest priority in order to maximize information for the Phase I
Diagnostic/Feasibility Study.
At each canal site flow ( f t / s ) was measured using a Marsh-McBirney model 201
flowmeter. The method of measurement used at each site was dependent upon water
depth. At depths of 3.5 ft. or less, a single flow measurement was taken at a
depth equal to 40% of the water column depth. At depths greater than 3.5 f t . two
separate measurements of flow were made; one at a depth equal to 20% of the water
column and the other at a depth equal to 80% of the x^ater column. The values
obtained at each depth were averaged to obtain a single value at each site. Depth
12

measurements were made by stretching a rope marked in one foot intervals across
the channel and securing it to each side. Channels of 35 ft. or less required flow
measurements at distances equivalent to 25% and 75% of the channel width. Three,
flow measurements were ir.ade in larger channels at locations equivalent tc 17%,<-\
50%, and £3% of the distance across the channel. Area ( f t ~ ) was calculated for
each section of the channel and multiplied by the average flow rate ( f t / s ) in that
section to obtain discharge (ft /s). Total discharge for the entire channel was
obtained by adding the individual section discharges. If no measurable flow was
observed, water samples were taken for background data.
Sampling at the outlet of Lake Washington was accomplished by collecting water
as it passed over the weir with a Van Dorr, water Sampler held parallel to the flow.
For each sample date the head above the weir was recorded so that discharge could
be calculated with the standard equation for a sheet pile weir (Nascn and Belanger,
1979) . Samples were taken at sites located 33%and 66% of the distance across the
channel. Data were averaged for use with the calculated total discharge in order to
obtain loading rates leaving Lake Washington.
Water samples 'taken at the other sites were collected with a tube sampler. This
sampler consisted of a four foot section of PVC pipe that had a 1.5 in. inside
diameter. A length of rope was passed through the pipe and attached to a rubber
stopper which sealed the tube. At each site, the sampler was placed vertically
into the water and rapidly sealed at the bottom by pulling on the rope. This was
done quickly to prevent fallout of suspended matter in the water column. It was
felt that the tube sampler would give a more representative sample for the entire
water column than a grab sample. Each sample was mixed and poured into a previously
acid washed one liter bottle. Samples were taken in duplicate at each site and
placed on ice fo r return to the lab , at which time they were refr igerated.
13
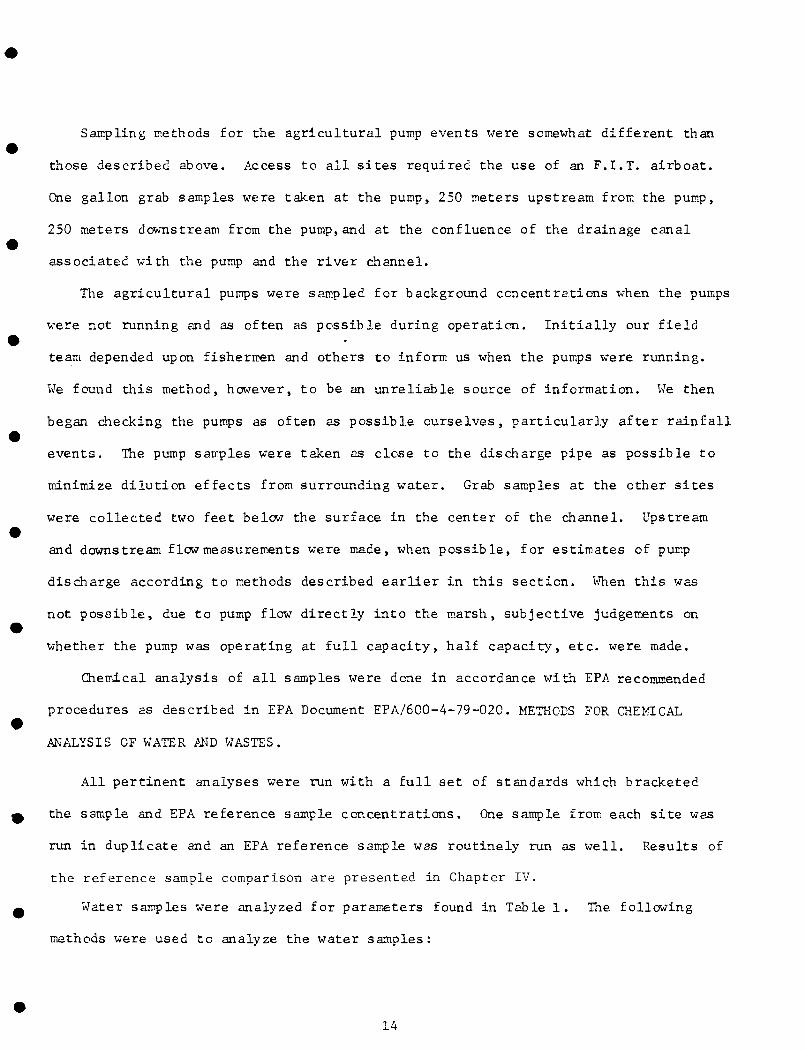
Sampling methods for the agricultural pump events were somewhat different than
those described above. Access to all sites required the use of an F.I.T. airboat.
One gallon grab samples were taken at the pump, 250 meters upstream from the pump,
250 meters downstream from the pump,and at the confluence of the drainage canal
associated with the pump and the river channel.
The agricultural pumps were sampled for background concentrations when the pumps
were not running and as often as possible during operation. Initially our field
team depended upon fishermen and others to inform us when the pumps were running.
We found this method, however, to be an unreliable source of information. We then
began checking the pumps as often as possible ourselves, particularly after rainfall
events. The pump samples were taken as close to the discharge pipe as possible to
minimize dilution effects from surrounding water. Grab samples at the other sites
were collected two feet below the surface in the center of the channel. Upstream
and downstream flow measurements were made, when possible, for estimates of pump
discharge according to methods described earlier in this section. When this was
not possible, due to pump flow directly into the marsh, subjective judgements on
whether the pump was operating at full capacity, half capacity, etc. were made.
Chemical analysis of all samples were done in accordance with EPA recommended
procedures as described in EPA Document EPA/600-4-79-020. METHODS FOR CHEKTCAL
ANALYSIS OF WATER AND WASTES.
All pertinent analyses were run with a full set of standards which bracketed
the sample and EPA reference sample concentrations. One sample from each site was
run in duplicate and an EPA reference sample was routinely run as well. Results of
the reference sample comparison are presented in Chapter IV.
Water samples were analyzed for parameters found in Table 1. The following
methods were used to analyze the water samples:
14

Table 1. Field and laboratory parameters.
Field:
Water temperature
Dissolved oxygen
PH
Specific conductance
Transparency
Flow
Lab :
Turbidity
True color
Suspended solids
Alkalinity
Hardness
Chloride
Sulfate
Ortho phosphate (unfiltered and filtered)
Total phosphorus (unfiltered and filtered)
Total Kjeldahl nitrogen (unfiltered and filtered)
Ammonia nitrogen
Nitrate-nitrite nitrogen
Chlorophyll
BOD
Iron
Calcium
Magnesium
Potassium
15
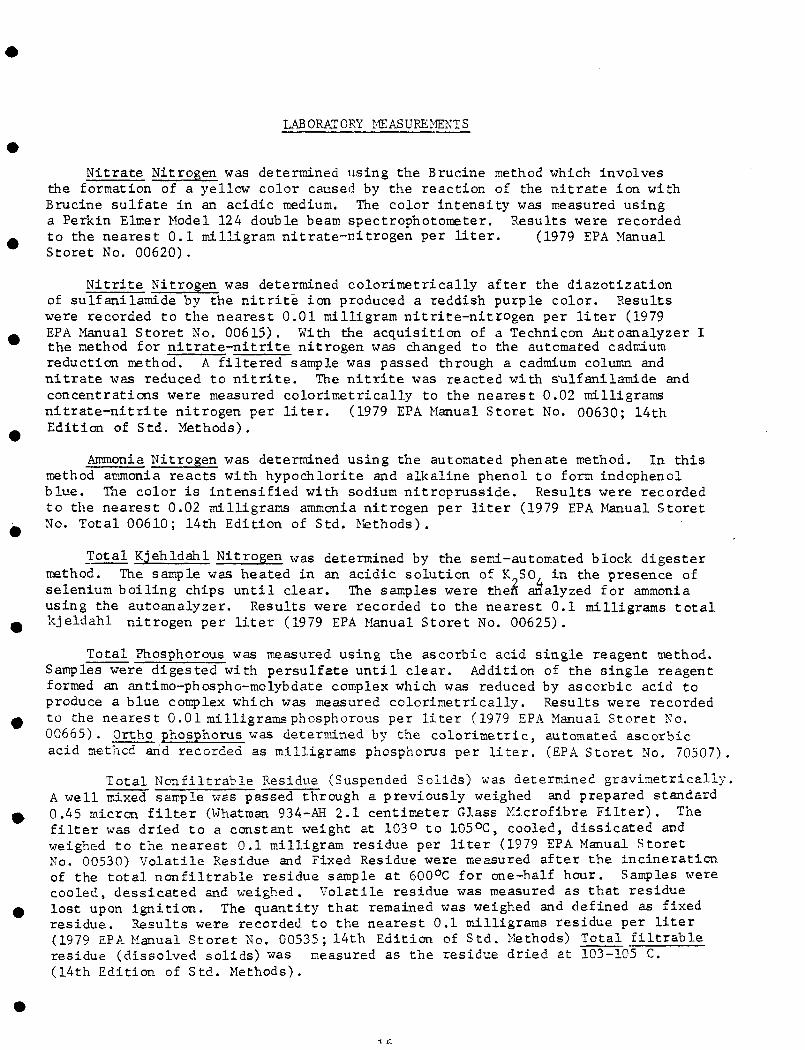
LABORATORY MEASUREMENTS
Nitrate Nitrogen was determined using the Brucine method which involvesthe formation of a yellow color caused by the reaction of the nitrate ion withBrucine sulfate in an acidic medium. The color intensity was measured usinga Perkin Elmer Model 124 double beam spectrophotometer. Results were recordedto the nearest 0.1 milligram nitrate-nitrogen per liter. (1979 EPA ManualStoret No. 00620) .
Nitrite Nitrogen was determined colorimetrically after the diazotizationof sulfanilamide by the nitrite ion produced a reddish purple color. Resultswere recorded to the nearest 0.01 milligram nitrite-nitrogen per liter (1979EPA Manual Storet No. 00615). With the acquisition of a Technicon Autoanalyzer Ithe method for nitrate-nitrite nitrogen was changed to the automated cadmiumreduction method. A filtered sample was passed through a cadmium column andnitrate was reduced to nitrite. The nitrite was reacted with s"u If anil amide andconcentrations were measured colorimetrically to the nearest 0.02 milligramsnitrate-nitrite nitrogen per liter. (1979 EPA Manual Storet No. 00630; 14thEdition of Std. Methods).
Ammonia Nitrogen was determined using the automated phenate method. In thismethod ammonia reacts with hypochlorite and alkaline phenol to form indophenolblue. The color is intensified with sodium nitroprusside. Results were recordedto the nearest 0.02 milligrams ammonia nitrogen per liter (1979 EPA Manual StoretNo. Total 00610; 14th Edition of Std. Methods).
Total Kjehldahl Nitrogen Was determined by the semi-automated block digestermethod. The sample was heated in an acidic solution of K SO. in the presence ofselenium boiling chips until clear. The samples were then analyzed for ammoniausing the autoanalyzer. Results were recorded to the nearest 0.1 milligrams totalkjeldahl nitrogen per liter (1979 EPA Manual Storet No. 00625).
Total Phosphorous was measured using the ascorbic acid single reagent method.Samples were digested with persulfate until clear. Addition of the single reagentformed an antimo-phospho-molybdate complex which was reduced by ascorbic acid toproduce a blue complex which was measured colorimetrically. Results were recordedto the nearest 0.01 milligrams phosphorous per liter (1979 EPA Manual Storet No.00665). Ortho phosphorus was determined by the colorimetric, automated ascorbicacid method and recorded as milligrams phosphorus per liter. (EPA Storet No. 70507).
Total Nonfiltrable Residue (Suspended Solids) was determined gravinetrically.A well mixed sample was passed through a previously weighed and prepared standard0.45 micron filter (Whatman 934-AH 2.1 centimeter Glass Kicrofibre Filter). Thefilter was dried to a constant weight at 103° to 105°C, cooled, dissicated andweighed to the nearest 0.1 milligram residue per liter (1979 EPA Manual StoretNo. 00530) Volatile Residue and Fixed Residue were measured after the incinerationof the total nonfiltrable residue sample at 600°C for one-half hour. Samples werecooled, dessicated and weighed. Volatile residue was measured as that residuelost upon ignition. The quantity that remained was weighed and defined as fixedresidue. Results were recorded to the nearest 0.1 milligrams residue per liter(1979 EPA Manual Storet No. 00535; 14th Edition of Std. Methods) Total filtrableresidue (dissolved solids) was measured as the residue dried at 103-105 C.(14th Edition of Std. Methods).

True Color was determined using the spectrophotometric modification of thevisual platinum-cobalt method. Results were recorded in chloroplatinate units.(14th Edition of Std. Methods).
Alkalinity was determined using the bromcresol green-methyl red titration.(14th Edition of Std. Methods).
Hardness was determined by the EDTA titrimetric method. (14th Edition ofStd. Methods).
BOD was measured using the five day incubation. (14th Edition of Std.
Methods; EPA Storet No. 00310).
Chloride was measured with the colorimetric, automated ferricyanide procedure(1979 EPA Manual Storet No. 00940).
Sulfate was determined with the turbidimetric method. (14th Edition of Std .Methods).
Chlorophyll JL_, b, and c were measured by the trichromatic spectrophotcmetricmethod"! (14th Edition of Std. Methods).
Iron was determined by the atomic absorption spectrophotometric method.(14th Edition of Std. Methods).
Calcium - (same as above).
Magnesium - (same as above).
Potassium - Flame photometric method. (14th Edition of Std. Methods) .
Results of all raw analytical data were recorded in laboratory notebooks andlater transferred to laboratory data sheets by the indiviudal analyst.
17

FIELD MEASUREMENTS
In situ reading of conductivity and temperature were measured with a YSI
Model 33 SCT meter. Dissolved oxygen was measured with a Leeds and Northrup
7932 portable dissolved oxygen meter. This meter, unlike the standard YSI
meter, is independent of sensor fouling and flow rate. Measurement of all
in situ field parameters were taken at 0.5m depth increments, when possible.
Transparency and depth were measured using a secchi disk. Flow measurements
were made using a Marsh McBirney electromagnetic flow meter. In situ field
data were recorded in Field Notebooks and later transferred to Field Data Sheets
similar to those used by the SJKWMD.
18

CORING AND BATHYMETRIC TRANSECTS
The sedimentation portion of the research program was intended to provide
information on the rate and nature of sedimentation in the lakes of the upper
St. Johns Fiver Basin. A hand corer similar to that referred to by Baker, Pugh
and Kimball (1977) was constructed and used for routine coring. The core consists
of a clear plastic core tube with a two inch check valve unit and rubber seal.
Core profiles and bathymetric transects were taken in the lakes in the upper St.
Johns River (Lakes Poinsett, Winder, Washington, Sawgrass, Hellen Blazes and Blue
Cypress). The locations of these lakes in the upper basin are shown in Figure 1.
Three radial core transects in each lake, extending to a distance of 150 m from
the river's entrance, were taken. The cores were taken at 30 m intervals yielding
a total of 16 radial cores per lake. The 30 m intervals were determined by operating
the boat at a predetermined throttle speed for a predetermined length of time. Buoys
were then placed at each sampling location. This same technique was used to deter-
mine coring intervals for longitudinal and transverse transects in Lakes Hellen Blazes,
Sawgrass, Washington and Winder, while siting across the lake using landmarks.
Longitudinal transect cores were taken at points equal to 10% of the total length
(11 samples) while transverse transects were taken at intervals equal to 20% of the
lake width (6 samples). For each core, sediment depths and types were recorded down
to sand substrate. Bathymetric profiles were obtained for each transect with a Ratheon
fathometer depth recorder. A calibrated rate indicator automatically selected coring
points in the larger lakes (Lakes Poinsett and Slue Cypress)at regular intervals by
an audible signal, while compass readings kept each transect en line. The location of
the transects and radials in each lake are shown in Figure 7 through 12. Each core was
analyzed for total organic sediment thickness and for the thickness and nature of any
>r distinguishable strata. Coring locations on the longitudinal and transverse
*~ric profiles were marked on the sounder chart paper.
19
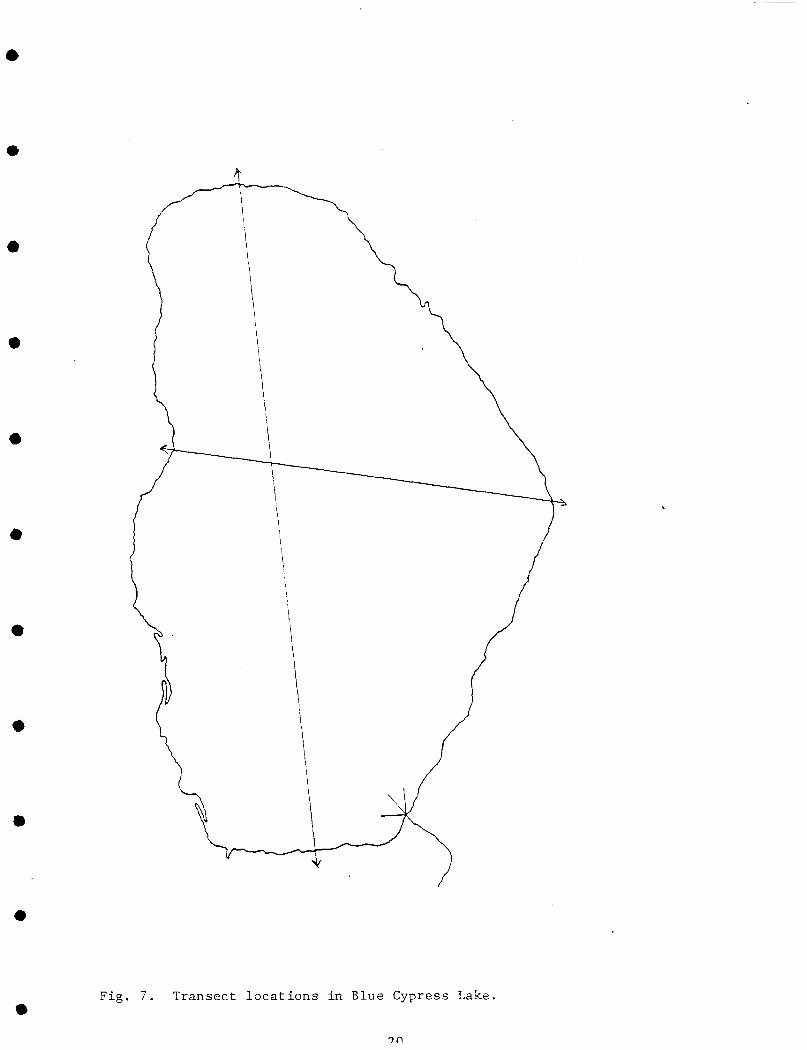
Fig. 7. Transect locations in Blue Cypress Lake,
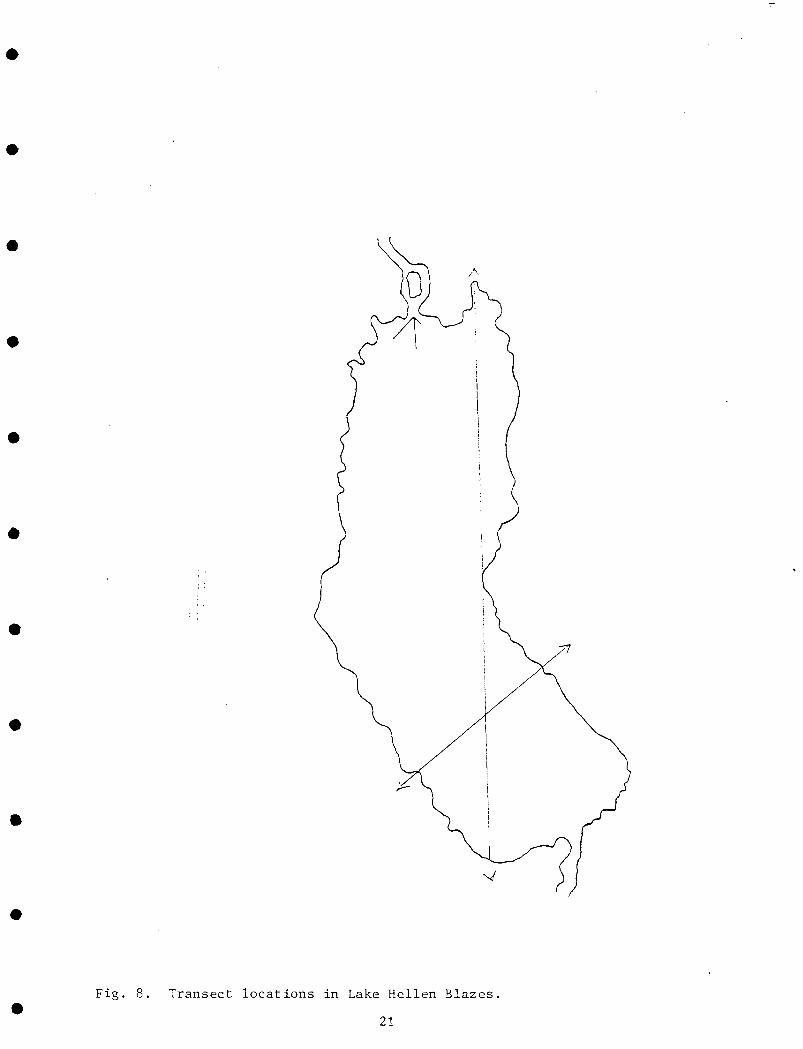
Fig. 8. Transect locations in Lake Hellen Blazes.
21

Fig. 9. Transect locations in Lake Sawgrass,
22

Fig. 10. Transect locations in Lake Washington.
23

Fig. 11. Transect locations in Lake Winder.
24

Fig. 12. Transect locations in Lake Poinsett
25
CHAPTER IV
QUALITY CONTROL
LABORATORY QUALITY CONTROL
1. All glassware was Class A.
2. Analytical reagent grade chemicals were used whenever called for in the method.
3. Laboratory water was dis tilled/deionized with s. negligible conductivity(<5 umh os / cm) .
4. All glassware was washed in a scap solution, acid washed and then rinsedin distilled wa te r .
5. All analyses were done with EPA approved methods and time frames.
6. Replicates were cone on approximately 10 percent of the duplicate samplesas an estimate of precision. Results were recorded in the laboratorynoteb ooks.
7. Spikes were done en 20 percent of the samples and results were recordedin the laboratory notebooks as percent recovery.
8. Blanks were run with each set of analyses.
9. A minimum of four standards were used to construct a standard curve.Subsequent use of a standard curve was verified by the use of at least areagent blank and one standard.
10. This environmental laboratory participated in a sample exchange programwith Enviropact Inc. , Jacksonville, Florida.
11. EPA reference .samples were routinely ran with the collected samples.
DATA HANDLING AI\D RECORD KEEPING
1. As stated previously, field data were recorded in Field Notebooks forlater transferral to Field Data Sheets. Field data sheets were cataloguedby date and site number and kept in a separate notebook (Field Data SheetNotebook) by the Project Director.
2. Each analyst was responsible for certain specific parameters. The rawanalytical and quality control data for these parameters were recordedin the analyst's own laboratory notebook. When the tests were completedeach analyst transferred his data to Master Laboratory Data. Sheets, whichwere catalogued by date and site and kept in a separate notebook (LaboratoryData Sheet Notebook) by the Project Director.
26
FIELD QUALITY CONTROL
Field equipment was calibrated by the following methods:
1. Temperature was calibrated to ± 0.5 C by comparison with a laboratorygrade thermometer.
2. Dissolved oxygen was routinely air calibrated and periodically checkedagainst Winkler titrations.
3. Conductivity was periodically calibrated using a 0.010 M KC1 solution(1413 ymhos/cm) .
4. pH was calibrated to ± 0.1 pH unit using known buffers .
5. Turbidity was calibrated to ± 0.5 NTU using Formazine ampule standards.
All calibrations were performed just prior to a series of measurements. Turbidity,
pH and dissolved oxygen measurements were often re-calibrated during the analyses. In
addition, duplicate samples and field data were collected at all sites to verify re-
producibility. The flow meter was routinely checked in surface waters of known velocity
(by measuring the time it takes a float to travel a certain distance).
27

LAKE WASHINGTON OUTLET DISCHARGE CHECK ;
On 12/8/82 discharge was measured at the Lake Washington low level dam for
comparison with the calculated discharge computed from the standard sheet pile
weir formula discussed later. The stage height on this date was 14.68 ft. msl.
B.esults from the two methods compared very well as the measured discharge was
3 3536 ft /s and the calculated discharge was 546 ft /s.
SAMPLE EXCHANGE
The results of the F . I .T. sample exchange with Enviropact, Incorporated of
Jacksonville, Florida are presented in Table 2. Two pump event samples were
sent to Enviropact for analysis. Although the samples were kept cool on ice,
the lag time of approximately 4 to 8 days may account for some of the differences
between the F.I.T. and Enviropact values, particularly for the nutrients.
Results of EPA reference sample analyses are shown in Table 3. In general,
agreement between F.I .T. and EPA/Enviropact values were good and within acceptable
limits.
28

able 2 . Sample Exchange
ample Site
ollection Date
•,
'
issolved Solids (mg/L)
a^rdness (mg/L as CaCCL
03~N/L (mg/L)
34+ (mg/L)
iOI (mg/L)
otal P (mg/L)
rtho P (mg/L)
j^fate (mg/L)
iloride (mg/L)
alcium mg/L
aflnesium mg/L
Zig Zag
8/16/82
Enviropact
550
241
0.24
0.39
2.95
0.15
0.14
—
—
78.0
11.1
F.I.T.
546
292
0.32
0.23
3.4
0.14
0.10
—
—
100
10.2
Mary A River Down
8/12/82
Enviropact F.I .T.
236 253
76 94
—
0.08 0.05
—
0.17 0.16
0.16 0.12
51 68
53 52
22.0 20.0
—
ample received by Enviropact on 8/20/82
'port ft J1188
ib ID // 86119
tvircpact of Jacksonville, Inc.)27 East 8th Streeticksonville, Florida 32206
29

Table 3. Comparison of Florida Institute of Technology with EPA Reference Samples,
Parameter Date F.I.T. EPA
N03/N02 7/23 0.35 0.31
N03/N02 8/9 0.31 0.31
N03/N02 8/17 0.28 0.31
N03/N02 9/4 0.25 0.31
0-POA 7/21 0.02 0.031
0-POA 7/26 0.03 0.031
0-P04 9/4 0.03 0.031
Cl~ 7/26 21 18.7
Cl" 8/24 21 18.7
Cl" 9/7 20 18.7
30

CHAPTER V
RESULTS AND DISCUSSION
LAKE WASHINGTON INLET-OUTLET
Results from our study indicate there is an overall imbalance between loading
rates for the inlet and outlet of Lake Washington. The outlet generally had higher
discharge rates and higher concentrations of nutrients during the study period, re-
sulting in the imbalance. Discharge concentrations and loading and export rates
from Lake Washington are presented graphically in Figures 13 through 16. Several
sources of water other than the inlet enter Lake Washington and increase outflow.
These sources are primarily drainage canal and marsh flow. The drainage canals,
located along the east side of Lake Washington discharge heavily during low stage
conditions. During high stage conditions these canals drain with the surrounding
marsh as sheet flow. At a critical lake stage height of approximately 15-15.5 ft.
msl the canals and marsh generally stop flowing and act as an extension of the lake,
significantly increasing the storage capacity of the lake. Inflow - Outflow char-
acteristics are ^influenced by rainfall, agricultural pumpage and stage height in
the upper basin ,' draining into Lake Washington.
Discharge into Lake Washington varied greatly from week to week; however, we
feel the numerous measurements have given us a fairly good data base for a mass
balance approach. Discharge measurements for the Lake Washington inlet and cutlet,
South Mormon Outside Canal, Three Forks Run and Bulldozer Canal are shown in Table 4.
Nutrients were not measured until January, 1982, and consequently loading rate data
presented in the figures begin at that time. At high stages, when the Marsh became
submerged, nutrient concentrations were slightly higher. This is not unusual and is
probably due to organic inputs from the marsh, nonpoint source runoff from surrounding
lands and periodic agricultural pumpage. Wind mixing and bottom resuspensicn may
also be important in periodically increasing nutrient concentrations and export rates
from Lalce Washington.
31

2000LUCD
§5XrO
'°oo
19741818
K3
2 3.0< 3a: ^fe
1.0oCJ
1.7
J69T
1.8 1.6
2.4
1.8
|242l337l630 Ie48|
CVJfrol
1406T
12234
6860
10,000 CD
1
^5,000 3
JAN ' FEB 'MARCH' APRIL ' MAY ' JUNE ' JULY ' AUG ' SEPT
Fig- 13 . Discharge and total nitrogen concentrations (B) and loading (Q) at the entrance to
Lake Washington.

UJ2000
-1000
108 ,29 198 198 3*l 3£5250
25332216
u>u> g 5.0
fej 4'°01 \1= ^ 3.0*- cr>y j 2.0oO 1.0
2.2
3.8
16105- 15,000
10,000 §-§
- 5,000
JAN FEB MARCH APRIL MAY JUNE JULY AUG SEPT
Fig. 14. Discharge and total nitrogen concentrations (1) and export (0) at the outlet of
Lake Washington.

UJCD(T
o0}O
2000
1000
19741818
54.4 89.8 I33J 1474
g\-
t; CPUJ j§
0.15
0.10
0.05ou
0.14
JAN
004 0.03H i.
JL7 ^6.1 HI 13.8 1118.1 2^10.4
FEB MARCH ' APRIL JULY AUG SEPT
Fig. 15. Discharge anc1 total phosphorus concent rations (§) and loading (0) at the entrance to
Lake Washington.

g<
2000
1000
108
2533
2216
O 0.15
a: 0.10
0.05OU
007
JAN ' FEB 'MARCH'APRIL ' MAY 'JUNE 'JULY ' AUG 'SEPT
Fig. 16. Discharge and total phosphorus concentrations (g) and export (Q) at the Lake Washington Outlet

The only parameter which exhibited a net input into Lake Washington was
suspended solids. This is logical as the sediment particles settle out as the
velocity of the river slows upon entering Lake Washington. Results of coring through-
out the lake, showing sediment types, are shown in Figure 27.
Discharge at the outlet ranged from 0 CFS when the river stage was below the
head of the weir (13.5 ft msl), to 2538 cfs. The outlet discharges were calculated
using the following USGS equation for a sheet pile weir:
q = cm372
where
Q = Discharge (cfs)
C = 2.63
L = 162.16 ft. (effective length of the weir when clear of obstructions)
H = Head above the weir ( f t ) .
This equation is used effectively when the head above the weir is two feet or less.
This was the case for most of the sample dates. On one date, an actual discharge
measurement was made and results were compared with the equation value showing good
agreement.
The inlet discharges ranged from 17.1 cfs to 1974 cfs. As a quality control
check our discharge data were compared with USGS data for comparable sample dates,
although measurements were seldom made on exactly the same days. Results of this
comparison can be found in Table 4 and show acceptable agreement. We found, however,
that discharges can vary significantly from day to day and this fact should be taken
into consideration in the comparisons.
Nutrient concentrations are presented in Appendix B. Total N and Total F
concentration loading and export rates are presented in Figures 13 through 16. Total
nitrogen concentrations at the outlet ranged from 1.4 mg/1 to 3.8mg/l with a mean
36

concentration of 2.2 mg/1. Most of this nitrogen was present as organic nitrogen
which is expressed as total kjeldahl nitrogen (organic + ammonia). Kjeldahl
nitrogen had the same ranges as total nitrogen. Analysis for ammonia nitrogen was
not initially run and only a few values were obtained. The range for those samples
analyzed was <0.02 mg/1 to 0.26 mg/1 at the outlet. For those dates when ammonia
concentrations are missing the ammonia concentrations are included In the total kjeldahl
nitrogen. Due to this fact, inorganic nitrogen is expressed as nitrate-nitrite
nitrogen. This form of nitrogen made up a small percentage of total nitrogen present
and ranged from <0.02 mg/1 to 0.23 mg/1 nitrate-nitrite nitrogen at the outlet.
At the inlet, total nitrogen ranged from 1.5 mg/1 to 3.0 mg/1 and, again,total kjeldahl
nitrogen had the same ranges ,as well. Concentrations of ammonia at the inlet varied
from <0.02 mg/1 to 0.19 mg/1. Nitrate-nitrite levels were much lower at the inlet
than at the outlet, with concentrations ranging from <0.02 mg/1 to 0.03 mg/1.
Phosphorous concentrations at the outlet ranged from 0.03 mg/1 to 0.14 mg/1.
Elevated levels were found during the summer months when rainfall-runoff and stage
levels were high and this trend is similar to historical trends. The inlet samples in
Lake Washington exhibited similar concentrations ;to the outlet,but differences in
discharge between the two sites resulted in a greater phosphorus export rate than
input rate.
37

UPPER ST. JOHNS RIVER CANALS
Three additional canals in the upper reaches of the basin were studied as
they each represent a distinct source of x-?ater and materials into the St. Johns
River. Three Forks Run (TFR) drains the entire east side of the St. Johns marsh
via C-40 canal and others that drain into C-40, and drains into South Mormon Out-
side Canal south of Lake Helen Blazes. South Mormon Outside Canal (SMOC) drains
the west side of the upper St. Johns River basin. Bulldozer Canal (BDZ),an east-
west canal that drains portions of the marsh west of SMOC, joins SMOC at the origin
of the original St. Johns River channel.
Discharges in these canals were quite variable throughout the study period.
At the beginning of the study period, during low stage conditions, TFR was the
strongest flowing canal sampled. By June 1982, this canal, had completely stopped
flowing and did not flow again until the end of August, when a negligible flow was
detected. In the summer, when the river was at high stage levels, the marsh became
inundated with water and sheet flow across the marsh into SMOC became the major
mode of transportation for water coming from the east, replacing the flow in TFR.
This is shown by the fact the flow stoppage in TFR correlated with a dramatic increase
in discharge in SMOC (Table 4 ) . The critical stage height (at U . S . 192) for this
occurrence appears to be approximately 15 ft msl. Bulldozer canal (BDZ) did not
discharge at all in the initial phases of the study and most recorded discharges were
quite low until June 1982 . At that time discharges were f i f ty times greater than
previous values, but, the discharge was reversed in the canal. A large
percentage (>60%) of the strong South Mormon Outside Canal discharge was entering
BDZ and flowing to the west. Any discharge from BDZ was being directed into the
marsh, to the month of Bulldozer Canal, as was the SMOC flow that entered the canal.
38

This marsh input was then discharged via sheetflow back into the St. Johns north
of Lake Hellen Blazes.
Total nitrogen followed a seasonal pattern in SMOC and BDZ. Low concentrations
were found in the winter and high concentrations were found in the summer. SMOC had
total nitrogen concentrations ranging from 1.2 mg/1 to 3.4 mg/1 while levels in BDZ
varied from 0.8 mg/1 to 3.1 mg/1. The high values for BDZ were recorded during the
reverse flow conditions and are actually downstream duplications of SMOC samples.
TFR showed very littler variation in total nitrogen concentrations and ranged from
1.5 mg/1 to 2.7 mg/1. Most of the samples .however, were in a 2.1 mg/1 to 2.7 mg/1
range.
Total kjeldahl nitrogen comprised the majority of the total nitrogen present and
exhibited nearly identical ranges to those of total nitrogen. Ammonia-nitrogen
showed similar trends to those found in Lake Washington. In TFR ammonia-nitrogen
ranged from <0 .02 mg/1 to 0.11 mg/1, in SMOC it ranged from 0.02 mg/1 to 0.25 mg/1
while BDZ concentrations varied from <0.02 mg/1 to 0.21 mg/1. The highest concentrations
were found during the summer months. Nitrate-nitrite levels showed an opposite trend
to that of ammonia-nitrogen > with elevated concentrations during the winter and very
low concentrations during the summer. The canals all displayed levels of nitrate-
nitrite nitrogen well above the levels found at Lake Washington. The seasonal
trends for ammonia and nit rate-nit rite are quite easily explained as similar trends
have occurred in the past. The summer oxygen levels in the St. Johns River and
marsh were severely depressed to levels below 1.0 mg/1 most of this time and the
marsh was completely flooded.Under these low oxygen to anaerobic conditions in the
summer, nitrate-nitrogen cannot occur in abundance and reduction or denitrification
may occur, producing ammonia-nitrogen. When oxygen is more available, as in the
winter months, ammonia oxidation can occur in additions to biological nitrification.
39

These processes decrease the ammonia-nitrogen available and increase nitrate-nitrite
concentrations .
Total P concentrations found in the canals were also higher than those found at
the Lake Washington sites. Loading values were considerably lower, however, due
to the lower discharge rates in the canals. Phosphorus showed a seasonal variation
of low winter and high summer concentrations. These elevated levels are probably due
to increased runoff that occurs during the summer rainy season. TFR concentrations
ranged from 0.05 mg/1 to 0.15 mg/1. SMOG levels ranged from 0.02 mg/1 to 0,45 mg/1,
with the higher concentrations occurring during the summer when rainfall was high.
BDZ ranged from <0.01 mg/1 to 0.24 mg/1, but the high levels are representive of
South Mormon Outside Canal due to the reverse flow phenomenon.
Suspended solids concentrations in the canals were variable. Generally,
suspended solids concentrations increased with increased discharge,although there
was considerable variability and statistical correlations between these two parameters
were very poor (r = .05) . TFR concentrations ranged from 0.8 mg/1 to 10.3 mg/1 and SMOG
levels ranged ifrom 1.9 mg/1 to 26.2 mg/L. The highvalue in SMOG occurred when a huge silt
plume passed through the area as the transect and flow measurements were being made.
A plume such as this is generally indicative of a pump discharge from an upstream
location. Both total phosphorous and total nitrogen were at maximum concentrations at
this time, also. Bulldozer Canal had suspended solids concentrations varying from
0.6 mg/1 to 10.4 mg/1.
The suspended solids levels fmmd in the canal areas are generally higher than
the values recorded further downstream at the Lake Washington inlet. The solids are
therefore settling out in the lakes before they reach downstream areas. Lake Hellen
Blazes, the first lake encountered north of the canals, has a bottom consisting of
loose organic muck with a thickness of up to three feet. This muck layer is thicker
than layers in lakes located farther downstream, indicating that most of the suspended
solids entering this lake settle out.
40

Conductivity levels at the canal sites were higher than any other sites
sampled, reflecting groundwater irrigation and seepage directly into canals.
Conductivity ranged from 315 to 1440 ymhos/cm in South Mormon Outside Canal
from 310 to 1190 ijmhos/cm in Bulldozer Canal. Three Forks Run ranged from 305 to
900 ymhos/cm. The lower values for conductivity at all sites were recorded during
the summer months due to the dilution effect from rainfall/runoff. Lake Washington
inlet conductivity levels varied from 300 to 845 ymhos/cm during the same period.
The canal data from each site were grouped together (49 cases) and analyzed
statistically to identify significant relationships. In particular, we investigated
relationships between rainfall (3 day) and discharge and all measured parameters
at the canal sites. The only significant correlations were between discharge and
ammonia (r = .68; P<.0l) and discharge and conductivity (r = -.32; P<.05). Also,
total phosphorus and total kjeldahl nitrogen were significantly (p<.01) related to
suspended solids with r values of .74 and .44, respectively. Discharge, nutrient
concentration and loading data for Mormon Outside, Three Forks and Bulldozer canals
are presented in Figures 17 through 22. The raw water quality data for these canals
are shown in Appendix B.
41
LJCDcr<5COo
600
500
-400
^300it;
200
100
538472
6.8
N) 4.0
O
O
o 1.0
3.4
1.8
1.3
917 MO 1195^=f-m=i-JAN ' FEB MARCH ' APRIL '• MAY JUNE JULY AUG SEPT
Fig. 17. Discharge and total nitrogen concentrations (@) and loading (Q) at Mormon Outside canal.

600
UJ 500C3 ^
< "400
Q 200
100
538472
O 040
0.30i
UJ ifu 32OO
0.20
0.100.04
JAN
0.45
FEB 'MARCH 1 APRIL ' MAY ' JUNE ' JULY ' AUG ' SEPT
Fig. 18- Discharge and total phosphorus concentrations (B) and loading (0) at Mormon Outside canal.
120
UJoa: 80
aco5 40
20
106.6
74.6 71.9
38.5
13
a:2
§o
2.0
1.0
JAN FEB MARCH APRIL MAY JUNE
0 0 0
JULY ' AUG ' SEPT
1000
800
600
400
200
Fig. 19. Discharge and total nitrogen concentrations (I) and loading (0) at Three Forks tributary.

a:
ocoa
100
80
60
40
20
38.5
74.6
13
9 0.15
HO: 0.10"UJooo
0.05
0.08
-ll 360.15
JAN FEB MARCH APRIL MAY JUNE JULY AUG SEPT
Fig. 20. Discharge and total phosphorus concentrations (0) and loading (Q) at Three Forks tr ibutary,

UJ 400CD§ ^300X (0o *- 200co £;5 100
3.9 3.9 0 0
o 3.0
5?
OCJ
1.0 0.8
JAN
WESr WEST
3.2 3.2
H3000
2000 <Q
Hiooo
FEB MARCH APRIL MAY JUNE JULY AUG SEPT
Fig. 21. Discharge and total nitrogen concentration (1) and loading (D) at Bulldozer canal.

O
500
400
300
200
1003.9
-p-
.ob 0.2
I-a:yf O.I2:""oo
FEB MARCH APRIL MAY JUNE JULY AUG SEPT
Fig. 22. Discharge and total phosphorus concentrations (i) and loading (D) at Bulldozer canal.

DISCHARGE PATTERNS IN THE UPPER ST. JOHNS RIVER STUDY AREA
Routine discharge rates were measured at several locations in the upper
St. Johns River (Table4) . These locations were the Lake Washington inlet
and outlet (LWI & LWO) , South Mormon Outside Canal (SMOG), Three Forks Run
(TFR) and Bulldozer Canal (BDZ). Suspended solids and nutrient loading rate
data collected at these sampling points are discussed elsewhere in this Chapter.
Field observations and measured discharges shown in Table 4 indicate that
above a stage height of 13.5 ft. msl (height of weir) the discharge leaving
Lake Washington was slightly greater on sampling days than the inflow (Infloxtf
and outflow data were collected on the same day eighteen times during the
study year, consequently these data are very limited and inconclusive.) This
may be due to additional water inputs from the marsh (located primarily on
the southeast and west sides of the lake), from canal inputs on the east side
of the lake, and from groundwater seepage. It was noticed that at high stage
levels ( > 15 ft. msl), the drainage canals entering Lake Washington cease to
flow and the marsh and canals act as an extension of the lake. At these stage
heights, the discharge differences between inflow and outflow are minimized.
A detailed water budget for the lake was not done at this time for 1982 but was
constructed in detail by Mason and Belanger (1979) for 1978.
A paucity of discharge data are available for the summer months (1982) as
our efforts were primarily concentrated on sampling pump events at that time.
However, based on our data, the following generalizations hold true. It appears
that SMOG exhibits a small flow rate until the stage height reaches a critical
level of approximately 15 f t . msl, at which point the discharge dramatically
increases. This critical stage height cannot be pinpointed due to a lack of
data. At this same critical stage level, TFR ceases to flow and a large
48

Table 4. Discharge Measurements in the Upper St. Johns River, 1982Department oj Environmental Science, Florida Institute of Technology (ft /s)
Lake Washington Lake Washington Lake Washington South Mormon OutsideStage lit. (ft) Inlet Outlet Canal Three Forks Run Bulldozer
1212121414141413131313131313131314141414
16161615
.03
.12
.99
.10
.13
.04
.13
.98
.80
.76
.75
.72
.77
.85
.87
.96
.15
.10
.10
.40
.46
.78
.20
.73
8/28/819/1/819/15/819/23/81
10/2/8110/8/8111/6/8111/16/8112/15/8112/17/811/20/822/9/822/24/823/12/823/30/824/7/824/22/825/13/825/26/826/3/82
7/19/828/4/828/26/829/28/82
2634
4352992191235683*
101*231774*5490
13394*
1476068*
350*
1574 a1974 (2580)18181510
0 -.-;•:_00
27723923925014210812910844
129198198133376305250575
2216253319621419
9/15/819/23/81
10/8/81
12/17/811/20/82
2/22/823/10/823/31/82
4/22/825/13/825/26/826/18/826/24/82
7/20/828/2/828/31/82
24329
177
03248
1063
203276
481321538
9/15/819/23/81
10/8/81
12/17/811/20/82
2/22/823/10/823/31/82
4/22/825/13/825/26/826/18/826/24/827/12/827/20/828/2/828/31/82
538798
2839
7582
107
797256
00000
13
9/15.819/23/81
10/8/81
12/17/811/20/82
2/22/823/10/823/31/82
4/22/825/13/825/26/826/18/82
000
2839
007
200
130
Canal
(west)No measure7/12/827/20/828/2/828/31/82
275374307317
(west)(west)(west)(west)
USGS Field Measurement

percentage of the SMOC discharge enters BDZ and travels west. The percentage
of SMOC flow entering BDZ was found to be 64 and 78% on 6/18/82 and 7/20/82,
respectively. The westerly flow in BDZ gradually enters the marsh on the north
side of the canal near BDZ pump "1 and travels nor thward as d i f fuse f low, probably
re-entering the St. Johns River channel near Jane Green Creek. Any pump discharge
in BDZ at high stage heights also enters the north marsh and is not observed
directly as canal flow. TFR stops flowing at this high stage level because
discharge which normally enters TFR f rom lateral M canal and C-40 canal crosses
the narsh east of SMOC and enters SMOC, contributing to the high discharges in
that canal. The measured d i scharge ra tes are shown graphica l ly in Appendix C,
There have been confl ict ing reports in the past on the relationship of
agricultural activities in the upper St. Johns River Easin to water quality
problems in the area. Sullivan (1979) concluded, based primarily on an extensive
literature review, that agricultural activities have adversely a f fec ted water
quality. In particular, his report states that agricultural runoff and pumped
water can degrade water quality by increasing loadings of suspended solids, BOD
and nutrients. The report was primarily concerned with the activities of Deseret
R.anches of Florida Inc. , although the conclusions can apply to other ranches as well
A report by CE M Hill, however, a firm, hired by Deseret Ranches, indicated the
runoff and putnpage activities had an insignificant affect on receiving water
(CH M Hill, 1979). These conclusions were based on a preliminary water sampling
program at and within the vicinity of Deseret pumping stations. The sampling
program covered only two sampling periods, however, and these occurred on October
2-3, 1978 and January 12-13, 1979. In view of this paucity of agricultural pumpage
da t a , the in format ion provided within this report is t imely and sorely needed .
50

Thirteen purnp events were monitored during this study, in addition to
periodic background sampling. Pump discharge rates and total nitrogen and
total phosphorus concentrat ions and loading rates are presented in Tables 5
and 6 and Figure 23 and 24 . The thirteen purnp events were collectively analyzed
in numerous ways to de termine s ta t is t ical r e l a t ionsh ips , W a t e r qual i ty para-
meters were regressed against ra infa l l and d i scharge , as well as against each
other . Very s ignif icant relationships were f o u n d between d ischarge and ammonia
(r = .95; p < .01), but no other significant relationships were found,
DUDA CANAL AND NORTH MORMON PUMP SITES
The North Mormon Pump was visited several times, but was never pumping.
Background data collected on 5/28/82 are presented in Table / . The Duda
pump was also not on during the F . I .T. sampling tr ips, however the GFwFC
reported it pacr.pir.g on 12/7/82 and they collected water samples at the entrance
of Duda canal to the river (approximately 1 mile downstream of the pump). The
GFWFC upstream, down stream and Duda canal data, along with F . I .T . background
data collected on 9/3/82 at : the pump, are presented in Table 8 . T'nese dat£
indicate the pump was discharging high concentrations of ortho ( .22 me P /L) and
total (.31 mg P/L) phosphorus and inorganic nitrogen, particularly ammonia
nitrogen ( .92 mg NH 3~N/L). Hardness (275 mg/L as CaCO ) and chloride
(590 mg/L) levels were also very high. Although loading could not be computed
because discharge was not measured f it was probably significant as the Duda
pump capacity is 57,000 GPK and the GFWFC noticed a very swift flow entering the
river from the canal. If this pump was discharging at 50% capacity (28,500 GPM
2or 63.5 ft /s) the TN and TP loads entering the river would be 379 and 48 Kg /day ,
respectively. This loading is higher than that recorded for the Bulldozer pumps
(at the outfal l ) and indicates that this pump could be a potentially significant
pollutional source to the St. Johns River.
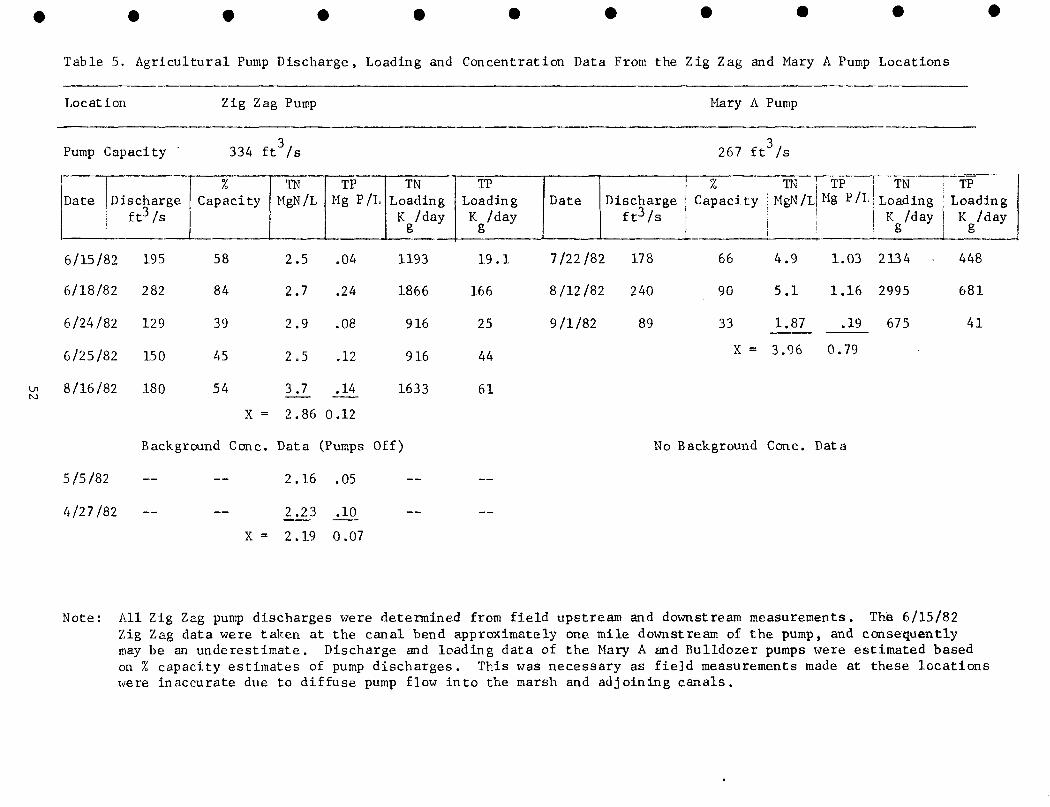
Table 5. Agricultural Pump Discharge, Loading and Concentration Data From the Zig Zag and Mary A Pump Locations
Location Zig Zag Pump
Pump Capacity 334 ft /s
% TN TP TNDate Discharge Capacity MgN/L Mg P /I, Loadii
ft3/s K /d,8
6/15/82 195 58 2.5 .04 1193
6/18/82 282 84 2.7 .24 1866
6/24/82 129 39 2.9 .08 916
6/25/82 150 45 2.5 .12 916
8/16/82 180 54 3.7 .14 1633
X = 2.86 0.12
Background Cone. Data (Pumps Off )
5/5/82 — — 2.16 .05
ft/27/82 — — 2 .23 .10
Mary A Pump
267 f t3 /s
TP % ; TN i TP j TNig Loading Date Discharge Capacity ; MgN/L| Mg P/L | Loadingay K /day ft3/s ; j i K /day
g | i | g
19.1 7/22/82 178 66 4.9 1.03 2134 -
166 8/12/82 240 90 5.1 1.16 2995
25 9/1/82 89 33 1.87 .19 675
44 X - 3.96 0.79
61
No Background Cone. Data
—
—
TPLoad
K /g
448
681
41
X = 2.19 0.07
Note: All Zig Zag pump discharges were determined from field upstream and downstream measurements. The 6/15/82Zig Zag data were taken at the canal bend approximately one mile downstream of the pump, and consequentlymay be an underestimate. Discharge and loading data of the Mary A and Bulldozer pumps were estimated basedon % capacity estimates of pump discharges. This was necessary as field measurements made at these locationswere inaccurate due to diffuse pump flow into the marsh and adjoining canals.

Table 6. Agricultural Pump Discharge, Loading and Concentration Data from the Bulldozer Pump Locations.
Location Bulldozer Pump #1
3Capacity 72 ft /s
% TN TP TN TPDate Discharge Capacity MgN/L MgP/L Loading Loading Date
ft3/s K /day K /dayO O
7/12/82 36 50 2.89 .14 238 12.3 7/12/82
7/20/82
8/3/82
8/31/82
Bulldozer Pump #2
36 ft3 /s
Dischargeft3 /s
18
18
13
No me as .
%Capacity
50
50
36
—
TNMgN/L
2.4
1.8
2 .4
2.38
TP j TN 1 TPMgP.'/L[ Loading' Loading
j K /day! K /dayi g j g
.27 106 11.9
.11 79 4.8
.14 73 4.4
.29
No Background Cone. Data
.X = 2.25 .20
Background Cone. Data (Pumps O f f )
5/26/82 -- — .97 .06

Ul
LJ
300
200
5-3- 100
Q
zO 6.0
<-; 5.0;40
tr-
zoo
2.0
(22)195
( 2 2 )180
(MA)89
6/15 6/18 6/24 6/25 7/12 7/2O 7/22 8/3 8/12 8/16
2995
9/1
1899
13000
- 2000;
Q<
- 1000 -
1982JUNE JULY AUGUST
Fig. 23. Discharge and total nitrogen concentrations (i) and loading (Q) from Zigzag Canal (Z.Z), Mary A
Canal (M.S.) and Bulldozer Canal (BDZ) agricultural pumps.

O 300<r -^
Q 100
(ZZ)282
128.5BDZ
I 2
II fO
(MA)240
(BDZ)18
(BDZ)13
6/15 6/18 6/24 6/25 7/12 7/20 7/22 8/3 8/12 8/16
(MA)89
9/1
LnLn
O
0-1zoo
O.24
°
300c9 —250| o200< vic:n ° C"150 _j :
100 £L
50
JUNE AUGUST
Fig. 24. Discharge and total phosphorus concentrations (@) and loading (Q) from the Zigzag Canal (Z.Z.),
Mary A Canal (M.A.) and Bulldozer Canal (BDZ) agricultural pumps.

Table 7. North Mormon Canal background data (5/28/82)
Turbidity (NTU) 20
True Color (CPU) 226
Suspended Solids (mg/L) 1.6
Dissolved Solids (mg/L) 295
Volatile Suspended Solids (mg/L) 1.6
Fixed Suspended Solids (mg/L) 0.0
Volatile Dissolved Solids (mg/L) 94
Fixed Dissolved Solids (mg/L) 201
Alkalinity (mg/L as CaCCL) 46
Hardness (mg/L as CaCCO 114
Chloride (mg/L) 72
Sulfate (mg/L) 45
Ortho Phosphate - Filt. (mg/L) < 0.01
Ortho Phosphate - unfilt. (mg/L) 0.02
Total P-filt. (mg/L) 0.11
Total P-unfilt. (mg/L) 0.13
TKN-filt. (mg/L) 1.6
TKN-unfilt. (mg/L) 2.2
Ammonia-Nitrogen (mg/L) 0.28
Nitrate, Nitrite-Nitrogen (mg/L) < 0.02
BOD (mg/L)3
Chlorophyll a (mg/m ) 9.3
Iron (mg/L) 0.3
Calcium (mg/L) 33.0
Magnesium (mg/L) 7.3
Potassium (mg/L) 2.5
56

Table 8. Duda Canal Water Chemistry Data
PH
Conductivity(umhos/cm)
Total Residue(180°C)
Sulfate
Turbidity (JTU)
Turbidity (NTU)
Calcium.
Magnesium
Sodium
Potassium
Total Iron
Hardness(mg/L as CaCO )
Chloride
N03~-N/L
NH3-N/L
Org N/L
Ortho P (as P)
Total P (as P)
Background atPump
9/3/82
6.6
435
Exit ofLake Winder
12/7/82
6.6
450
Entrance of Downstream ofDuda Canal Duda Canal(% mile)
12/7/82 12/7/82
7.9
1700
7.8
304
14.5
—
2 . 4
25.6
15.1
—
2.9
0.32
126
78
0.08
0.19
1.61
.06
0.13
316
23
34
—
54
6.1
29.5
1.6
0.34
161
69
0.03
0.58
1.80
.04
.07
1113
69
20
—
66
26.6
156
5.9
.43
2.75
590
0.16
0.92
1.36
.22
.31
596
45
28
—
67
12.3
66.2
2 .7
0.39
219
210
0.07
0.52
1.64
.09
.13
Note: 9/3/82 and 12/7/82 data collected by F.I.T. and GFWFC, respectively.

ZIGZAG CANAL PUMP SITE
The water chemistry data for the Zigzag pump, a pump draining primarily
citrus land use, are shown in Table 9 . Zigzag pump discharges were characterized
by very high color, often much higher than the upstream station, but the color
was not as high in the nearby Mary A pump site. The pumped water was characterized
by fairly high inorganic nitrogen concentrations, as ammonia-nitrogen (x = .15j-
mg NH ' -N/L) and nitrate-nitrite-nitrcgen (x = .64 mg N O , , NO^-N/L) were elevated -
and much higher than the average background concentrations of .05 and .08 mg/L,
respectively. Total phosphorus (as P) averaged .15 m g / L , compared to background
TP concentrations of .10 and .05 mg/L on 4/27/82 and 5/5/82, respectively.
In terms of total nutr ients , the discharge water appeared to be overloaded
with n i t rogen, as the average TN and TP concentrations were 2 .86 mg N/L and
.15 mg P/L, respectively. Background data taken on A/27 /82 and 5/5/82 'showed
average TN and TP levels of 2.19 mg N/L and C . 0 7 mg P/L. Eased on TF :TK ratios it
appears that the canal system and pumped water are P limited as ratios of
> 20 mg/L were found. Dillon and Rigler (1974) suggest ratios greater than 12
indicate limitation of primary production by phosphorus. However, the average
inorganic N : soluble reactive P ratios of 7.1 and 3.1 for the puinpage and upstream
canal water, respectively, suggest N is mere likely to limit production. TN and
TP loading rate est imates, based on measured discharge and nutrient concentrations,
are given in Table 5 and Figures 23 and 24. This pump ranked second in terms of
nutrient loading among the sampled pumps.
Discharge EOD c for the five pump events averaged 2.4 mg/L and was similar
to the average upstream BOD of 2.5 mg/L. This indicates that elevated concen-
trations of oxygen consuming labile organic mat ter were not being discharged
to the canal. However, since oxygen levels throughout the entire system, were so
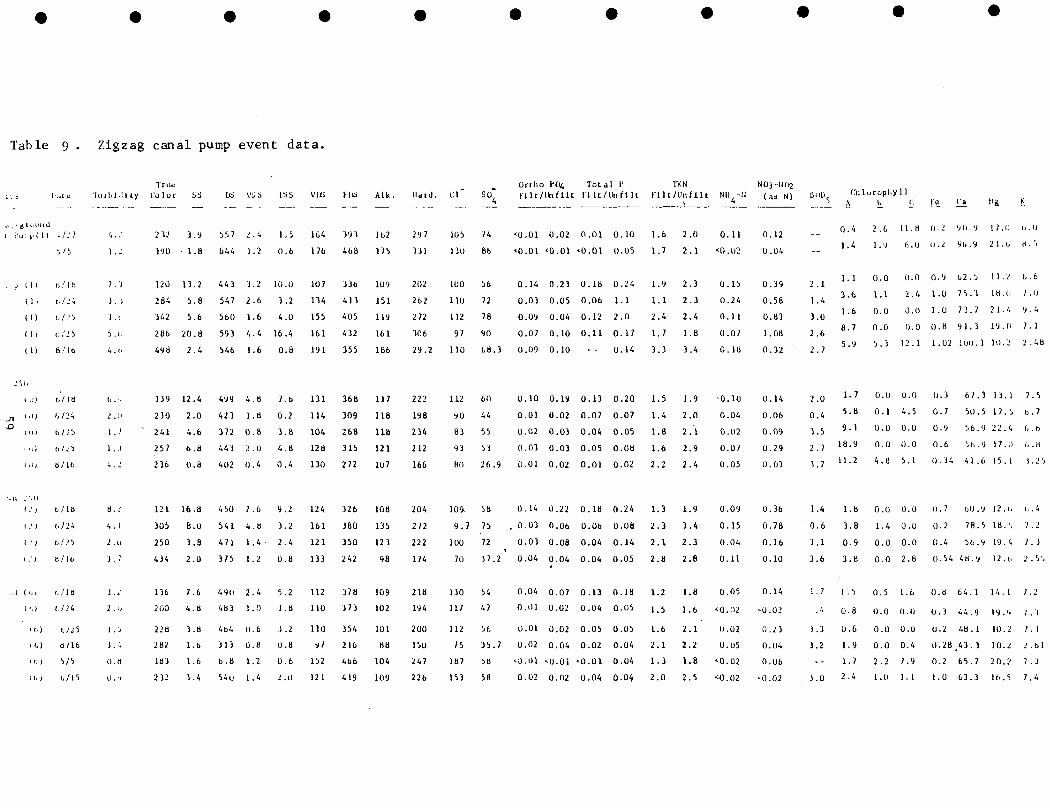
Table 9 . Zigzag canal pump event data.
TrueI'.ne T u i l i i . l l i y C o l o r
u : . | j ( l l 4 / J 7 4..'
5/5 I . - '
i l l h .' 1 a 7 /3
I I I t , / 2 4 1 . 3
( 1 ) 6 / . I5 ) . t
( 1 ) C . / J 5 5 .1 .
( 1 ) 8/16 4 . c .
I D ) 6 / 1 8 6 . .
l . i ) 6 / 2 4 2 . 1 )
mi 6 / 2 5 1 . 7
i n ) 6/. '5 1..1
l . i ) B /16 4 . 2
i.'l 6 / 1 a 8 . 2
( . ' ) t , / 2 4 4 . 1
I . ' J 6 / 2 5 2 . u
i . ' l B / l f c 3 . 7
( 6 1 6 / 1 8 3 . 2
C.) t./.-' 4 2 . 1 )
u.) 6 / 2 5 1 . 5
i l , ) B / 1 6 ) . 4
I N ) 5 / 5 ().»
u . ) 6 / 1 5 O . J
232
190
120
284
342
286
498
139
230
' 241
2 5 7
236
121
305
250
4 3 4
136
200
228
282
183
232
SS
3.9
1.8
13.2
5.8
5.6
20.8
2 . 4
12.4
2.0
4.6
6.8
0.8
16.8
8.0
3.8
2.0
7 . 6
4 . 8
3.8
1.6
1.6
3 . 4
OS
557
644
4 4 3
547
560
593
546
499
4 2 3
372
4 4 3
402
450
541
4 7 1
375
490
483
464
313
6.8
54U
WS
2 . 4
1.2
3 . 2
2 .6
1.6
4 . 4
1.6
4 . 8
1.8
0.8
2 . 0
0 .4
7 .6
4 . 8
1.4
1.2
2 . 4
1.0
0.6
0.8
1.2
1.4
1
0
10
3
4
16
0
7
0
3
4
0
9
3
2
0
5
3
I
0
0
2
.5
.6
.0
_ 2
.0
.4
.8
.6
.2
.8
.8
.4
,
.2
.4
.8
.2
.B
.2
.8
.6
.0
VIS
164
176
107
134
155
161
191
131
114
104
128
130
124
161
121
133
112
110
110
97
152
121
F,K
393
468
336
413
405
432
355
368
309
268
315
2 7 2
326
380
350
2 4 2
378
3 7 3
354
216
466
419
A l k .
162
175
109
151
119
161
186
117
118
118
121
107
108
135
123
98
109
102
101
88
104
109
l l d i J .
2 9 7
331
202
262
2 7 2
306
29.2
2 2 2
198
234
212
166
204
2 7 2
222
174
218
194
200
150
247
226
cT
105
130
100
110
112
97
110
112
90
83
93
80
109-
9 . 7
100
70
130
117
112
75
187
153
O r t h o VOt, T o t a l fSO* F i l t / H n H l t I l l t / U n f i l t
74
86
56
72
78
90
68.3
60
44
55
53
2 6 . 9
58
75
72
3 7 . 2
54
47
56
3 5 . 7
58
58
'0.01
<0.01
0.14
0.03
0.09
0.07
0.09
0.10
0.01
0.02
0.03
0.01
0.14
0.03
0.03
0.04
0.04
0.01
0.01
0.02
>0.01
0.02
0.02
<0.01
0 . 2 3
0.05
0.04
0.10
0.10
0.19
0.02
0.03
0.03
0.02
0 .22
0.06
0.08
0.04
0.07
0.02
0.02
0.04
^0.01
0.02
0
<0
0
0
0
0
0
0
0
0
0
0
0
0
0
0
0
0
0
<0
0
.01
.01
.18
.06
.12
.11
.13
.07
.04
.05
.01
.18
.06
.04
.04
.13
.04
.05
.02
.01
.04
0.10
0.05
0 . 2 4
1.1
2 .0
0.17
0.14
0.20
0.07
0.05
0.08
0.02
0 . 2 4
0.08
0.14
0.05
0.18
0.05
0.05
0.04
0.04
0.04
TKNF l l t / t l n U l t
1.6
1.7
1.9
1.1
2 . 4
1.7
3.3
1.5
1.4
1.8
1.6
2 . 2
1.3
2.3
2.1
2.8
1.2
1.5
1.6
2.1
1.3
2.0
2 .0
2 .1
2 .3
2 . 3
2 .4
1.8
3.4
1.9
2 .0
2.1
2.9
2 . 4
1.9
3.4
2 .3
2.8
1.8
1.6
2 .1
2 . 2
1.8
2.5
N l l ^ - l l
0,
<0
0.
0
0,
0.
0
•0
.11
.02
.15
.24
.11
.07
.18
.10
0.04
0
0.
0.
0.
o.0.
0.
0.
<0.
0.
0.
<0.
<0.
.02
.07
.05
.09
,15
04
.11
05
1)2
02
05
02
02
N 03-1102(as N )
0
0
0
0
0
1
0
0
0
0
0
0
0
0
0
0,
0
< ( J .0.
0.
0,
-0 ,
.12
.04
.39
.58
.83
.08
.32
.14
.06
.09
.29
.03
.36
.78
.16
.10
.14
.02
. 2 3
.04
,06
.02
lioD
2.1
1.4
3.0
2 .6
2 . 7
2 .0
0 .4
3.5
2 . 7
3 . 7
1.4
0.6
3.1
3.6
1 . 7
• 4
3 . 3
3 .2
--
3.0
nilA
0 .4
1.4
1.1
3.6
1.6
8.7
5 9
1.7
5.8
9.1
18.9
11.2
1.8
3.8
0.9
3.8
1 .5
0.8
0.6
1.9
1.7
2 . 4
orophy 11II C
2 .6
1.9
0.0
1.1
0.0
0.0
5 3
0.0
0.1
0.0
0.0
4 .8
0.0
1.4
0.0
0.0
0.5
0.0
0.0
0.0
2 . 2
1.0
11.8
ft. 0
0.0
2 . 4
0.0
0.0
12. 1
0.0
4 . 5
0.0
0.0
5.1
0.0
0.0
0.0
2.8
1.6
0.0
0.0
0.4
7.9
1. 1
Kc
0 . 2
11.2
0.9
1.0
1.0
0.8
1.02
0.3
0 .7
0.9
0.6
0 . 3 4
0 . 7
0.2
0.4
0.54
O . B
0,3
0.2
0.28
0.2
1.0
( a
90.9
96.9
6 2 . 5
75 .3
7 3 . 7
9 1 . 3
100. 1
6 7 . 3
50.5
56.9
5 6 . 9
41 .6
60.9
78.5
56.9
4 t i . y
64. 1
44 .9
48. 1
4 3 . 3
65 .7
63 .3
MB
17 .0
2 1 . 6
1 1 . 2
1H. I I
2 1 . 4
19.11
10.2
1 3 . 1
1 7 . 5
2 2 . 4
1 7 . 1 )
15. 1
12 .1 ,
18. 5
19.4
. 2 . 6
1 4 . 1
19.9
10.2
10.2
20.2
16.5
K
6 .0
H . '<
6 .6
7.0
9 .4
7 . 1
2 .48
7 . 5
6 . 7
1, .6
h .a1 . 2 5
6 . 4
7 .2
7. 3
2 .55
7 . 2
7 . 3
7. 1
2 .61
7 . 3
7 . 4

depressed during the abnormally wet sampling period (usually < 2.0 mg /L) ,
this was not an important consideration. During normal years, agricultural
pumpage could very well represent a significant BOD input to the system.
Although the dissolved solids concentrations of discharge and upstream water
were similar, suspended solids were higher in the pu-ped water, averaging 9.6
and 5.3 mg/L, respectively, at the two sites.
Nitr if ication could be occurring in Z i g z a g Canal as nitrate concentrations
remained high at downstream stations, while ammonia levels dropped o f f . If
nitrification was occurring the BOD may be an underest imate. However, the
high color and dissolved humic levels and low Do ' s in the canal do not favor
nitrification (We-tzel, 1975). Such was the case in several European waters
(Nyguard, 1938; Karker 1939). It is likely that ammonia reduction downstream
was due to plant uptake and that nitrification is not a major process in this
system. However, nitrification may have occurred near the pump outfall where
oxygen levels were higher and extremely high N O - N O concentrations were found.
: BULLDOZER CANAL PUMP
Two pumps were sampled :on Bulldozer Canal (F igure2) . Pump No. 1 was
sampled once and pump #2 was sampled 5 times. These pumps drain improved
pasture and citrus areas, respectively. The nutrient levels from these pumps
were not high and most data indicate that the water quality (BOD nutrients,
etc.) of the northward flowing South Mormon Outside Canal (SMOC) was worse
than the BDZ pump water . Bulldozer pump TN and TP loading rate information
is presented in Table &. Loading rates are low due primarily to the low discharge
rates encountered. The chloride, hardness, alkalinity suspended solids and
dissolved solids levels of pump //2 were fairly high; much higher than upstream
levels, SMOC levels or pump //I discharge (Table 10).Pump #1, although sampled
only once, exhibited higher TKN (2.7 ing N/L) , NH -N (0.10 mg N/L) and BOD
60

Table 10. Bulldozer canal pump event data.
!. 1 I *
Up 2*11)
U 4 )
( 2 s )
( 2 4 )
( 2 4 )
( 2 4 )
I'ump J2(22)
( 2 2 )
(22)
( 2 2 )
( 2 2 )
( 2 2 )
' ump J 1
(19)
"wu 211)121)
^' ( 2 1 )
( 2 1 )
( 2 1 )
< - M )
,11 f 1 ,.'Ik I 1 Uf 11 I
I ' a l t : • TlUC( I ' / l i :1) In 1 1,1, 11 ly Color
1 / 2 7 6 . 4
7 /12 14.0
7/20 7 . 7
8/1 7.8
B/31 2 . 1
5/27 1.7
7/12 15.0
7/20 7.4
8/3 7.9
8/31 B. 8
5/26 1.4 •
/ / 1 2 14.0
1/27 1 .5
/ / 1 2 1 .5
7 / 2 0 7 .8
B/3 8.6
8/11 2 . B
e uf
7 7
617
471
534
379
68
432
244
267
243
75
472
66
444
308
378
340
SS
1.4
12.8
8.4
5.6
5.6
6.8
12.0
10.8
6.8
23.3
4.0
10.0
3.6
10.0
8.8
10.0
9.0
[>S
671
268
240
180
176
632
--
542
528
439
681
242
6 7 7
429
459
368
271
VSS
2 . 2
10.4
6.8
4 . 5
4 . 4
3.8
11.4
8.8
5.2
10.6
0.6
8.4
2 . 2
8.0
7 . 2
4 .8
6.5
rss
3 . 2
2 . 4
1.6
2.5
1.2
3.0
1.6
2.0
1.6
12.7
3.4
1.6
1.4
2 .0
1.6
5.2
2 . 5
vris
170
122
100
87
86
118
—148
142
154
162
110
126
142
141 .
125
120
f'K'i
101
146
140
93
90
494
—393
385
285
519
132
551
287
158
243
155
A l k .
155
37
42
63
63
147
75
89
183
135
173
36
150
73
78
119
90
II it nl .
326
122
120
104
90
322
238
296
266
224
352
120
328
230
246
200
144
. so- ortho P Total P TKN N|| _()
C.\ 4 }•) i r / U l f 111 I'll t / U n f l l l U l t / U n H l t 4
192 7 .20
30 1.3
31 8.7
22 0.5
48 4.3
199 95.0
62 2 0 . 7
113 58.7
110 47.1
83 31.2
199 76.0
21 9.3
196 95.0
58 20 .5
96 45.0
64 30.5
75 13.7
<0.01
0.11
0.15
0.15
0.08
0.01
0.19
0.06
0.08
0.06
<0.01
0.05
<0.01
0.13
0.09
0.10
0.08
<0.01 0.04 0.04 0.6 0.8
0.13 0.13 .18 2.0 2.2
0.19 0.17 0.23 1.9 2.3
0.18 0.19 0.22 2.0 2.0
0.09 0.20 0.31 0.8 1.8
0.01 0.04 0.05 0.7 1.2
0 . 2 3 0.21 0 .27 1 .9 2 .4
0.07 0.09 0.11 1.6 1.7
0.09 0.11 0.14 1.8 2.2
0.06 0.08 0 .29 0.7 2.5
0.01 0.03 0.06 0.8 0.9
0.06 0.11 0.14 2 . 1 2 . 7
<0.01 0.08 -- 0.8 1.0
0.19 0.18 0 . 2 1 2 . 3 2 . 3
0.11 0.10 0.16 1.5 0.08
0.12 0.13 0.17 2.2 2.2
0.09 0.20 0.31 0.8 1.8
0.03
0.03
0.03
0.05
0.07
0.04
0.18
0.10
0.10
0.09
0.05
0. 19
0.01
<0.02
0.08
0.05
0.07
N O - N O3 2 aon( t» N ) i
O . C 2 0 .7
<.02
0.05 0-«
0.05 1-1
0.05 4 .2
0 .02 2 -0
<0.02 2 .4
0.05
0.08 0.4
0.04 3.1
0.02 ?-55
<0.02 4 - 2
» 0 . 0 2 1 - 3
<0 .02 2 . 2
0.05 0.07
0.06 1 -7
0.05 < - 2
Chi oropti
A ^
3.5
4.2
3.8
29.5
3 . 7
1.9
7.9
5.2
13.3
19.4
3.4
10.9 2
1.5
6.0
5.3
4.8
21.3
1.7
0.9
0.0
6.7
0.0
ly l l
c
4 . 7
1.3
0.0
0.0
0.0
II
0.4
.73
0.61
0.79
0.60
1.6 4.2 0.2'
2.1
0.7
3.2
1.4
5.1
.6
0.0
2 .0
0.5
0.0
0.3
0.8
0.0
0.0
0.0
24.3
1.0
2 . 4
0.0
0.0
0.0
0.0
0.84
0.61
0.41
0.84
0.1
0.96
0.1
0 . 2 7
0 . 2 7
0.63
0.60
Ca
81 .7
36.8
37.6
25.6
28,8
84.9
64.1
84.1
80.1
88.9
100.9
34.4
81.7
60.9
68.1
5 7 . 7
46.5
iUS
29.6
7.3
6.3
9.7
18.0
26.7
19.0
20.9
21.4
2.0
24.3
8.3
30.1
19.0
18.5
13.6
28.0
K
4 .2
1.99
1.75
1.14
1.96
4.8
4 . 9 3
4.06
2.83
3.45
3.6
2.14
4 . 0
4.0-;3,. 34
2.20
2. 81
• M i l 1 K I V L T
(!'.)
( ] • . )( I 1 , )1 1 ' . )
(!'.)
01 > l ,
( l ' i b )
- ,ulh flu.ti.,.1 ( 1
U l )
1 1 1 )
5/27 1.2
7 / 1 2 16
7/20 7.9
B / 1 B . 0
8/11 2.9
B/31 2 . 3
) Ulllll
1 ) B / 3 1 2 . 6
7/12 11
7/20 7 .4
250
552
5B2
146
464
431
4 1 7
539
494
1.4
9 .2
10.4
4 . 4
4.0
4 .8
4.0
9.6
8.8
512
349
331
2aa216
264
214
321
313
1 .0
7 . 2
8.4
2 . 0
3.6
3.8
3. B
7.2
6.6
0.4
2 .0
2.0
2 . 4
0.4
1.0
1 .0
2.4
1.2
116
130
130
100
109
104
100
44
100
396
219
160
188
147
160
154
84
212
99
4P
39
74
62
63
64
37
40
220
138
132
136
106
108
102
136
136
177 52.0
62 7.2
71 13.2
16 11.1
55 9.4
13 8.7
55 8 .7
60 5.8
71 13.8
<0.01
0 . 2 0
0. 14
0.09
0.06
0.07
0.07
0.17
0.13
0.02 0.11 0.13 1.81.8
0.21 0.23 0 .25 1.7 3.2
0.11 0.17 0.24 3.0 3.1
0. 10 0. 11 0 .14 2.0 2.9
0.07 0.08 0. 13 1 . 8 2 . 7
0.08 0.10 0.12 1.2 2.7
0.08 0.09 0.12 1.4 3.0
-0.19 0.19 0.25 2.8 2.8
0.15 0.16 0.21 1.9 2.6
0.05
<0.02
0. 19
0.19
0.22
0.20
0 .24
<0.02
0.19
0.05 0.8
••0.02 --
0.05 3.?
o . oa 1 .10.04 4 . 3
0.02 4.3
<0.02 3.6
<0.02 4-5
<0.02 ' ' -7
0.7 O.I
2 0 . 4 0 .0
i s . •> o.o
1 U . 2 0 .0
11. 1 0
14.9 0
.0
.0
11.0 0.9
16.6 0.
10.0 0.
.0
0
3.7
•o .o0.0
o.o0.0
o.o
2 .3
0.0
0.0
0.2
0.38
0.73
0 . 7 9
0.50
0.52
0.50
1.31
1.65
48.9
37 .6
38.4
36.8
30.4
30.4
30.4
34.4
36.8
23.8
10.7
8.7
1 C . '
30.0
32.0
2 6 . 0
12.1
10.7
4.1
3 .20
2.12
1 . 7 5
2.17
2.12
2 . 5 2
3. 10
2.68

(4.2 mg/L) than pump #2 (Table 10). The BOD (4.2 mg/L) was significantly
higher than the average BOD of pump #2 (2.0 m g / L ) , but this value was similar
to those recorded from South Mormon Canal (SMOG) and the Marsh. Chlorophyll
was generally much higher in SMOC than in the BDZ canal, except on 8/31/82
when an algal bloom was present in the BDZ canal. Iron was high in Bulldozer
canal at the upstream and pump stations, but very high levels (x = 1.15 mg/L)
were found in SMOC, also. One interesting observation on the pump discharges
concerns color. Pump #2 exhibited lower average color (266 CPU) than upstream
(416 CPU) or SMOC (483 CPU). Pump #1 had a higher average color (472 CPU) ,
and this value was similar to upstream values (444 CPU) , but lower than SMOC
(539 CPU) levels.
Pump chemistry data collected on several different dates by Bionomics
Analytical Laboratory for Deseret Ranches of Florida, Inc. are presented in
Tables 11 and 12. These data are for Bulldozer pumps #1 (Table 11) and #2
(Table 12), and F.I .T. pump discharge data on the closest dates to those
sampled by Bionomics Lab are included for comparison. We are not sure of the
sampling conditions encountered such as hew long the pumps were on before
sampling occurred and the discharge rates, etc. Some differences in the data
may be due to the fact that they sampled behind the dikes, whereas we sampled
outside the dikes directly at the pump outfall.
On the average, F . I .T . and Bionomic water quality data were similar. On
7/12/82 our TKN level was slightly higher and the TP level was significantly
higher than concentrations found during the 6/1/82 pump event at BDZ pump #1.
Also, F.I.T. recorded higher suspended solids (10 mg/L) than did Bionomics
(5 mg /L) . The F.I .T. pump #2 data generally indicated higher TKN and suspended
solids levels than the Bionomics data , but the BOD_ was usually lower.
62

Table 11. Comparison of Pump #1 Water Quality Data.
Deseret Sampling F.I .T.
6/1/82 6/3/82 6/4/82 7/12/82
pH 7.9 7.8 7.9 6.65
BOD (mg/L) 4 3 2 4.2
Chlorides (mg/L) 47 80 90 21
Conductivity (ymho/cm) 490 680 750 290
Total Nitrogen as N (mg/L) 2.36 2.60 2.50 2.70
NO,-NO Nitrogen 0.32 0.13 0.14 <0.02as N (mg/L)
TKN as N (mg/L) 2.04 2.47 2.36 2.70
Total Phosphorus 0.019 0.019 0.004 0.14as P (mg/L)
Total Solids (mg/L)- 328 473 513 252
Total Dissolved Solids 324 468 508 242(mg/L)
Total Suspended Solids 4 5 5 1 0(mg/L)
Sulfate as SO (mg/L) 40 69 75 9.3
63

Table 12. Comparison of Bulldozer Pump #2 Water Quality Data.
Deseret Sampling F.I.T. Sampling Deseret Sampling
PH
BOD5 (mg/L)
Chloride (mg/L)
Conductivity(ymhos/cm)
Total Nitrogenas N (mg/L)
N O - N O Nitrogen
as N (mg/L)
TKNas N (mg/L)
Total Phosphorusas P (mg/L)
Total Solids (mg/L)
Total Dissolved
6/1/82
7.9
3
179
1400
1.18
<0.1
1.17
0.093
744
741
6/7/82
7.9
5
161
1000
1.88
<0.1
1.88
0.11
684
680
6/11/82
7.6
6
164
1300
1.98
0.48
1.50
0.11
755
752
7/12/82
7.1
2.4
62
650
2 .4
<.02
2 .4
0.27
-_
7/20/82
6.9
-
113
750
1.75
0.05
1.7
0.11
553
542
8/3/82
6.65
0.4
110
800
2.3
0.08
2.2
0.14
535
528
8/31/82
6.7
3.3
83
580
2.54
0.04
2.5 '
0.29
463
439
7/26/82
7 .2
4
75
560
2.05
0.15
1.90
0.29
412
410
8/4/82
6.3
4
28
200
2.14
0.12
2.12
0.21
201
198
8/10/82
6.3
3
47
320
1.89
<0.1
1.89
0.15
279
279Solids (mg/L)
Total SuspendedSolids (mg/L)
Sulfate as SO(mg/L)
79 71 77
12
21
11
59
7
47.1
24
31
2
38 17

On 8/3/82 a marsh sample was taken near Bulldozer canal at site 19B (Figure 4)
approximately 0.5 miles north of BDZ pump //I (see Appendix A; Sampling Dates and
Field Data). This sample was collected for water quality comparison with pump #2
and SMOC data. The results are presented in Table 12A. and show that the water
quality in the marsh is very similar to SMOC water quality, more so than with
the pump //2 downstream sample, indicating the dominance of SMOC discharge into
Bulldozer canal and the adjoining marsh.
65

Table 12A. Bulldozer pump //2, SMOC and marsh water quality data.
Marsh SMOCSite Bulldozer pump #2 (site 19B) (site 13)
Turbidity (NTU) 8.8 2.3 2.6
True Color (CPU) 243 435 417
Suspended Solids (mg/L) 23.3 4.8 4.0
Dissolved Solids (mg/L) 439 264 254
Volatile Suspended Solids (mg/L) 10.6 3.8 3.8
Fixed Suspended Solids (mg/L) 12.7 1.0 1.0
Volatile Dissolved Solids (mg/L) 154 104 100
Fixed Dissolved Solids (mg/L) 285 160 154
Alkalinity (mg/L as CaCC>3) 135 63 64
Hardness (mg/L as CaC03) 224 108 102
Chloride (mg/L) 83 53 55
Sulfate (mg/L) 31 8.7 8.7
Ortho-PO.-filt. (mg/L) 0.06 0.07 0.07
Ortho-PO.-unfilt. (mg/L) 0.06 0.08 0.08
Total P-filt. (mg/L) 0.08 0.10 0.09
Total P-unfilt. (mg/L) 0.29 0.12 0.12
TKN-filt. (mg/L) 0.7 1.2 1.4
TKN-unfilt. (mg/L) 2.5 2.7 3.0
NH4-N (mg/L) 0.09 0.20 0.24
N03,N02-N (mg/L) 0.04 C.C2 <0.02
BOD (mg/L) 3.3 4.3 3.6
Chlorophyll a (mg/L) 19.4 14.9 11.0
Iron (mg/L) 0.84 0.52 0.50
Calcium (mg/L) 88.9 30.4 30.4
Magnesium (mg/L) 2.0 32.0 26.0
Potassium (mg/L) 3.49 2.52 2.52

MARY A PUMP
The Mary A pump is listed as draining improved pasture although we observed
row cropping uses, particularly com. The water quality from the Mary A pump
was, by far, the worst of the pumps sampled and discharge from this pump had
the greatest pollutional potential. The average TN and TP concentrations for
the three sample dates were 3.96 mg N/L and 0.79 mg P/L, respectively (Table 5 ) .
Phosphorus levels of over 1.0 mg P/L were recorded on 7/22/82 and 8/12/82 at
this pump site. Nutrient loading rates were high and reflect the high concentra-
tions and discharge rates at this site (Table 5 ) . The upstream background site
does not reflect upstream conditions and should be neglected for comparison as
pump water backed up and moved in all directions and hyacinth jams prevented
reaching an appropriate upstream site. In fac t , Mary A discharge rates could not
be measured due to diffuse flow across the adjacent marsh in various directions
making it necessary to estimate discharge rates.
Mary A pumpage exhibited very high average levels of ortho PO (0.52 mg P /L) ,
total P (0.79 mg P/L) , TKN (3.9 mg N/L) , NH -N (0.31 mg N/L) , NO -N (0.48 mg N/L)
iron (1.68 mg/L) , turbidity (18.1 N T U ) , BOD (5.5 m g / L ) , hardness (223 mg/L as
CaCO ) and calcium (67 mg/L). The mean color of the pump discharge (525 CPU) was
very high, higher than the upstream station on lateral M canal (380 CPU). Chloro-
phyll £ was very high at the pump and in the canal on 7/22/82 and 8/12/82 with
concentrations at the pump of 23 and 29 mg/m , respectively. These levels were
much higher than Lateral M canal on those dates and reflect the "algal bloom"
conditions present in the canal at those times. The pump discharge and upstream
and downstream water chemistry data are shown in Table 13 .
67

Mary A pump event data.
p
."ill( A )
( C )
( A )
.11 2 5 nI I I )( I I I
( I I )
i : )u. i
'"
. 1 tK*
1 ! '
'? 1
l i ^ t c Tur l . l i l u y
7 / 2 2 1)
d / 1 2 1 ti
') / 1 5 . 3
7 / 2 2 2 6
B / 1 2 4 . 4
9 / 1 5 . ;
7/2. ' 24
B / 12 4. a
'l / 1 2 . i
7 / 2 2 7 . 3
B / 12 2.9
•• ' 1 3.4
-m
B / 1 2 1 . )
• , / l 2 . 5
Color
B 33
479
265
858
518
265
902
534
'177
384
379
379
393
378
Ortho Pss
187.0
56.0
10.0
71.0
10.4
1 2 . 4
78.0
6.8
1.8
4.0
8.8
12.0
5 . 2
4 . 8
i'S
404
284
700
399
218
732
414
223
207
327
238
207
2 5 3
190
VSS
91.0
24.0
4 . B
3 7 . 0
4 .8
5 .6
40.0
4 . 4
1.2
2.8
4 . 4
6 . 4
4 . 4
2 . 2
FSS
96.0
32.0
5.2
3 4 . 0
5 . 6
6 .8
38.0
2 . 4
0.6
1.2
4 .4
5.6
0.8
2 . 6
VDS
1570
136
204
1 700
104
2 1 7
1780
106
82
104
82
79
100
72
F!>S
2470
148
496
2290
114
515
2360
117
125
223
156
128
153
118
A l k .
123
78
2 3 7
120
59
230
118
61
44
53
45
40
48
44
lUrJ
192
126
352
184
100
332
184
9.8
76
128
84
76
94
80
Cl
52
38
175
52
28
175
50
29
48
82
52
48
52
48
4 F l l t / U n f l l t
2 7 . 4
15.8
4 1 . 3
3 1 . 3
15.2
4 4 . 3
28.4
13.5
9 .4 '
40.0
16.4
9.4
16.0
8.7
0.58
0.77
0.09
0 .65
0.68
0.09
0.66
0.72
0.08
0.06
0.07
0.08
0.12
0.08,
0.62
0.840 . 10
0.660 . 7 3
0.10
0.68
0.75
0.09
0.06
0.07
0.08
0.12
0.09
Tot a 1 PF l l t / U n f l l t
0
0
0
0
0
0
0
0
0
0.
0.
0.
0.
0.
.62
.91
.13
.66
.80
.13
.66
.82
.09
.07
.07
.09
12
09
1.03
1.16
0.19
0.960.87
0.19
0.87
0.88
0.15
0.09
0.09
0.17
0.16
0.13
TKN H01-H00
F l l t / U n f l l t
3.1
3.7
1.5
3 .4
3.3
1.5
3.8
3.3
1.5
1.9
1.7
1.2
1.9
1.4
4 . 2
4 .4
3.0
3. 7
3.4
2 .9
3.8
3.5
1.7
1.9
2.0
1.7
2.2
1.5
Nil N4
0
0
0
0
0
0
0
0
0
0
-o,0.
0.
0.
.35
.42
.17
.04
.33
.16
.42
.38
.11
.13
.14
.15
04
15
(as N)
0
0
0
0
0
0
0
0.
0.
0.
0.
0.
0.
0.
.72
.67
.06
.70
.17
.06
.68
.13
.06
,23
09
08
10
07
BOD U i l o r o p h y l
6.7 23.4
6.6 29.4
3.1 7.3
5.5 13.6
5 . 3 2 7 > 8
3 . 7 7 . 2
5.3 13.4
5.5 25.8
3.4 3 .2
0.8 3.9
2 - 6 4 .5
3.2 2. B
9.0 3.9
2 . V 2 .3
0.0
9.2
0.0
0 . 4
4 . 4
0.5
1.9
2 .4
0.0
0.4
1.5
0.0
1.4
0.0
0.
25.
0.
0.
10.
0.
0.
8.:
2 . '
1.4.
3.
5.2
1.1
— £ii M|j K^
0.0 2.92 60.1 10.2 4.4
1.59 36.0 B . / 3.85
0.0 0.52 104.9 21.'., 1 .72
1.88 55 .3 11.2 4 .3
10.3 0 . 7 0 2 8 . 0 7 . 3 3 . L B
0.50 109.7 1 4 . 1 3 . B 1
0 .2 2 .11 58.5 9 . 2 4 . 1 1
0.57 2 7 . 2 7 .1 3 .75
2.9 0.36 30.4 0.0 2 .50
1.1 0.61 30.4 12 .u 2 .40
4.9 0.50 22 .4 6.8 1 .79
3.1 0.52 21.6 5.1 2.r,9
5.2 0.47 20.0 10.7 2 .02
1.1 0 .35 , 25 .6 6 .1 2 . 3 4
365 13.2 283 10.4 2.8 93 190 56 116 68 2 1 . 5 0 .07 0.08 ' 0.07 0.12 1.6 1.7 0.08 0.09 1. u 5.5 0.7 2.2 0.61 2 7 . 2 11.7 2 . J

DIURNAL PUMP EVENT
One Zigzag canal pump event was sampled three times over a. 24 hr. period.
We sampled the Zigzag pump when it was turned on and again approximately 14 and
23 hours later. The data for the upstream (Station 0) , pump (Station 1) and
one mile downstream (Station 6) sites are presented in Table 14 . Most parameters
were fairly consistent throughout the 24 hour period. The level of nitrate-nitrogen
was high at the pump, averaging 0.83 mg/L, and remained fairly high one mile
downstream. TKN, and BOD concentrations, although not extremely high, remained
similar to pump discharge levels at the downstream station. Total phosphorus was
not extremely high in the pump discharge and it appears that the discharge of
inorganic nitrogen is the major problem associated with this pump. Studies by
the SJRWMD generally show an upper basin system which is nitrogen limited.
However, the Canal 40 and Lateral M areas exhibited the most frequent phosphorus
limitation and pump discharge with high inorganic nitrogen concentrations could
be a possible reason for this.
70
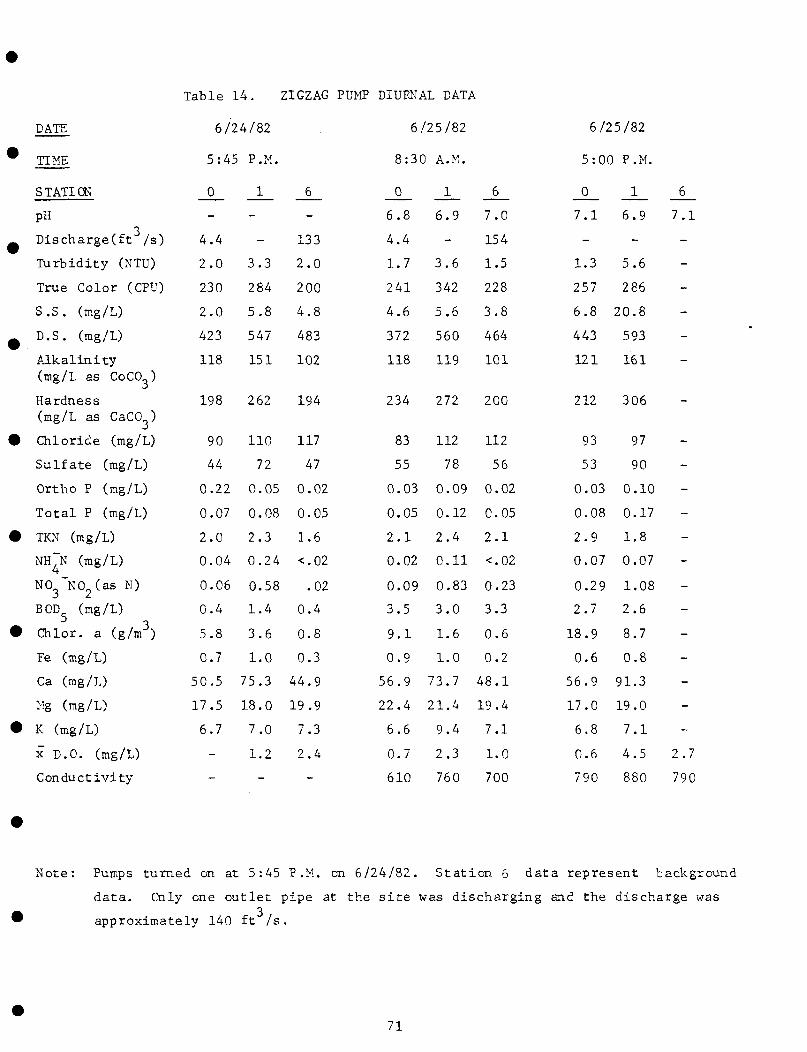
Table 14. ZIGZAG PUMP DIURNAL DATA
DATE
TIME
STATION
pH
Discharge(ft /s)
Turbidity (NTU)
True Color (CPU)
S.S. (ir.g/L)
D.S. (mg/L)
Alkalinity(mg/L as CoCO )
Hardness(mg/L as CaCO )
Chloride (mg/L)
Sulfate (mg/L)
Ortho P (mg/L)
Total P (mg/L)
TKN (mg/L)
NH~N (mg/L)
N03~N02(as N)
BOD (mg/L)3Chlor. a (g/m )
Fe (mg/L)
Ca (mg/L)
Mg (mg/L)
K (mg/L)
x D.O. (mg/L)
Conductivity
6/24/82
5:45 P .M.
0
-
4.4
2.0
230
2.0
423
118
198
90
44
0.22
0.07
2.0
0.04
0.06
0.4
5.8
0.7
50.5
17.5
6.7
-
-
1
-
-
3.3
284
5.8
547
151
262
110
72
0.05
0.08
2.3
0 .24
0.58
1.4
3.6
1.0
75.3
18.0
7.0
1.2
-
6
-
133
2.0
200
4.8
483
102
194
117
47
0.02
0.05
1.6
<.02
.02
0.4
0.8
0.3
44.9
19.9
7.3
2 .4
-
6/25/82
8:30 A.M.
0
6.8
4.4
1.7
241
4.6
372
118
234
83
55
0.03
0.05
2.1
0.02
0.09
3.5
9.1
0.9
56.9
22.4
6 .6
0.7
610
1
6.9
-
3.6
342
5.6
560
119
272
112
78
0.09
0.12
2 . 4
0.11
0.83
3.0
1.6
1.0
73.7
21.4
9.4
2.3
760
6
7.0
154
1.5
228
3.8
464
101
200
112
56
0.02
0.05
2.1
<.02
0.23
3.3
0.6
0.2
48.1
19.4
7.1
1.0
700
6/25/82
5:00 P .M.
0
7.1
-
1.3
257
6.8
443
121
212
93
53
0.03
0.08
2 . 9
0.07
0.29
2.7
18.9
0.6
56.9
17.0
6.8
0.6
790
1 6
6.9 7.1
-
5.6
286
20.8
593
161
306
97
90
0.10
0.17
1.8
0.07
1.08
2.6
8.7
0.8
91.3
19.0
7.1
4.5 2 .7
880 790
Note: Pumps turned on at 5:45 P .M. on 6/24/82. Station 6 data represent background
data. Only one outlet pipe at the site was discharging and the discharge was
approximately 140 ft /s .
71

SEDIMENTATION STUDIES
This phase of the study provided background data on the rate and nature
of sedimentation for comparison with past and future studies.
CORING PHASE
Sediment cores produced profiles and depths of sediment strata along
longitudinal and transverse transects in each lake, as well as profiles along
radials positioned at the river entrance into each lake. The methodology and
coring locations are discussed in detail in Chapter III. The location of the
longitudinal and transverse transects are shown in Figures 7 through 12.
Also included in this section is a Lake Washington sediment type map constructed
from numerous dredges taken throughout the lake in 1978 (Mason and Belanger, 1979).
Bathymetric profiles of the longitudinal and transverse transects are presented
in Appendix B; coring locations in these transects are indicated on the chart
paper. Although-the Ratheon Fathometer was set on the lowest depth range (0-55'),
very little detail can be seen from the transect profiles due to the shallow end
uniform nature of the lakes.
Core data indicate all the lakes generally have a layer of fine organic matter
on the sediment surface with layers of sand and clay beneath the surface at various
depths. The U.S . Fish and Wildlife Service (1951) described the sediments of
Lake Washington as "hard sand and silty mud". We found that the lake is characterized
by large amounts of fine organic matter on the surface (more than the other lakes),
underlain by clay and some sand. Vie frequently encountered clay in Lake Washington
at lower core depths. The sediment at the inlet to Lake Washington is primarily
comprised of sand. Lakes Sawgrass and Hellen Blazes have very shallow layers of
fine organic matter on the surface, but these southern lakes in the chain ex-
hibited more fibrous or woody organic matter beneath the fine layer than other
72

upper St. Johns Lakes. These data seem to indicate that aquatic plant sedimenta-
tion dominates in Lakes Helien Blazes and Sawgrass, while algal and allochthonous
sediment inputs are important in Lake Washington. Cox et al. (1976) stated that
the sediments of Lakes He lien Blazes and Sawgrass are primarily organic oozes or
mucks with some firm peat , mostly derived from hyacinths and marsh vegetation.
The U.S . Fish and Wildlife Service (1951) described the sediments as just "plant
debris over sand". Organic build-up occurs wherever hyacinth rafts decay and sink,
However, waves can move and distribute these organic sediments throughout the lake
basin. On the average, longitudinal and transverse cores in Lake Helien Blazes
exhibited greater depths of organic matter than cores from the other lakes.
Based on the .17 longitudinal and transverse cores taken in each lake (Appendix D) ,
there was a progressive decrease in the depth of organic matter present in the
lakes as they progress northward from Lake Hellen Blazes (with the exception cf
Lake Poinsett) . Lakes Hellen Blazes, Sawgrass, Washington, Winder and Poinsett
exhibited average organic matter depths of 13.8, 9 .7 , 9.5, 3.4 and 5.4 inches,
respectively.
Blue Cypress, which is considered separately, had the greatest depth of
organic matter of any lake, averaging 17.7 inches for the 17 longitudinal and
transverse cores. Most of this organic matter appeared to be well decomposed
material of algal origin. More peat was encountered in this lake than the others.
In fac t , all of the radial cores had a loose peat bottom, and sand or clay levels
were never found.
Cores taken from transverse transects during this study (1982) were compared
with cores taken during the FGFWFC 1971 sedimentation/vegetation transects
(Figures25 and26 ). Our transverse transects were positioned in Lakes Hellen
Blazes through Poinsett to duplicate, as closely as possible, the transect
73

IEST B A N K CEN I ER EAST R A N K
Lake Helleri BlazesDrpl.h (inches) Q 2 4 6 8 10 12 14 16 18 20 22 24 26 20 2 4 6 8 10 12 14 16 10 20 22 24 26 20 2 4 6 R 10 12 14 16 10 20 22 24 26 20 30
r.rwn; 1971
nr 1902
nrwir : 1971
I I ! 1902
nrwrc 1971
T i l 1902
OSPD \35.V\ /
SLT PD S/PD S/C 1
2
PD S
SLT PO S C 1
2
s c s c j
SS S S/C C | .1
2
K E Y : USPD - Unconso l ida ted si l l
US1!) \40"V /
:;L PD S/PD s/c cSl.l PD S/PD S
Lake Sawgrass
PD S ]c i
si. r | PD |s jft: | cPD | PD/S S S/C C |
Lake Washington
SI. I S C j
SL T s/r rSLT ISS I SI.1/C 1 C j
t and plant detr i tus S = Sand
USPD \W \ /
SLT TO S/PDJ S S/C (1 )
PD T' ,
SLT % 5 !- 1
s |c |li|
ss Js/c l cl c "J
( 1 1 - Cl ay foundPD = Plant detritusSLT = S i l tS/PD - Sand and plant detritusS/C - Sand and clay
SLT/C = Silt and c layC = ClaySS = Silty sand
i !- Depth of stratar~7' - Did not reach hardpan
FIGURE 25. West bank, Center and East Bank cores in lakes He 1 1 en Blazes, Sawgrass and Washington
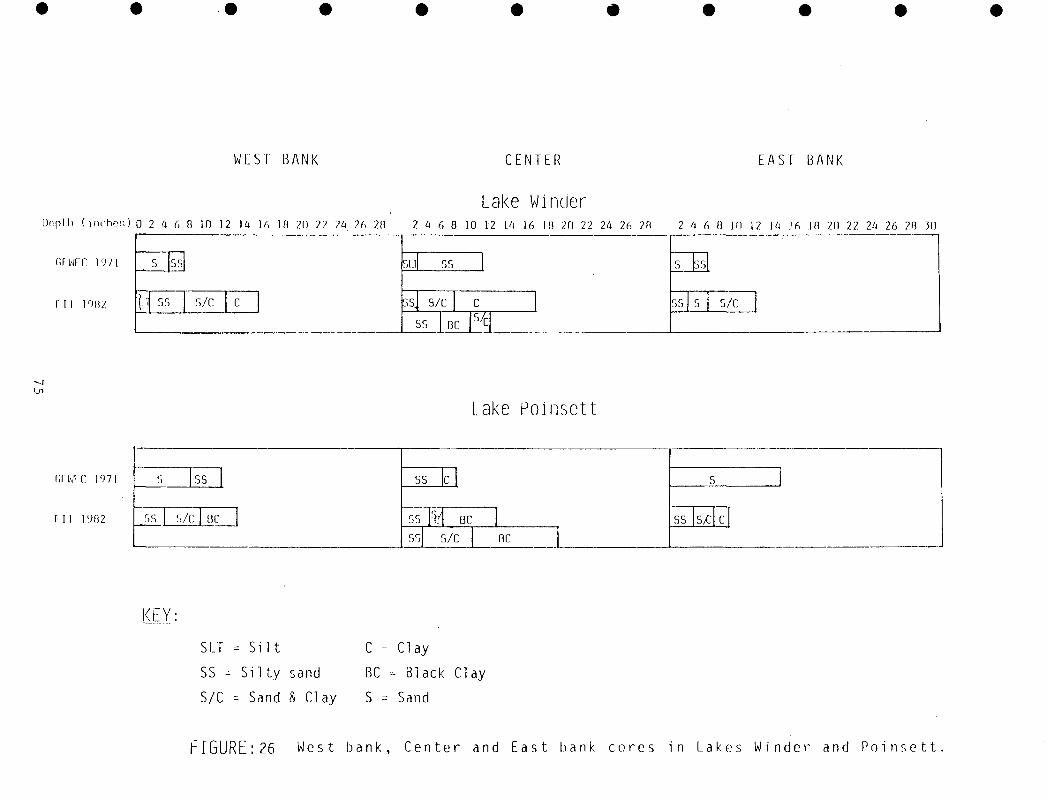
WEST B A N K C E N T E R EAST B A N K
Lake WinderDr-plh (inches) 0 2 4 6 0 10 J 2 .14 16 10 20 22 24 26 20 2 4 6 0 1.0 12 14 16 IB 20 22 24 26 20 2 4 6 8 JO 12 14 .16 10 20 22 24 26 20 30
1971.
rn 1902
S 5
I 55 5/C C
55
S/C C
ss nc5 5 S/C
Lake Poinsett
r.rwrr 1971
F i r 1902
ss
55 5/C OC
55 C
OC
5/C nc55 S£
K E Y :
SLT - S i l t C - Clay
SS - S i l ty sand BC = B lack Clay
S/C = Sand & Cl ay S = Sand
h I G U R E : 2 6 W e s t b a n k , C e n t e r a n d E a s t h a n k c o r e s i n L a k e s W i n d e r a n d P o i n s e t t

locations of the GFWFC. We realize, however, that considerable error may be
involved in the duplication of the exact coring locations. Two F.I.T, center
cores are presented in Figures 25 and 26, as we took cores 40 and 60% across
the lake from the west, instead of in the exact center as did the GFWFC. The
GFWFC corer was 20 inches long and, therefore, very limited. Our coring device
was longer and was used to reach a hard sediment stratum whenever possible.
Figure 26 shows the sandy, less organic nature of the bottoms of Lake Winder
and Poinsett, while Figure 25 shows the more organic nature of the sediment of
Lakes Hellen Blazes and Sawgrass. Figures 25 and 26, comparing 1971 and 82 core
data, indicate Lake Hellen Blazes presently has significantly less sediment
organic matter than in 1971. Lake Washington's bottom has a large percentage
of sand and clay, but the sediment type is extremely variable in the lake with
location. The variable nature of the Lake Washington sediment can be seen in
Figure 27 from sediment classification of the Lake based on Ponar dredge samples
taken in 1978 (Mason and Belanger, 1978). The visual description of the sediment
and the percent volatile solids content are shown in Figure 27, also. The depths
of organic matter in each lake are presented in Figures 28 through 33 for easy
visual comparison. Transverse cores (1971 and 1982) from Lake Sawgrass indicate
similar organic layer depths while the 1982 Lake Washington sediment cores show
the lake has a slightly deeper organic layer. One 1982 core from the center of
Lake Washington, however, indicates considerable organic deposition. Cores from
Lakes Winder and Poinsett show slightly more organic silt in the surface sedimen-
than in 1971, although the depth of this layer is not high.
Pb-210 analysis was attempted in Lake Hellen Blazes by others but I feel
the results are of questionable value as sediment mixing often occurs below the
sediment-water interface. Cox et al, (1976) state that in many areas of the upper
76
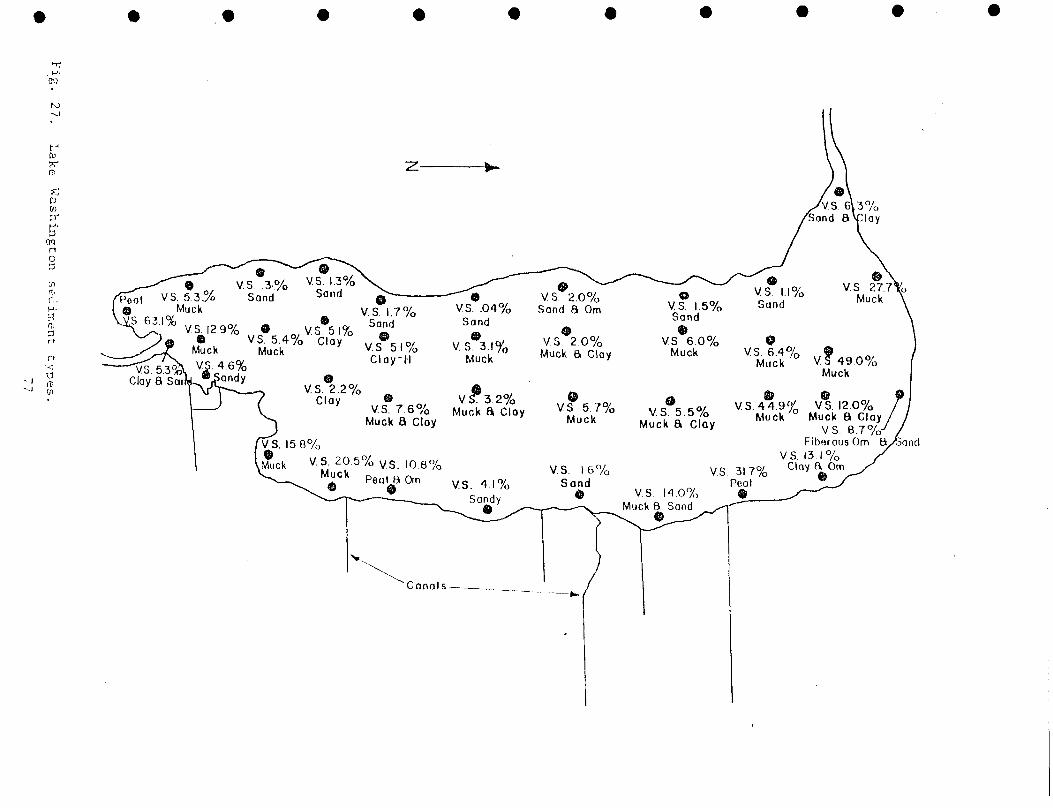
m
ho
0>7?(D
5TJ[UtoP'
5'00
n.H-
. ^V V.SW3-% V.S7|.3%V ^^~~f^at vs 5 3% Sand band
Q Muck© •
V S 1.7%- .% -.- v,v%v^ x;x<Jr Muck Mur.k V-s 5.1%
— ~^^\-X/>.
~^VS. 5.3%Clay B SarM
V_S. 4.6%Clay-H
©Sandy ©"\rr-->----> vs 2 2%
J / Clay
1 S
1 fVS. 158%
®V.S. 7.6%
Muck 8 Cloy
-~~^9VS. .04%
Sand
V.S®3.I%Muck
®V*3.2%
Muck S Cloy
i \lSck V.S. 20 5% VS. 106%x_^ rxiutc
^"~\©Peat a Om
t&
• vV
> .
V.S. 41%Sandy
~~^*.^
'Canals
iond

FIT 1982-T Dated Sampled:
11/24/82
FIT 1982
7 = did not reach hardpanbottom, 7 inches ofpeat collected.
Fig. 28. Depth of organic sediment in Blue Cypress Lake (inches).
(Specific strata and depths for longitudinal, transverse and inletradial transects are presented in Appendix D.)
78
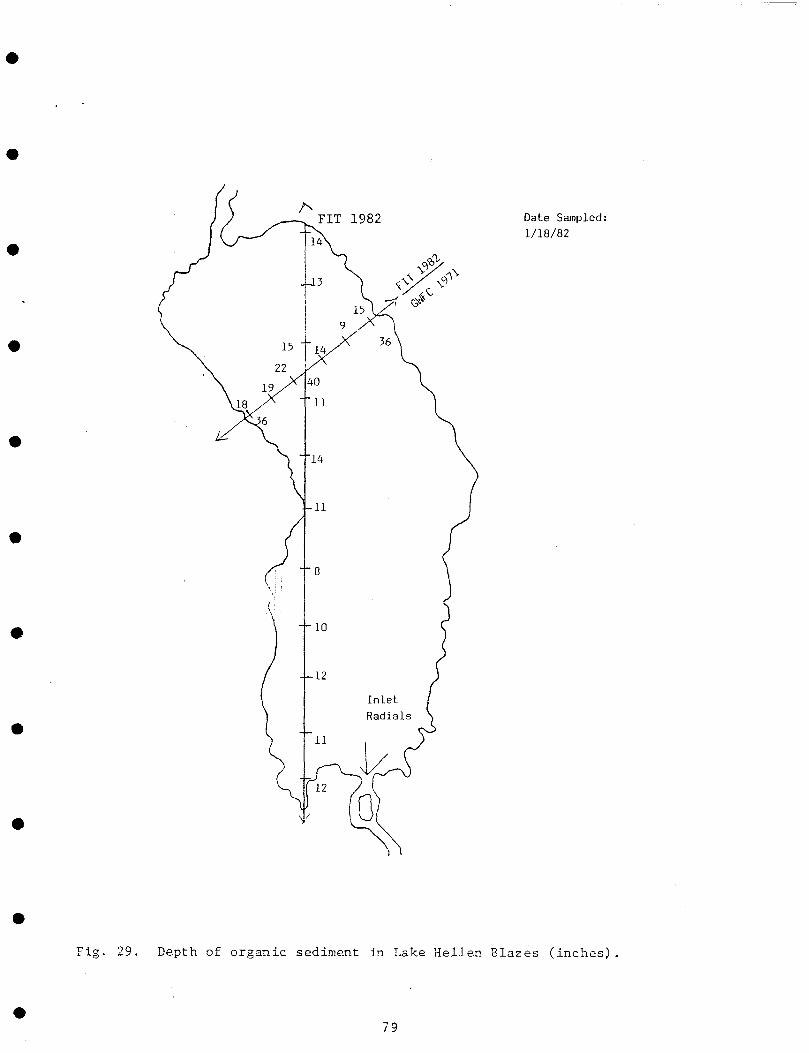
FIT 1982 Date Sampled:1/18/82
Fig. 29. Depth of organic sediment in Lake Hellen Blazes (inches)
79

FIT 1982 Date Sampled:11/10/81
Fig. 30. Depth of organic sediment in Lake Sawgrass (inches)
80

FIT 1982A Date Sampled:
3/12/82
31. Depth of organic sediment in Lake Washington (inches)
81

Date Sampled:10/22/82
Fig. 32. Depth of organic sediment in Lake Winder (inches)
82

FIT 1982
Date Sampled:11/3/82
Fig. 33. Depth of organic sediment in Lake Poinsett (inches)
83

St. Johns River lakes there is actually no defined sediment-water interface,
and a gradual change from thin suspensions of watery sediment to more compact
strata often occurs over depths of a meter or more. Although results from our
study indicated lower average organic layer depths of from 3.4 to 17.7 inches
in the six upper St. Johns lakes, these mixing depth in shallow lakes are still
great enough to invalidate the use of Pb-210 dating.
SUSPENDED SOLIDS LOADING DATA
Based on data from our seventeen sampling days (August, 1981 - August, 1982),
suspended solids data indicate a very small net input into Lake Washington as
inlet and outlet loading rates averaged 3500 and 3450 Kg/day, respectively (Table 15)
At the outlet the suspended solids concentrations ranged from 0,0 mg/L to 3.8 mg/L,
compared to a range of 0.8 to 7.7 mg/L at the inlet. The suspended solids averages
were 2.6 mg/L and 2.2 mg/L for the inlet and outlet, respectively (Table 16).
Volatile suspended solids made up more than 50% of the total solids content
(x = 54%; n = 27), showing the organic nature of the solids. The average suspended
solids concentrations for Three Forks, Bulldozer and South Mormon Outside Canals
were 3.5, 2.6 and 5.0 mg/L, respectively, while the loading levels were 409, 9 and
1181 Kg/day for these same canals (Tables 17 and 18). Bulldozer canal usually
exhibited a negligible flow and, in fact, reversed its flow during the summer of
1982. The data indicate that Three Forks was a significant solids source during
the dry season (September, 1981 - May, 1982) , and that Mormon Outside Canal was a
very significant source of solids during the wet season, when stage levels rose
(June - Augus, 1982). Since Three Forks ceased to flow in the summer, flow from
the C-40 area undoubtedly crossed the marsh south of Three Forks Run during that
time and contributed to the hight discharge, suspended solids and nutrient levels
in South Mormon Canal. Silt plumes were occasionally observed in the canal and
are believed to be caused by agricultural pumping.
34

Table 15. Suspended solids loading and export from the Lake Washington
entrance and exit, (kg/day) .
INLET OUTLET8/28
9/1
9/15
9/23
10/2
10/8
12/17
1/20
2/24
3/12
3/30
4/22
5/13
5/26
7/19
8 /A
8/26
43
156
8545
1650
1279
890
69
86
225
0
207
905
484
328
6973
22274
15388
8/28
9/1
9/15
9/23
10/2
10/8
12/17
1/20
2/24
3/12
3/30
4/22
5/13
5/26
7/19
8/4
8/26
0
0
0
1763
1460
1400
406
950
536
0
1261
2851
2670
1529
13003
23535
7327
x = 3500 x - 3452
85

Table .16. Suspended Solids data for the Lake Washington Inlet and Cutlet.
(mg/L) (mg/L)OUTLET
8/28
9/1
9/15
9/23
10/2
10/8
12/17
1/20
2/24
3/12
3/30
4/22
5/13
5/26
7/19
8/4
8/26
SS
0.0
0.0
0.0
2.6
2.5
2.4
1.3
3.6
1.7
2.6
3.1
2.9
2.5
2.4
3.8
3.1
x = 2.2
%
65
52
58
50
41
92
58
41
80
67
29
19
VSS
0.0
0.0
0.0
1.7
1.3
1.4
—
1.8
0.7
2.4
1.8
1.2
2.0
1.6
1.1
0.6
%
35
48
42
50
59
8
42
59
20
33
71
81
FSS
0.0
0.0
0.0
0.9
1.2
1.0
—
1.8
1.0
0.2
1.4
1.7
0.5
0.9
2.7
2.5
INLET
8/28
9/1
9/15
9/23
10/2
10/8
12/17
1/20
2/24
3/12
3/30
4/22
5/13
5/26
7/19
8/4
8/26
SS_
0.8
1.9
1.7
2.3
2 .7
2.9
1.0
1.9
1.8
0.8
3.3
3.1
1.9
1.8
4.7
3.5
x = 2.6
%
63
53
69
65
74
83
37
44
50
45
48
63
50
56
17
VSS
0.5
1.0
5.3
1.5
2 .0
2.4
—
0.7
0.8
0.4
1.5
1.5
1.2
0.9
1.7
0.6
c//o
37
47
31
35 '
26
17
63
56
50
55
52
37
50
64
83
FSS
0.3
0.9
2 , 4
0.8
0.7
0.5
—
1.2
1.0
0.4
1.8
1.6
0.7
0.9
3.0
2.9
86
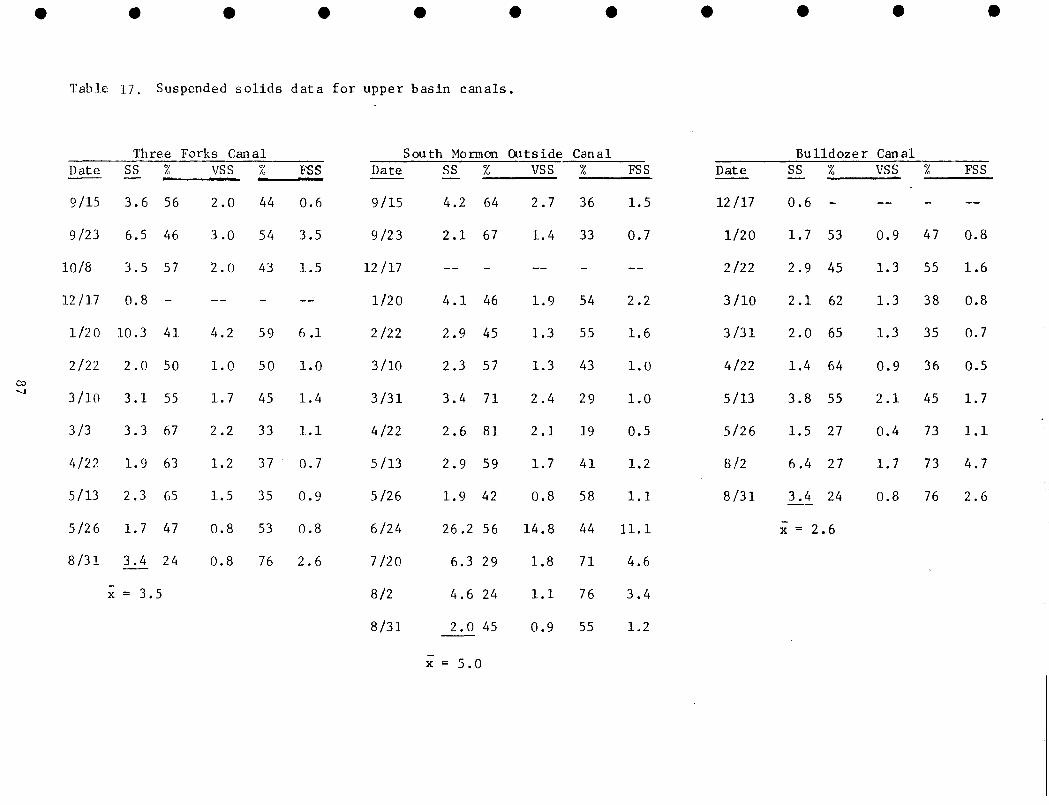
Table 17. Suspended solids data for upper basin canals.
Three Forks Canal South Mormon Outside Canal Bulldozer Canal
Co
Date
9/15
9/23
10/8
12/17
1/20
2/22
3/10
3/3
4/22
5/13
5/26
8 /3 1
SS
3.6
6.5
3.5
0.8
10.3
2 . 0
3.1
3.3
1.9
2.3
1.7
3.4
x = 3.
%
56
46
57
-
41
50
55
67
63
65
47
24
5
VSS %
2.0 44
3.0 54
2.0 43
—
4.2 59
1.0 50
1.7 45
2.2 33
1.2 37
1.5 35
0.8 53
0.8 76
FSS
0.6
3.5
1.5
—
6.1
1.0
1.4
1.1
0.7
0.9
0.8
2 .6
Date
9/15
9/23
12/17
1/20
2/22
3/10
3/31
4/22
5/13
5/26
6/24
7/20
8/2
8/31
SS
4.2
2.1
—
4.1
2.9
2.3
3.4
2 .6
2.9
1.9
26.2
6.3
4 .6
2.0
x = 5.
%
64
67
-
46
45
57
71
81
59
42
56
29
24
45
0
VSS
2 .7
1.4
—
1.9
1.3
1.3
2 .4
2.1
1.7
0.8
14.8
1.8
1.1
0.9
%
36
33
-
54
55
43
29
19
41
58
44
71
76
55
FSS
1.5
0.7
—
2.2
1.6
1.0
1.0
0.5
1.2
1.1
11.1
4.6
3.4
1.2
Date
12/17
1/20
2/22
3/10
3/31
4/22
5/13
5/26
8/2
8/31
SS %
0.6 -
1.7 53
2.9 45
2.1 62
2.0 65
1.4 64
3.8 55
1.5 27
6.4 27
3.4 24
x = 2.6
VSS % FSS
—
0.9 47 0.8
1.3 55 1.6
1.3 38 0.8
1.3 35 0.7
0.9 36 0.5
2.1 45 1.7
0.4 73 1,1
1.7 73 4.7
0.8 76 2.6
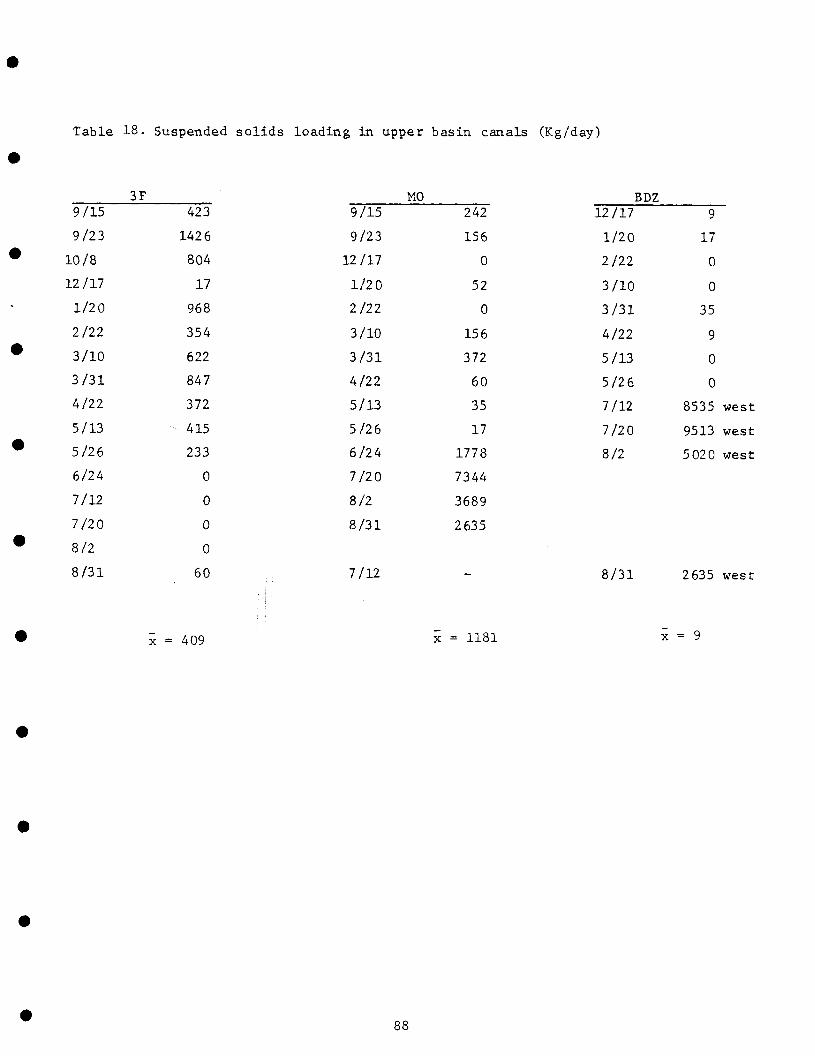
Table 18. Suspended solids loading in upper basin canals (Kg/day)
3F MO BDZ9/15
9/23
10/8
12/17
1/20
2/22
3/10
3/31
4/22
5/13
5/26
6/24
7/12
7/20
8/2
8/31
423
1426
804
17
968
354
622
847
372
415
233
0
0
0
0
60
9/15
9/23
12/17
1/20
2/22
3/10
3/31
4/22
5/13
5/26
6/24
7/20
8/2
8/31
7/12
242
156
0
52
0
156
372
60
35
17
1778
7344
3689
2635
—
12/17
1/20
2/22
3/10
3/31
4/22
5/13
5/26
7/12
7/20
8/2
8/31
9
17
0
0
35
9
0
0
8535 west
9513 west
5020 west
2635 west
x = 409 x = 1181 x = 9
88

The mass-balance method of using gaged stream flow and collecting suspended
sdiments at the inlet and the outlet to Lake Washington to de te rmine net sediment
•iflow has been previously criticized by the USGS and consequently the technique
is abandoned by the GFWFC. However, most of the critisrn centered aroung the
laccuracy of measuring flow by stream gaging (stage ht.) in a river with as
-.allow a gradient as the St. Johns River. We felt our mass balance approach
>uld at least give us ballpark answers as we made detailed flow measurements each
.me suspended solids samples were taken. For loading rate calculations, we also
:lt that the effect of bottom resuspension would not be large as the influent
rupling point is preceded by approximately 1-2 miles of sand bottom stream
armel and the outflow sampling point consisted of only surface water flowing over
e weir. The data are intended to give only approximate estimates, due to the
ove mentioned sources of error.
• SUSPENDED SOLIDS LOADING FROM AGRICULTURAL PUMPS
Suspended solids data for the four pump sites are presented in Tables 19
d 20 and indicate variable but high concentrations, particulary for Mary A.
e solids are generally highly organic in nature, as indicated by the high
rcent VSS levels. Loading rate data (kg/day) presented in Table 21 indicate
at the pumps are important sources of suspended solids. Mary A (37,877 Kg/day)
3 Zigzag pumps (3,511 Kg/day) were much greater contributors of suspended ;
ILids than the Bulldozer pumps (#1= 881 Kg/day; #2 = 359 Kg/day). The suspended , j
.ids concentrations and loading rates were much lower in the canals south of
^e Hellen Blazes (Table 18), but the high average SMOG suspended solids loading
.81 Kg/day) may be partially due to the upper basin pumpage. The low average
.u (3.5 Kg/day) at the Lake Washington entrance, however, indicates most of
: suspended solids settle out in Lakes Hellen Blazes and Sawgrass before reaching
.e Washington.

Table 19. Suspended solids data for the Zigzag and Mary A agricultural pumps.
ZigzagDate
4/27
5/5
5/5
6/15
: 6/18
6/18
6/18
6/18
j 6/24
6/24
6/24
6/24
; 6/25
' 6/25I i
f 6/25
r 6/25
I 6/25
' 6/25
8/16
'. 8/16
[;••; 8/16
;| 8/16
1
P
P
R
R
P
U
D
R
P
U
D
R
P
U
D
R
P
U
P
U
D
R
SS
3.9
1.8
1.6
3.4
13.2
12.4
16.8
7.6
5.8
2.0
8.0
4.8
5.6
4.6
3.8
3.8
20.8
6.8
2.4
0.8
2.0
1.6
%
62
67
63
41
24
39
45
32
45
90
60
21
29
17
37
16
21
29
67
50
60
50
vss
2.4
1.2
1.0
1.4
3.2
4.8
7.6
2.4
2.6
1.8
4.8
1.0
1.6
0.8
1.4
0.6
4 .4
2.0
1.6
0.4
1.2
0.8
%
38
33
37
59
76
61
55
68
55
10
40
79
71
83
63
84
79
71
33
50
40
50
FSS
1.5
0.6
0.6
2.0
10.0
7.6
9.2
5.2
3.2
0.2
3.2
3.8
4.0
3.8 '
2.4
3.2
16.4
4.8
0.8
0.4
0.8
0.8
DateMary
SS %
7/22 P— 187.0 49
U
D
R
8/12 P =
U
D
RU
RD
9/1 P
U
D
RU
RD
P = pump
71.0 52
78.0 51
13.2 79
56.0 43
10.4 46
6.8 65
8.8 50
5.2 85
10.0 48
12.4 45
1.8 67
12.0 53
4.8 46
AVSS
91.0
37.0
40.0
10.4
24.0
4.8
4.4
4.4
4.4
4.8
5.6
1.2
6.4
2.2
%
51
48
49
21
57
54
45
50
15
52
55
33
47
54
FSS
96.0
34.0
38.0
2.8
32.0
5.2
2.4
4.4
0.8
5.2
6.8
0.6
5.6
2.6
U = upstream 250 yds
D = downstream 250
R = bend in
RU = Lateral
RD = Lateral
canal ,
M canal
M canal
yds
1 mile downstream c
Pupstream '
downstream
Note: upstream station at Mary A not
conditions.
90

Table 20 . Suspended solids data for the Bulldozer Canal agricultural pumps,
Bulldozer #2 Bulldozer #1Date
5/26
5/27
7/12
7/20
8/3
8/31
SS
P
P
U
D
R
P
U
D
P
U
D
P
U
P
P
U
D
R
4
6
5
3
1
12
12
10
10
8
8
6
5
10
23
5
9
4
.0
.8
.4
.6
.4
.0
.8
.0
.8
.4
.8
.8
.6
.0
.3
.6
.0
.8
%vss
15
56
41
61
71
95
81
80
81
81
89
76
80
48
45
79
72
79
0
•3
2
2
1
11
10
8
8
6
7
5
4
4
10
4
6
3
.6
.8
.2
.2
.0
.4
.4
.0
.8
.8
.2
.2
.5
.8
.6
.4
.5
.8
%FSS
85
44
59
39
29
5
19
20
19
19
11
24
20
52
55
21
28
21
3.
3.
3.
1.
0.
1.
2.
2.
2.
1.
1.
1.
7.
5.
12.
1.
2.
1.
Date SS . %vss %FSS
4 7/12 P 10.0 84 8.4 16 1.6
0
2
4 North Mormon Outside BackgroundDate SS %VSS %FSS
45/28 P 1.6 100 1.6 0 0.0
6
4
0
0 Duda BackgroundDate SS %VSS ' %FSS
69/3 P 4.0 75 3.0 25 1.0
6
6
5
2
7
2
5
0
P = pump
U = upstream 250 yds
D = downstream 250 yds
R = confluence of canal and river
91
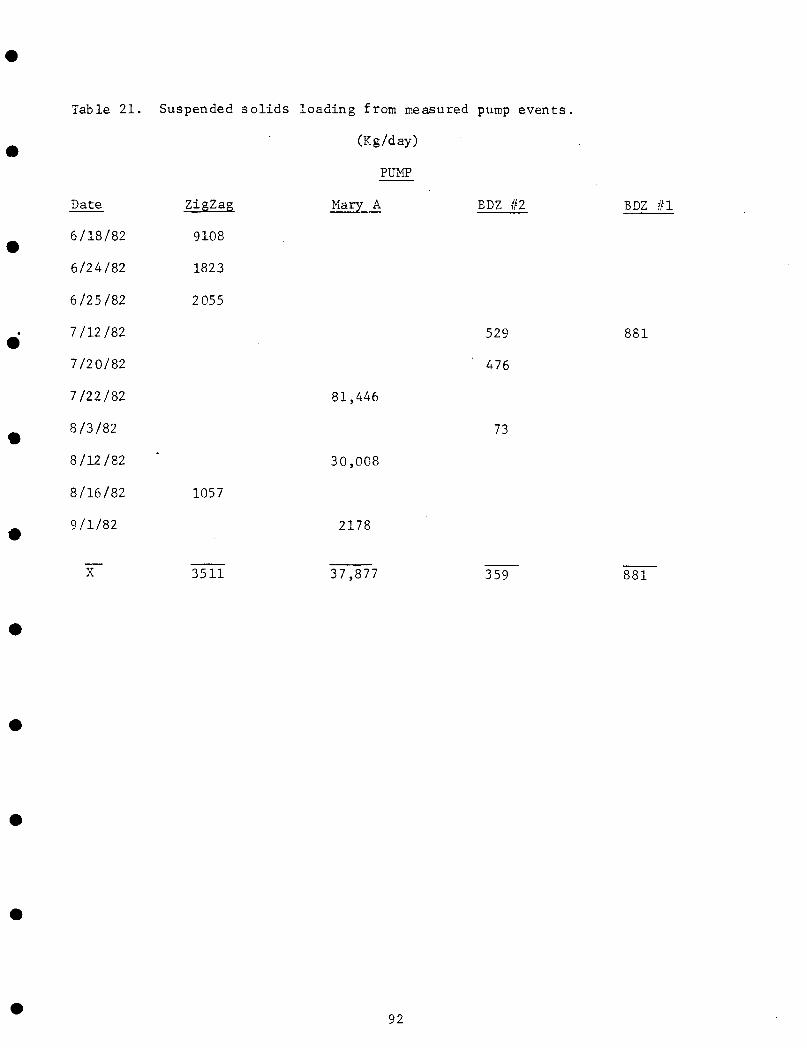
Table 21.
Date
6/18/82
6/24/82
6/25/82
7/12/82
7/20/82
7/22/82
8/3/82
8/12/82
8/16/82
9/1/82
X~
Suspended solids loading from measured pump events
(Kg/day)
PUMP
ZigZag Mary A BDZ #2
9108
1823
2055
529
476
1057
3511
81,446
30,008
2178
37,877
73
BDZ #1
881
359 881
92

WATERHYACINTH STUDIES
Recent information generated from an F.I.T. Masters thesis by Thomas Debusk
(1983) on ''Standing Crop Changes, Detritus Production and Decomposition of Eichornia
crassipes (Mart.) Solms" is pertinent to this discussion on sedimentation. Mr.
Debusk was under the supervision of Dr. F.E. Dierberg, Assistant Professor of
Enrivonmental Science. In his study Debusk (1983) measured the decomposition
rate of waterhyacinth plant tissues at two locations: 1) Lake Washington, and
2) a wastewater treatment facility in Pompano Beach, Florida. The study was
conducted in 1981 and 1982.
Waterhyacinth aerial tissues submerged at the sewage lagoon decomposed more
rapidly than roots (Fig. 34). The dry weight loss of aerial tissue in the first
seven days was equal to (p <.05) the loss of root tissue during the entire 120 day
incubation period. Also, decomposition of aerial and root tissues in the nitrogen
rich wastewater facility were much greater than corresponding rates in the low
nitrogen Lake Washington site. Aerial tissues comprised 88% of the standing crop
biomass of plants collected at the Pompano Beach sewage lagoon and only 68% of the
standing crop biomass of plants obtained from Lake Washington, where roots are more
important to the total biomass.
Standing crop growth and detritus production by the waterhyacinths were affected
both by nitrogen availability and by the amount of biomass in the standing crop
(Table 22). Table 22 shows that from July 11, 1981 to May 10, 1982,' the greatest
quantity of detritus was produced by waterhyacinths maintained under high-nitrogen,
non-harvested conditions. Slightly lower mean detritus production was found in
harvested high-nitrogen tanks followed by that in both harvested and non-harvested
low nitrogen tanks. Detritus production by low nitrogen waterhyacinths varied
seasonally, and was significantly lower than that of high nitrogen plants. Highest
detritus values occurred in the late spring and fall in the low nitrogen plants.
93
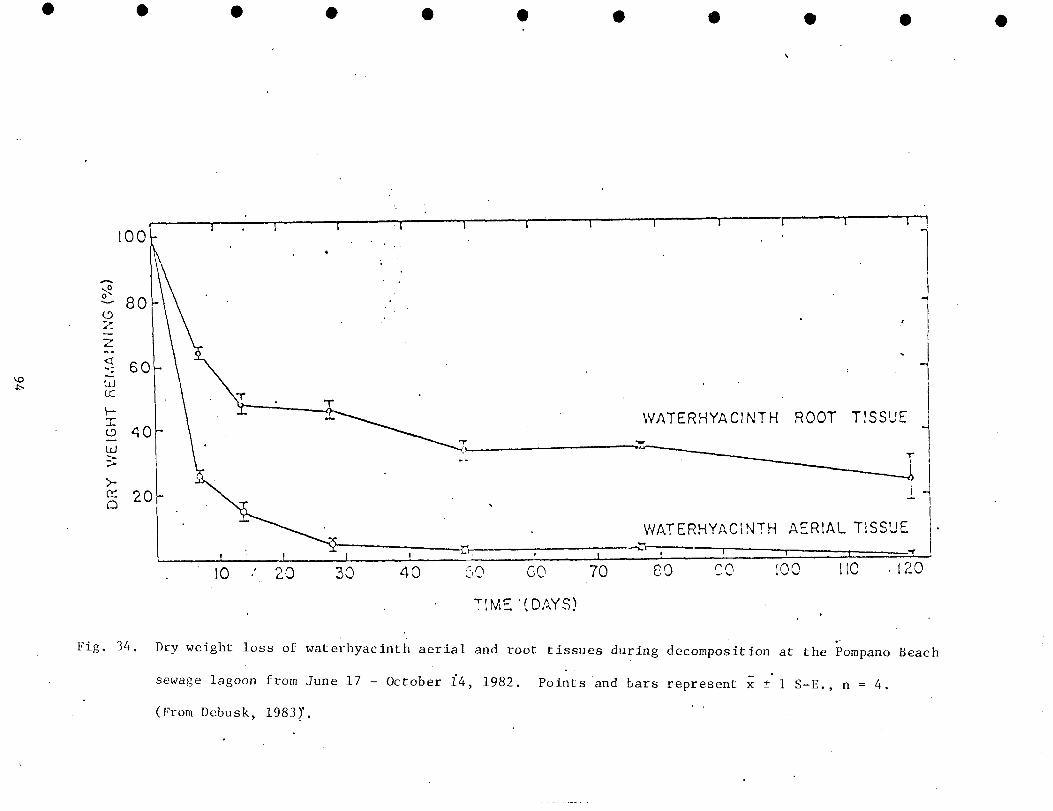
ID
100
80
§ 60ucrv-1 ^OUJ
20u
10
WATERHYACINTH ROOT TISSUE
WATERHYACINTH AERIAL TISSUE
30 40 50 GO 70
"HME. ' (DAYS)
80 100 .10 - 1 2 0
Fig, 34. Dry weight loss of waterhyacinth aerial and root tissues during decomposition at the Pompano Beach
sewage lagoon from June 17 - October 14, 1982. Points and bars represent x ±' 1 S-E., n = 4.
(From Debusk, 1983)'.
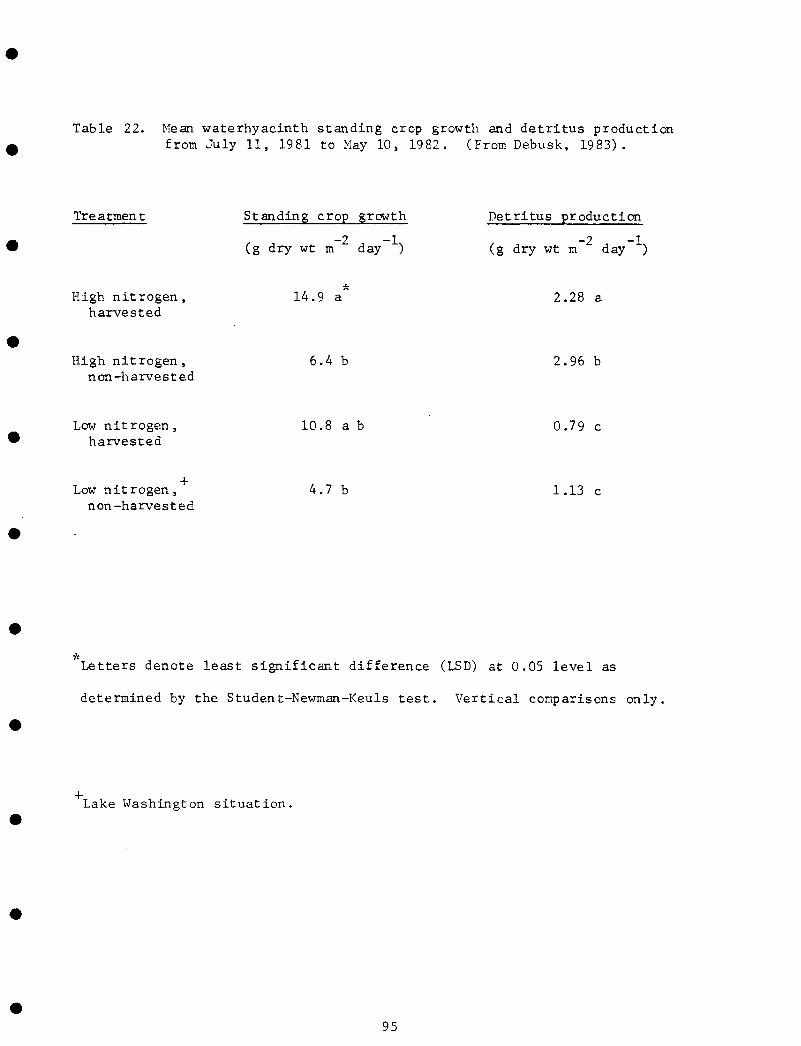
Table 22. Mean waterhyacinth standing crop growth and detritus productionfrom July 11, 1981 to May 10, 1982. (From Debusk, 1983).
Treatment Standing crop growth Detritus production
-2 -1 -2 -1(g dry wt m day ) (g dry wt m day )
High nitrogen, 14.9 a 2.28 aharvested
High nitrogen, 6.4 b 2.96 bnon-harvested
Low nitrogen, 1 0 . S a b 0 . 7 9 charvested
Low nitrogen, 4.7 b 1.13 cnon-harvested
Letters denote least significant difference (LSD) at 0.05 level as
determined by the Student-Newman-Keuls test. Vertical comparisons only,
Lake Washington situation.
95

The highest mean standing crop occurred in harvested high nitrogen tanks followed
by harvested, low nitrogen; non-harvested, high nitrogen; and non-harvested, low
nitrogen. The exact conditions and nitrogen concentrations used are specified in
Debusk (1983).
Although considerable literature exists on the "productivity" or standing
crop growth of Eichhomia (see Pieterse, 1978), there is a paucity of information
on detritus production by this species. Unlike many plants, Eichhomia detritus
(material sloughed from the mat) consists primarily of root, rather than aerial
tissues. In addition, because floating waterhyacinths are rarely inundated by
fluctuating water levels, dead aerial tissues are infrequently washed from the
mats and usually decompose within or near the mat. Dead aerial tissues decompose
fairly rapidly while held in the floating plant stand. Vega (1978) reported that
about 33% of the original dry weight of waterhyacinth plants remained after four
weeks incubation in the mat. Thus, aerial tissues which fall through the water-
hyacinth mat into the water column are frequently already Well decomposed.
As with standing crop losses, no relationship was observed between positive
standing crop changes and detritus production by Eichhomia. The factors which
affect the sloughing of tissues (roots) from the floating mat therefore occur
independently of standing crop changes. The importance of the turnover, or
sloughing rate of root tissues, is also emphasized by the poor correlation between
detritus production and the absolute biomass of roots present in the standing crop
Turnover rates of root tissues were thus calculated from detritus production and
average root bioinass estimates for each treatment (Table 23) .
96

Table 23- Average detritus production, root biomass and turnover time forroot tissues of waterhyacinths maintained under four culture regimesfrom July 11, 1981 to May 10, 1982. (From DeBusk, 1983).
Treatment Detritus production
-2 -1(g dry wt m day )
Root biomass
_2(g dry wt m )
Root turnover
(days)
High nitrogenharvested
2.28 303 133
Low nitrogenharvested
0.79 246 311
High nitrogennon-harvested
2.96 457 154
Low nitrogennon-harvested
1.13 680 602
Lake Washington situation.
97
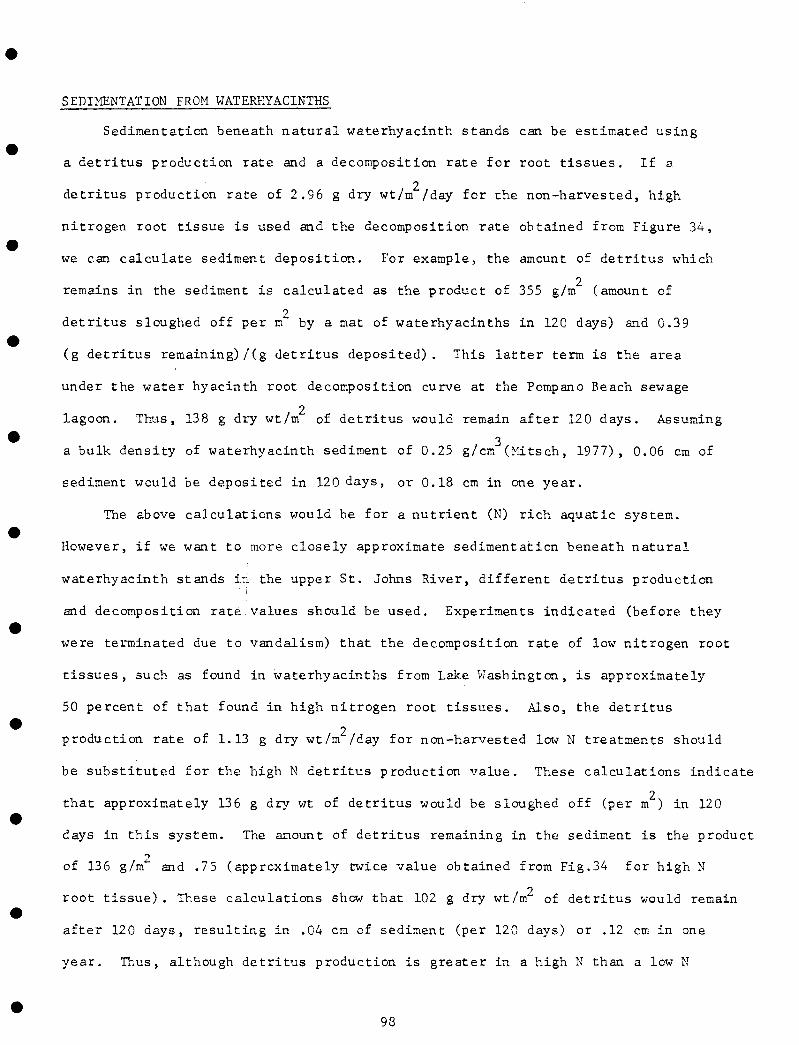
SEDIMENTATION FROM WATERKYACINTHS
Sedimentation beneath natural waterhyacinth stands can be estimated using
a detritus production rate and a decomposition rate for root tissues. If a.
2detritus production rate of 2 .96 g dry wt /m /day for the non-harvested, high
nitrogen root tissue is used and the decomposition rate obtained from Figure 34,
we can calculate sediment deposition. For example, the amount of detritus which
2remains in the sediment is calculated as the product of 355 g/m (amount of
2detritus sloughed off per m by a mat of waterhyacinths in 120 days) and 0.39
(g detritus remaining)/(g detritus deposited). This latter term is the area
under the water hyacinth root decomposition curve at the Pompano Beach sewage
2lagoon. Thus, 138 g dry wt/m of detritus would remain after 120 days. Assuming
3a bulk density of waterhyacinth sediment of 0.25 g/cm (Kitsch, 1977), 0.06 cm of
sediment would be deposited in 120 days, or 0.18 cm in one year.
The above calculations would be for a nutrient (N) rich aquatic system.
However, if we want to more closely approximate sedimentation beneath natural
waterhyacinth stands in. the upper St. Johns River, different detritus production
and decomposition rate:values should be used. Experiments indicated (before they
were terminated due to vandalism) that the decomposition rate of low nitrogen root
tissues, such as found in waterhyacinths from Lake Washington, is approximately
50 percent of that found in high nitrogen root tissues. Also, the detritus
2production rate of 1.13 g dry wt /m /day for non-harvested low N treatments should
be substituted for the high N detritus production value. These calculations indicate
2that approximately 136 g dry wt of detritus would be sloughed off (per m ) in 120
days in this system. The amount of detritus remaining in the sediment is the product
2of 136 g/m and .75 (approximately twice value obtained from Fig.34 for high N
fyroot tissue). These calculations show that 102 g dry w t / m of detritus would remain
after 120 days, resulting in .04 cm of sediment (per 120 days) or .12 cm in one
year. Thus, although detritus production is greater in a high N than a low N
98

environment, more of the root tissue is decomposed there and consequently a
lower percentage of the root tissue is deposited in the sediment. These calcula-
tions suggest the above differences nearly balance each other and similar annual
sedimentation rates of .12 and .18 cm were found for low N and high N systems,
respect ively.
SEDIMENTATION DISCUSSION
Contrary to previous opinion, our mass balance calculations and waterhyacinth
sedimentation calculations discussed here indicate that sedimentation in Lake
Washington may not be a significant problem. The mass balance technique showed
only a very slight net input into the lake, which was negligible when extrapolated
to a sedimentation rate for the entire lake. Even if the lake were covered by
a waterhyacinth mat the sedimentation rate would not be great (.12 cm/year). The
obvious error in the mass balance approach, however, are the lack of inflow and
outflow data and inability to correct for lake residence time so that the same
mass of water could be sampled at the lake entrance and exit. As a result, our
calculations may be somewhat misleading.
The practice of spraying waterhyacinths and other aquatic plants in the river
increases sedmentation in the area over the natural unsprayed rate as more dead
aerial and root tissue would reach the sediment. Large mats of waterhyacinths in
the upper St. Johns River are frequently eradicated by the use of herbicides by
the SJRWMD (i.e., 2,4-D). Chemically treated waterhyacinths usually die at the
surface, with the dead material sinking within two to four weeks. The immediate
fate of these dead tissues will vary depending on their composition. High quality
_2waterhyacinths (assume a standing crop of 2 kg m ; 85% aerial and 15% root tissue;
N content 2.5%; water 1 m deep) would rapidly decompose within one month, depositing
_2little sediment (0.23 kg m ) but releasing a large quantity of nitrogen to the
-2 -1water (46 g N m , or 46 nag NL ). In contrast, low quality waterhyacinths
99

(assume 6o/ aerial and 35^ root t issues, N content I / ; ' ) , similar to those f o u n d in
_7the upper St. Johns River and canal systems, would produce more sediment (0.92 kg m ~)
-2 -1but release less nitrogen to the water column (14 g N m or 14 mg K L ). Because
the composition, or quality of waterhyacinth tissues varies both with season (Tucker
and Debusk, 1981) and with nitrogen availability in the water (Tucker, 1981) chemical
control practices for this species could be timed to limit the impact of nutrient
or detritus additions to the water column and sediment.
SEDIMENTATION CONCLUSIONS
Although data are lacking and conclusions are preliminary in nature, our study
indicates that sedimentation in the upper St. Johns chain of lakes is not unusually
high, on an annual basis. These result are not what we thought we would find.
Sedimentation may be seasonally great when aquatic plant spraying is increased,
but it appears that periodic (seasonal) high flows in the system and accompanying
bottom resuspension allow most of the solids to be carried downstream with surface
waters. The shallow nature of the system and the fact that most of the total solids
are organic in nature (x = 54%) with a low specific weight support this contention.
The high suspended solids concentrations and loading rates found at pump sites
and in upper basin canals (TF, BDZ, SMOC) were significantly reduced before re.aching
Lake Washington, indicating some sedimentation occurs in Lakes Hellen Blazes and
Sawgrass. The solids (sediment) accumulate in the upper basin lakes to a great
extent under low flow conditions, such as occurred in 1974 and 1975, but are largely
carried downstream by high seasonal discharges, as experienced in 1978, 1979,
(Hurricane David 9/3/79), and 1982. Comparison of cores taken during this study
(1982) with cores taken during a FCFWFC 1971 sedimentation transect study indicates
there has been no significant increase of organic matter in Lakes Hellen Blazes
and Sawgrass. Lakes Washington, Winder and Poinsett, however, did show increases
in organic matter of .4 to .6 inches/yr, based on core comparisons. (Fig. 28-33).
Periodic bottom scouring and shifting under high flow conditions appears to
reduce long term secimer.t accumulation in the system. The data indicate there
100
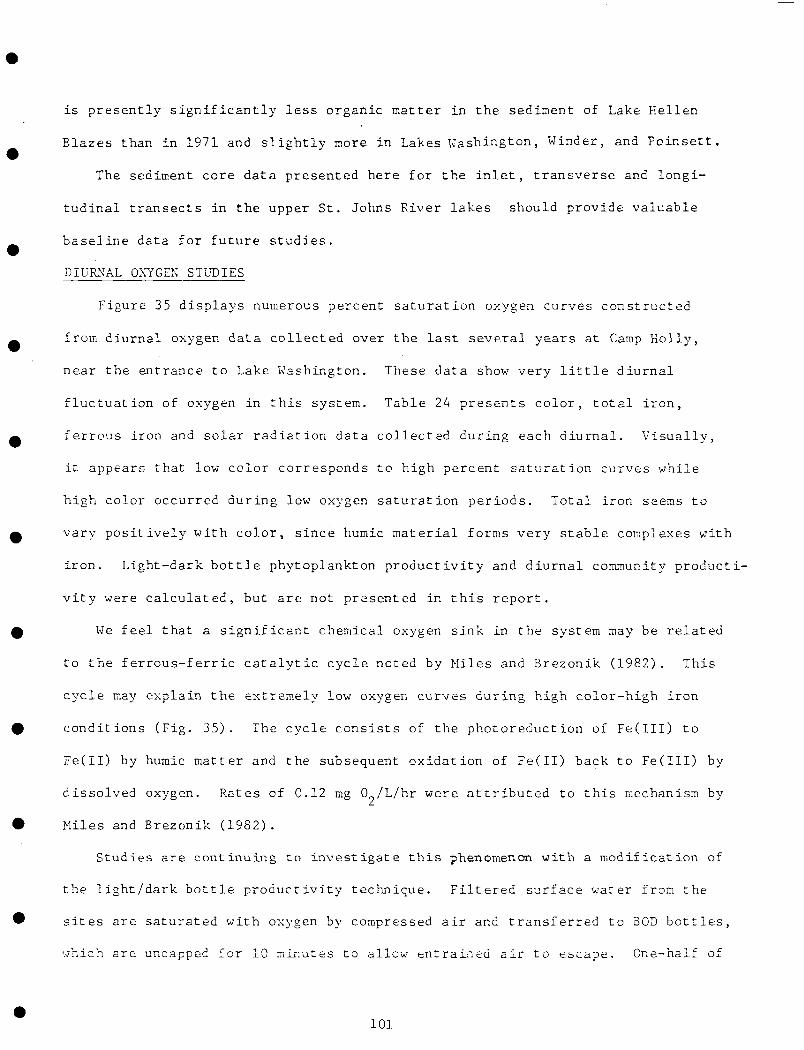
is presently significantly less organic matter in the sediment of Lake Hellen
Blazes than in 1971 and slightly more in Lakes Washington, Winder, and Poinsett.
The sediment core data presented here for the inlet, transverse and longi-
tudinal transects in the upper St. Johns River lakes should provide valuable
baseline data for future studies.
DIURNAL OXYGEN STUDIES
Figure 35 displays numerous percent saturation oxygen curves constructed
from diurnal oxygen data collected over the last several years at Camp Holly,
near the entrance to Lake Washington. These data show very little diurnal
fluctuation of oxygen in this system. Table 24 presents color, total iron,
ferrous iron and solar radiation data collected during each diurnal. Visually,
it appears that low color corresponds to high percent saturation curves while
high color occurred during low oxygen saturation periods. Total iron seems to
vary positively with color, since humic material forms very stable complexes with
iron. Light-dark bottle phytoplankton productivity and diurnal community producti-
vity were calculated, but are not presented in this report.
We feel that a significant chemical oxygen sink in the system may be related
to the ferrous-ferric catalytic cycle noted by Miles and Brezonik (1982). This
cycle may explain the extremely low oxygen curves during high color-high iron
conditions (Fig. 35). The cycle consists of the photoreduction of Fe(III) to
Fe(II) by humic matter and the subsequent oxidation of Fe(II) back to Fe(III) by
dissolved oxygen. Rates of 0.12 mg 0 /L/hr were attributed to this mechanism by
Miles and Brezonik (1982).
Studies are continuing to investigate this phenomenon with a modification of
the light/dark bottle productivity technique. Filtered surface water from the
sites are saturated with oxygen by compressed air and transferred to BOD bottles,
which are uncapped for 10 minutes to allow entrained air to escape. One-half of
101

100
oro
9 N 3
Time (hours)M
Figure 35. Diurnal oxygen curves (percent sa tu ra t i on ) at Camp Holly,near the en t rance to Lake Washington.
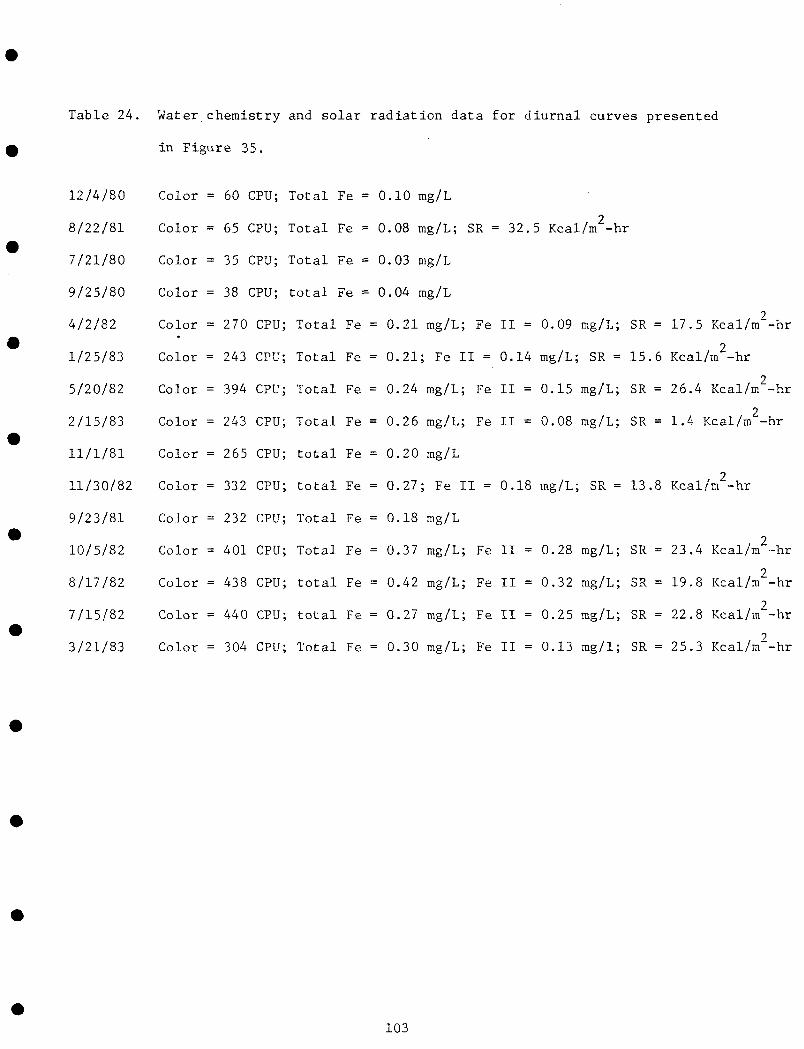
Table 24. Water chemistry and solar radiation data for diurnal curves presented
in Figure 35.
J; Total Fe = 0.10 mg/L
=32.5 Kcal/m^-hr
12/4/80
8/22/81
7/21/80
9/25/80
4/2/82
1/25/83
5/20/82
2/15/83
11/1/81
11/30/82
9/23/81
10/5/82
8/17/82
7/15/82
3/21/83
Color
Color
Color
Color
Color
Color
Color
Color
Color
Color
Color
Color
Color
Color
Color
= 60
= 65
= 35
= 38
= 270
= 243
= 394
= 243
= 265
= 332
= 232
= 401
= 438
= 440
= 304
CPU;
CPU;
CPU;
CPU;
CPU
CPU
CPU
CPU
CPU
CPU
CPU
CPU
CPU
CPU
CPU
Total
Total
Total
total
; Total
; Total
; Total
; Total
; total
; total
; Total
; Total
; total
; total
; Total
Fe =
Fe =
Fe =
Fe -
Fe =
Fe =
Fe =
Fe =
Fe =
Fe =
Fe =
Fe =
Fe =
Fe =
Fe =
0.
0.
0.
0.
0
0
0
0
0
0
0
0
0
0
0
10
08
03
04
.21
.21
.24
.26
.20
.27
.18
.37
.42
.27
.30
mg/L
mg/L; SR =
mg/L
mg/L
mg/L; Fe
; Fe II =
mg/L; Fe
mg/L; Fe
mg/L
; Fe II =
mg/L
mg/L; Fe
mg/L; Fe
mg/L; Fe
mg/L; Fe
3:
II
o.:
ii
ii
o.:
ii
ii
ii
ii
II = 0.09 mg/L; SR = 17.5 Kcal/m^-hr
20.14 mg/L; SR = 15.6 Kcal/m -hr
II = 0.15 mg/L; SR = 26.4 Kcal/m2-hr
II = 0.08 mg/L; SR = 1.4 Kcal/m -hr
0.18 mg/L; SR = 13.8 Kcal/m^-hr
20.28 mg/L; SR = 23.4 Kcal/m -hr
20.32 mg/L; SR = 19.8 Kcal/m -hr
0.25 mg/L; SR = 22.8 Kcal/m2-hr
0.13 mg/1; SR = 25.3 Kcal/m"-hr
103

the bottles receive 1 ml of saturated mercuric chloride to prevent microbial
respiration, and are incubated in situ in clear and opaque BOD bottles along with
untreated (no mercuric chloride) bottles. Replicate bottles of each of the four
treatments and controls are retrieved after 0, 4, and 8 hours and D.O. levels are
measured. In addition, total iron by atomic absorption spectrophotometry, ferrous
iron by colorimetry, dissolved organic color by absorbance at 420 nm on centrifuged
water, temperature, conductance, pH, Secchi depth, bottom depth and light energy
are measured for the surface water. Solar radiation is measured with a mechanical
pyranograph.
The data collected in this phase will be analyzed to determine the importanc-
of the photochemical ferrous-ferric catalytic cycle compared to uptake via microbial
respiration in the water column (by comparing rates of dissolved oxygen disappearance
in the poisoned light and dark bottles with that in the unpoisoned light and dark
bottles). In addition, the rates of oxygen produced by the phytoplankton community
will be determined using the unpoisoned light and dark bottles, respiration, and
net and gross productivity rates will be computed.
Diurnal -oxygen and field measurements made beginning on 2/16/83, 3/21/83 and
5/26/83 were used for single station metabolism calculations outlined in theUSGS
Computers Program User's Manual as referenced in Table 25. Single station calcula-
tions were made for stations 1, 2 and 3 with the 5/26/83 data, in addition to two
station computer calculations (Figure 35) . The single station technique (5/26/83)
indicates net daytime production, P/R and community metabolism increase in a
northward direction from station 1 to 3. The simultaneous two station technique,
however, indicates a dominance of respiration over production and negative 24 hr.
community metabolism values. Respiration and negative metabolism also dominated
at Camp Holly (Station 1) on 2/15/83 and 3/21/83. These data indicate that this
area is low in community production and studies are continuing to confirm that
hypothesis.
104

Table 25. Single and two station oxygen metabolism measurements near Camp Holly."
Net Daytime Night24. Hr.Community
DischargeDate (ft3/s)
2/16/833
3/21/834
5/26/S35
(1)
(2)
(3)
S/26/836
S/26/837
5/26/S38
__
98
98
98
98
98
98
Color(CPU)
243
305
296
296
296
296
Solar Radiation(cal/cm^/day)
11.4
365
585
585
585
585
Production(g 02/m
2/day)
1.77
0.43
2.75
3.42
5.23
- .43
- .19
-.14
Respiration(g 02/m2/day)
4.63
3.23
3.54
2.88
3.38
0.20
0.07
0.06
„ MetabolismP/P/ (g 02/m
2/day)
0.38
-0.13
.77
1.19
1.55
-1.59
-2.14
-1.76
-2.86
-3.66
- .79
.54
1.85
-0.63
-0.25
-0.20
1 Metabolism data were calculated using the Computer Program User's Manual entitled "Determination of PrimaryProductivity and Community Metabolism in Streams and Lakes Using Diel Oxygen Measurements", developed byDoyle Stephens and Marshall Jennings at the U.S.C.S. Water Resources Division of the Gulf Coast HydroscienceCenter, Bay St. Louis, Mississippi.
2. Net daytime production divided by night respiration.
3. Daytime rain occurred; single station method.
4. Single station method.
5. Single station method, stations 1, 2, and 3,(Figure 36).
6. Two station method; stations 1 - 2,(Figure 36).
7. Two station method; station 2 - 3 , (Figure 36).
8. Two station method; station 1-3, (Figure 36).

Figure 36 . Oxygen metabol ism measurement s tat ions.
CHAPTER VI
SUMMARY AND CONCLUSIONS
AGRICULTURAL PUMPAGE
Thirteen pump events were monitored during the Summer of 1982 for the Zigzag,
Mary A and Bulldozer Canal pumps. Background data were collected for these pumps,
in addition to the Duda and North Mormon pump sites. A very significant statistical
correlation was found between pump discharge rates and ammonia (r = .95; p<.01),
but no other relationships were found.
The GFWFC collected data on 12/7/82 at the entrance of Duda canal to the
St. Johns River when the Duda pump was operating. These data indicate the pump was
discharging high concentrations of ortho (.22 mg P/L) and total (.31 mg P/L) phos-
phorus and high levels of inorganic nitrogen particularly ammonia nitrogen (.92 mg
NH3-N/L). Hardness (275 mg/L as CaCO ) and chloride (590 mg/L) levels were also
high. The high inorganic nutrient and chloride concentrations and the close proximity
of the pump to the river indicate that this pump, which drains primarily improved
pasture, is a potentially significant pollutional source to the river.
Zigzag pump drains primarily citrus areas and has a rated capacity of 150.000 GPM.
Zigzag pump discharges were characterized by very high color (x = 300 CPU), ammonia-
nitrogen (x = .15 mg N/L) and nitrate-nitrogen (x = .64 mg N/L). Pump discharge from
this area is overloaded with nitrogen as background concentrations of these same
parameters averaged only .05 and .08 mg/L, respectively. Total phosphorus, however,
was only slightly elevated (x = .15 mg P/L) over background concentrations (x = .08
mg P/L). Discharge BOD^ for the five pump events was not high (x 2.4 mg/L) and
was similar to the upstream BOD,.. Diurnal sampling of a 6/24-6/25/82 pump event
indicated most parameter levels were fairly constant throughout the 24 hr. period.
Nitrate-nitrite nitrogen was high at the pump (x = .64 mg N/L) and remained fairly
high at downstream stations.
107
Two pumps were sampled on Bulldozer canal. Pump #1 was sampled once
(improved pasture drainage) and pump //2 was sampled 5 times (citrus drainage) .
Nutrient, BOD_ and other parameter levels from these pumps were not excessively
high and the data indicate the water quality of South Mormon Outside Canal was
worse than the Bulldozer pump discharge water. Pump #2 exhibited higher chloride,
hardness, alkalinity and suspended solids concentrations than pump //I; pump //I,
however, showed higher color, TKN, NH.-N and BOD . BOD from pump //2 was high
(4.2 mg/L), but this value was similar to recorded values in South Mormon Canal.
The Mary A pump is listed as draining improved pasture although we observed
row cropping uses (corn) during sampling trips. This pump has a high rated
capacity (120,000 GPM) and the water quality from this pump was the worst of any
pump and appears to have the greatest pollutional potential. The average TN and
TP concentrations for the three sample dates were3.96mg N/L and 0.79 mg P/L,
respectively. Mary A pumpage also exhibited very high average levels of ortho
P04(0.52 mg P/L), TKN (3.9 mg N/L), NH^-N (0.31/mg N/L) N03-N (0.48 mg N/L),
iron (1.68 mg/L), turbidity (18 NTU), BOD5 (5.5 mg/L), Hardness (223 mg/L) and
color (525 CPU). Chlorophyll a_ was very high at the pump and in the canal, reaching
concentrations of 23 and 29 mg/m on 7/22/82 and 8/12/82, respectively.
Total P and total N pump loading rates reflect discharge rates to a large
degree and they are one way of looking at the pollutional potential of the pumps.
The total N loading rates for the Mary A, Zigzag, Bulldozer //2 and Bulldozer #2
pumps were 1935, 1305, 238 and 86 Kg/day, respectively. The total P loading rates
for these same pumps were 390, 63, 12 and 7 Kg/day. These calculations show that
the pumps that drain into C-40 (Zigzag and Mary A) are the worst offenders in terms
of nutrient loading. Mary A was extremely high in both N and P. Bulldozer pump
nutrient loading rates were not exceedingly high, with pump #1 levels (improved
pasture; one sampling) exceeding nutrient loading rates from pump 7/2 (citrus) .
108

LAKE WASHINGTON INLET-OUTLET STUDIES
During the study the outlet to Lake Washington generally had higher discharge
rates and nutrient concentrations than the inlet. From August, 1980,through
September, 1982,the inlet discharge ranged from 1.7 to 1974 cfs (x = 390 cfs)
while the outlet discharge varied from 0 to 2533 cfs (x = 492 cfs). Total nitrogen
concentrations at the outlet ranged from 1.4 to 3.8 mg/L from January through
September, 1982, with a mean concentrations of 2.2 mg/L. At the inlet, total
nitrogen varied from 1.5 to 2.0 mg/L. Higher discharge at the outlet, throughout
most of the study, resulted in a slightly greater nutrient (TN + TP) export rate
from the lake than nutrient input rate. The average TN and TP loading rates to
Lake Washington were 3136 and 155 Kg/day, respectively, while the export rates
f-rom the lake for these same parameters were 4029 and 182 Kg/day. Total phosphorus
concentrations at the inlet and outlet were similar, ranging from 0.03 to 0.14 mg/L.
The only parameter that exhibited a slight net input into Lake Washington, in spite
of the greater outlet discharge, was suspended solids. Based on seventeen sampling
days exhibiting different flox^ regimes, inlet and outlet loading rates were 3500
and 3450 Kg/day, respectively. The suspended solids averages were 2.6 and 2.2 mg/L
for the inlet and outlet, respectively. Core data from the transverse profile
indicate that the depth of organic matter has increased in Lake Washington since
1971, more than in the other lakes. Other lakes in the chain showed a slight
increase in organic matter, except for Lake Sawgrass which had an organic layer
depth profile similar to the 1971 profile and Lake Hellen Blazes which had less
surface organic matter than the 1971 cores indicate.
UPPER ST. JOHNS RIVER CANALS
Discharge south of Lake Hellen Blazes was dominated by South Mormon Outside
Canal (SMOC). At low stage heights, Three Forks was the strongest flowing tributary,
109

although the discharge only reached a maxium level of 107 cfs. As the stage
height rose (>15 ft msl), Three Forks stopped flowing altogether and the discharge
in SMOC began rising dramatically, reaching a maximum value of 538 cfs in August,
1982. Bulldozer Canal showed a negligible flow at low stage heights (<15 ft. msl),
and actually flowed west at high stage levels as a large percentage of the South
Mormon Outside Canal discharge entered Bulldozer Canal before entering the marsh
to the north of the canal.
As would be expected from the above discharge patterns, SMOC dominated nutrient
and suspended solids loading. SMOC had total nitrogen concentrations ranging from
1.2 to 3.4 mg/L. Nitrate-nitrite nitrogen and Total P levels were higher than
those recorded in Lake Washington. SMOC total N loading varied from 0 to 2950
Kg/day, while total P loading ranged from 0 to 302 Kg/day. These loading rates
are less than at Lake Washington due to the lower discharge. The only significant
correlations in these canals were between discharge and ammonia (r = .68; P<.01) and
discharge vs. conductivity (r = -.32; P<.05). Generally, suspended solids concen-
trations increased with increasing discharge, although statistical correlation
these two parameters was poor. South Mormon Outside Canal suspended solids concentra-
tions varied from 1.9 to 26.2 mg/L. The SMOC canal suspended solids concentrations
were generally less than those recorded downstream at Lake Washington as some solids
settle out enroute.
DIURNAL OXYGEN STUDIES
Sixteen diurnal oxygen curves (percent saturation) were constructed from 24 hours
diurnal oxygen measurements made at the entrance to Lake Washington at U.S. 192. These
data show very little fluctuation of oxygen in the system. Color, total iron, ferrous
iron, and solar radiation data were collected during the diurnal sampling and it was
found that low percent saturation curves correlate positively with high color and
110

high iron values. Studies are continuing to investigate the operation of a
ferrous-ferric catalytic cycle, described by Miles and Brezonik (1982), in the
upper St. Johns River system. Community production rates, calculated from diurnal
and field data, were consistently low at the sampling stations.
Ill

SEDIMENTATION STUDIES
Core data indicate all upper St. Johns lakes have a layer of fine organic
matter on the sediment surface, underlain by various layers of sand and clay.
The southern lakes of the chain, Lakes Sawgrass and Hellen Blazes, had more
fibrous or woody organic matter beneath the fine surface layer than the other
lakes and this may reflect a greater degree of waterhyacinth decomposition and
sedimentation in these lakes than in other upper basin lakes. However, organic•
layer depths in Lakes Hellen Blazes and Sawgrass were similar or less,than found
in a 1971 core survey by the GFWFC, indicating periodic high discharge rates since
that time have carried much organic bottom debris downstream. Based on seventeen
longitudinal and transverse cores taken in each lake (1982) , there was a progressive
decrease in the depth of organic matter present in the lakes as they progress north-
ward from Lake Hellen Blazes (with the exception of Lake Poinsett). Lakes Hellen
Blazes, Sawgrass, Washington, Winder and Poinsett exhibited average organic matter
depths of 13.8,9.7, 9.5, 3.4 and 5.4 inches, respectively. Blue Cypress Lake, the
deepest of all the lakes, had the greatest depth of organic matter found, averaging
17.7 inches for the seventeen longitudinal and transverse cores. Also, more peat
was encountered in Blue Cypress lake than any of the other lakes.
Our studies indicate, although more data should continue to be collected,
that sedimentation in the upper St. Johns Chain of lakes is not extremely high,
on an annual basis. If we can assume our coring sites are duplications of the 1971
GFWFC coring sites, data indicate average accumulations of 4.5 to 7 inches of organic
matter in Lakes Washington, Winder, and Poinsett since 1971. This translates to a
sedimentation rate of approximately 0.5 inches/yr. Calculations based on recent
waterhyacinth studies indicate that natural sedimentation beneath hyacinth stands
would only be approximately .12 in/yr. The sedimentaion from hyacinths is great
when these plants are chemically sprayed, as then more dead aerial and root tissue
reach the sediment.
112
LITERATURE REVIEW
Baker, J.A., L.A. Pugh III, and K.T. Kimball. 1977. A simple hand corer
for shallow water sampling. Chesapeake Science. 18(2)232-236.
CH2M Hill, Inc. 1979. Assessment of Water Quality. Report for Deseret
Ranees of Florida, Inc. Gainesville, Florida 32601.
Cox, D.T., E.D. Vosatka, H.L. Moody, and L. Hartzog. 1976. D-J. F-25
Stream investigations completion report: Upper St. Johns River Study.
Florida Game and Fresh Water Fish Commission, Tallahassee, Fl. 859 p.
Debusk, T.A. 1983. Standing crop changes, detritus production and decomposi-
tion of Eichhornia crassipes (Mart.) Solms. M.S. Thesis. Florida
Institute of Technology. Melbourne, 92 pp.
Dillon, P.J. and F.H. Rigler, 1974. The phosphorus-chlorophyll relationship
in lakes. Limnol. Oceanogr. 19:767-773.
Karcher, F.H. 1939. Untersuchungen uber den Stickstoffhaushalt in ostprev
ssischen Waldseen. Arch. Hydrobiol. 35:177-266.
Mason, D . R . , and T .V. Belanger. 1979. Lake Washington project final report,
Florida Institute of Technology, Melbourne, FL. 421 pp.
Miles, C.J . and P .L . Brezonik. 1981. Oxygen consumption in hutnic colored
water by a photochemical ferrous-ferric catalytic cycle. Environ. Sci.
Technol. 15:1089-1095.
Mitsch, W.J . 1977. Waterhyacinth (Eichhornia crassipes) nutrient uptake and
metabolism in a north central Florida marsh. Arch. Hydrobiol. 81:188-210.
Nygaard, G. 1938. Hydrobiologische studien uber clanische Teiche and Seen. 1.
Teil: Chemisch-Physikalische Untersuchungen and Planktoawagungen. Arch.
Hydrobiol. 32:523-692.
113
Pieterse, A.H. 1978. The waterhyacinth (Eichhornia crassipes) - a review.
Abstr. Trop. Agric. 4:9-42.
St. Johns River Water Management District. 1979. Upper St. Johns River Basin
Surface Water Management Plan. Phase I Report. Volume I.
Tucker, C.S. 1981a. The effect of ionic form and level of nitrogen on the
growth and composition of Eichhornia crassipes (Mart.) Solms. Hydrobiol.
83:517-522.
Tucker, C.S. and T.A. Debusk. 1981. Seasonal growth of Eichhornia crassipes
(Mart.) Solmes: relationship to protein, fiber and available carbohydrate
content. Aquat. Bot. 11:137-141.
U.S. Fish and Wildlife Service. 1951. Basic material for the preparation of
reports on the effects of fish and wildlife resources of water-development
projects in the upper St. Johns River, Florida. Atlanta.
Vega, A. 1978. Effects of different control practices for waterhyacinth
(Eichhornia crassipes (Mart.) Solms) at Lake Alice, Florida. M.S. Thesis.
Univ. of Florida, Gainesville, 144 pp.
Wetzel, R.G. 1975. Limnology. W.B. Saunders Company. Philadelphia. 742 pp.
114
IIIIIIII
IIIIIIIII1
APPENDICES

IIIIIIIIIIIIIIIIIII
APPENDIX A
SAMPLING DATES AND FIELD DATA
1981 - 82
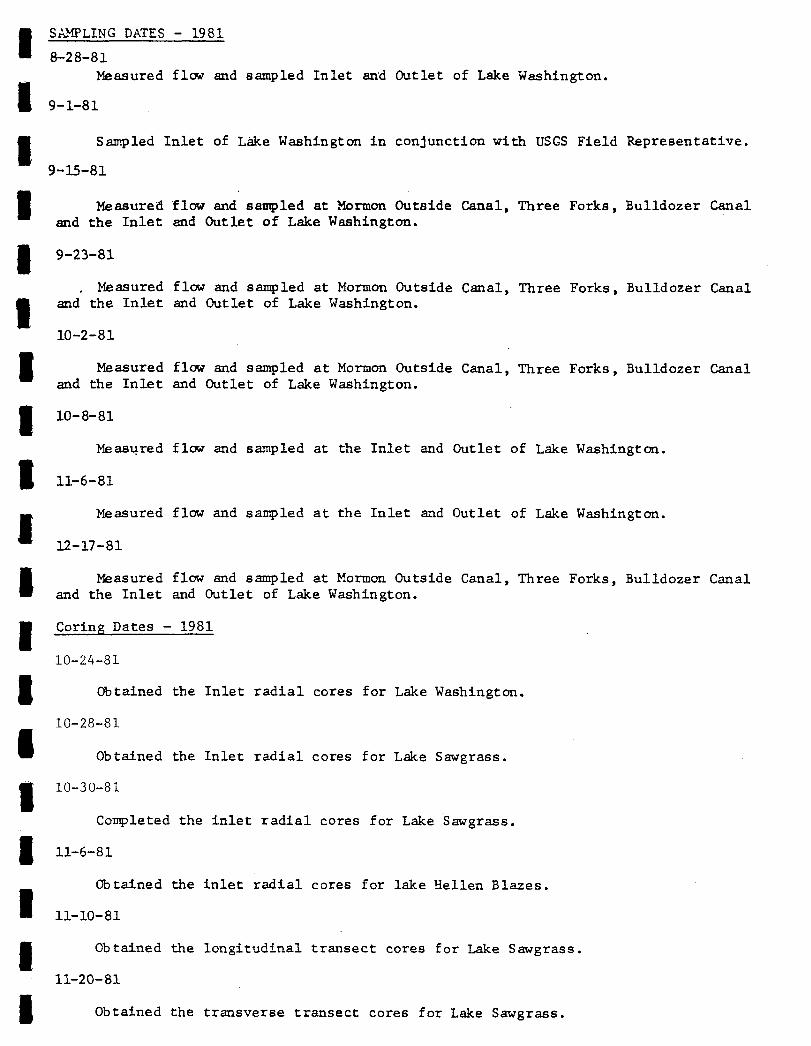
ISAMPLING DATES - 1981
8-28-81Measured flew and sampled Inlet and Outlet of Lake Washington.
I
9-1-81
Sampled Inlet of Lake Washington in conjunction with USGS Field Representative.
9-15-81
• Measured flow and sampled at Mormon Outside Canal, Three Forks, Bulldozer Canaland the Inlet and Outlet of Lake Washington.
1 9-23-81
. Measured flow and sampled at Mormon Outside Canal, Three Forks, Bulldozer Canal<• and the Inlet and Outlet of Lake Washington.
10-2-81
• Measured flow and sampled at Mormon Outside Canal, Three Forks, Bulldozer Canaland the Inlet and Outlet of Lake Washington.
• 10-8-81
Measured flow and sampled at the Inlet and Outlet of Lake Washington.
11-6-81
Measured flow and sampled at the Inlet and Outlet of Lake Washington.
12-17-81
•Measured flow and sampled at Mormon Outside Canal, Three Forks, Bulldozer Canal
and the Inlet and Outlet of Lake Washineton.
I
and the Inlet and Outlet of Lake Washington.
Coring Dates - 1981
10-24-81
I Obtained the Inlet radial cores for Lake Washington.
10-28-81
™ Obtained the Inlet radial cores for Lake Sawgrass.
m 10-30-81
Completed the inlet radial cores for Lake Sawgrass.
11-6-81
Obtained the inlet radial cores for lake Hellen Blazes.
11-10-81
• Obtained the longitudinal transect cores for Lake Sawgrass.
11-20-81
• Obtained the transverse transect cores for Lake Sawgrass.
•

IISAMPLING DATES - 1982
1-20-82
• Sampled and measured flow at 3 Forks, Mormon Outside Canal, Bulldozer Canal,Lake Washington Inlet and Lake Washington Outlet.
2-22-82
Sampled and measured flow at 3 Forks, Mormon Outside Canal and Bulldozer Canal.
| 2-24-82
_ Sampled and measured flow at Lake Washington inlet and outlet.
3-10-82
•Sampled and measured flow at 3 Forks, Mormon Outside Canal and Bulldozer Canal.
Checked pumps on Bulldozer Canal. (Not pumping) .
ft 3-12-82
Sampled and measured flow at Lake Washington inlet and outlet.
^
3-19-82
Checked pumps on Zig Zag canal. (Not pumping).
3-30-82
Jfe Sampled and measured flow at Lake Washington inlet and outlet.
3-31-82
• Sampled and measured flow at 3 Forks, Mormon Outside Canal and Bulldozer Canal.Checked pumps on Bulldozer Canal. (Not pumping).
B 4-22-82
Sampled and measured flow at 3 Forks, Mormon Outside Canal, Bulldozer Canal,Washingtc
(Not pumping).
4-27-82
fl Lake Washington Inlet and Lake Washington Outlet. Checked pumps on Bulldozer Canal.
Sampled pumps on Zig Zag Canal for background data.
5-5-82
Sampled pumps on Zig Zag Canal. Pumps reported running this morning, however,Wt the pumps were not running when we arrived.
5-13-82
g Checked pumps on Zig Zag Canal. Not on. Sampled and measured flow at 3 Forks,Mormon outside Canal, Bulldozer Canal, Lake Washington Inlet and Lake Washington Outlet.

IISAMPLING DATES - 1982
1-20-82
• Sampled and measured flow at 3 Forks, Mormon Outside Canal, Bulldozer Canal,Lake Washington Inlet and Lake Washington Outlet.
• 2-22-82
Sampled and measured flow at 3 Forks, Mormon Outside Canal and Bulldozer Canal.
2-24-82
Sampled and measured flow at Lake Washington inlet and outlet.
3-10-82
I Sampled and measured flow at 3 Forks, Mormon Outside Canal and Bulldozer Canal.Checked pumps on Bulldozer Canal. (Not pumping).
m 3-12-82
Sampled and measured flow at Lake Washington inlet and outlet.
3-19-82
Checked pumps on Zig Zag canal. (Not pumping).
3-30-82
Sampled and measured flow at Lake Washington inlet and outlet.
3-31-82
• Sampled and measured flow at 3 Forks, Mormon Outside Canal and Bulldozer Canal.Checked pumps on Bulldozer Canal. (Not pumping).
I
1
ft 4-22-82
Sampled and measured flow at 3 Forks, Mormon Outside Canal, Bulldozer Canal,Washingto
(Not pumping).
4-27-82
!• Lake Washington Inlet and Lake Washington Outlet. Checked pumps on Bulldozer Canal.
1Sampled pumps on Zig Zag Canal for background data.
I 5-5-82
Sampled pumps on Zig Zag Canal. Pumps reported running this morning, however,B the pumps were not running when we arrived.
5-13-82
g Checked pumps on Zig Zag Canal. Not on. Sampled and measured flow at 3 Forks,Mormon outside Canal, Bulldozer Canal, Lake Washington Inlet and Lake Washington Outlet.
I
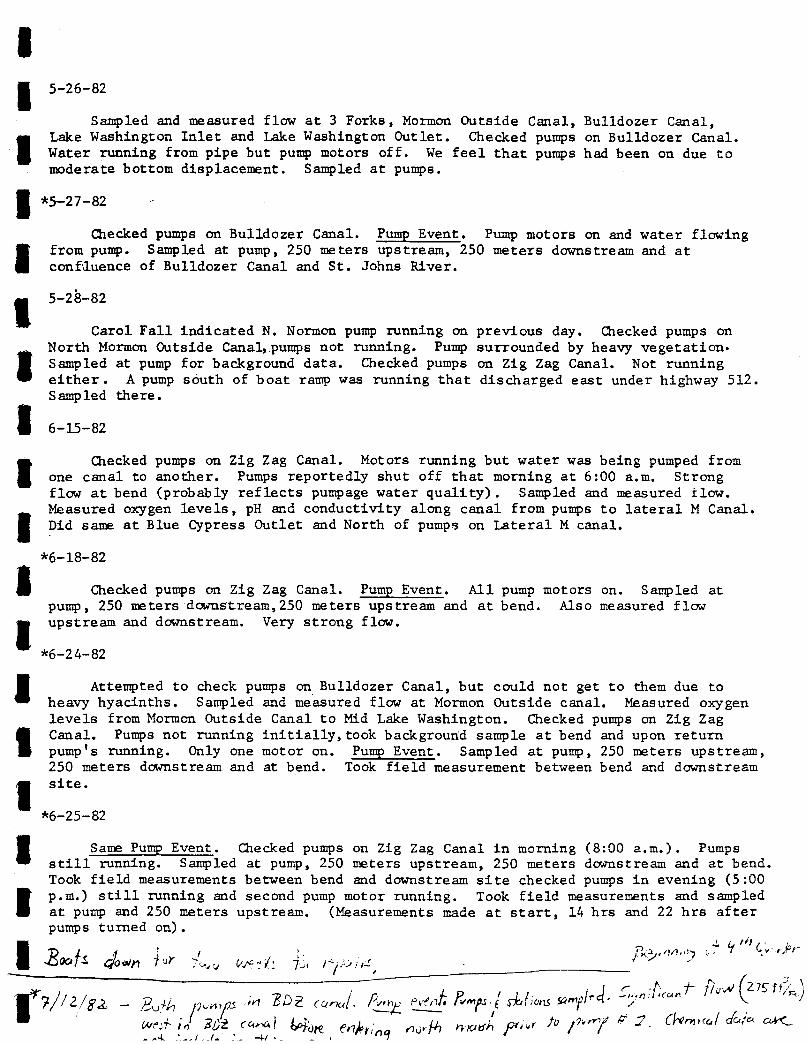
II
I
1III1I
I
5-26-82
Sampled and measured flow at 3 Forks, Mormon Outside Canal, Bulldozer Canal,Lake Washington Inlet and Lake Washington Outlet. Checked pumps on Bulldozer Canal.Water running from pipe but pump motors off. We feel that pumps had been on due tomoderate bottom displacement. Sampled at pumps.
*5-27-82
Checked pumps on Bulldozer Canal. Pump Event. Pump motors on and water flowingfrom pump. Sampled at pump, 250 meters upstream, 250 meters downstream and atconfluence of Bulldozer Canal and St. Johns River.
5-28-82
Carol Fall indicated N. Normon pump running on previous day. Checked pumps onNorth Mormon Outside Canal,.pumps not running. Pump surrounded by heavy vegetation-Sampled at pump for background data. Checked pumps on Zig Zag Canal. Not runningeither. A pump south of boat ramp was running that discharged east under highway 512.Sampled there.
6-15-82
Checked pumps on Zig Zag Canal. Motors running but water was being pumped fromone canal to another. Pumps reportedly shut off that morning at 6:00 a.m. Strongflow at bend (probably reflects pumpage water quality). Sampled and measured flow.Measured oxygen levels, pH and conductivity along canal from pumps to lateral M Canal.Did same at Blue Cypress Outlet and North of pumps on Lateral M canal.
*6-18-82
Checked pumps on Zig Zag Canal. Pump Event. All pump motors on. Sampled atpump, 250 meters downstream,250 meters upstream and at bend. Also measured flowupstream and downstream. Very strong flow.
*6-24-82
Attempted to check pumps on Bulldozer Canal, but could not get to them due toheavy hyacinths. Sampled and measured flow at Mormon Outside canal. Measured oxygenlevels from Mormon Outside Canal to Mid Lake Washington. Checked pumps on Zig ZagCanal. Pumps not running initially,took background sample at bend and upon returnpump's running. Only one motor on. Pump Event. Sampled at pump, 250 meters upstream,250 meters downstream and at bend. Took field measurement between bend and downstreamsite.
*6-25-82
Same Pump Event. Checked pumps on Zig Zag Canal in morning (8:00 a.m.). Pumpsstill running. Sampled at pump, 250 meters upstream, 250 meters downstream and at bend.Took field measurements between bend and downstream site checked pumps in evening (5:00p.m.) still running and second pump motor running. Took field measurements and sampledat pump and 250 meters upstream. (Measurements made at start, 14 hrs and 22 hrs afterpumps turned on).

II
1 f I ' L*7 t< «..»•>?, -
Sampling Dates - 1982
I
I
I
7-19-82
Sampled and measured flow at Lake Washington inlet and outlet.
7-20-82
Checked Bulldozer pumps. Pump Event - Pump //2 running. Sampled at pump,250 meters downstream and upstream. The mouth of Bulldozer Canal and South MormonOutside Canal. Strong odor from pump water at pump.
7-22-82
Checked Mary A pump. Pump Event - Two out of three motors running. Canalheavily choked with hyacinths. Sampled at pump, 250 meters upstream and downstream,at the confluence of canal and river, and also a background from Triangle Canal.Strong flow here due to flood gates being open on Fellsmere Grade. Water at pump verydirty with corn cobs floating by.
8-2-82
Sampled and measured flow at South Mormon Outside Canal and Bulldozer Canal.
8-3-82
Checked Bulldozer pumps. Pump Event - Sampled pump #1. 250 meters upstream and250 meters downstream.
8-4-82
Sampled and measured flow at Lake Washington inlet and outlet.
8-12-82
Checked Mary A pump. Pump Event - All pumps running strongly. Sampled pumpflow - seemed to move across flood platn to far canal. Pump canal closed up to 50meters on either side with hyacinths. Sampled far canal upstream and downstream ofcanal. Confluence with marsh. Sampled at points P, A, C, F, & D.
8-13-82
Checked pumps at ZigZag Canal. Not running.
8-16-82
Checked pumps at ZigZag. Pump Event - Sampled at pump, 250 meters upstream anddownstream and at bend. Only one pump running. Sampled at points 6, 5, 3, 1 and 0.
8-26-82
Sampled and measured flow at Lake Washington outlet and inlet.
I
1
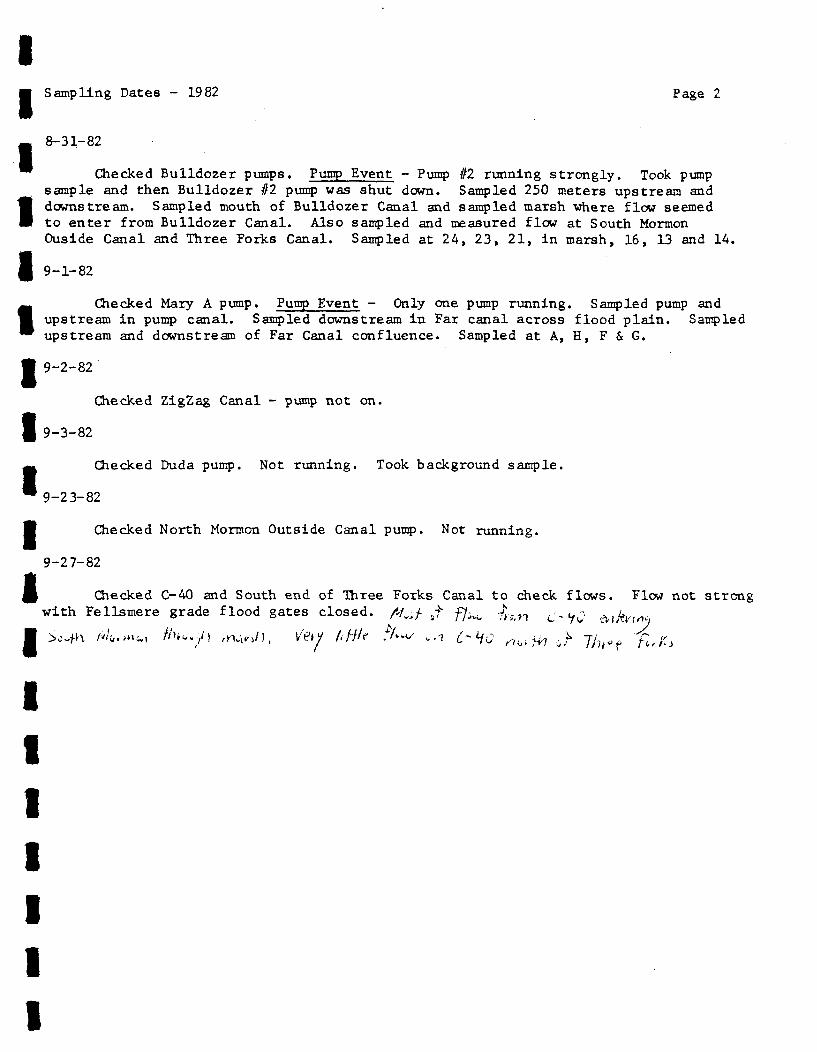
IISampling Dates - 1982 Page 2
8-31-82
Checked Bulldozer pumps. Pump Event - Pump #2 running strongly. Took pumpsample and then Bulldozer #2 pump was shut down. Sampled 250 meters upstream and
f downstream. Sampled mouth of Bulldozer Canal and sampled marsh where flow seemedto enter from Bulldozer Canal. Also sampled and measured flow at South MormonOuside Canal and Three Forks Canal. Sampled at 24, 23, 21, in marsh, 16, 13 and 14.
I
I
I1I1I1II1I
9-1-82
Checked Mary A pump. Pump Event - Only one pump running. Sampled pump andupstream in pump canal. Sampled downstream in Far canal across flood plain. Sampledupstream and downstream of Far Canal confluence. Sampled at A, H, F & G.
9-2-82
Checked ZigZag Canal - pump not on.
9-3-82
Checked Duda pump. Not running. Took background sample.
9-23-82
Checked North Mormon Outside Canal pump. Not running.
9-27-82
Checked C-40 and South end of Three Forks Canal to check flows. Flow not strongwith Fellsmere grade flood gates closed. /<,/. ef- f/^ £,.^ (-.,l^. j v | ,

III1II1IIIII11IIIII
FIELD DATA
KEY
All data refers to number station locations described here and shown in Fig. 1.
No. Description
0 - 250 m upstream of Zig Zag Canal pump
-1 - At pump
2 - 250 m downstream of pump
3 - 500 m downstream of pump
4 - 1000 m downstream of pump
5 ' - 1500 m downstream of pump
6 - approx. 2000 m downstream, at bend of canal
7 - north of bend at stage gage
8 - 400 in past pump on north-south canal
9 - at bend where canal turns west
10 - 20 m east of north-south lateral M canal
11 - 200 m north of Blue Cypress Lake on lateral M canal
12 - 200 m north of pump, midway on lateral M canal
13 - Mormon Outside Canal, 200 m south of Three Forks confluence
14 - In Three Forks, 30 m upstream of confluence with Mormon Canal
15 - At confluence of Bulldozer Canal and Mormon Canal
16 - In Bulldozer Canal, 30 m upstream of mouth
17 - 1/3 distance between Bulldozer Canal mouth and 1st pump
18 - 2/3 distance between Bulldozer Canal mouth and 1st pump
19 - At pump
20 - 500 m downstream of second pump
21 - 250 m downstream of second pump
22 - At pump
23 - 250 m upstream (west) of pump in Bulldozer Canal
24 - 250 m upstream of pump on lateral canal ,
25 - In Mormon Canal midway between Bulldozer Canal and Lake Hellen Blazes
26 - Middle of Lake Hellen Blazes
27 - Midway between Lake Hellen Blazes and Lake Sawgrass
28 - Middle of Lake Sawgrass
29 - Near Camp Holly at U.S. 192
30 - 400 m north of U.S. 192
31 - Lake Washington inlet
32 - Middle of Lake Washington
33 - At weir at north end of Lake Washington
34 - At North Mormon Outside Canal pump

I
I
I
I
I
1
1I
FIELD DATA5-5-82
Station Depth Time Discharge D. 0<_._ T_ Cond. _p_H S.D.
0 6.5 11:00 am none
- 1 7.0 2:50 pm S 5.5 25.0 920 7.15 5.51m 3.6 23.62 m 2 . 7 23.3
6 12.2 ft 3:40 pm S 4.0 24.4 925 6.7 6.0Im3.8 24.32m3.8 24.3
32 6.7 5.5 ft /sec
Comments: High east wind, slow surface flow to west. Measurements indicatethat when pomps not on there is normally no flow in Zig Zag Canal, ora small wind induced or seepage flow of around 5 ft/sec. Substantiatedby later data. Carol Fall indicated pumps running on previous day. Notrunning on this date.
5-28-82
29 2:30 pm S 4.4 27.2 -Im4.0 26.6 -
34 8.5 ft 11:45 am AS2.1 25.0 490 3.0 ft
1ml.9 24.3 4902m 1.7 23.7 490
4-27-82 - Background
1 8.7 ft 11:00 am * s5.6 24.5 850 7.1 4.0Im6.2 23.5 8502m 6.1 23.1 850
No upstream or downstream flow
ANorth Mormon pump not on.
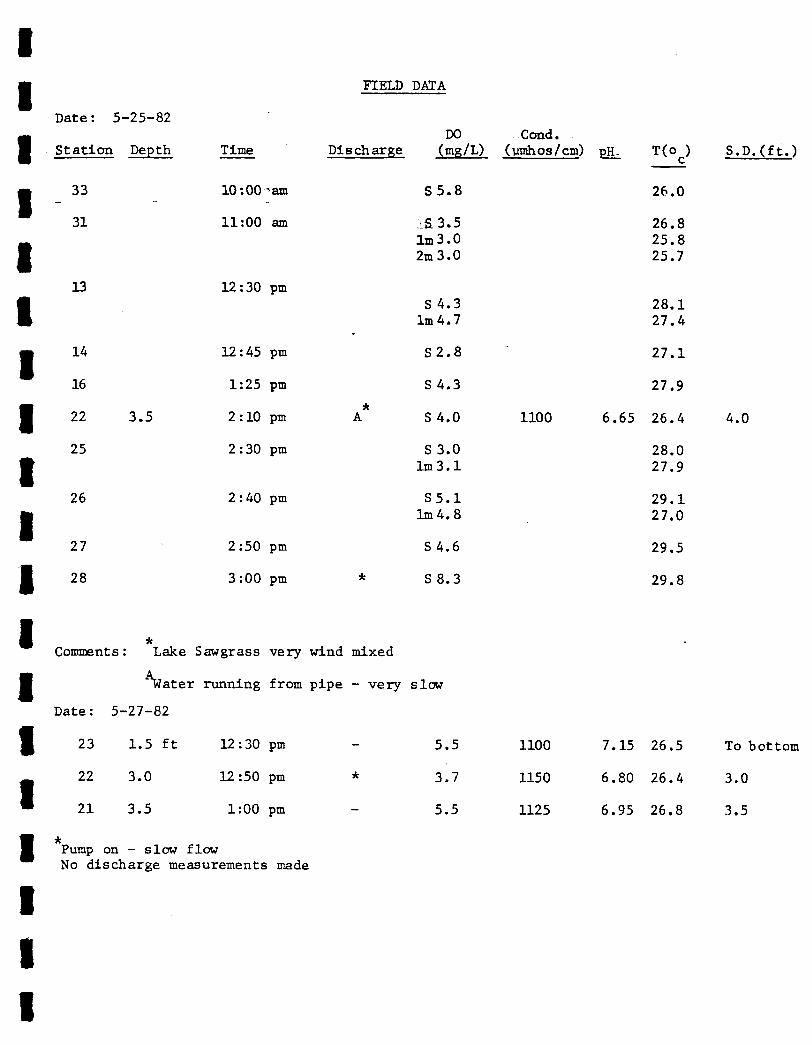
11
19^m
1
I
1
t
1
1
IV
1
1
IW
1
1
1
FIELD
Date: 5-25-82
Station Depth Time Discharge
33 10:00iam
31 11:00 am
13 12:30 pm
14 12:45 pm
16 1:25 pm
22 3.5 2:10 pm A*
25 2:30 pm
26 2:40 pm
27 2:50 pm
28 3:00 pm *
*Comments: Lake Sawgrass very wind mixed
water running from pipe - very
Date: 5-27-82
23 1.5 ft 12:30 pm
22 3.0 12:50 pm *
21 3.5 1:00 pm
Pump on - slow flowNo discharge measurements made
DATA
DO(mg/L)
S5.8
IS 3. 51m 3.02m3.0
S 4.31m 4. 7
S2.8
S 4.3
S 4.0
S 3.0Im3.1
S5.11m 4. 8
S4.6
S8.3
slow
5.5
3.7
5.5
Cond.(ymhos/cm) pH. T(o )— c
26.0
26.825.825.7
28.127.4
27.1
27.9
1100 6.65 26.4
28.027.9
29.127.0
29.5
29.8
1100 7.15 26.5
1150 6.80 26.4
1125 6.95 26.8
S.D. ( f t . )
4.0
To bottom
3.0
3.5
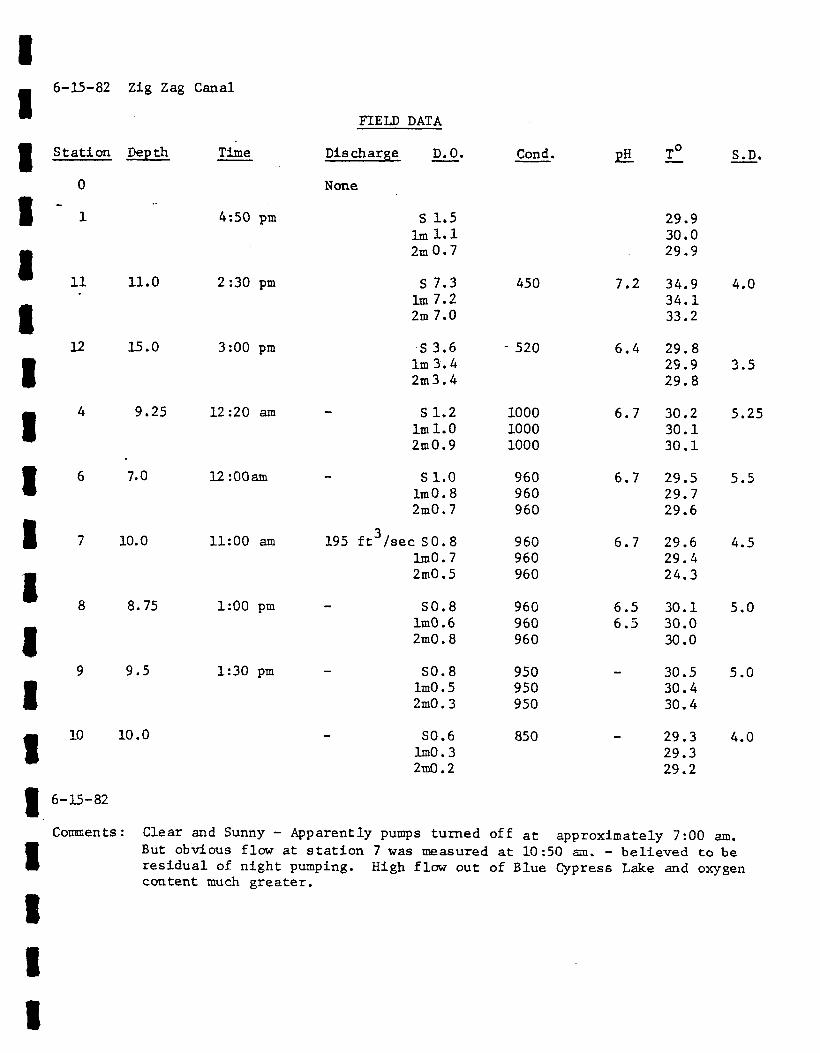
III
I
II
I1I
I
6-15-82 Zig Zag Canal
Station Depth
0
1
11
12
11.0
15.0
9.25
7.0
10.0
8.75
9.5
10
6-15-82
Comments
10.0
FIELD DATA
Time
4:50 pm
2 :30 pm
3:00 pm
12:20 am
12:00am
11:00 am
1:00 pm
1:30 pm
Discharge D.O.
None
S 1.51m 1.12m 0.7
S 7.31m 7. 22m 7.0
S 3.61m 3. 42m3.4
S 1.21m 1.02m0.9
Sl.OlmO.82m0.7
195 ft3/sec SO. 8Im0.72m0.5
SO. 8Im0.62m0.8
SO. 8Im0.52m0.3
SO. 6Im0.32m0.2
Cond,
450
- 520
100010001000
960960960
960960960
960960960
950950950
850
pH T° S.D.
29.930.029.9
7.2 34.9 4.034.133.2
6.4 29.829.9 3.529.8
6.7 30.2 5.2530.130.1
6.7 29.5 5.529.729.6
6.7 29.6 4.529.424.3
6.5 30.1 5.06.5 30.0
30.0
30.5 5.030.430.4
29.3 4.029.329.2
Clear and Sunny - Apparently pumps turned off at approximately 7:00 am.But obvious flow at station 7 was measured at 10:50 am. - believed to beresidual of night pumping. High flow out of Blue Cypress Lake and oxygencontent much greater.
I
I

16-18-82
1Location: Zig Zag Canal
1 Station Time Depth
_ 0 4:15 pm 6.5 ft^M — -
•
1 1 4:00 pm 7.6
.
1 2 3:45 pm 7.5
7 2:44 pm 11.0
1
1 Comments : All three pumpsDischarge 282 ftaround the bend
m Station Time Depth
( Bulldozer16 10:30 am 6.4 ft
• {200 m west of mouth)
South Mormon• 13 11:OQ :am 7.2 ft
25 12:30 pm
26 12:45 pm
• 27 1:00 pm
1 29 1:15 pm
32 1:30 pm
• Comments: Bulldozer Choked
FIELD DATA - Pump Event
Discharge D.O. Cond.
None S 3.9 625Im3.6 6252m0.5 625
S4 .6 575Im4.4 5752m 4. 4 575
S4.1 485Im3.9 5852m 3.0 585
282 ft3/sec S3. 5 6601M3.3 6602m3.2 6603m3.1 660
pH T° S.D.
7.1 26.5 2 ft26.426.2
7.2 26.7 2.526.726.7
7.3 26.5 2.026.526.6
7.2 26.2 3.526.226.126.0
on. Very strong wind from southwest, partly cloudy,-'/sec or 126,500 gal/min. Discharge measurement madeat staff gage.
DO Cond.Discharge (mg/L) (pmhol/cm)
130 ft3 /sec 0.4 mg/L 500/ i«es4-) (surf)
0.2 mg/L 500(1m)
203 ft3/sec 0.4 S(_•»«*») 0.1 2m
0.3 S0.2 1m
0.3 S0.2 1m
0.4 S0.2 1m
0.5 S0.3 1m0.2 2m
0.5 S0.3 1m
with hyacinths. Visable flow west -
T
28.5
28.5
29.127.229.829.3
29.829.3
28.928.7
28.628.628.6
29.329.1
strong.Three Forks choked with hyacinths and no flow.
§ South Mormon Outside showed very strong northward flewturbid clouds of water. Very Silty. 203 ft3/s - 130"1
with frequentft3/s - 73 ft3/sec
Flowing north of entrance to Bulldozer Canal. More than % of South Mormoni _ » _ i j • _,.... - - "
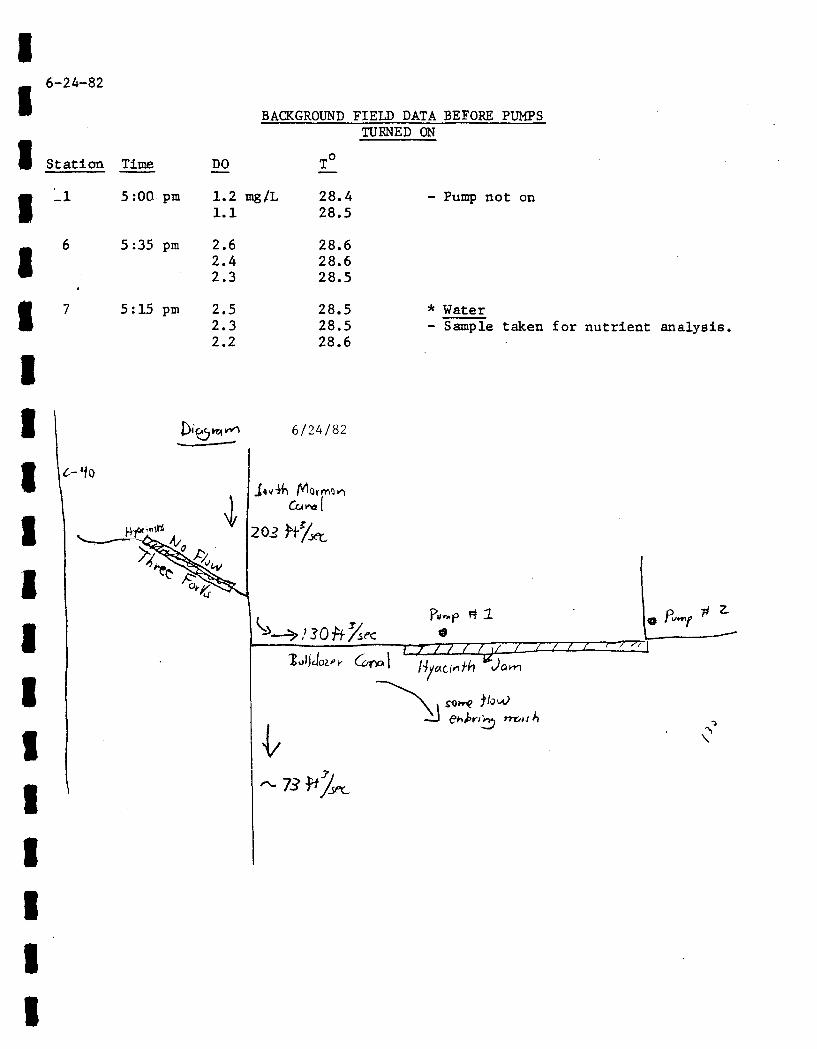
16-24-82
• Station Time
• _1 5:00-pm
— 6 5:35 pm
it 7 5:15 pm
1
1
I
1
I
1
1
I
I
<
£-4o
f4yOC'«ltf
^
1
1
1
1
BACKGROUND FIELD DATA BEFORE PUMPSTURNED ON
DO
1.2 mg/L1.1
2.62.42.3
2.52.32.2
202
28.428.5
28.628.628.5
28,28,28.6
6/24/82
- Pump not on
* Water- Sample taken for nutrient analysis,
T* 2.
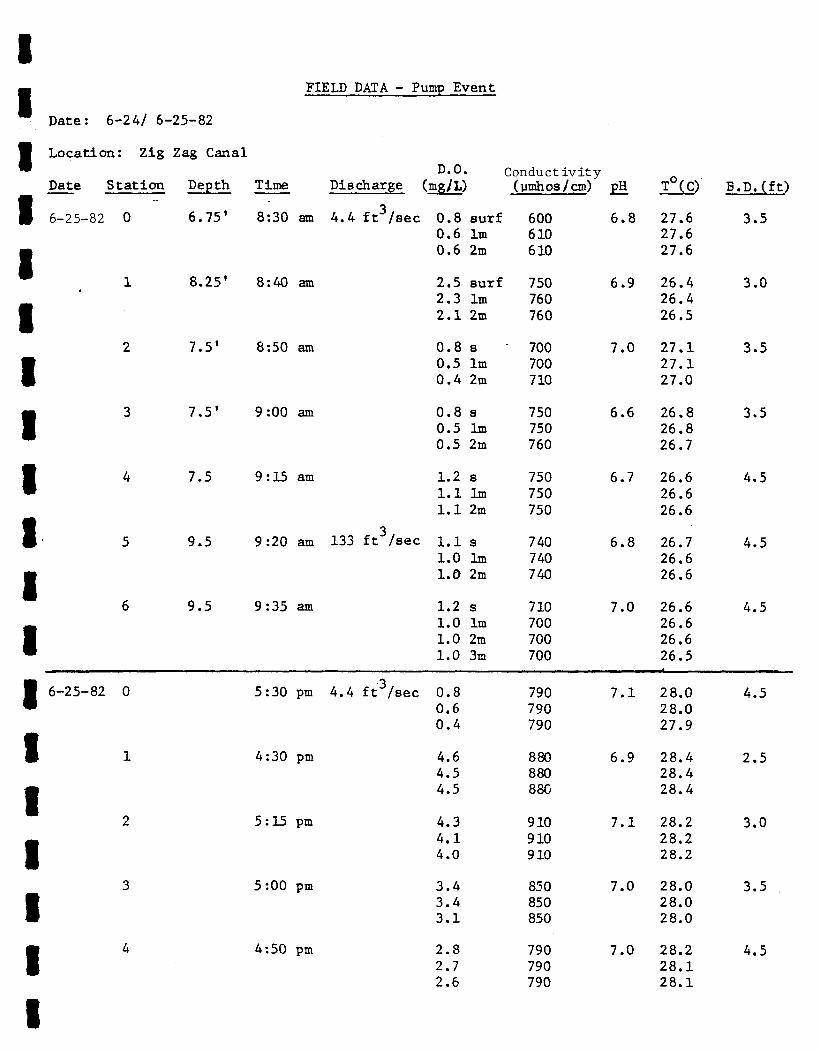
1m FIELD DATA - Pump Event1
Date: 6-24/ 6-25-82
• Location: Zig Zag Canal
Date Station Depth Time
B 6-25-82 0 6.75' 8:30 am
•* 1 8.25' 8:40 am
12 7.5' 8:50 am
Ig 3 7.5' 9:00 am
V 4 7.5 9:15 am
| 5 9.5 9:20 am
16 9.5 9:35 am
1 6-25-82 0 5:30 pm
I 1 4:30 pm
12 5:15 pm
3 5:00 pm
1• 4 4:50 pm
1
D.O.Discharge (mg/L)
4.4 ft3/sec 0.8 surf0.6 1m0.6 2m
2.5 surf2.3 1m2.1 2m
0.8 s0.5 1m0.4 2m
0.8 s0.5 1m0.5 2m
1.2 s1.1 1m1.1 2m
133 ft3/sec 1.1 s1.0 1m1.0 2m
1.2 s1.0 1m1.0 2m1.0 3m
4.4 ft3/sec 0.80.60.4
4.64.54.5
4.34.14.0
3.43.43.1
2.82.72.6
Conductivity(ymhos/cm) pH
600 6.8610610
750 6.9760760
700 7.0700710
750 6.6750760
750 6.7750750
740 6.8740740
710 7.0700700700
790 7.1790790
880 6.9880880
910 7.1910910
850 7.0850850
790 7.0790790
T°(C)
27.627.627.6
26.426.426.5
27.127.127.0
26.826.826.7
26.626.626.6
26.726.626.6
26.626.626.626.5
28.028.027.9
28.428.428.4
28.228.228.2
28.028.028.0
28.228.128.1
B.D.(f t )
3.5
3.0
3.5
3.5
4.5
4.5
4.5
4.5
2.5
3.0
3.5
4.5
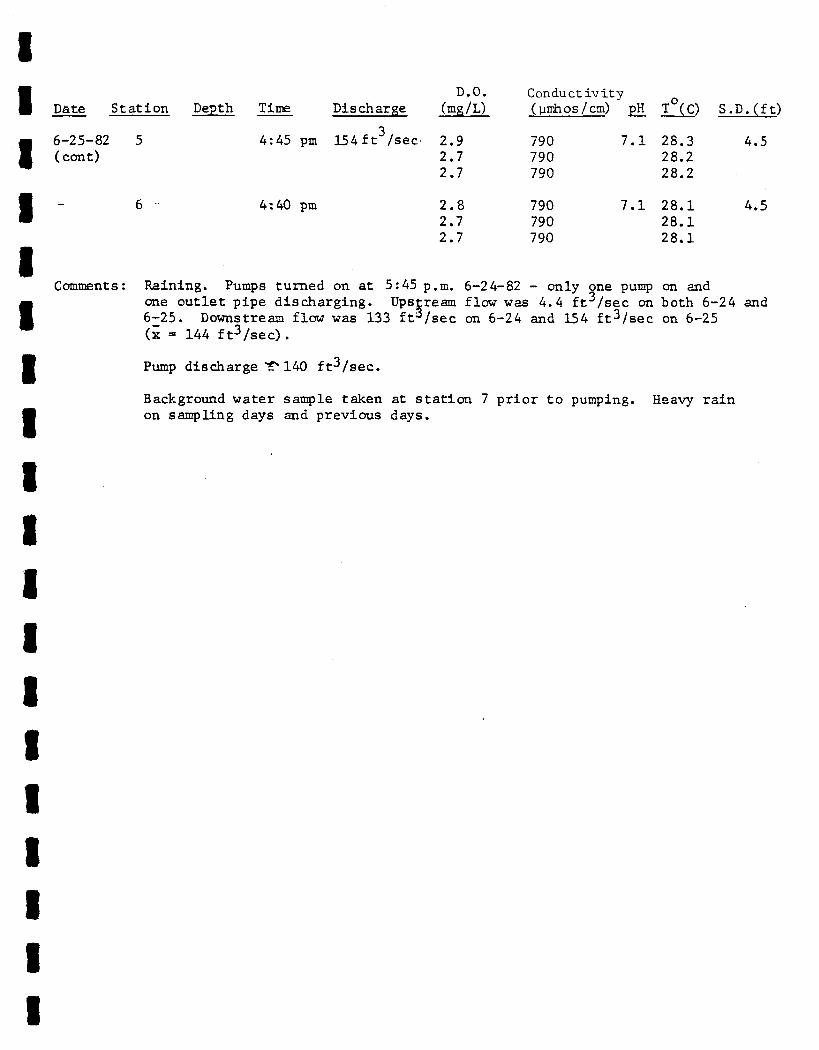
I
III
IIIIIIIIIIIII
D.O. ConductivityDate Station Depth Time Discharge (mg/L) (yimhos/cm) pH T (C) S . D . ( f t )
6-25-82 5 4:45 pm 154ft3/sec 2.9 790 7.1 28.3 4.5(cont) 2.7 790 28.2
2.7 790 28.2
6 4:40 pm 2.8 790 7.1 28.1 4.52.7 790 28.12.7 790 28.1
Comments: Raining. Pumps turned on at 5:45 p.m. 6-24-82 - only one pump on and
I one outlet pipe discharging. Upstream flow was 4.4 ft /sec on both 6-24 and6-25. Downstream flow was 133 ft^/sec on 6-24 and 154 ft3/sec on 6-25(x - 144 ft3/sec) .
Pump discharge " 140 ft3/sec.
Background water sample taken at station 7 prior to pumping. Heavy rainon sampling days and previous days.

IIIIIIIIIIIIIIIIIII
Location: Bulldozer Canal (BDZ)
Date: 7/12/82
Depth Discharge -QQ Cond.Station ft Time f t / s e c C m g / L ) (pmhos/cm) pH T
24 6.4 4 :00 P . M . none 0
0
0
22 9.0 4 :25 — 1
1
21 6.0 4:40 10 f t 3 /sec East 1
0
19 5.5 5 :C5 P . M . 4
4
IS 3.5 4 :50 P . M . 4
17 6.5 5 :20 0
0
16 6.6 6:00 P .M. 275 f t 3 / s ecWes t 0
0
13 6.5 6:30 P .M. Flow meter broke 0
High flow 0
.9
. 7
.4
.4
.1
f 2
.9
_ 2
.0
_ 3
.7
.5
.4
.2
.7
.3
S 290
1m
2m
S 650
icT
• S 600
1m
S 290
1m
S 290
S 440
1m
S 450
1m
S 440
1m
6.95 31
29
28
7.1 30
3C
7.1 30
30
6.65 31
31
6.65 31
6.56 30
30
6.65 30
30
6.7 31
31
C
.1
.4
.7
.1
.1
.4
.4
.2
.2
.3
.4
.5
.7
.4
.6
.5
SDf t .
2 .5
1.5
2.0
2 .0
2.0
2 .0
1.5
1.5
1.5
Comments:
Received call f rom Vicki at SJRWMD that both BDZ pumps on (1:30 P . M . ) . Got to
pump •?2 at 4 :00 P . M . No f low in ups t ream canals (Stat ion 23 & 2 4 ) . Puir.p #2 pumping
at high rate. Pump cover ^ open. Plow traveling f rom pump --2 eas t , but entering
3northern marsh as d i f f u s e f low. Only discharge of 10 ft /sec measured in BDZ canal
at Station 21. Both pumps at BDZ #1 pump running. Signif icant ou tpu t . Covers \
open. Heavy white foam covering area and flow swirling in circular motion in canal.
Most of pump output entering marsh on north side of canal. (Did not go east into
South Mormon canal). In f a c t , significant westerly flow in BDZ canal (275 ft /sec)
was measured at site 16. Most of South Morten f low was enterinc Bul ldozer canal

III
I
II
(BDZ) and flowing west until reaching a dense water hyacinth jam, before going
into northern marsh (see diagram). Three Forks did not appear to be flowing
into South Mormon Canal. Flow meter broke while making flow measurements on
Mormon Canal, consequently we do not know the magnitude of this flow (although
it was high) .
I
I
I "T:"Il1l _> ??•:
I
Measurements made during high water conditions en 6/18/82 and 7/12/82
indicate a large percentage of the South Mormon Canal flow enters BDZ canal
and flows west and then into the north marsh area.

III
Location: Bulldozer Canal
Date: 7/20/82
DepthStation ft
>. Mormon 13
jstream 24
t
I
I
I
I
I
I
I
I
I
I
I
I
I
pump 22
0 down 21
20
16
TimeDischarge
f t-VsecDOmg/L
7.0 10:30 A.M. 481ft /sec 0.3 surf
0.1 1m
6.0 10:55 A.M. 12.5f t 3 /sec 0.8 surf
0.5 1m
6.0 11:10 A.M. 1.0 surf
6.5 11:30 A.M. 18.2 ft3/sec 1.1 surf
0 .8 1m
0.7 2m
12:00 P .M. 1.2 surf
0.8 1m
6.5 12:30 P .M. 374 ft /sec 0.4
0.2
Cond.(ymhos/cm)
450
pH
6.73
3C5 surf 6 .76
320 1m
750
720
720
720
380
380
470
6.86
7.3
6.4
6.7
T°C
SDf t .
.29.0 surf 2.0
28.9 1m
29.3 1.7
28.7
28.2 2.0
28.7 2.5
28.4 .
28.2
29 .4 surf 1.5
28.1 1m
29 .0 1.5
28.9
Note: Three Forks net flowing. Pump //2 running, definite odor present. Pumps #1
not on. 78% of South Mormon flow entering Bulldozer canal and then flowing north into
marsh. Some of discharge from Pump if2 enters marsh to north. See diagram. Only
small discharge O 6 ft3 /sec) flowing east from Pump if2.

III
Location: Mary A
Date: 7 /22/82
:ream
imp
S t at i on
A
Depthf t Time
Dischargeft3 /sec
6.5' 3:30 P.M. No flow
DO Cond.(mg/L) (umhos/cm) p_H
4 . 9 S 600 7.03
4.61m 600
T°C
32.7
31.8
9.0 ' 3:45
-t~at. M
lat. M-54
I
I
I
if 1
t
I
I
I
I
I
I
I
I
I
down 8.5 4:15 P.M.
in hyacinthssoft bottom
4:45
5:15
2 of 3pumps on
*33 ft3/sec16,850 gal/min
very highdischarge'.
5 . 2 S 600 7 .22 33.0
5.21m 600 33.0
5 . 0 2 m 600 33.0
5.1 S 600 6.7 32.9
4.7 1m 32.8
2.2 2m 27.3
1.4 S 550 6 .62 30.7
1.5 1m 30.8
S ample t akenNo field meas.storm coming in.
SDft_
1.0'
5.0"
5"
1.5'
Comments: . ;
Mary A pumps on. White foam. Some of flow could be crossing marsh and
entering northern canal - (we couldn't tell, although it didn't appear to beA
occurring) Therefore, our discharge measurment may be an underestimate. Very
high productivity in area. (hyacinths and duckweed). Water very turbid'. Wind
shifting directions constantly. Very high flow in Lateral M canal.(2 of 3 pumps
on. Discharge probably 40,000-80,000 gpm) .
/'-t—

IIIII
AJBPurapI
IDown
I
I
I
I
I
I
I
I
I
I
I
Location: Bulldozer Canal
Date: 8/3/82
DepthStation ft Time
24 7.0 ' 11:30
Dischargeft3 /sec
19 ft J / s
South
DO Cond. SD(mg/L) (yimhos/cm) p_H_ T°C f t_
2 . 0 '
22 9 ' 11:05 A.M.
21 7 .5 '
15 5.5'
19 fr /s
0.6S 2100 . 3 l m 350
0 . 7 S 800
0.61m 800
0 .52m 800
0.9S 600
0.51m 650
0.2S 430
O. l lm 430
6.65 30.029.7
7.03 28.8
28.8
28.8
7.03 30.0
29.3
6.83 30.2
30.2
3'
2'
* 3Measured pump output at least 38 ft /sec
Comments :
Pump #2 on. Low flow of water out of pipe. Flow in lateral canal south, due
to wind some of pumpage into marsh. Most of South Mormon flow entering BDZ, from
south.
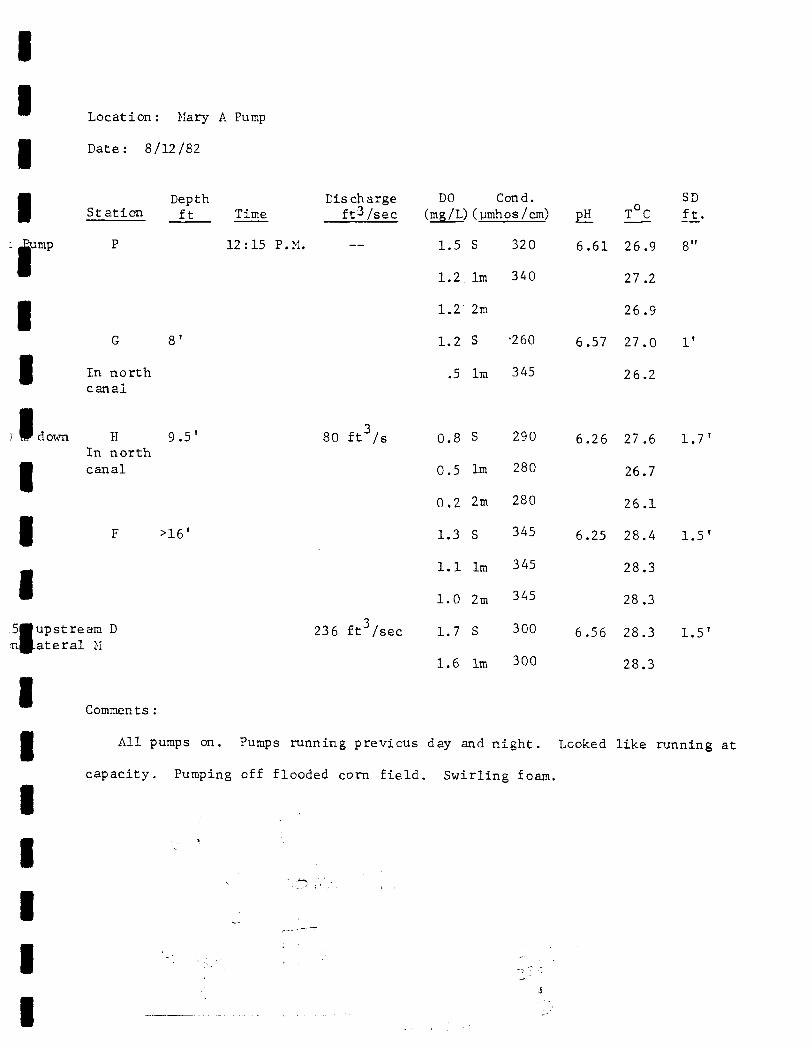
I* Location: Nary A Pump
• Date: 8/12/82
•
Depth DischargeStation f t Time ft3 /sec
: Jump P 12:15 P.M.
1G O 1o
• In northcanal
) P down H 9.5 ' 80 f t3 /sIn north
• canal
1 F >16'
15«upstream D 236 ft3/sec•nj.ateral M
Comments :
I All pumps on. Pumps running previous
capacity. Pumping off flooded corn field
1
1"*— j ;\ ' •
1
\
DO Cond. SD(mg/L)(pmhos/cm) pH T°C ft.
1.5 S 320 6.61 26.9 8"
1.2 1m 340 27.2
1.2 2m 26.9
1.2 S -260 6.57 27.0 1'
.5 1m 345 26.2
0.8 S 290 6.26 27.6 1.7'
0.5 1m 280 26.7
0.2 2m 280 26.1
1.3 S 345 6.25 28.4 1.5'
1.1 1m 345 28.3
1.0 2m 345 28.3
1.7 S 300 6.56 28.3 1.5'
1.6 1m 300 28.3
day and night. Looked like running at
Swirling foam.
a

1
1
1
1
-.Pbend
1
1
1
1
1
1
1
8/13/82 Checked pumps at Zigzag - Flat tire -
LO cat i on : Z i gz ag c an al
Date: 8/16/82
Depth Discharge DOStation f t Time ft3 /sec (m
6 9.5' 1:00 P.M. — 0
0
0
5 9.5 1
0
0
3 9.5' — 182 ft3 /sec 2
(500 down) - 1
0
0
1 13.0' — 1(at pump) 1
1
Didn't appear to be on.
Cond..g/L) (umhos/c
.8 S 500
.6
.5
.5
.8
.7
.1
.2
.5
.4
.6
.4
.3
0 7 .0 ' — ^3 ft3 /sec 1.4(250 up)
U . D
0.3
I
1
1
1
1
1
1
Comments :
Wind from East, sunny, partly cloudy. Only
upstream flow - negligible.
2-or:- • - • • - /:
1m
2m
S
1m
2m
S
1m
2m
3m
S
1m
2m
S
1m
2m
one
.-;-•
500
500
500
550
550
550
610
650
810
820
820
600
610
610
pump
,m) Ei T C
7.0 28
27
27
7.05 28
27
27
7.03 29
27
27
27
7.37 29
28
28
7.36 28
27
26
.0
.9
.8
.2
.8
.4
.2
.6
.2
.0
.4
.4
.3
.5
.2
.7
running, west
SDft..
3.0
2.0
2.3
3.0
3.0
pipe.

IIIIIIIIIIIIIIIIIII
Location: Bulldozer
Date: 8/31/82
Station
24
22
20
Depthf t _
7 '
Time
VL:30 P .M.
Dischargeft3/sec
DO Cond.(mg/L) (umhos/cm)
5.75 Flow is west
1.0
CM
1.2
0.5
317 ft /s(west)
538 ft3/sec
6.0 12.8 ft /sec
265 S
300 1m
510 2m
580
385 S
460 1m
510 2m
310 S
315 S
305 S
T°C
6.54 27 .9
27 .4
6.73 27.3
27.2
SDft.
2.5
2.5
16
13
14
Comments:3 3Total discharge south of entrance to BDZ is 538 ft /sec + 13 ft /s from
3 33 Forks = 551 ft /s. Of that 317 ft /s flowed west into BDZ canal. Evidence
of spray in canal. Took marsh sample % mile north of BDZ //I pump. Difficult
to tell where flow from //2 pump is going as 500 m downstream - no flow. Appears
to be entering marsh. Also, was very slight flow to south at station 24.
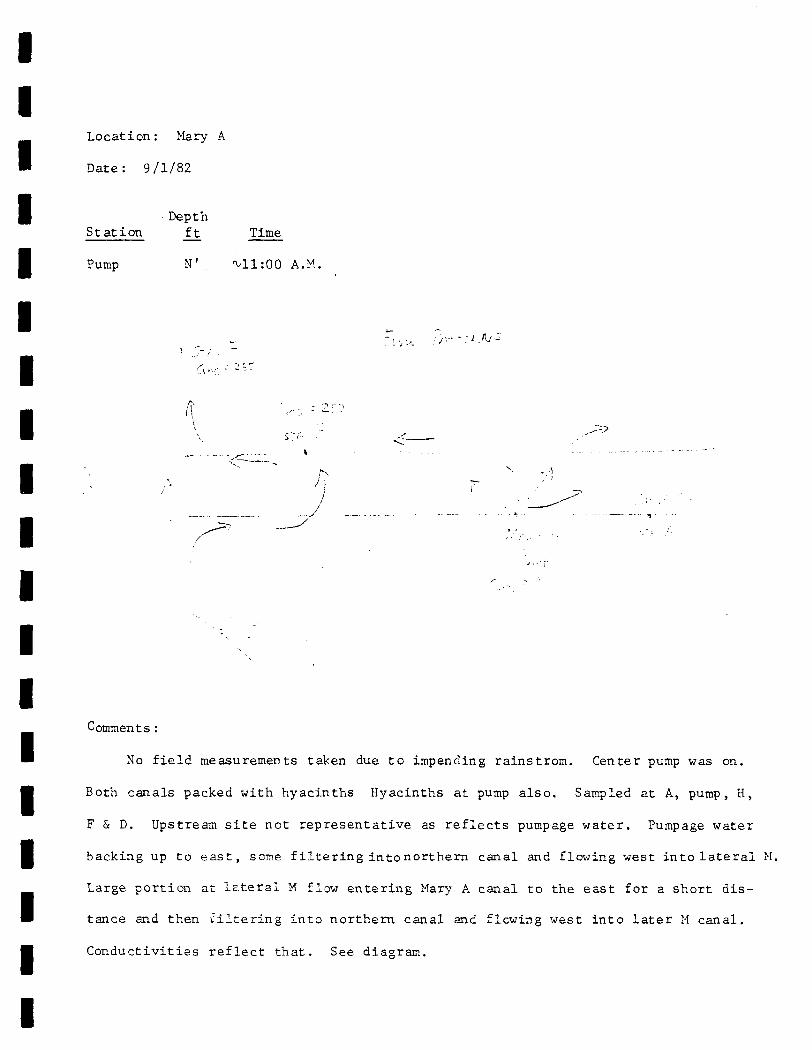
II
Location: Mary A
B Date: 9/1/82
I DepthStation _ft Time
I Pump N' ^11:00 A.M.
I• "' ' •' - -, "~
i \ ,::-;_ ., »
I . - . ^ ^
I
I
-~>
II
Comments:
• No field measurements taken due to impending rainstrom. Center pump was on.
• Both canals packed with hyacinths Hyacinths at pump also. Sampled at A, pump, H,
F & D. Upstream site not representative as reflects pumpage water . Pumpage water
• backing up to east, some filtering into northern canal and flowing west into lateral M.
Large portion at lateral M flow entering Mary A canal to the east for a short dis-
tance and then filtering into northern canal and flowing west into later M canal.
Conductivities reflect that. See diagram.
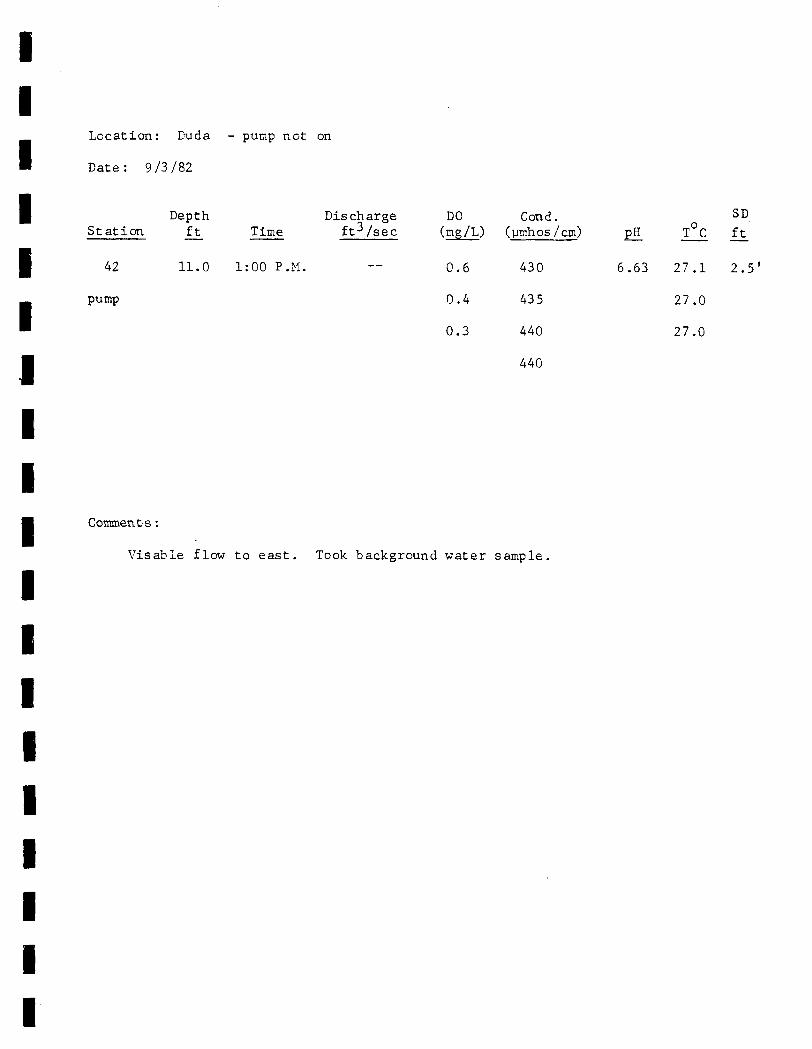
II
Location: Duda - pump not on
• Date: 9/3/82
| Depth Discharge DO Cond. SD
Station ft_ Time ft3 /sec (mg/L) (yimhps/cm) p_H_ T°C ft_
IIIIIIII
42 11.0 1:00 P .M. — 0.6 430 6.63 27.1 2 .5 '
pump 0.4 435 27.0
0.3 440 27.0
440
Comments:
Vis able flow to east. Took background water sample.

t weir 33
30
IIII
.t \
III1IIIIIIIIIII
Location: Lake Washington
Date: 8/26/82
Station Discharge
Condition
South North
1818 ft: /sec
320 S
330 An
390 S
390/m
Stage
16.22
S amples t aken.

IIIIII1IIIIIIIIIIII
APPENDIX B
Three Forks Canal, Bulldozer Canal, South Mormon Outside Canal
and Lake Washington Inlet and Outlet Discharge and Concentration Data.

Table B-l. Water Quality and discharge dat,a for Three Forks Canal.
•BITE
3F
3F
3F
3F
3F
3F
3F
3F
3F
3F
3F
3F
DATE
9A5/81
^23/81
0/8/81
Z/L7/81
V2Q/82
2/22/82
3/10/82
3/3V 82
4/22/82
713/82
5/26/82
8/3V82
DISCHARGE ft3 /S
N
3.8
8.7
8.0
0.0
14.9
31.8
33.9
58.0
49.0
33.4
18.7
13.0
C
31 JO
64 £
55.0
—
_
f f .
S
18 J.
13.1
35.0
28.0
23.6
42.8
48.0
48.6
30.3
38.5
37.6
0.0
(Total
53
87
98
28
39
75
82
107
79
72
56
13
TN
mg/L
2 .7
2.5
2.1
2 .4
2.1
2.3
1.5
2 .6
TKN
mg/L
2 .4
2.2
2.0
2.3
2 .0
2.3
1.5
2.6
NH, -N4
rag/L•
0.0
0.03
0.11
N03-N02
as N 'mR/L
0.41
0.29
0.38
0.11
0.12
0.06
<0.02
0.04
<0.02
TP •
mg/L
0.07
0.08
0.08
0.05"
0.14
0.15
0.07
0.08
0.11
Suspended Solids mg/L
N
4'. 4
6.2
4.0
1.3.
10.1
1.9
3.0
3.3
1.9
2.1
1.5
2.0
C.
3.2
6.8
3.3
«.
«.
.
S
3.2
6,6
3.3
0.3
10.4
2.0
3.2
3.2
1.9
2.6
1.8
4.8
X
3.6
6.5
3.5
0.8
10.3
2.0
3.1
3.3
1.9
2.3
1.7
3.4
VSS m R / LN
2 .2
3.5
1.7
4.'1
n
1.8
2.1
1.2
1.4
0.9
0.8
C
1.9
3 .2 .
2 .2
«
„ .
S
1.8
2.2
2.1
4 .2
0.9
1.6
2.2
1.2
1.6
0,7
0.8
FSS mi? /LN
2.2
2 .7
2.3
6.0
0.9
1.2
1.2
0.7
0.7
0.6
1.2
C
1.3
3.6
1.1
—
_
_
S
1.4
4.2
1.2
6.2
1.1
1.6
1,0
0^7
1.0
1,1
4 .0
X
Cond.Mmhmo/cm
900
730
780
730
725
700
305

Table B-2.Water Quality and Discharge data .for Bulldozer Canal.
£ITE
BDZ
BDZ
BDZ
BDZ
BDZ
BDZ
BDZ
BDZ
BDZ
BDZ
DATE
L2/L7/81
1/20/82
£2/82
3/10/82
/31/82
£2/82
A3/82
£6/82
8/2/82
8/3/82
DISCHARGE ft3/S
N
4.5
3.9
0.0
0.0
6.8
0.5
0.0
0.0
12 Q 5
-
C
2.0
0.0
0.0
0.0
0.0
1.4
_
-
317.0
S
0.0
0.0
0.0
0.0
0.0
0.0
0.0
D . O
.83.4
-
[Total
7
4
0
0
7
2
0
0
304
317
TN
mg/L
0.8
0.9
0.8
0.8
1.1
1.2
0.8
3.2
2.2
TKN
mg/L
0.8
0.9
0.7
0.8
1.1
1.2
0,8
3.2
2.2
NH. -N4
mg/L
0.03
0.21
0.20
N03-N02
as Nmj>/L
<0.02
<0.02
<0.02
0.11
0.02
0.01
<0.02
<0.02
<0.02
0.02
TP •
mg/L
0.01
0.01
0.05
0.01
<0.01
<0.01
0.07 "
0.04
0.16
0.09
Suspended Solids mg/L
N
o'.4
1.4
4.8
2.5.
2.0
1.3
3.5
1.4
4.4_
C
0.7
1.9
1.7
2.4
1.4
1.5
_
_
3.4
S
*6.7
1.8
.2.3
1.4
2.5
1.4
4.0
1.5
8.3
_
X
0.6
1.7
2.9
2.1
2.0
1.4
3.8
1.5
6.4
3.4
VSS rng/LN
3.8
2.5
1.4
L.'3
3.9
> , o3.3
L . 6
_
C
1.2
0.6
1.6
0.9
1.2
_
_
0.8
S
0.8
0.9
0.9
1.6
0.7
2.1
0.4
1.7_
FSS mt?/LN
0.6
2 .3
1.1
0.7
0,4
1.5
1.1
2.8
—
C
0.7
1.1
0.8
0.5
0,3
—_
2.6
S
1.0
1.4
0.5
0.9
0,7
1,9
1.1
6.6
—
X
Cond.umhmo/cm
870
975
900
925
990
1190
445
310

J.UL iouth Mormon uut-t;icie Canal.
SITE
M.O.
M.O.
M.O.
M . O .
M . O .
M . O .
M . O .
M.O.
M . O .
M . O .
M.O.
M . O .
M . O ,
M.O.
DATE
9/15/81
9/23/81
12/17/81
1/20/82
2/22/82
yio/82
:V3V82
/22/82
513/82
5/26/82
624/82
7/20/82
3/2/82
^31/82
DISCHARGE f f c 3 /S
E
5.6
5.4
1.4
0.0
0
5.3
10,3
0.0
0.0
0.0
53.6
iia3
84.6
120
C
1L4
17.7
15.1
4.8
0
ias
20.9
6.8
5.5
3.1
1310
207.6
146,4
248
W
6,6
9.1
0.0
2 .0
0
7.8
16c5
2 . 9
0.0
0.0
9Z2
L46.3
9ai17. C
JTotal
24
32
17
6.8
0
32
48
9.7
5.5
3.1
276
472
321
538
TN
mg/L
-
1.3
1.8
1.3
1.3
1.9
3.0
2.4
3.4
2 .6
2.9
1.2
TKN
mg/L
0.9
1.6
1.0
1.2
1.8
3.0
2.4
3.4
2.6
2.9
1.2
NH.-N4
mg/L
-
_
_
_
_
_
0.03
0.25
0.17
0.18
0.25
N03-N(L.
as N :mg/L
0.18
0.35
0.23
0.25
0.06
0.15
<0.02
<0.02
<0.02
<0 .02
< 0 . 0 2
cO.02
TP
mg/L
0.02
0.04
0.11
0.04
0.07
0.31
0.10
0.08
0.45
0.20
0.18
0.12
Suspended Solids mg/L
E
4 .7
2.3
0
7.2
1.8
2.3
4 .4
2.9
3.2
1.6
26 .0
6.0
4 , ?
2.0
r
4 .2
1.9
0
2 .7
3.7
1.5
2 . 2
2 .9
2 .6
2.2
27.0
6.4
5.3
2 . 0
W
3.8
2.1
0
2 .2
3.1
3.1
3.7
2 .0
2.8
1.9
25,7
6.6
4 - 2
2 .0
X
4 . 2
2.1
0
4.0
2.9
2.3
3.4
2 . 6
2.9
1.9
26.2
6. -3
4 .6
2 .0
VSS me/L
Ft
3.0
1.5
0
3.4
0.8
1.4
3.1
2.0
2 .0
0 ,7
16,3
1 ,8
1 ,0
0.8
r.
3.0
1.4
0
1.3
1.7
1.1
1.7
2 .4
1.4
1.0
13,4
1.8
1 .0
0.8
W
2.1
1.3
0
0.9
1.4
1.5
2.5
1.8
1.6
0.8
14.7
1.8
1 .4
0.9
pSS me/L
E
1.7
0.8
0
3.8
1.0
0.9
1.3
0.9
1.2
0,9
9.7
4 . 4
•\.*>
1.2
r
1.2
0.5
0
1.4
2 . 0
3.4
0.5
D . 5
1.2
1,2
?.fi
4 . 6
4 '
1.2
w -1.7
0.8
0
1.3
1.7
1.6
1.2
0 ,2
1.2
1,1
HO
4 . f
- ? . f
i.
X
Cond.umhmo/cm
1000
1095
1090
880
965
1440
520
4sn
A 9 S
315

Table B-4. Water Quality and discharge data for Lake Washington Inlet,
!iSITE
: IN
! IN
! IN
INI
i IN
1
! IN
1 IN
I N!
i IN!
i N
IN
I N
I Ni
IN
'• IN
i IN
; IN
:N
DATE
&/2&/81
^V81
yis/si
^2Y81
102/81
108/81
1J/6/81
2/L7/81
VIQ&2
2£4/82
2/12,62
3/30/82
4/2 2£2
5/1362
#6/82
7/1^62
a/ 4/82
S/26/82
DISCHARGE f t 3 /S
E
7 .2
-
isai
63.0
5 4 . 4
2 4 . 2
0.0
12.5
4 . 9
13.7
23.7
34.0
0.0
0.0
26.9
497.9
6817
540
C
14.6
34.;
18 4£
14 9A
1130)
5L8
32.6
10.2
12.2
33.4
57.4
77.9
1371
60.3
24.9
5873
714.8
768
W
4 .2
L1L9
36.8
51.3
i 7 . 4
23 .8
0.0
0 .0
7.3
8.7
2L2
10.:
0.0
16,1
497.9
577.7
510
iTotal
26
34
435
299
219
123
56
23
17
54
90
133
147
60
68
1574
1974
1818
TN
mg/L
1.7
1.8
1.6
2.0
1.8
3.0
2.4
2. '5
2 . 5
1.5
TKN
mg/L
1.7
1.8
1.6
2.0
1.8
3.0
2.4
2 .5
2:5
1.5
N H . - N4
mg/L
<0.02
0.07
0.19
0,14
0.15
N03-N(^
as N :m R / L
0.01
0.00
0.01
0.01
0.01
0.02 '
•cO.02
0.03
< 0 . 0 2
< = 0 . 0 2
0.03
TP
mg/L
0.03
0.04
0.04
0.03
0.04
0.05
0.07
0.06
0.14
0.08
0.13
Suspended Solids m%/L
E
0,4
2 .0
4.8
2.3
2 .5
2.8
1.1
2 . 4
1.6
0.5
3.0
3.1
2.3
1.8
3.6
2 .9
C
0 ,7
1.6
10.9
2 . 2
1.5
2 .8
L . 5
1.9
L . 6
3.5
1.5
3.3
L.9
> . o
4 . 3
3 .5
W
1.3
2.1
7.3
2 .3
4 . 2
3 .2
0 , 4
1.5
2.1
1.3
4.3
3.0
L . 6
L . 6
6 .2
1.0
X
0.8
1.6
7 . 7
2 .3
2 . 7
2 . 9
1,0
1.9
1.8
0.8
3.3
3.1
1.9
1.8
4 . 7
3.5
VSS mg /L
F]
0 , 2
1.0
4 . 2
1.8
2 . 5
2 . 4
0 , 9
0 , 9
0,3
1.2
1,3
1,6
0.8
1.3
0.5
C
0.4
1.0
7 . 0
1.3
1.1
2 . 4
0.7
0 . -5
0,3
0,7
1,6
i,?
1.0
1.3
0.5
W
1.0
0.9
5.7
1.3
2 . 5
2 . 4
0.7
0.9
0.7
2 . 4
1,8
0.9
0.8
2 . 4
0.9
fSS m e / L
E
0.2
1.0
1.6
0.5
0.0
0.4
1 . «;
0.7
0 ,2
1.8
1,8
0 ,7 '
1.0
2 . 3
2 . 4
P
D . 3
D'J6
3.9
D . 9
3.4
P , 4
1,2
1.2
) .2
1.8
'1|7
O . f i
1.0
3,0
3.0
w •0.3
1.2
1.6
1.0
1.7
0,8
fLK
1.2
0.6
1,?
1 ,2
0,7
0.8
3 , 8
3.1
X
Cond .Mmhmo/cm
815
880
700
585
645
730
415
380
340

Table B-5. Water Quality and discharge data for Lake Washington Outlet,
1
SITE
; OUT
OUT
OUT
OUT
GUI'
OUT
OUT
OUT
OUT
OUT
oUT
OUT
OUT
OUT
OUT
OUT
OUT
, ' i ' JT
DATE
8/2$ 81
9/ 1/81
9/15/819/23/81
10/2/81
1(X 8/81
1V6/81
12/17/81
V20/82
2/2V82
3/]2£2
^3062
V22£2
s/i3$2
5/26/8-2
7/2^82
8/4>82
8/2^62
DISCHARGE ft3 /S
E C W (Total
0
0
0
277
239
239
250
129
108
129
198
198
376
305
250
2216
2533
962
TN
mg/L
2 . 2
2.1
1.4
2 . 0
1.6
3.8
2.3
2'. 3
2 .6
1.6
TKN
mg/L
2 .0
2.0
1.4
2.0
1.6
3.8
2.3
2 .3
2'. 6*
1.6
N H . - N4mg/L
<0.02
0.07
0.26
0.25
0.18
N03-N(^
as N :mg/L
0.23
0 .22
0.10
0.01
0.03
0.02
<0.02
0.03
0.02
0.03
< 0 . 0 2
L TP
me/L
0.05
0.07
0.05
0.03
0.06
0.04
0.05
0.66
0.14
0.09
0.11
Suspended Solids mg/L
E
3.8
3.0
2.1
1.3
3.4
1.6
2 .5
3.0
3.3
' 2 . 4
2 .0
4.0
3.0
r
1.6
2 . 6
2 .8
W
.
vm
,
_
W
2.3
1.9
2 . 2
1.3
3.7
1.7
2 . 7
3.2
2.5
2 .5
2.8
3.6
3.2
X
2 . 6
2 .5
2 . 4
1.3
3.6
1,7
2 . 6
3.1
2 .9
2 .5
2 . 4
3.8
3.1
VSS mg /L
EL
2 . 2
1.7
1.1
2 .0
0.9
2,3
1.3
1.4
2 .0
1.2
1.4
0.6
C
1.5
1.4
1.9
M
— m
^
_
W
1.3
0.7
1.2
1.6
0.5
2 .5
2 . 2
1.0
1.9
1.8
0.8'
0.6
pSS m e / L
E
•
1.6
1.3
1.0
1.4
0.7
0 .2
1.7
1,9
0.4
0.8
2 . 6
2 . 4
r
3.1
1.2
0 , 9
_
^_
_
_
,W •
1.0
1.2
1 ,o
2.1
1.2
0 .2
1,0
1,5
0 .6
1.0
2 , 8
2 . 6
X
Cond .M i u h m o / c m
735
815
805
845
810
775
395
390
360
II1I1IIII1III1I1II1
APPENDIX C
Discharge Rates

DATE8/28/81
CDa:
2000
1500
1000
500
Jli
L1 1 iin.i_i_u_...
__ i
JJ.
Sta. No.
e Height at LaJ<e Washington; 12.
i
._LL
1L
I i
L£J5
KEY:MOC = Mormon Outsidg Canal
TFR = Three Forks Run
BDZ = Bulldozer Canal
LWI = Lake Washington Inlet
LWO - Lake Washington Outlet

DATE 9/1/81
UJCOry
O
a
2000
1500
1000
500
.11
I |
LU
-i.-LJ_LI
i
1.11 iiU.„ 1_-
It
ySta. No.
L W O
Stase Height at Lake Washington: 12.12 msi. KEY:HOC - Morman Outside Canal
TFR = Three Forks Run
BDZ = Bulldozer Canal
LWI = Lake Washington Inlet
LWO = Lake Washington Outlet

DATE 9/15/81
CD -—OL >S><C \IT roO -<->OO 4-
2000
1500
1000
500
Sta. No. 1 2
-f-
_LJ .OIL'
5 LWO
Stage Height at Lake Washingjton: 12.99 msi. KEY:MOC = Mormon Outside Canal
TFR = Three Forks Run
BDZ = Bulldozer Canal
LWI = Lake Washington Inlet
LWO = Lake WAshington Outlet

DATE 9/23/81
<C oo:n -*->C_> "4-
Q
2000
150°
1000
500
Li,H
Sta. No .
7m
1 2
i i i I.LJ.-U-
i |
i l , ,
iili-t
! i
4_u
Ul
_L JJ..ii
277
Staae Height at Lake WashiimlQn: 14.10 msi . KEY:MOC = Mormon Outside Canal
TFR = Three Forks Run
BDZ - Bulldozer Canal
LWI = Lake Washington Inlet
LWO = Lake Washington Outlet

DATE
IE 00C_> 4->OO 4-i—i ^—^Q
2000
1500
1000
500
ILLL
10/2/81-f-H-j-
11
-U_LJ_
I I i ;
lillI
_ __u
J L
ii
J__i
+
rrrtj.J..|Li
I_L.
II I.
M-H
JJ.I i :i I
.!_
239
Sta. No.
5 L W O
Stage Height at Lake Washington: 14.13 msi. KEY:MOC = Mormon Outside Canal
TFR = Three Forks Run
BDZ - Bulldozer Canal
LWI = Lake WashingtonMTm.-let
LWO = Lake Washington Outlet

DATE
CDo;
00
2000
1500
1000
500
Sta. No.
10/8/81
|98
JJ_.._L
-L.J_i_L
t
-L.1.
J1
11
tt"
I--1-H
_LJ_
239
1 2 3
Stage Heicjhtaj: Lake Washington: 14.06 msi. KEY:HOC = Mormon Outside Canal
TFR = Three Forks Run
BDZ - Bulldozer Canal
LWI = Lake Washington Inlet
LWO = Lake Washington Outlet

DATE
<C ^m oo<_> -MCO <4-
2000
1500
1000
500
11/6/81_. i. j i.
J_
Ul.
t i
illl
J_L
JJ..L
125.0
Sta. No.
Staae Height at Lake, Washington: 14.13 K_EY:MOC = Mormon Outside Canal
TFR = Three Forks Run
BDZ = Bulldozer Canal
LWI = Lake Washington Inlet
LWO = Lake Washington Outlet
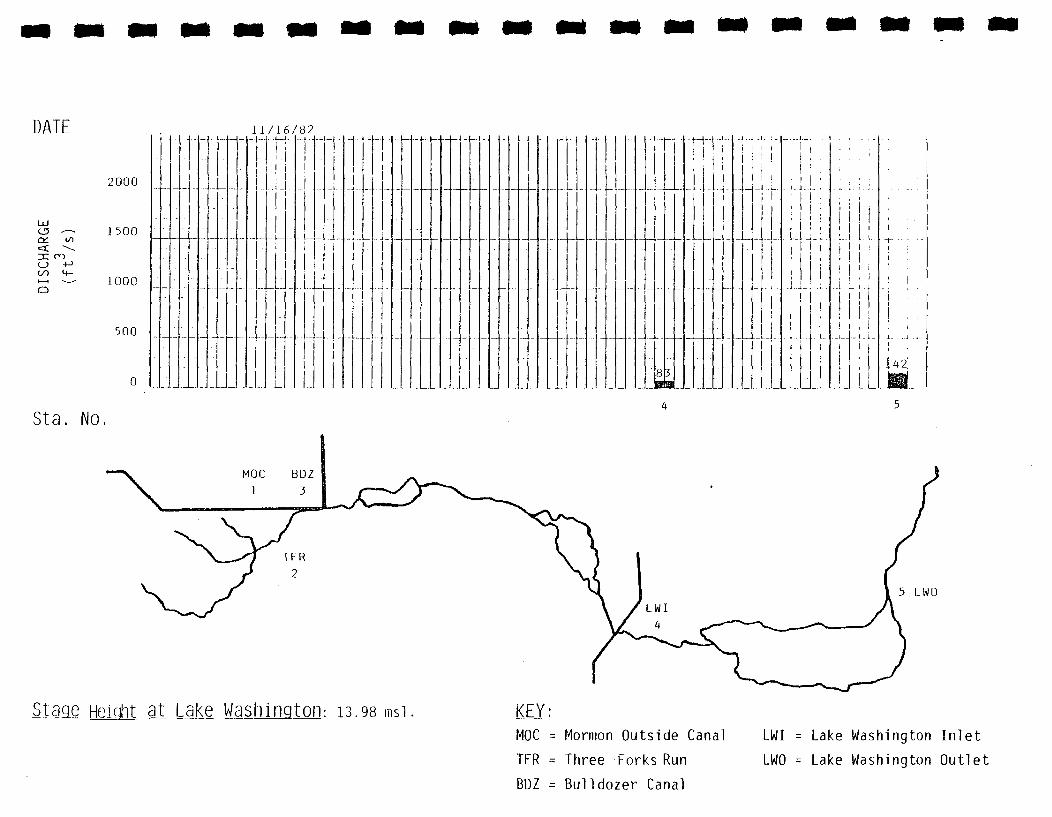
DATE
o -—ry toct ^DC roCJ -MGO «4-
Q
2000
1500
1000
500
Sta. No.
11/16/82i—i
i_L
ii
_L
-f- T
1 -i_ _J j_ !..
..L.
Stage Height at Lake Washinglon: 13.98 KEY:MOC = Mormon Outside Canal
TFR = Three Forks Run
BDZ = Bulldozer Canal
LWI = Lake Washington Inlet
LWO = Lake Washington Outlet

DATE 12/15/82
2000
LUCD — 1500CsL to
0OO
1000
500
i !
_L- J JJ
_L 111
Sta. No.
Stage Height at Lake Washington: 13-80 ms1 KEY:MOC = Mormon Outside Canal
TFR = Three Forks Run
BDZ = Bulldozer Canal
LWI = Lake Washington Inlet
LWO = Lake Washington Outlet

DATE
2000
03 —- 1500<c
OO<_JCO
Q1000
500
12/17/81
I I
-4—• _I_J_1
J..
-J-
1
Sta. No.
Stacje Heighi at Lake Washington: 13.75
H-
J L
J.
...L.1
-1-
_lhii i i i
L ...L
|29m
KEY:MOC = Mormon Outside Canal
TFR = Three Forks Run
BDZ = Bulldozer lanal
LWI = Lake Washington Inlet
LWO = Lake Washington Outlet

DATE 1/20/82
LUCD -—o; oo<: ^:n ooC_J 4->OO 4-
2000
1500
1000
500
i
..jj-j.1 1 j11 II 1
~r
-L.
1
r
iiI
n rtt I I <
I I
Ui
111
! i
Sta. No.1 2 3
I i. - _
Stage Height at Lake Washington: 13.75 msi. KEY:MOC = Mormon Outside Canal
TFR = Three forks Run
BDZ = Bulldozer Canal
LWI = Lake Washington Inlet
LWO - Lake Washington Outlet
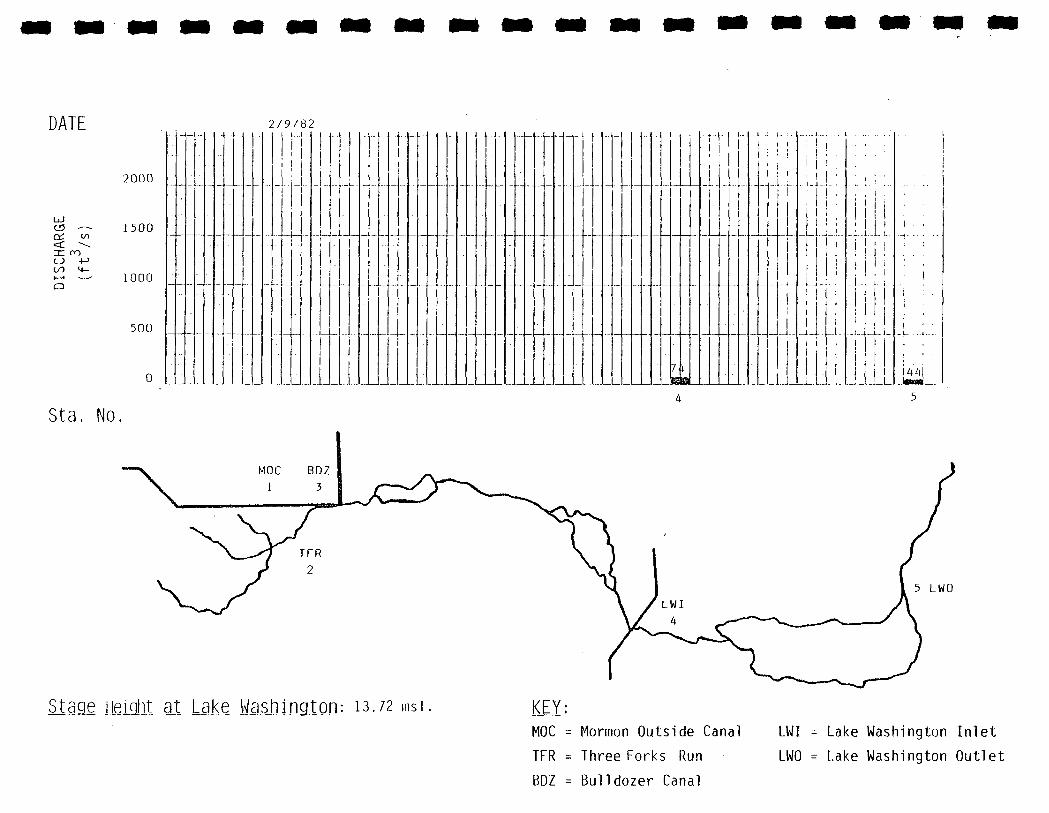
DATE 2/9/82
<c -1C. ro00 4-1 — * ^ — o
2000
1500
1000
500
i
-t-
I I
_L _L
Sta. No.
Stage iMalit at Lake W a s h i n g t o n : 13.72 KEY:HOC = Mormon Outside Canal
TFR = Three Forks Run
BDZ = Bulldozer Canal
LWI = Lake Washington Inlet
LWO = Lake Washington Outlet

DATE 2/22/82 2/24/82
LulO3 -—DC ooet -,m ooo +->CO 4-
Q
-LJ-J.J.
JJJ Jll
__L.J
JI . . r
129'
Sta. No - 1 2 3
Height at Lake Washington: 13-77 ms l-(2/24/82)
KEY:MOC = Mormon Outside Canal
TFR = Three Forks Run
BDZ = Bulldozer Canal
LWI - Lake Washington Inlet
LWO = Lake Washington Outlet

DATE
CJ 4->00 4-
Q
2000
1500
1000
500
3/10/82....I-
...UJJ-.
-I-
1
3/12/82H-H
1
J.
I !Ll-j-L
11Sta. No.
1 2
Stage Height at Lake Washington: is.85 msi(3/12/82)
KEY:MOC = Mormon Outside Canal
TFR = Three Forks Run
BDZ = Bulldozer Canal
LWI'= Lake Washington Inlet
LWO = Lake Washington Outlet
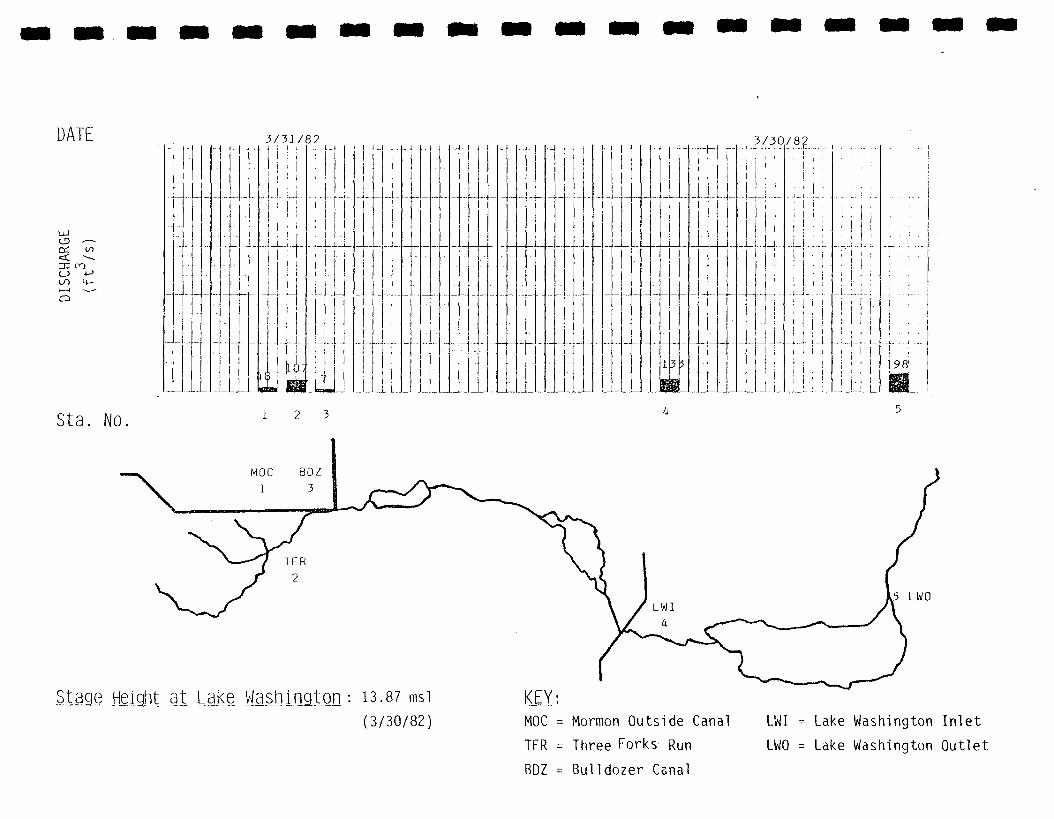
DATE
LJo —CC (/>
GO 4-(— < - — "Q
IL
3/31/82
.iJ..
JJ-
ki
trr l_-,-L_4~|—I — --f-4-
-t-
I
_.LJ_L
J.J
3/30/82
198'
Sta. No 1 2 3
Stage Height at Lake Washington : 13.37 msi(3/30/82)
KEY:MOC = Mormon Outside Canal
TFR = Three Forks Run
BDZ = Bulldozer Canal
LWI = Lake Washington Inlet
LWO - Lake Washington Outlet

DATE 4/7 /82
2000
0 — - 1500Qi CO<c ~^DC ro0 •»->GO <4-•— — 1000Q
500
0
— ~ ~
...-
—
-
_ —
_. ...
-
-
-
_
... ._
— '
. —
~
—
- - _. _
1"
_
—
-- -
--
-
_
-
"r
-
._
-
-
-
__
- .. --
—
-
—
-
—
-
— —
-
9ts
t
^
-
_J
-H
„
^~
- -
-
_ -_
-
-- -
~
_
...
... .. L -
:
1
i . . .t
1 • :1i
; I1t1 , .I : '
1j |133nn
Sta. No.
Stage Height at Lake Washington: 13.95 KEY:HOC = Mormon Outside Canal
TFR - Three Forks Run
BDZ = Bulldozer Canal
LWI = Lake Washington Inlet
LWO = Lake Washington Outlet
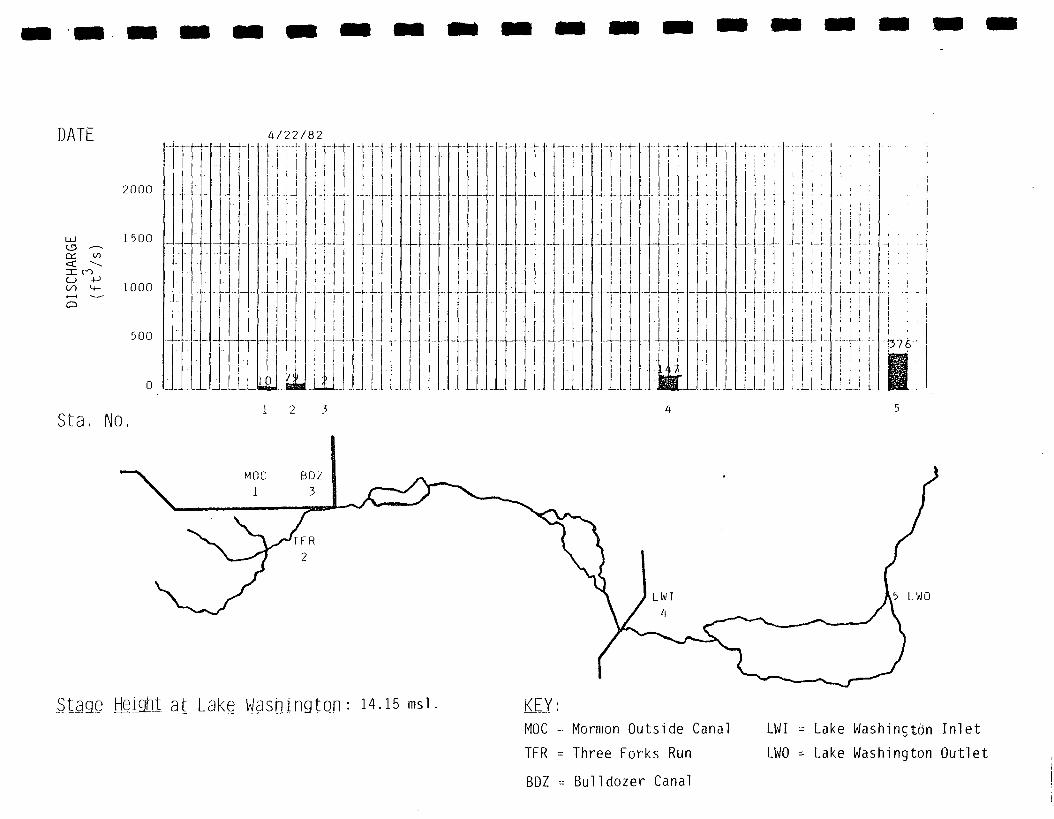
DATE
O —.ry i/i
2000
1500
CJ +->oo 4- 1000
500
4/22/82..| _.--!._:- ...i .4~4—
.L
.LL
-H
iili
ii
Li:
.4.1.
I |
•Hi
! I
..L
'13 7 6'
Sta. No .1 2 3
Stacifi Heiaht at Lake Wasim^ton: H.I5 msi. KEY:HOC = Mormon Outside Canal
TfR - Three Forks Run
BDZ = Bulldozer Canal
LWI = Lake Washington Inlet
LWO = Lake Washington Outlet

DATE
U3 -—
<C --.n: ooO 4->OO "4-(—t - —"Q
2000
1500
1000
500
72
5/13/82i.-l-
I I
.Lh
i
j_U_
,u_
1
i
rII
_l_ _L
.ij_
I I :i i ;.L!._i_!.
...L
LL
305.
Sta. No.1 2 3
Stage Height at Lake Washington: 14.10 KEY:MOC = Mormon Outside Canal
TFR = Three Forks Run
BDZ = Bulldozer Canal
LWI = Lake Washington Inlet
LWO = Lake Washington Outlet

DATE 5 / 2 6 / 8 2
CtL<Crn
2000
J500
1000
500
Sta. No .
I I I
_J,
68
r-M-i i
1 2 3
Stage Heiaht.at Lake WashiMton: 14.10 ms i KEY:MOC = Mormon Outside Canal
TFR = Three Forks Run
BDZ - Bulldozer Canal
i !...L
!25Q
LWI = Lake Washington Inlet
LWO = Lake Washington Outlet
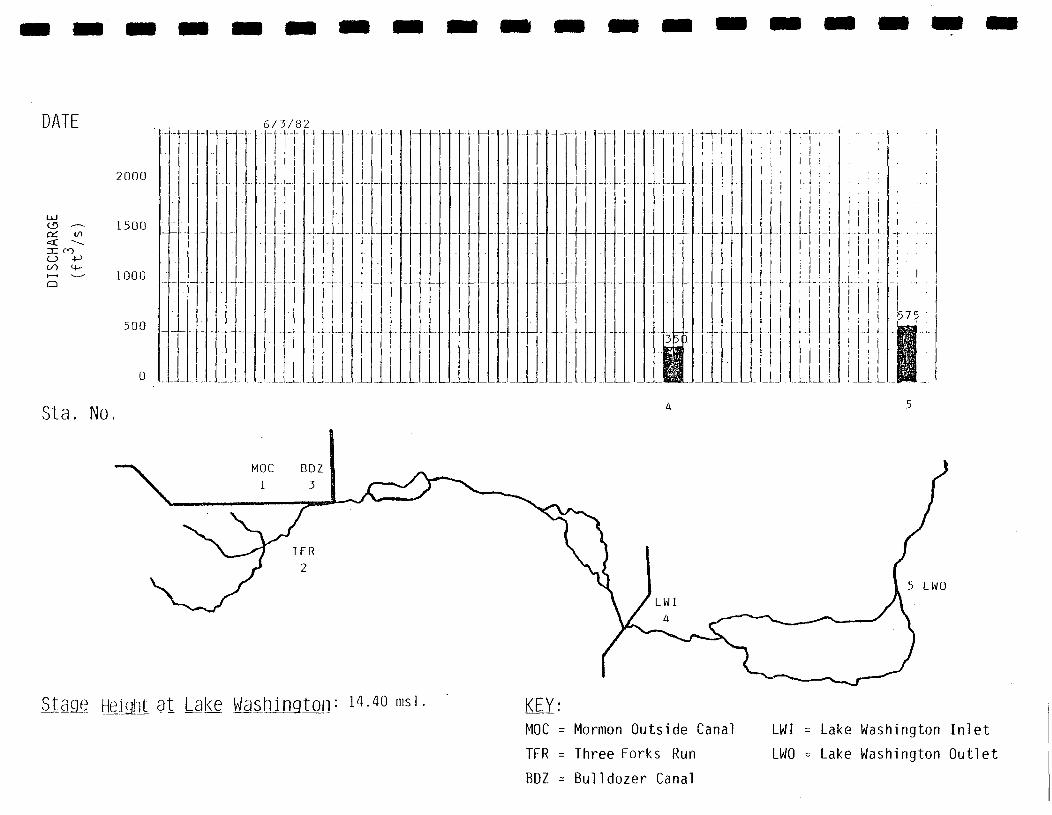
DATE 6 /3 /82
2000
UJCD — 1500C£ </)
CJ00
1000
500
._!_
J_ —t-- _LL
. ..j_u..
\
._L.
i
_L 1I I
1
_l_U Li. i
1575
Sta. No.
Stage Height at Lal<e Washington: 14-40 msi KEY:HOC = Mormon Outside Canal
TFR = Three forks Run
BDZ = Bulldozer Canal
LWI = Lake Washington Inlet
LWO = Lake Washington Outlet
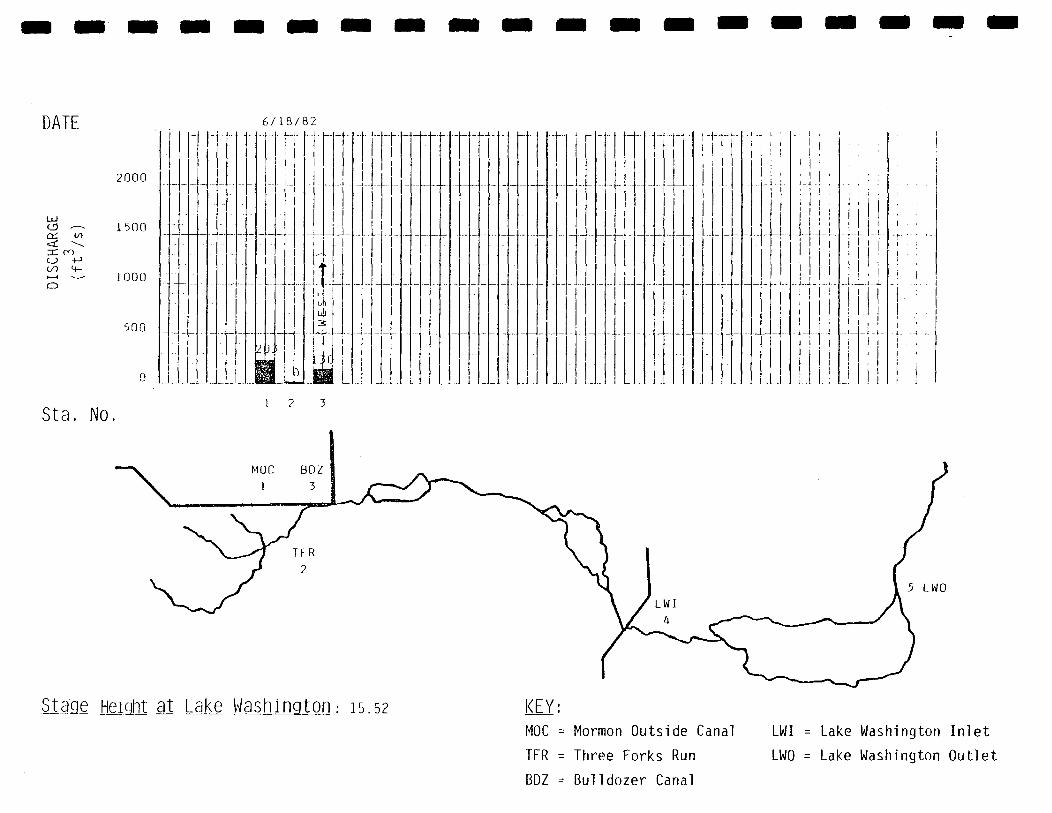
DATE 6/18/82
(£3 —-Of 1/1<C -^ZC COo +->U1 14-I—< -—"Q
2000
1500
1000
500
Sta. No.
LlJ
4
Li
1
LLJ
JJ
! I
i i
_L_uL LLM M' i l l
1 2 3
Stage Height at Lake Washington: 15.52 KEY:MOC = Mormon Outside Canal
TFR = Three Forks Run
BDZ = Bulldozer Canal
LWI = Lake Washington Inlet
LWO = Lake Washington Outlet

DATE
2000
a ~ 1500a: i/>re ooc/} M— L O O O
500
T
_U~L
7/20/82.-l_. ...!„; l. 4..-1-
7/19/82
l I
l;
4
•14-
IL-t-
i
2216
Sta. No. 1 2 3
Stage Height at Lake Washington: is.46 msi.(7/19/82)
KEY: •MOC = Mormon Outside Canal
TFR = Three Forks Run
BDZ = Bulldozer Canal
LWI = Lake Washington Inlet
LWO = Lake Washington Outlet

DATE 8/2/82 3/4/82
COi—iQ
2000
1500
1000
500
Sta. No.
_L -H
'
IJ
i
_J_L
H-r
JJ_LL
2533
2 3
Stage -Height at Lake Washington: 16.78 msi .(8/4/82)
KEY:MOC = Mormon Outside Canal
TFR = Three forks Run
BDZ = Bulldozer Canal
LWI = Lake Washington Inlet
LWO = Lake Washington Outlet
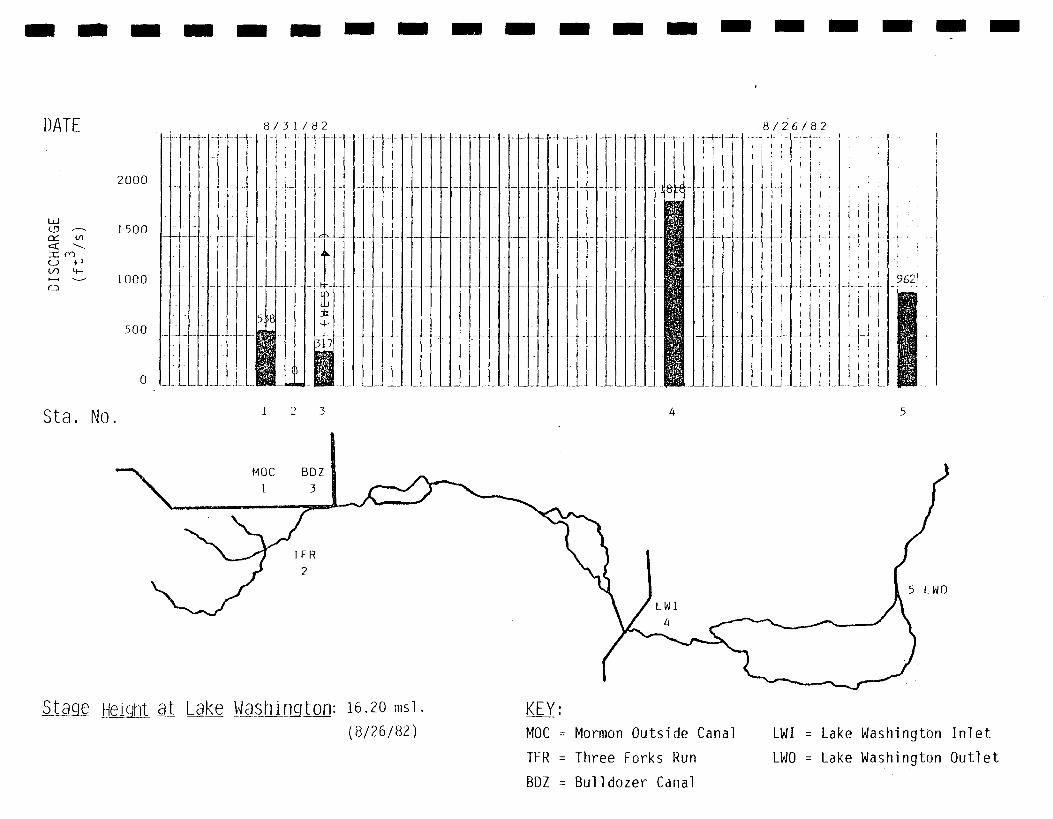
DATE 8/ 3 L /82 8 / 2
UJO3rv
Q
-M
2000
1500
1000
500
JJ_
4-.i_U7 i
I I
-4-L
6 / 8 2._.! I
Sta. No. 1 2
Stage Height at Lake WashingtQQ: 16.20 msi.(8/26/82)
KEY:MOC = Mormon Outside Canal
TFR = Three Forks Run
BDZ - Bulldozer Canal
LWI = Lake Washington Inlet
LWO = Lake Washington Outlet

DATE 9 / 2 8 / 8 2
03 -—CC i/l<c - .DC 00
4-
CD
2000
1500
1000
500
Sta. No.
_1
I L
Stage Height at Lak_e Washington: is.73
-L-L .1.I
11
il...L
4-419--
KEY:MOC = Mormon Outside Canal
TFR = Three Forks Run
BDZ = Bulldozer Canal
LWI = Lake Washington Inlet
LWO = Lake Washington Outlet
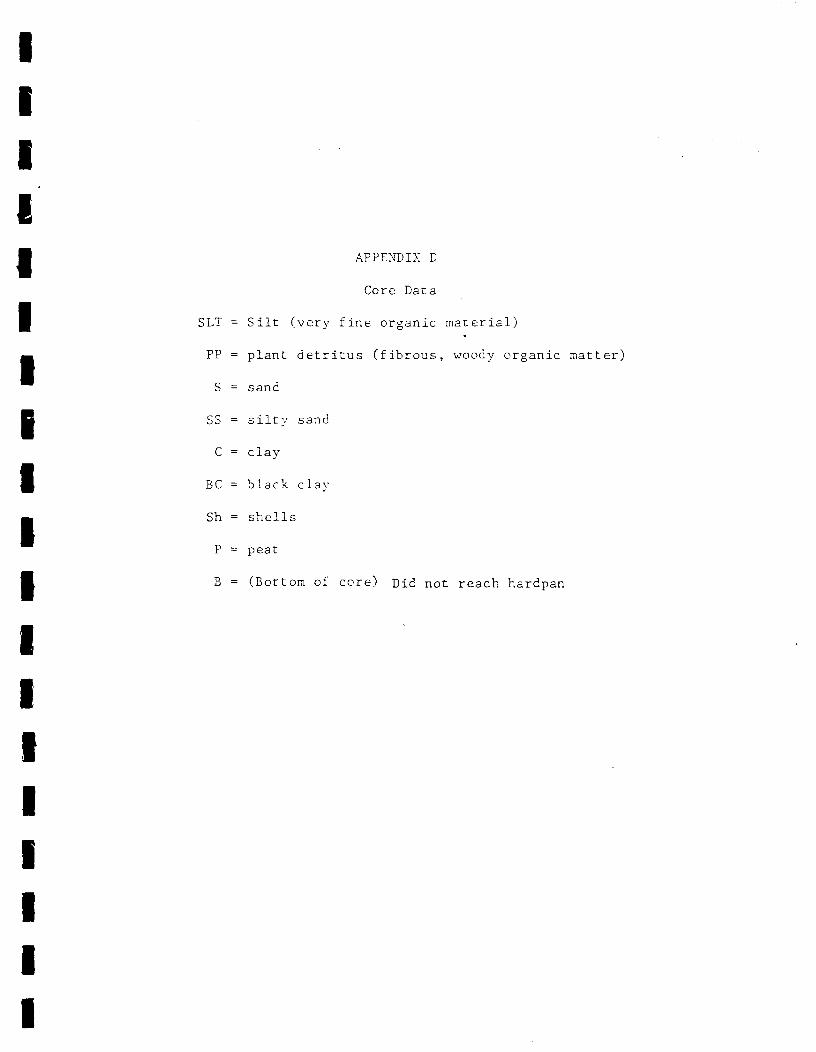
II1II APPENDIX D
Core Data
I SLT = Silt (very fine organic material)
PP = plant detritus (fibrous, woody organic matter)
S = sand
SS = silty sand
C = clay
BC = black clay
Sh = shells
P = peat
• B = (Bottom of core) Did not reach hardpan
I
I
I
I
1
I
I
I
I
I
I
I

Area
</>CO«£
Ce
nte
r.
ino
UJ
Site(yd)
150
120
90
60
30
150
120
90
60
30
0
150
120
90
60
30
Core Depth
5 10• i • i i i i i . i
SLT
SLT
4
*
S
S
S
s "
Peat
Peat
LT
SLT
Peat
Peat
(in)
B
i
B
Peat
If-SLT
Peat P/S
Peat
Peat
Peat
Peat
Peat
Peat
P/S•4- -SLT
SLT/S
•+ — i
Peat
B
15
B
B
B
B
B
B
Peat B
-SLT/SH/S Peat
SLT
Peat
Peat B
B
B
B
B
Note: Could nc
c loy or sand Ic
radials had o p
20i i
B
> t reach
jyer. All
eat botlom.
WaterDepth
( f t )
8.0
7.25
6.5
6.0
5.5
7.75
6.5
6.75
6.5
6.5
6.25
7.5
6.5
5.75
5.25
4.5
SampleDate
11/24/82
11/24/82
11/24/82
11/24/82
11/24/82
11/24/82
11/24/82
11/24/82
11/24/82
11/24/82
11/24/82
11/24/82
11/24/82
11/24/82
11/24/82
11/24/82
Figure Blue Cypress Lake - Inlet Radia ls.

Areao//o'o
Across Core Depth (in)WaterDepth(f t)
SampleDate
10 15 20 25 30i ' i * • i 35 40i • i i i i i
oCO
a>ca>O
x:i_o
0
10
20
30
40
50
60 SLT
Peat B
SLT BC
SLT
SLT S/C-
SLT SLT/S-
SLT SLT/S-
SLT/S
70 SLT S/C
r-S/CBC
•S/CBC
BC
BC
BC
80 SLT
90 SLT
100
S/C BC
Peat
•S/CBC
B
S/C-BC-
6.0 11/23/82
10.5 11/23/82
10.0 1/23/82
10.75 11/23/82
LO 11/23/82
11.75 1/23/82
10.5 1/23/82
10.0 11/23/82
10.0 1/23/82
10.0 11/23/82
6.0 11/23/82
Figure D-2 • Blue Cypress Lake - Longitudinal Transect.

Area
CD
aul
o/10
Across
0
20
40
60
80
100
Core Depth (in)
5 10 15 20 25 30i i . i . * i i i i i i i i i i i i i i i i i
S P/S B
+ -SLT S/C BC
SLT S/C-
SLT
-V BC
35
SLT
-- SLT P B
BC-
s/c
40
-*•
BC
WaterDepth( f t )
6.5
10.0
11.5
11.25
10.25
6.0
SampleDate
11/23/82
11/23/82
11/23/82
11/23/82
11/23/82
11/23/82
Figure 0-3 . Blue Cyp ress Lake - Transverse Transect .

Area
ina)£
i~a>
cCD
c/>aUt
Site(yd)
150
120
90
60
30
150
120
90
60
30
0
150
120
90
60
30
Core Depth (in)
5 10 15 20 25
Island prevented continuation of measurements.
SLT PD S PD/S S/C C B
SLT/PD S/C C B
SLT/PD S/C B
SLT/PD S/C C B
SLT PD S/C C B
SLT/PD S/C C B
S PD/C C S/C Q/r C C s/C Bo/L — *
SLT/PD S/C C B
SLT/PD PD PD/S S/C C B
SLT/PD PD S/C C B
SLT/PD S PD/S S/C C B
SLT/PD PD S/C C B
WaterDepth
( f t )
2.0
2.7
2.2
2.5
2.75
2.0
3.0
4.0
2.5
2.5
1.0
2.5
SampleDate
10/30/81
10/28/81
10/28/81
10/28/81
10/28/81
10/28/81
10/28/81
10/28/81
10/30/81
10/30/81
10/30/81
10/28/81
Figure D-4.. Lake Helen B lazes - Inlet Radials.
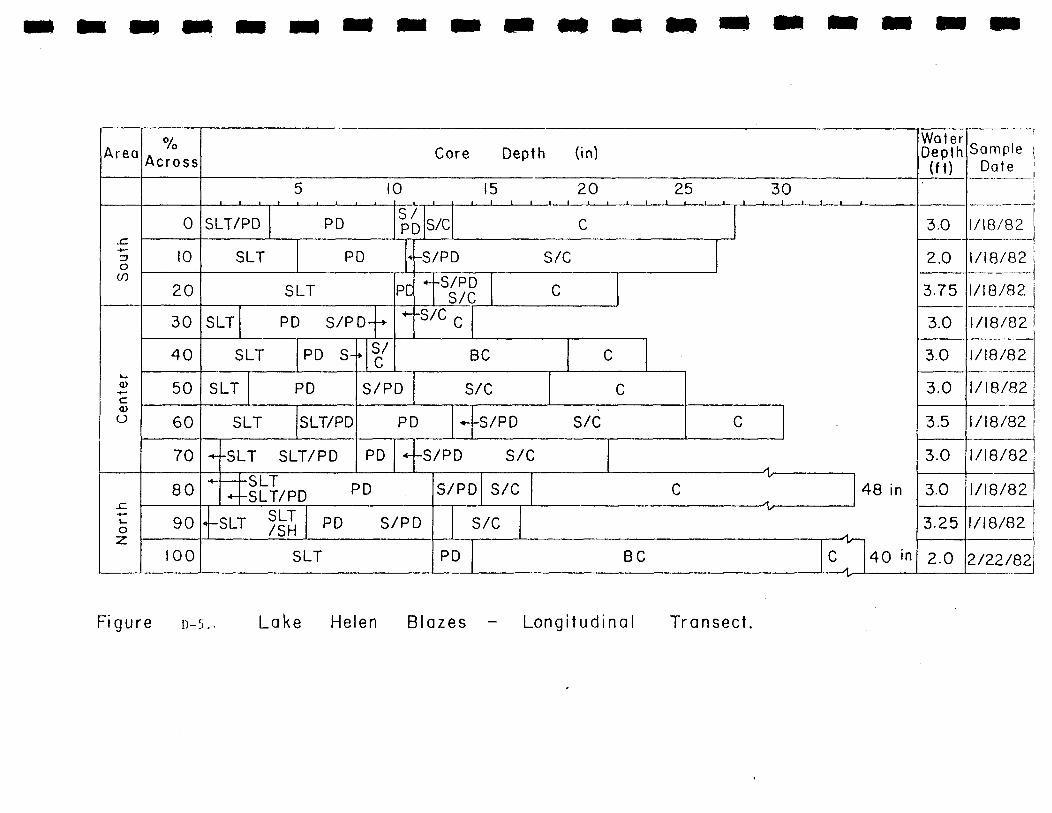
Area
o
Ce
nte
r
_ck_
oz
o//o
A c r o s s
0
10
20
30
40
50
60
70
80
90
100
Core
i i5
SLT/PD
SLT
PD
10i i
S/ c/rPD s/c
PD
SLT
SLT PD
SLT
SLT
S/PD
PD S-
PD
SLT SLT/PD
-- SLT SLT/PD
" SLT«- -SLT/PD
--SLT SLT/SH
»•
-*•
S/C
P:^-
Depth
15i i
(in)
20i i
25
C
-S/PD
f-S/PDS/C
-S/C C
S/C
C
BC
S/PD S/C
PD
PD
PD
PD
SLT
4-
•»-
C
C
-S/PD
-S/PD
S/PD
S/PD
S/C
S/C
S/C
S/C
PD
C
30i t I i
C
<\
>1
i
BC^\ -
C— t.
48 in
|40 in
WaterDepth
( f t )
3.0
2.0
3.75
3.0
3.0
3.0
3.5
3.0
3.0
3.25
2.0
iSample
Date (
1/18/82
1/18/82
1/18/82
1/18/82
1/18/82
1/18/82
1/18/82
1/18/82
1/18/82
1/18/82
2/22/82
Figure n-s.. Lake Helen B lazes - Longitudinal Transect .
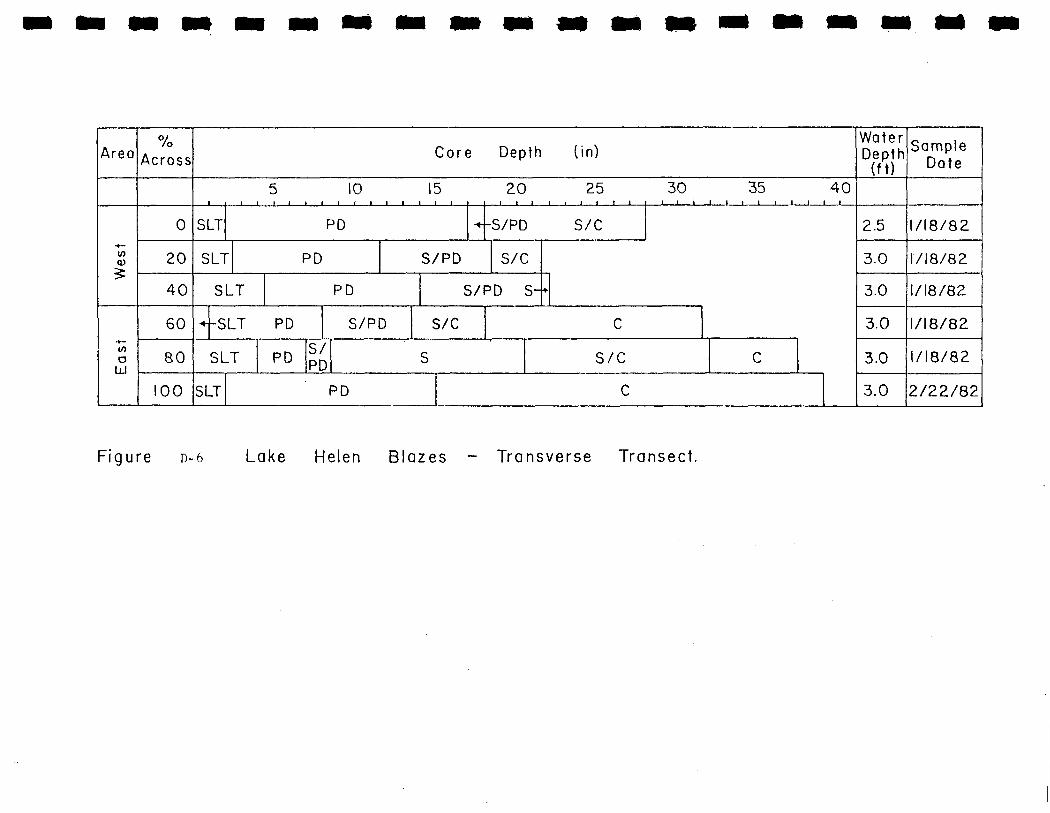
Area
i/>0)£
•V—
</>oLJ
01/o
Across
0
20
40
60
80
100
5 10
SLT PD
SLT PD
SLT PD
+ -SLT PD S/l
SLT PD S/
SLT PD
Core Depth
15 20
^-S/PD
S/PD S/C
S/PD S-
3D S/C
S
*
(in)
25i i i i i
S/C
C
S/C
30i i 4
35
C
i
C
40i
WaterDepth
( f t )
2.5
3.0
3.0
3.0
3.0
3.0
SampleDate
1/18/82
1/18/82
1/18/82
1/18/82
1/18/82
2/22/82
Figure D-6 Lake Helen Blazes - Transverse Transect.

Area
Ul
a>
OJ
ca>O
oLd
Site(yd)
150
120
90
60
30
150
120
90
60
30
0
150
120
90
60
30
C o r e
5
SLT PD
SLT SLT/PD
SLT P
PD/S
D
SLT SLT/PD
SLT SLT/bLI PD
SLT SLT/
SLT PD
SLT
PD
PD
*-
S/PD
-PD/S
PD
S
Depth
10
S S/C
PD
S
.-..-S:-.
PD
P
S/C
S
PD/S
SLT S/PD S
"5 SpLT S S/C C
SLT
(in)
i i
C
15i i
B
S
S/C
S/C
D
S
S/C
c
cS
BC
C
C
B
B
C B
B
S/C
S/C
S S/C
BC / c
BC
,
C
B
B
PD
SLT SLT/PD PD
SLT PD
SLT PD
SLT S
S
S
S
S/C
S S/C
S/C
S/C
C B
c
BC
C
B C
B
S/C
c
C B
20
B
W a t e rDepth
( f t )
2.5
2.0
2.0
2.0
2.0
3.5
3.5
3.0
3.5
3.0
4.0
3.0
3.0
3.0
3.5
3.0
SampleD a t e
11/6/81
11/6/81
11/6/81
1 1/6/81
11/6/81
10/30/81
10/30/81
10/30/81
10/30/81
10/30/81
10/30/81
10/30/81
0/30/81
10/30/81
10/30/81
0/30/81
Figure D-? • Lake S a w g r a s s - In le t R o d i a l s .
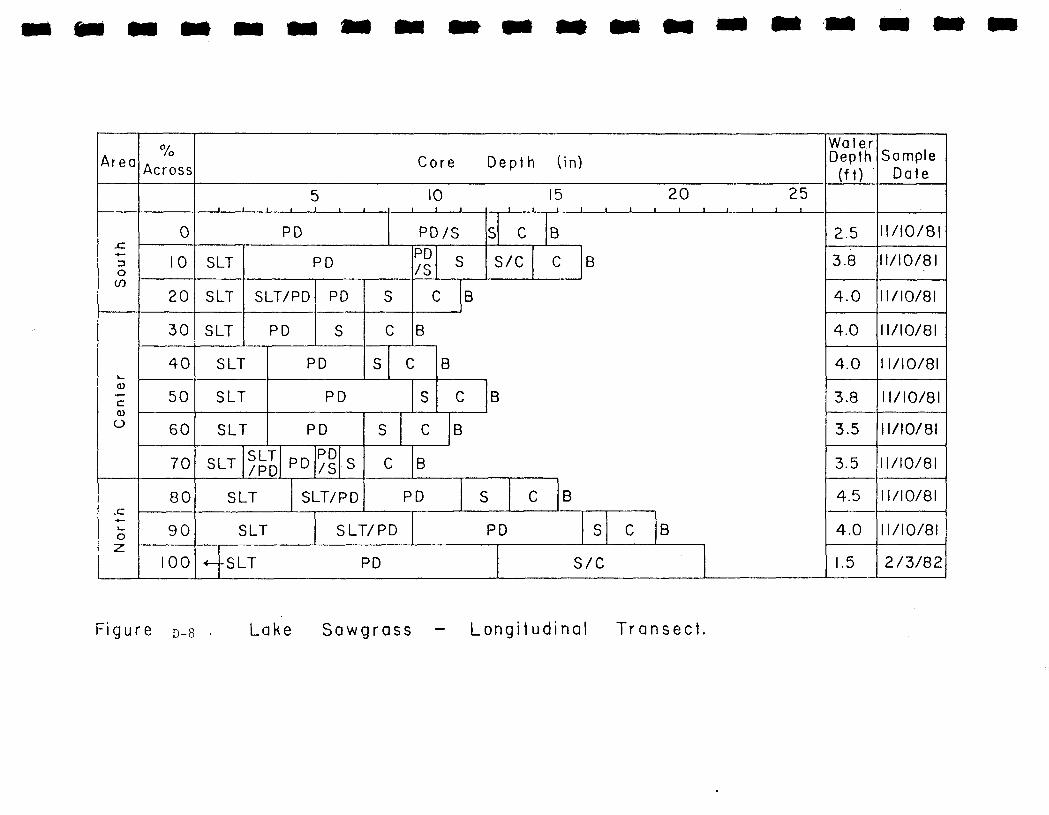
Area
JC.
rjo(/}
k.<D
c0)
O
.C•»—t—O
z:
o//o
Across
0
10
20
30
40
50
60
70
80
90
100
i
SLT
SLT
SLT
5
Co re De
10i t
PD
PD
SLT/PD
SLT
SLT
SLT
SLT
P D
PD
S
PD
PD/S
S
C
S
PD/S S
C
B
C
PD
SLT/PD
SLT
PD
PD
SLT
•«— -SLT
PD/S S
SLT/PD
S
S
C
c
B
iS
pth
C
s/c
(in)
15
B
C
i
B
i20
i25
j i i i
B
C
B
B
B
PD
SLT/PD
PD
S C B
PD S C B
S/C
W a t e rDepth
( f t )
2.5
3.8
4.0
4.0
4.0
3.8
3.5
3.5
4.5
4.0
1.5
SampleDate
11/10/81
1 1/10/8 1
11/10/81
11/10/81
11/10/81
11/10/81
11/10/81
11/10/81
11/10/81
11/10/81
2/3/82
Figure D-8 • Lake S a w g r a s s - Longi tudinal T ransec t .

A r e a
*+—wCD
£
inO
UJ
o//o
Across
0
20
40
60
80
100
Core Depth
5 101 4 I 1 1 1 1 1 f
(in)
SLT PD. PD
SLT PD /s
I15
S
S
C
C
B
SLT PD
«--SLT PD PD/S S S/C
SLT PD/S S C B
SLT PD/S S
C B
S/C
B
i
S
C B
i i
S/C
20
C B
WaterDepth
( f t )
3.0
4.0
4.0
3.75
3.5
3.5
SampleDate
11/20/81
11/20/81
11/20/81
11/20/81
11/20/81
11/10/81
Figure Lake S a w g r a s s T r a n s v e r s e Transect .

Area
0)
L.
0>
c
o"
toa
UJ
Site(yd)
150
120
90
60
30
150
120
90
60
30
0
150
120
90
60
30
Core Depth (in)
-[SLT
5 10i i i L i i i 1 i i i
15 20
1 1S PD PD/S S/C C
S/SLTL![I
S/PD C-S/PD PD/-S/SLT PD S S/C C
S/SLT S/PD S/SLT | PD --S/C C
S
S/ISLT
° J_ _ .S/PD
S/SLT
S/SLT
S/PD
S/SLT
S / lSLTI
S/C C 1 S/C C
S/PD C
SH S/cl C \By\ I ^
S/PD S/C BC/C
S/PD S/C BC/C
S C
4SLT S/SLT | PD S/C
S/SLT
*•«—
S/SLT
LSL"
S / P D S/C C
c
-SLT-S/SLT S/PD S/C C
SLT/PD PD S/PD C 1
•< —C / C 1 "T*W r W 1— • 1 l"l f 'l t* / /"^ (~*
-S/PD PU S/C C
WaterDepth
( f t )
5.0
4.25
4.0
3.5
4.5
4.5
4.5
4.0
4.0
3.75
6.0
4.0
3.5
4.0
4.0
3.5
SampleDale
1/8/82
1/8/82
1/8/82 !
1/8/82
1/8/82
1/8/82
1/8/82
1/8/82
1/8/82
/8/82
1/8/82
1/8/82
78/82
78/82
78/82
/8/82
Figure D_] n • Lake W a s h i n g t o n - Inlet R a d i a l s .

Area0110
AcrossC o r e Dep th ( in)
WaterDepth( f t )
SampleDate
O(S)
a)c0)
O
O
z:
10 15 20 25 30
0 SLT
10 S/SLT
20 S/SLT
30
SLT/C
-SLTSLT/S
40 SLT
BC
SLT/PD
50 SLT
-S/C
BC
60 SLT BC
70 SLT BC
80 SLT
90 SLT
100 hSLTS/C
SLT/CS/C
S/C
35
2.5
5.5
5.0
6.0
6.0
6.5
6.5
6.5
6.5
6.0
3.0
3/12/82
3/12/82
3/12/82
3/12/82
3/12/82
3/12/82
3/12/82
3/12/82
3/12/82
3/12/82
3/12/82
Figure n-ii. Lake W a s h i n g t o n - Longi tudinal T ransec t .

Area
(/)OLJ
(/)CD5
%
A c r o s s
0
20
40
60
80
100
C o r e D e p t h
i i i
S
SLT
51 i i
10i f i i
S/C
S/SLT
S
SLT
SLT s/bLI SLT
LT
S/C
SLT/S
S
(in)
15I I 1 i i i
C
S/C
S/SLT
C
S/C S/C/SH
S
20 25i i t i i i i i
C
SLT/
C
C
S/C
C
W a t e rDepth
( f t )
2.0
6.0
6.5
6.25
5.0
2.5
SampleDate
2/24/82
2/24/82
2/24/82
2/24/82
2/24/82
2/24/82
F igu re D_12. Lake W a s h i n g t o n - T r a n s v e r s e T r a n s e c t .

Area
«, g
t_0)
C
a
Site(yd)
150-
120i
90
60
30i
150
120;
90|-
60i
30
O j
150;
120
S 90-LJ — - - - :
Core De
5 10.1 i . .. i . i . i i . . i . i
hSLT S/SLT S S/v>
4- SLT S/SLT |c BC" """D r*IH-s/c BC
S/SLT S S/SLT S | |/?TJ
S/SLT S S/"i - • •
-4 SLT S/SLT
SLT S/SLT S S/BC
IsLT S/SLT S S/BC1
SLT S/SLT SoX S/C- - - - - ^ -
«-- SLT S/SLT S
S/SLT S C S/C
-H- SLT S/SLT S Q% S
<-SLT S S/SLT S
^SLT S/SLT ] S S/1 . . . . . ....
60 -H SLT ILJ S S/C S; | . . . . 1 . . . .
; 30 f/51 7 S/SLT
J Waterpth (in) ; Depth
15 20 25I I 1 I I I 1 ! 1
5.0
5.0
SampleDate
10/22/82
10/22/82
6.5 JIO/22/82
S/SLT | 5.0 10/22/82
BC 4.0 10/22/82•,._.__, _
S/BC C 5.0 10/22/82
BC 6.0 10/22/82
S£C_^ 5.5 10/22/82o *•
1 5.5 10/22/82
5.0 10/22/82
3.0 10/22/82
SC 5.0 10/22/82
5.0 10/22/82
C S 4.5.__,_
4.0
4.5
10/22/82
10/22/82
10/22/82
Figure D-13. Lake Winder - Inlet Radia ls
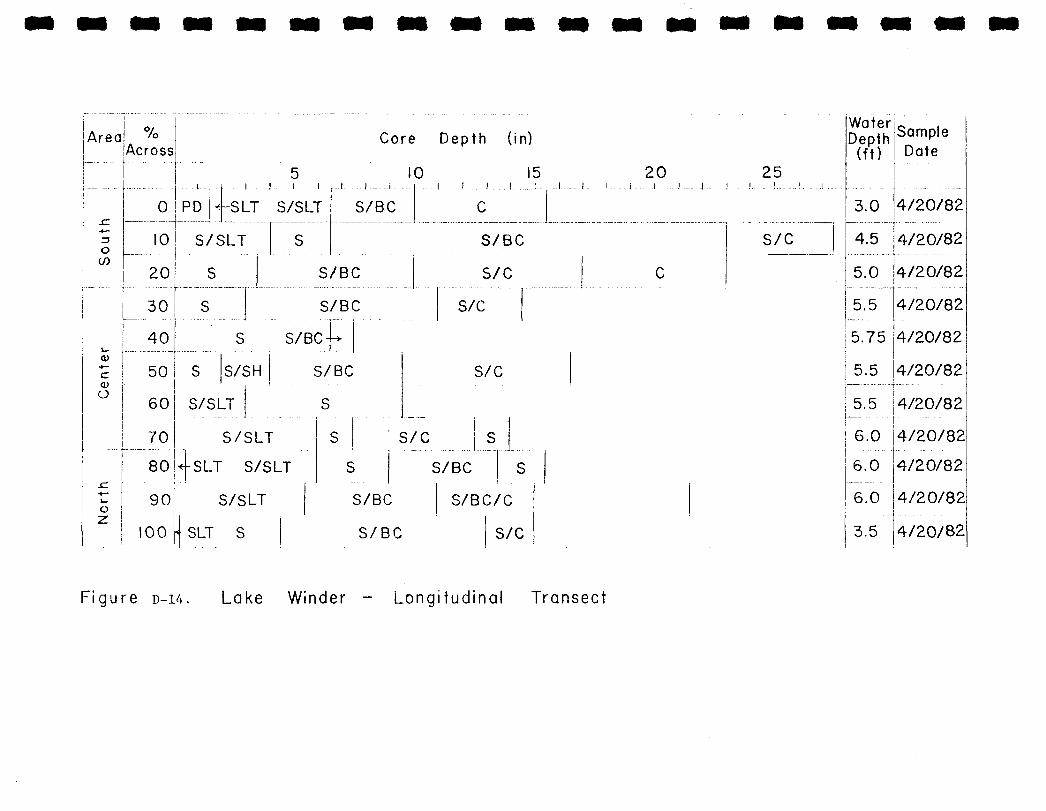
Area
x:•*—ZJO(S)
Ce
nte
r
.C-*—L~o
Across
0
10
20
30
40
50
60
70
5. . . i . i i ...i .
PD <-SLT S/SLT
Core
1
S/BC
S/SLT S
S S/BC
S S/B
S S/BCJ-*
S S/SH S/BC
S/SLT S
S/SLT S
r\
80 <[sLT S/SLT S
90 S/SLT S/BC
IOO^j-SLT S S/E
«
N
C
0
Depth
i ... i
C
i...
(in)
15! 1 !
1S/BC
S/C
3/C
c
S/C
s/c
S
5/BC
S/B(
.
:/
s
'C
3/C
20! i 1 l._.
C
.. J25
. .. !.. . 1 ...I. - .!
s/c
WaterDepth
( f t )
3.0
4.5
5.0
5.5
5.75
5.5
5.5
6.0
6.0
6.0
3.5
SampleDate
4/20/82
4/20/82
4/20/82
4/20/82
4/20/82
4/20/82
4/20/82
4/20/82
4/20/82
4/20/82
4/20/82
Figure D-14. Lake Winder - Longitudinal Transect

Area
w0)
•*—
(/)o
UJ
01lo
Ac ross
0
20
40
60
80
100
S/SLT
SLT
JjS/SLT
Cor
51
e Depth ( in)
S/C
S/SLT
S/SLT S/C
S/SLT
4- -SLT
4-SLT
S/SLT S
10i i i
S/C
It i 15
t i i i
_,_i c
C
BC |S/C
S/SLT
S/C
BC
WaterDepth
(ft)
5.0
7.0
7.5
7.5
6.0
4.0
SampleD a t e
10/22/82
10/22/82
10/22/82
10/22/82
10/22/82
10/22/82
Figure D-IS. Lake Winder - T r a n s v e r s e T ransec t .

Area
wa>
a>O
(n0
UJ
Site(yd)
150
120
90
60
30
150
120
90,
60
30• -
0
150
120
90
60
Core Depth (in)
5 10 15 20I l _ ' f J J 1 | | I 1 1 1 1 1 1 1 L. .. 1
SLT SLT/PD S 1 S/C
SLT S/SLT S/C
SLT IPD/S BC I s/c
Is/SLT S/SH S/C 1
SLT SLT/PD ~T S S/C C
S/SLT S/SH S/C S S/C
S/SLT S/C C
S 1 S/SLT S/C 1 C
"tSl-T S/SLT S/Cif r>~| -T- """ " """ "^ oLI c r
«- -S/SLT b ^
-SLT C
SLT C
SLT S/SLT S/C C
SLT S/SLT S S/SH BC/S C
SLT S/SLT S/C C
*j"SLT S/SLT S/C C
WaterDepth( f t )
5.5
5.5
5.0
5.0
5.0
5.0
5.5
6.5
7.5
10.5
II. 0
7.5
6.5
6.0
6.0
6.0
SampleDate
10/22/82
10/22/82
10/22/82
10/22/82
10/22/82
10/22/82
10/22/82
10/22/82
10/22/82
10/22/82
10/22/82
10/22/82
10/22/82
10/22/82
10/22/82
10/22/82
Figure D-ie. Lake Poinsett - Inlet Radials

Area A %
Acrossii
3O
CO
0
10
20
30
40£ r —1 L-5?0
Core Depth
5. L
^SLT S/1 s c.
S/C
•t4-SLT1 S/SLT
SLT
- .1 ... 1 J ..
S/C
._ -L10
, i i
BC
BC
c
S/SLT
_
(in)
. .
S/C
S/c
15.. i .. .
C
SLT""
S/SLT
60 S/SLT
70
f.02
S/SLTi
80
90
S/C
S/BC
20. . _. j
B
S/SLT
S/C
c
S/SLT
S/SLTi
100
S/C
S/BC
C
S s/c
C
c
S/SH
1 1
S/C/SH
C
Rh Sample| (ft) Datei
25j i
4.75 11/3/82
6.0 11/3/82
6.5 11/3/82
7.0 11/3/82
7.5 11/3/82
7.5 11/3/82
6.0 11/3/82
7.0
6.5_
6.0
3.0
11/3/82
11/3/82
11/3/82
11/3/82
Hgure D-I?. Lake Poinsett - Longitudinal Transect

Area
0)
^
0UJ
AcrossCore Depth (in)
5._ ...i i
SLT
20 S/SLT
40 S/SLT
60 S/SLT
80 |SLTS/SLT
100 | S/SLT] s
101 1 _ 1
PD/S
S/C
S/C
S/C
S/C
. ! i15
1 !
BC
BC
BC
S/C
C
"
1
'
BC
WaterDepth
(ft)
SampleDate
1;i
4.25 11/3/82;
6.0 11/3/82
6.5 11/3/82
7.0 11/3/82j 1
5.5
4.5
11/3/82
1/3/82
Figure D-is . Lake Poinseit - Transverse Transect

IIIIIIIIIIIIIIIIIII
APPENDIX E
Bathymetric Profiles

o
•f<*:
1OO
,) 73 CHART 743O-1G01-G1, 1t~.r\i i ^i*.t
L.IHRATE 15O
DEPTH IN FEET
O
RAYTHEON CO.5O
msn^^^mij^£ • " • ' ' • " ";|r l''l - i f ' ' • • - ''•', ' !'-*'• ••"••**.- *' . • . ' .' •'. •• :• ' ,
-1OO-
w?n•""in?
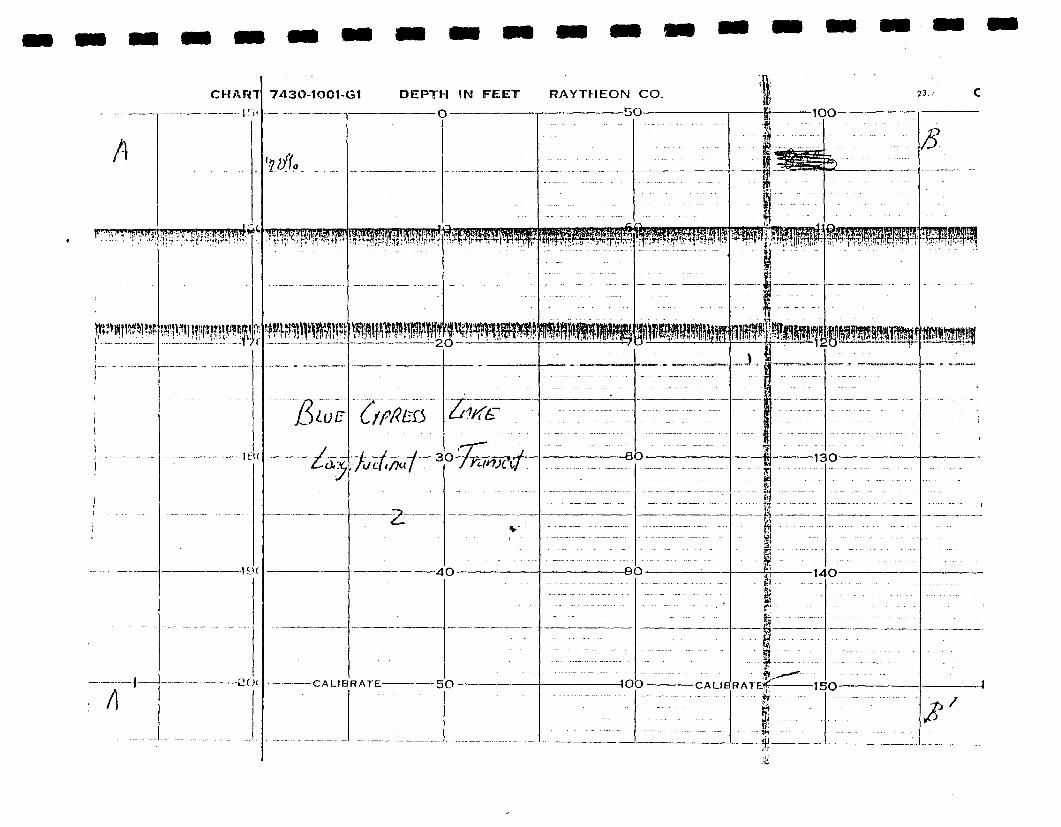
23.,
A
A

:HART 7430-1O01-G1 DEPTH IN FEET

DEPTH IN FEET RAYTHEON OOO1-G1
O
6
2O
3O-
4O-
ITE 1 5O --
6
.7C-^-
IT7
V-
-SCkCH)
-9C
-IOC
DEPTH IN FEET
O
-~,.JLO:
-3O-
-4O-
CALIBRATE- -5O-
RAYTHEON CO.
50
23
-70-
-8O-
-9O-
-100-
D
-130-
-14O-
HOO CALIBRATE -15O-

CHART 743O-1OO1-G11! ;<) —
0
iao-
DEPTH IN FEET
O
"
Pt^-JfMU
-jr
t
-4O-
,'?()O CALIHUATE- -50-
RAYTHEON CO.
bO
-8O-
-9O-
-1OO
fit
-13O-
-14O-
—1OO CALIBRATE 15O
CHAWT 743O-I
-18O:
-I9O-
-2OO-

IN FEET RAYTHEON CO. 13&-CHART 743ti-1OOi-G1 DEPTH IN FEET RAYTHE
3-
o
-^
f
-9O-
-1OO- -CALIBRATE
-100-
-13O"
-140-
-15O —
. n. ";..o^^
-18O -
-19O-
20O-
-3O:
-4O-
-CALIBRATE- 50-
6-
' i - j

ON CO.
6
-HO-
-1OO-
6
23 CHART 743O-10O1-G1 DEPTH IN FEET RAYTHEON CO.
-100-
Q
-13O-
-14O-
:ALIBRATE- -15O-
-150-
m
-18O-
-19O-
-200-
-o
-CALIBRATE-
-50-
-3O-
-4O-
-5O-
-80
-90-
-1OO- CALI&
I

100
t-ky. -!|
130-^r^—-
]4O.
RATE 15O-
11 '
CH
S
7430-1O01-G1
15O-
$»_
-ieo-
-19O-
DEPTH IN FEET RAYTHEON CO.
O 1 5O-
-3O —
-4O-
2OO CALIBRATE- -50-
-00-
-90-
-100-
-13O-
\OO CAl IBRATE ISO
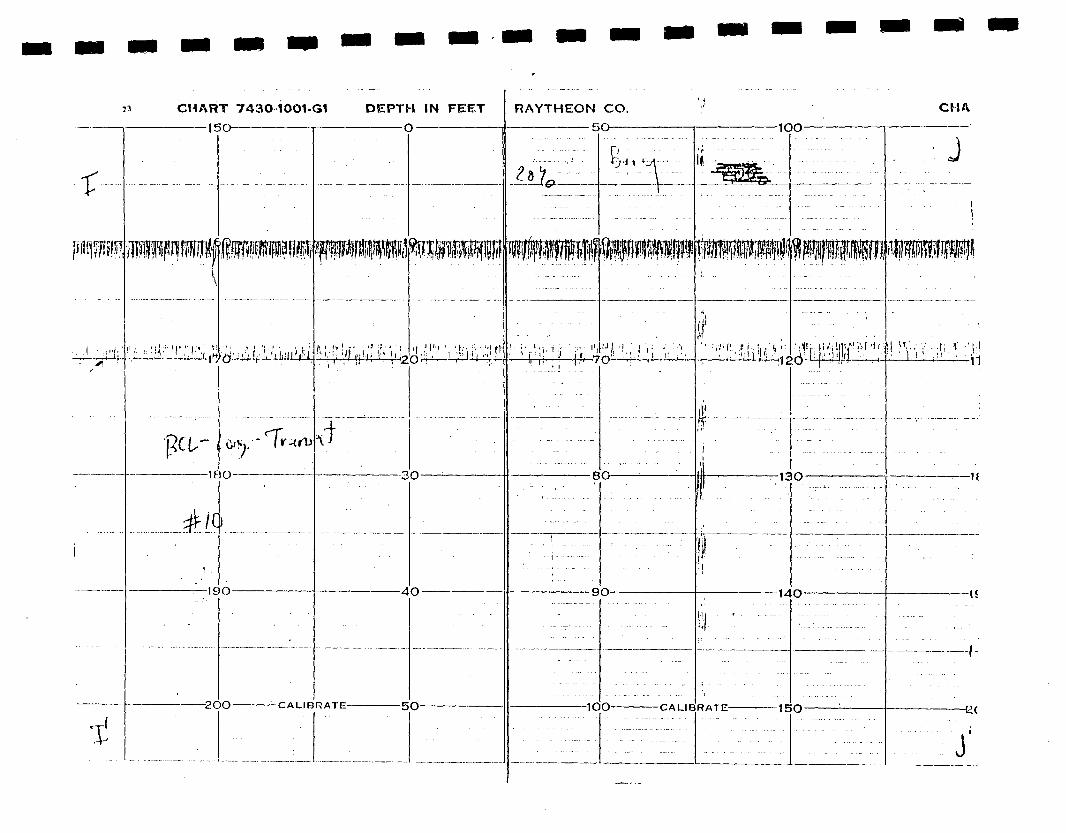
33 CHART 743O 10O1-G1
150
.
,v -^i O'S. i'r-
~1OO-
-19O-
DEPTH IN FEET
O
JO-
-4O-
-2OO ^-CALIBRATE- -5O-
RAYTHEON CO.
50CHA
P-'-
-70-
-100-
-80-
-9O- -T4O-
1OO CALIBRATE 1 5O
J
-H
-ȣ

ni 743O-1OO1-G1
\
7O-
iD--
DEPTH IN FEET
O
^__i|L 20 .Tj___
-30-
-4O-
•o- -CALmRATE- -50-
RAYTHEON CO.
so—
—so—
-9O-
-100-
-13O-
HOO CALIBRATE 1 5Q
23 CHART 743O-1OO1-G1
150
P. ouu . - iii —
• J i
-18O—
-190-
-2OO- -CALIBF?A
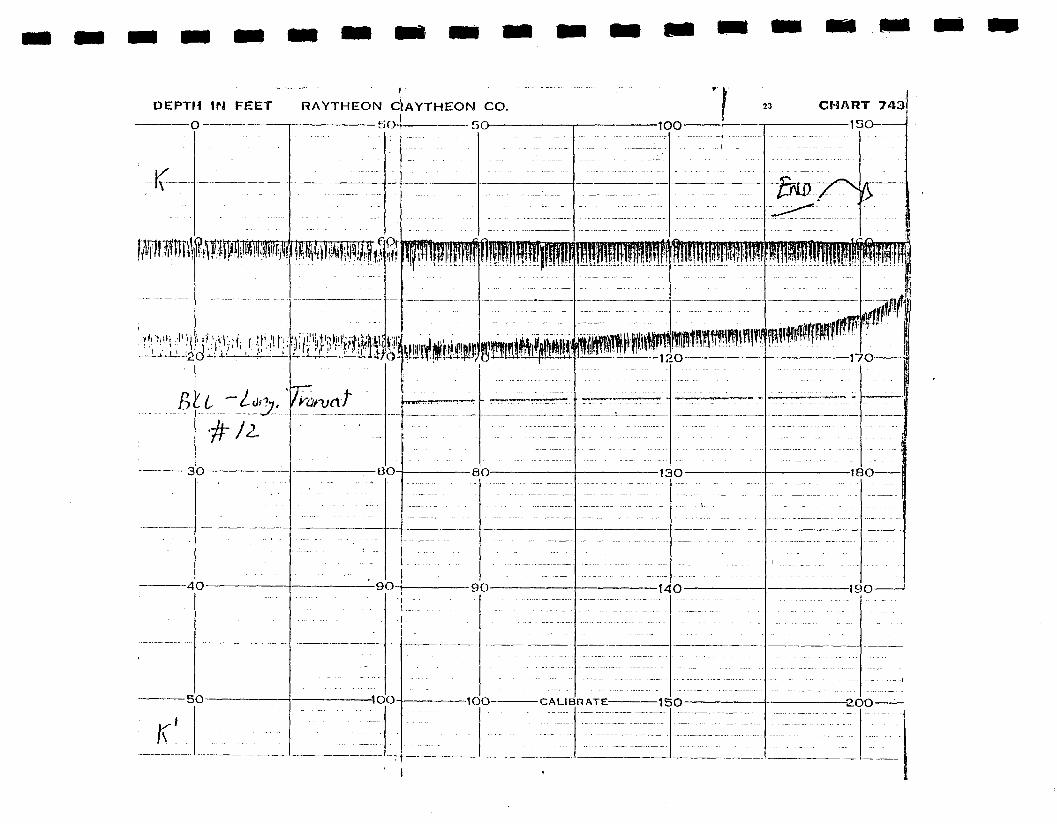
DEPTH IN FEET RAYTHEON dAYTHEON CO.
- f,o| 50

i '
23 CHART 743O-10O1-G1
I -3 O
120- O-
DEPTH IN FEET
O
RAYTF EON CO.
-20 __-7o
-100— -3O- -8O-
VL
14O- -19O- -4O- -90-
— CALini'lATE- -15O- -soo- -CALIEIRATE- -5O-
-14
-IOO -CALIBRATE

" ....... • ........ \CHART 743O-1O01-G1 DEPTH IN FEET
o/I
,o
o
.I' JFVTE ifi*TOJ^T
V
' • * ' '.- :
******• - ' "
If.
CL ,
z.1 C
in
rztshrtto
t~)
1 'rf
$
i»i.i'!: ' lp ' '• r ' '"xi.
J):
J
.'• . , o
i!,
It
T"
1 '
L
;-
RAYTHEON CO.
50
\
-8O-
-90-
-^OO
-100-
-13O-
-140-
-CALIBRATE -15O-


c
LIBRATE-
-100-23 CHART 743O-1OO1-G1 DEPTH IN FEET RAYTHEON CO.
-13O-
Ba :.
-14O-
-15O-
O-
T'.d,
-19O-
}-|f ^ IP |
-20-
-30-
-40-
SOO CALIBRATE- -50-
£&s
7O-
8O-
-90-
-1OO
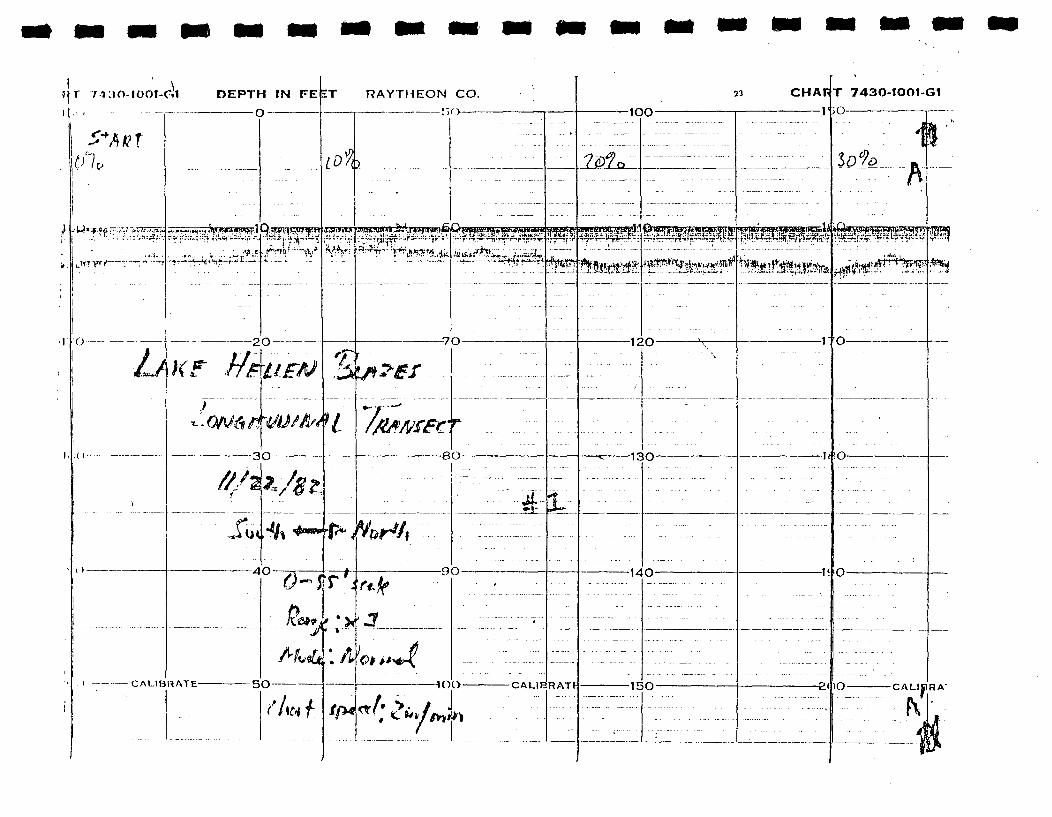
?j t 74;iO-IOO1-O1 DEPTH IN FE
O
IT RAYTHEON CO.
+A-KT
i-J»3:.pa "^77»7S»^
l'\ -20-
ffe-t
3O
-40-
CALIBRATE 5O
-7O-
-80-
rr : -9O-
>f ^M^ g»ifgi«i«;-jjii jt«w.j!.!fai tgi
•J>.V/> J
HOO CALIBRATE
23 CHAF
T
-13O-
-14O-
-15O-
-1!
T 743Q-1OO1-G1
t
$&gsg3jgsi8i
o-
o-
o-
O CALIBRA"

DKPTH IN FE|ET RAYTHEON co."O
/J.
-20
3O —i
40
re—f 50-
A
-7O-
-80-
90
-1OO -CALIBRATf
CHA
-12O
5O-
»T 743O-1OO1-G1
3O-
9O-
)O-
DEPTH IN ff\ , ;
-CALIBRATE-
-2O
-3O-
-4O-
-5O-

vi $ IDEPTH IN FEET

RAYTHEON co. \ • ,
v'
-7O —
M
—oo-
/•; - A*
OQ-
1OO-
-120-
r-130-
-14O-
-CALIBRATE- -15O-
5DJ.o.
e gJ/iW^u;
CHART 743O-1QOH-C51
_ ] • -,o—
DCTPTH IN FIFET RAYTHEON CO
_I7O
ino-
•'OO CALIBF7ATE-
o
1$m
20 —I
30-
4O-
5O~-
X

23 CHART 74J O-1OO1-G1
a_
DEPTH IN FEET
O
RA\ HEON CO.
>w*
Spraf
1-CALIBR
12O-
M
£
-13O-
-140-
TE -15O-
-1RO-
-1PO-
O- -CALIDRATE-
-2O
-3O-
-5O-
-7O-
-QO-
Jf.)O- CALIDRATE-I

-10O-
r/*
-13O-
-14O —
CHART 743O-1OO1-G1
/I HO-
DEPTH IN FEET RAYTHEON CO.
— 17O
-too-
/ v
]$;f»RmR5$ifc«'•:-il*'-V'-w.--l-*;-?->-ri 'r
^o-
-no-
-90-
—ic>n —
-13O-
-14O-
I5O-
• 'T'>
-CALIBr?ATE- CALI3RATE- -15O-

CHART 743O-1OO
17O-
190-
U7 DEPTH UN FEET RAYTHEONy~*
-2Oi
* QK
rm/-4O-
CALIBRATE 5O~
•:,(>i!_^
_ V t-!
Ofe ri
V-T1"r:;:I
_7O—
-9O-

23 CHART 741JJO-1OO1-G1

23
1OO

43O-1001-G1

EPTH IN FEET RAYTHEON CO,/•>! <--•-, ' i* * t( >
ft-
>
"1
10 '»
i ' Ift!^i 'finis
-2O — -
4O
5O
K
preppi
-7O-
l|.-.iV V ; ,'•
—8O-
z
i
-100-
.. ( I
-i??
-ISO-
CHART 743O,-tOO1-G1 DEPTH IN
r— 150
-14O-
-1OO CALIBRATE -15O-
-18O-
-19O-
-2OO-
-30-
-4O-
-CALIBRATE- -50-

*" >" .... , "
1 HEON CO.'
CHART.743O-1O01-G1 . DEPTH IN FEET
All i fM. J«|
I-7O-
8O-
-15O
itiimum
-120-
-14O-
1( ) ( ) CALIBRATE— -ISO-
B
lit!-17O-
-18O
-19O-
-20O-
!i Wi
II
-20-
-30-
-40-
-CALIBRATE- -50-
THEON CO.r>o
<r
-7O-
-8O-
-9O—
—1OO-
c

4 O/"^- - - - lovj .
—MO-
if* AT E—
, CHART 743O-1001-G1 , DEPTH IN FEET RAYTHEON CO.
-1 no— 1 : o ——' ^-i 5O-
^7WB°-s/
-19O-
-2OO-
-3O-
-4O-
-CALIBRATE- -50-
-80
-9O-
-100-
-1OC
-12(
-13(
-14C
-CAUIBRATE- -15C
_JJ
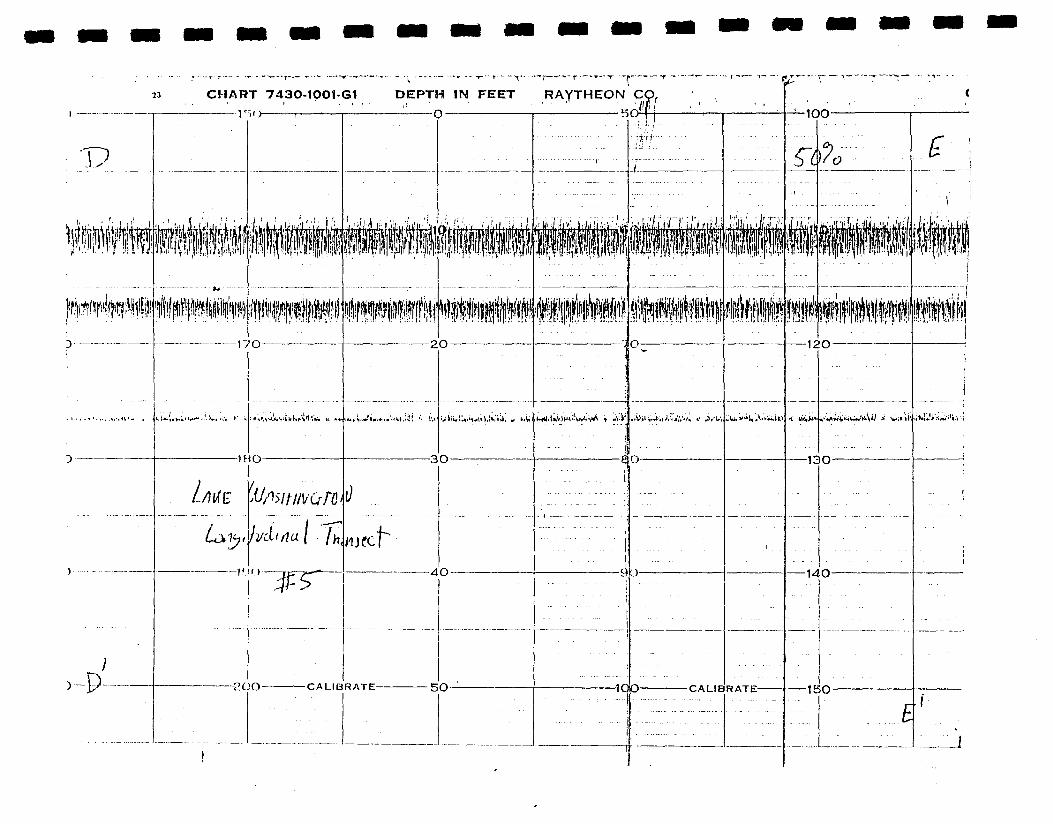
CHART 743O-10O1-GI DEPTH IN FEET RAyTHEON CO.
2OO CALIBRATEx
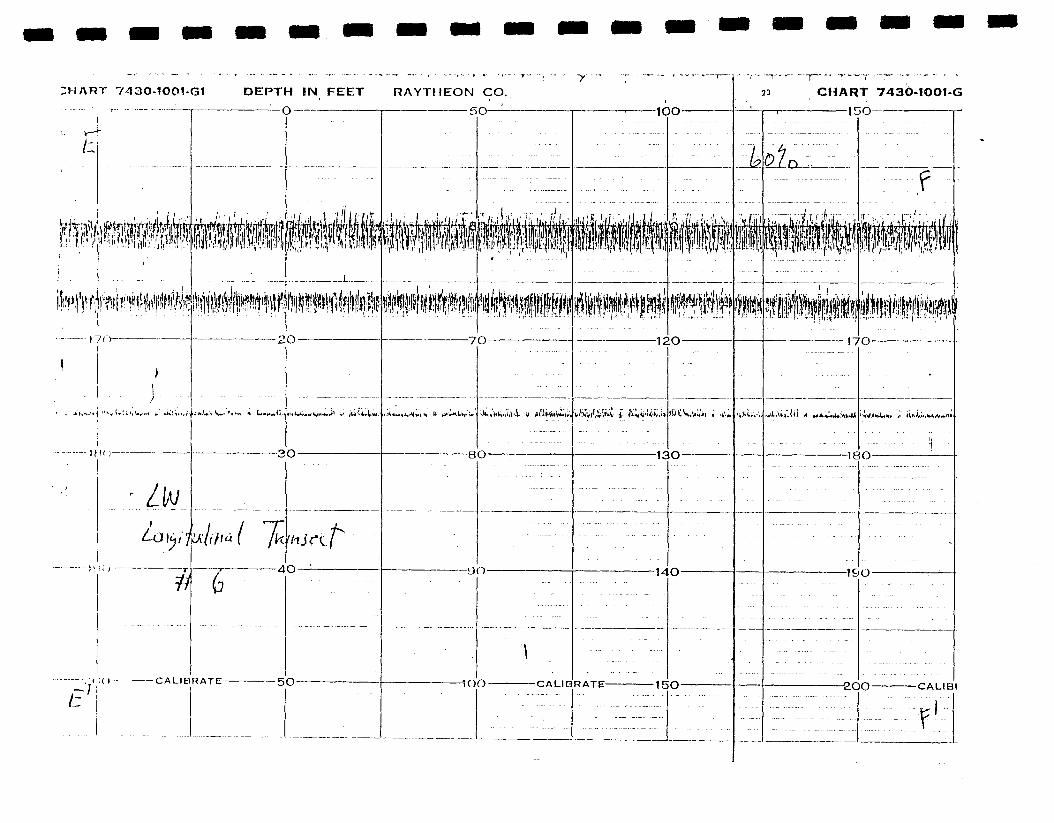
;ilART 743O-1O01-G1 DEPTH IN FEET
_o
CHART 743O-1OO1-G
t
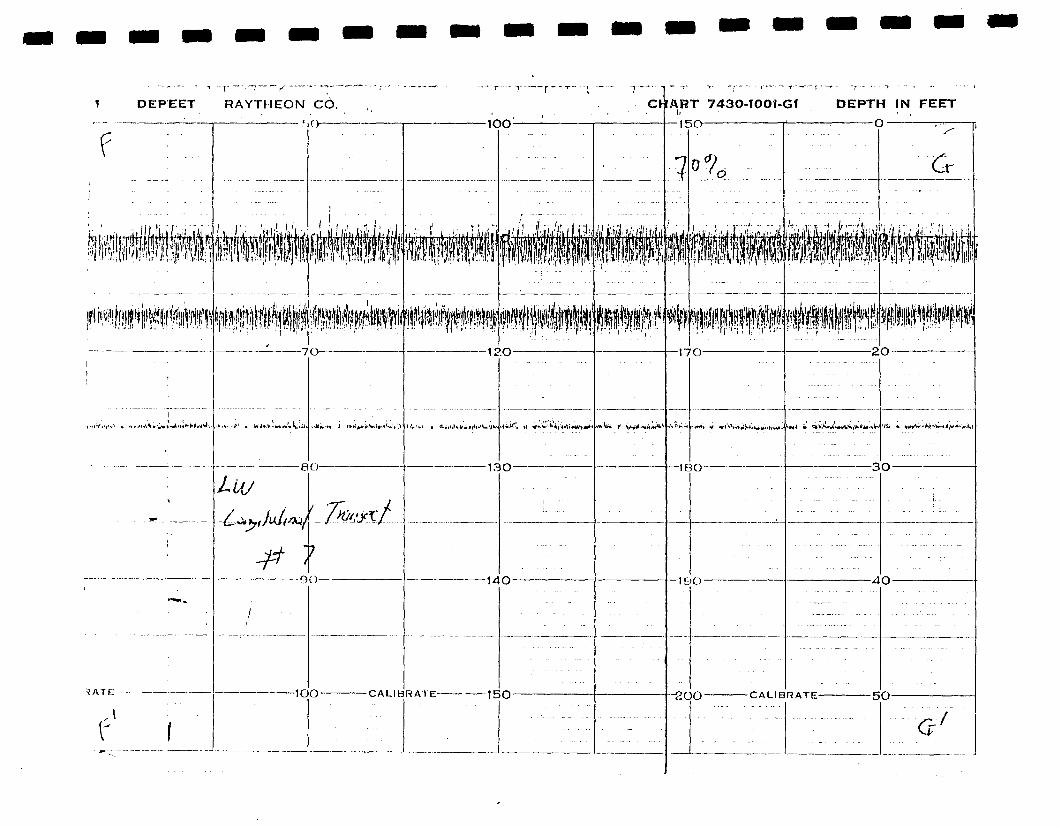
1 DEPEET
f
f I
RAYTHEON CO.
<>o
CHART 743O-10O1-G1 DEPTH IN FEET
-eo-
Luj-£**r,M#y
J-9O-
-100- -CALIBRATE
-130-
-14O-
-15O-
T._ -„ ^.-_^..- T ,
—180-
-2OO- -CALIBRATE-
-30-
-4O-
-5O-

RAYTHEON CO. 23
-7O-
HO-
AKf b
1OO- -CALIBRATE
-12O-
"'•»•, %*f!^W»*M'*.**
'u / /rq/7^
-14O-
-15O-
CHART 749O-tOi
J ISO- :—
-17O~
«0.'rV,m^U4,ylBi,*V
-100-
-2OO- -CA
I-G1 DEPTH IN FEET
6 —
-20-
-3O-
-40-
.IBRATE- -5O-
RAYJHE9N CO.: j-,Q
\L
-7O™
^4>tU<f(Vli».*'1-"l* . *H'
-so-
-9O-
•100-

H
Sip;
120
-13O-
—14O —
- CALIE RATE 15O-
| — •;- ( - • -' - f ' , --- -f i •>
CHART 7430-1001-Gl DEP
1'K)
17O-I
-180—
-19O-
2O-
-2OO- -CALIBRATE-
H IN FEET
O —
3O-
4O-
RAYTHEON CO.
—'- 5.'0—-
-7O-
3O-
-9O
-100-
iii
-CALIBRATE-

1OO-
-12!O
13O-
MO-
15O-
23 CHART 743O-1OOI-G1
'•—i ;30—
UK
l
BYi W '-MF
- I.
—17O-
-T8O-
• (T....
-I9O-
Jt/o
-20O-
DEPTH IN FEETo——'——r
-CALIBRATE-
-2O-
-3O-
-40-
-5O-
fTHEON CO.
-fifi 5O——
pj-\
-7O-
QF
-90-
id
-it
-13
-14
-100- -CALIBRATE-

CHART 7430-1OO1-G1 DEPTH IN FEET
-. 1OO
IT/) -T
-12O-
-15O-
-17O-
-IBO-
-1MO-
Y) / )
-20O-
2O-
-30-
-40-
-CALIBRATE—- -5O-
RAYTHEON CO.
iiiiiii-7O-
-8O
-90-
-100-
-100-
I-
-120
-13O-
-14O-
-CALIBRATE- -15O-
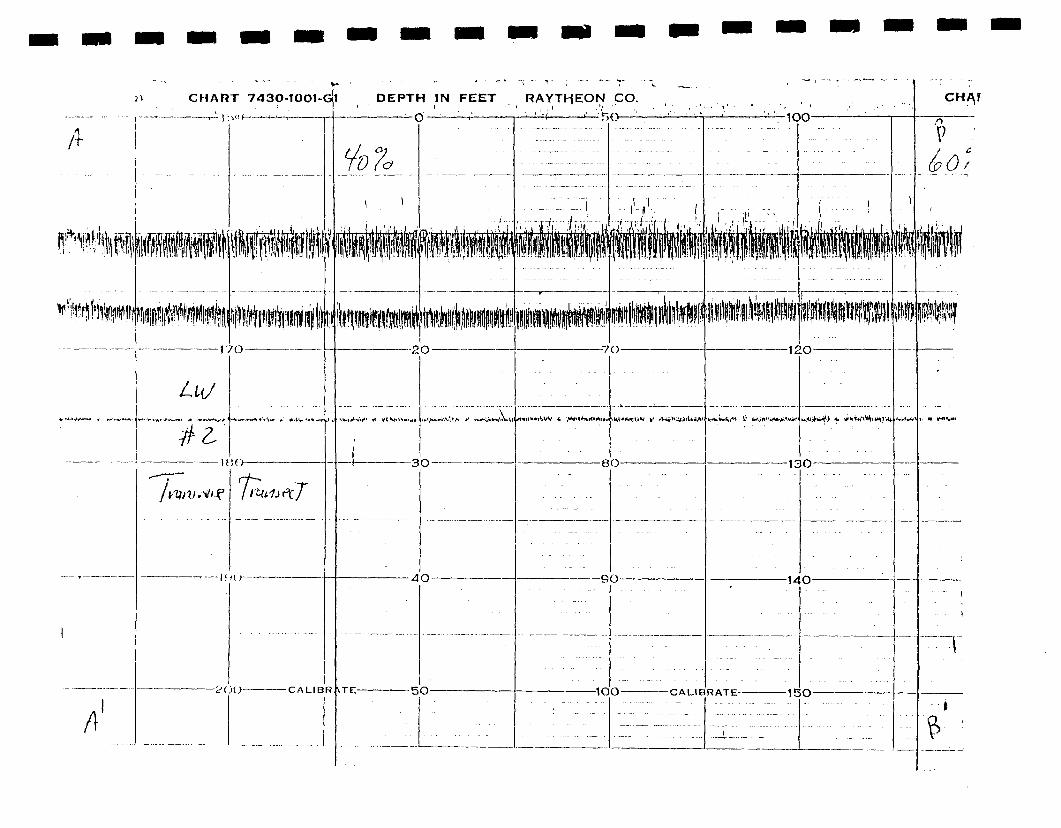
21 CHART 7430-1001-G DEPTH IN FEET RAYTHEON CO.
— 6 —; —r • 1 • ' '';i'—•—^SO-
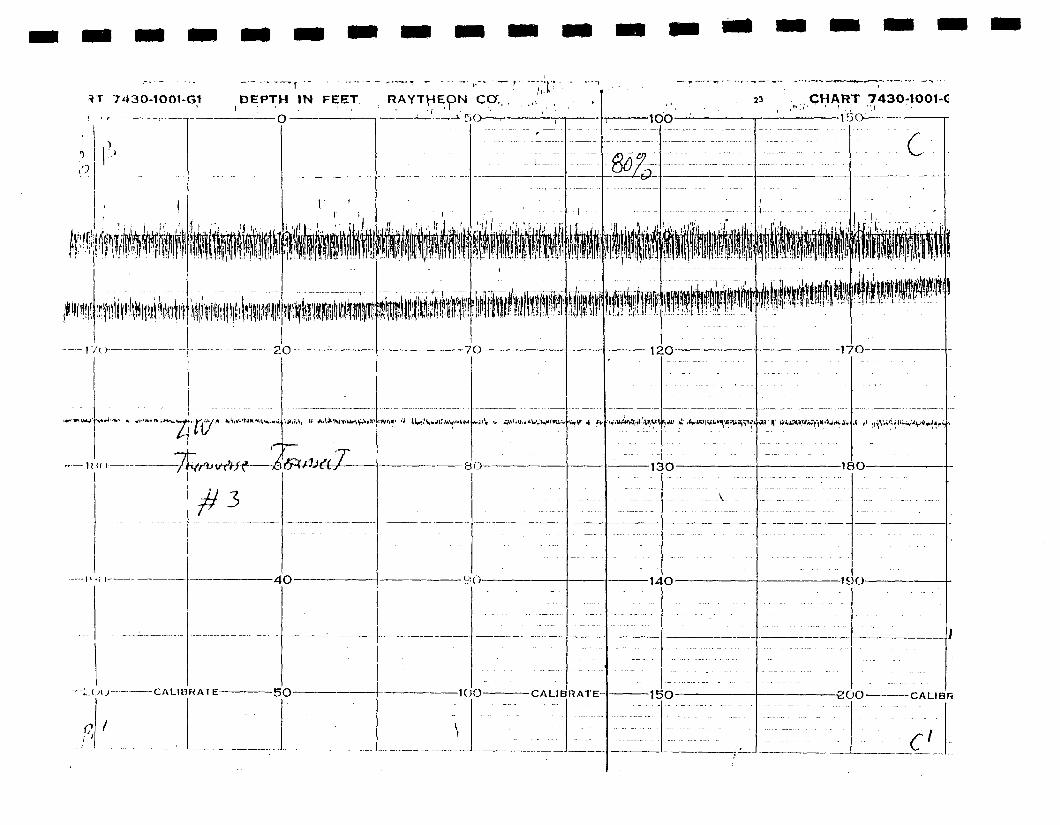
*T 743O-1OOI-G1 DEPTH IN FEET RAYTHEfpN CCT. . ,,

cPEPTH IN,FEET

RT 743O-1OO1-G CHART 7430-10'. .. - • ' • ••-.j. •• -.1 ' - ' . . • • ' • ' : '
I, O C / " *
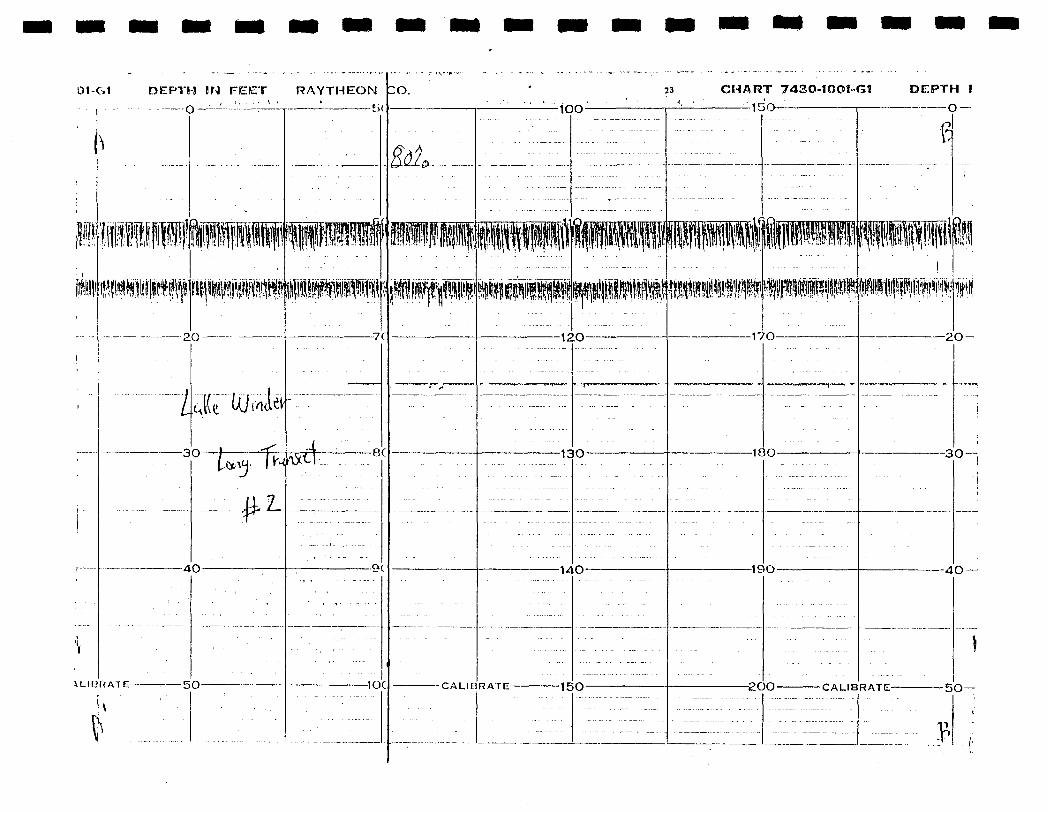
OI-G1 DEPTH IN FEET RAYTHEON
-3O-
-4O-
\LIBKATE : 5O-
-O.
-ac
-9C
-IOC
-13O-
-14O-
- CALIBRATE ISO-
CHART 743O-10O1 G1
15O—
-TOO-
-190-
DEPTH I
^\
—3O—,
-4O-
-2OO CALIBRATE 5O~

IRAYTHEIDEPTH IN FEET
O
- l( H) CALIUHATE
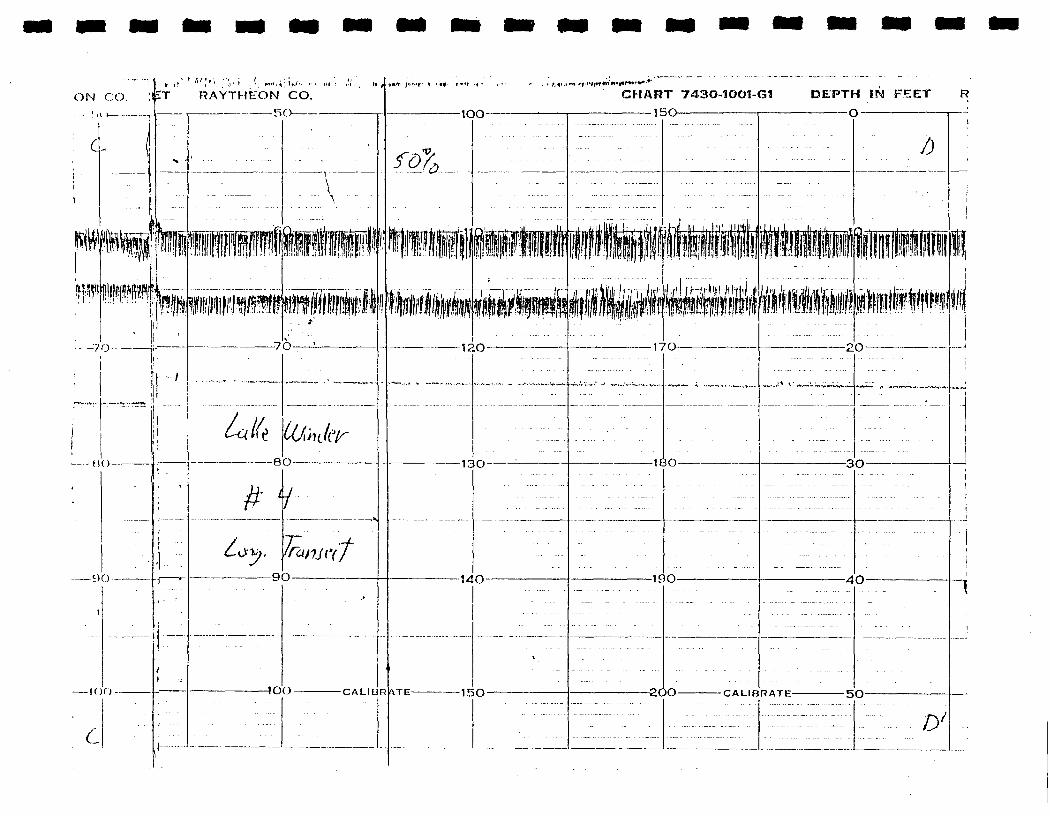
ON CO.k 1*. ' " > ' " ' . , l ' ' • ' .»*"'•»,' '•*•
DEPTH IN FEET
O
CHART 743Q-1O01-G1
ISO
£T RAYTHEON CO
iiiSilllftiiiiiii
c

AY HEON CO.
D
-8O-
L
9O-
-JOO- -CALIBRATE
-100-23 CHART 743O-1OO1-G1
ISO
120-
13O-
-14O
-15O-
-17O
18O-
-190-
OO-
DF PTH IN FEET
-CALIBRATE-
-o-RAYTHEON CO.
50
—2O
-3O-
-40-
—5O-
-7O-
-8O-
-9O-
-IOO
£'

CHART
-15CI -1OC
ssisiiiiiii
743O-1QO1I-G1 DEPTH IN FEET RAYTHEON CO,, , . ., . ' .' , - •> • H' i I • . i ' r '
o
-12C
// /v -^»
-13O- -3O- -8O-
-14O — -19C -4O- -9O-
-CALIBRATE- -15O- -2OC -CALIBRATE- -5O- -IOO- •CALIBRATE -15
f

CHART 743O-1OO1-G1 DEPTH IN FEET
o

OKPTH IN FEETV. RAYTHEON CO,
4O —
&>rr
*! -rr. 50-
&»&£#'*&<f 7$m*£<'r
-90-
-1OO- -CALIBRATE
1OO
-14O
-15O
-19O-
23 CHART 7430-IOOI-G^
150
DEPTH IN FE
-4O-
-2OO CALIBRATE- 3O-
ft'

e r J RAYTHEON co, . CHAI3T 7430-1O01-G1 DEPTH IN FEfTT RAYTHEO
A
A
-9O
-1OO -CALIBRATE
-120 —
—13Q—
-14O-
-1SO-
Jtf l
8O-
90-
-3O-
-4O-
OO •—CALIBRATE-
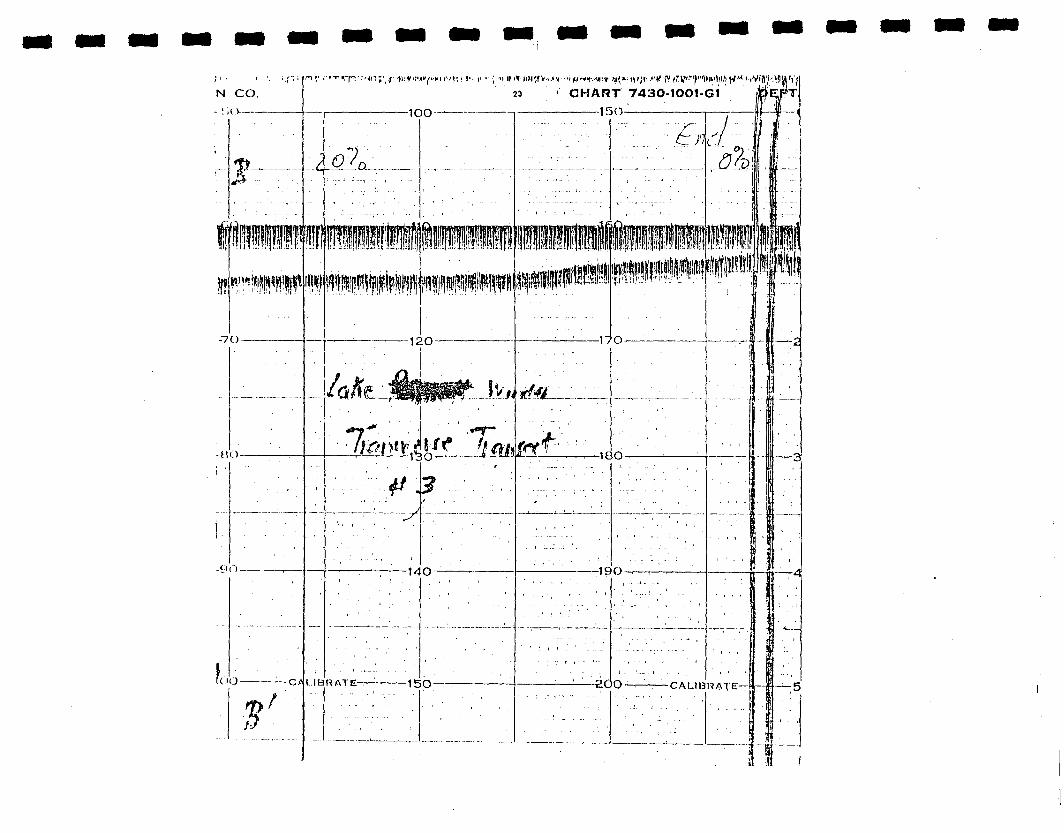
•p •••'•tnv.f 'ii/rw^-u i iv.ii i (•.. ,i • • • ; . •«•» i>ri»c;ry..>T"ifr-»r,'<iiiv i><p«-in';i-.fK"
23 CHART 7430-1OOI-G1
100~- . r-150'

CJH/1RT 743O-IOO1-G1 DEPTH IN FEET
-O
RAYTHEON CO.
5O-
CHART 74
i -f> 5OO CALIBRATE 5O

l30-10O<-C;i CHART 743O-1t>O1-d1"150
A
EET 'RAYTMEON C'O
2OO CALIBRATE
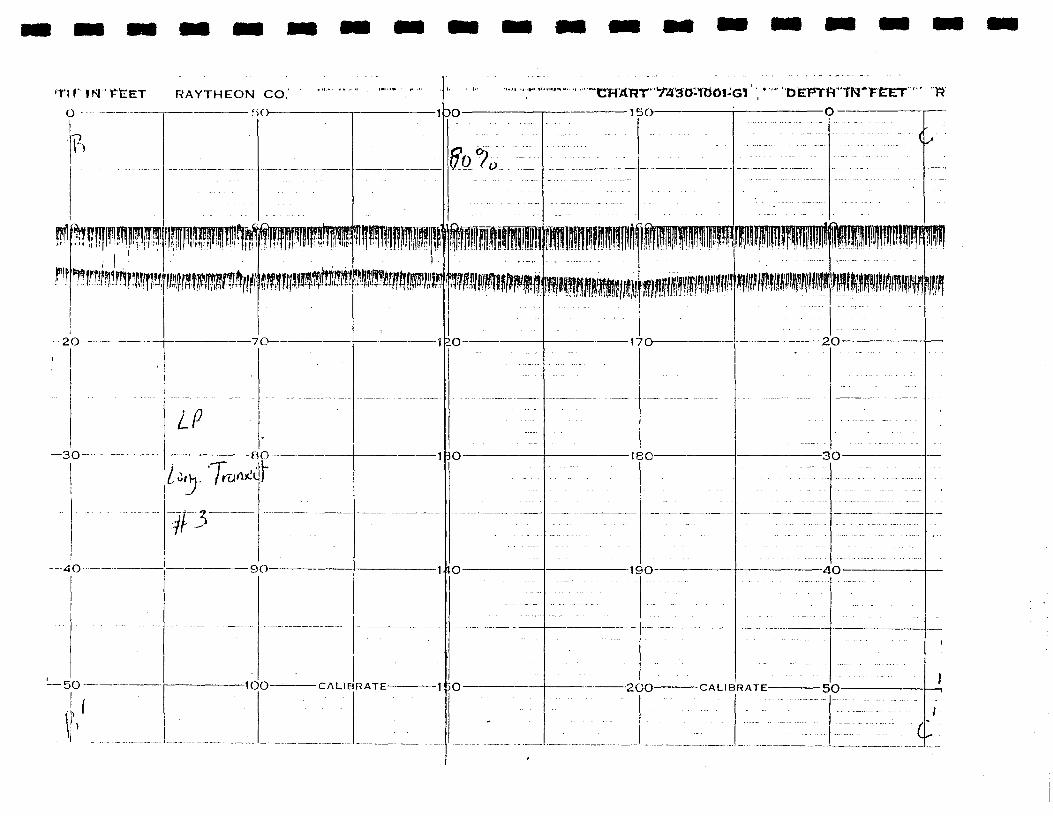
•TIT IKT
O
RAYTHEON CO.
f.iO-
-3O
IPIti*. Irurti.
4 -5— 4O
5O
if>
-9O-
-1OO- -CALIBRATE
1 DO
1 3O-
MO-
5O-
CWAIRT
ISO
, ' DETPTH INTFCET
-O
-ieo-
-19O-
-2CO-
-3O-
-4O-
-CALIBRATE- -5O-

AYTHi£ON CO'
— soCVlAttf 9436-lOdt-Gl
-15O-
kAYTHEON 'CO:
5O-
L
DEPTH IN FEET
O —

-100-
ALIHRATE- -
-12O-
/.P
-13O —
¥5"
-MO-
-150-
CH AfeT "743O-1001-G1
15O- —
DEPTH IN FEET
-17O-
180 —
-19O-
-o-
-20-
-30-
-40-
-2OO- -CALIBRATE- -5O-
-50-
-70-
-8O-
-90-
HOO- -CALIBR
1OO —
ET.
\TE-
12O-
13O-
14O-
15Of

rT
CHART 7430-1001-G!
l'i(') •—
DEPTH IN FEETO
F
—19O-
-3O-
-4O
-ZOO- CALIBRATE- -5O-
RAYTHEON CO.
SOCH
-8O-
-9O
-1OO- -CALIBRATE
-100-
-13O-
-14O-
-15O-
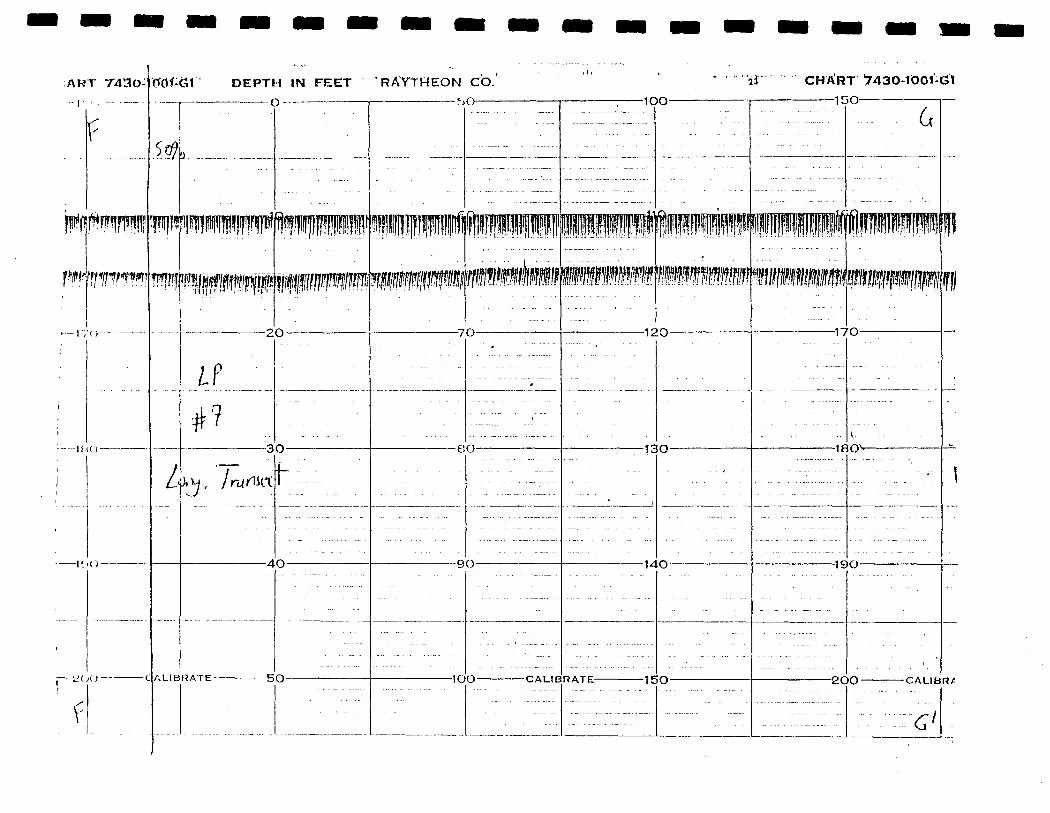
T43o: DEPTH IN FEET 'RAYTHEON CO. CHA!RT '743o-iooi-Gi-1OO-
fffllflfflffllf?!
-20-
-30-
-4O-
ALIBRATE- -5O-
-70-
-eo-
-90-
-100- -CALIBRATE
-12O- -170-
-13O-
-14O-
-15O-
V
-18OV-
-19O-
-2OO- -CAUIBR/

DEPTH »N FEET prA'VTHEO'N C0
\\
3O — ^
Lwy-
4O
t 5O —
1\
i
-7O-
-8O
-90-
1OO-
-100-CHART" 7430-1Cftn-G1
ISO
IN
-12O-
-13O-
-14O-
-- CALIBRATE 15O
-17O
-18O-
-19O-
-o-
-20 —
-3O-
-4O-
-2OO CAL1DRATE- -5O-
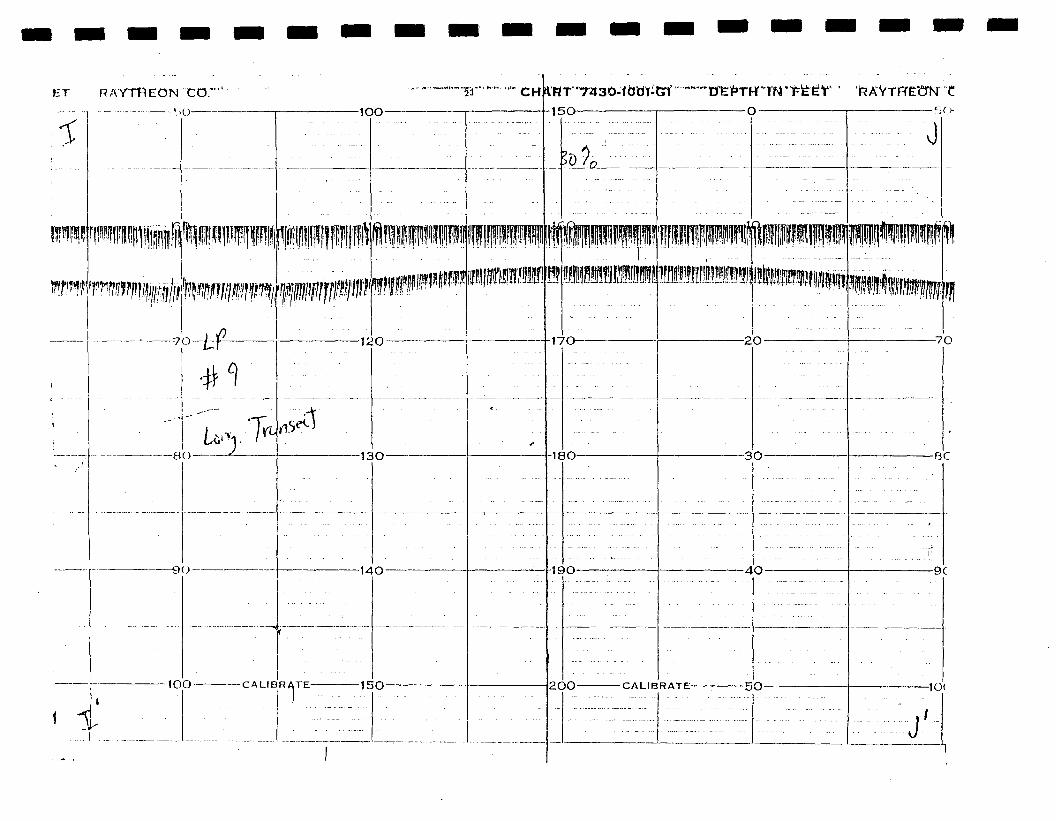
ET RAYTHEON CO!"'
-?.iO

7430-100I-G1" tSTTPTH m'
J

23 'CHART 7430-1OOJ-G1 ' DEI^fH IN FEET 'RAVtHEON CO'.
t ;-,o T-T . O :—<-—P 5O-
-120
K—~—14O
-170-
•/HUvJtT J
-20-
-3O-
JO-
2.OO CALIBRATE- 5O
-VO-
-80-
-9O-
-10O -
-12O-
-13O-
-14O-
-J)OO CALIBRATE J5O
'ii
>!

<;HART" 743o-iobi GI- - I'i'J
DEPTH i'ri FEET' RAVTHEON co.'—o- r r>o-
23100--
CHART 7430-
-15(
M

•'11OO1-"Gl':*"ri">""DlEpfH'i7Nl'"F''Tp1

ON CO
t ' ,( .
23 (CHART i43O-1OO1-G1
-)'JO-
DEPTH IN FEET FTAYTHeOKI CO.
O 1 5O-

— 1OO —
fHptpftpfllf
-i^b-
CHART 743O-1OO1-G1
150
fJWMWWf
13O
14O —
ISO-
-18O-
H9O-
JOO-
DtfTH IN FEET
O
-3O-
-4O-
-CALIBRATE- -50-
-8O-
-9O—-
-100- -CALIBRATE
IOC
I / / I
-12C
-13C
-140
-150

CHAUT 74'30MOt)1-:Gr OEPTW IN FEfef150 1 0
-18O-
7;
-19O-
-3O-
-40-
-80-
-9O-
-I7C
-13O- -18C
-14O- -19C
-2OO CALIBRATE- -5O- -rlOO- -CALI RATE- -15O- -COC
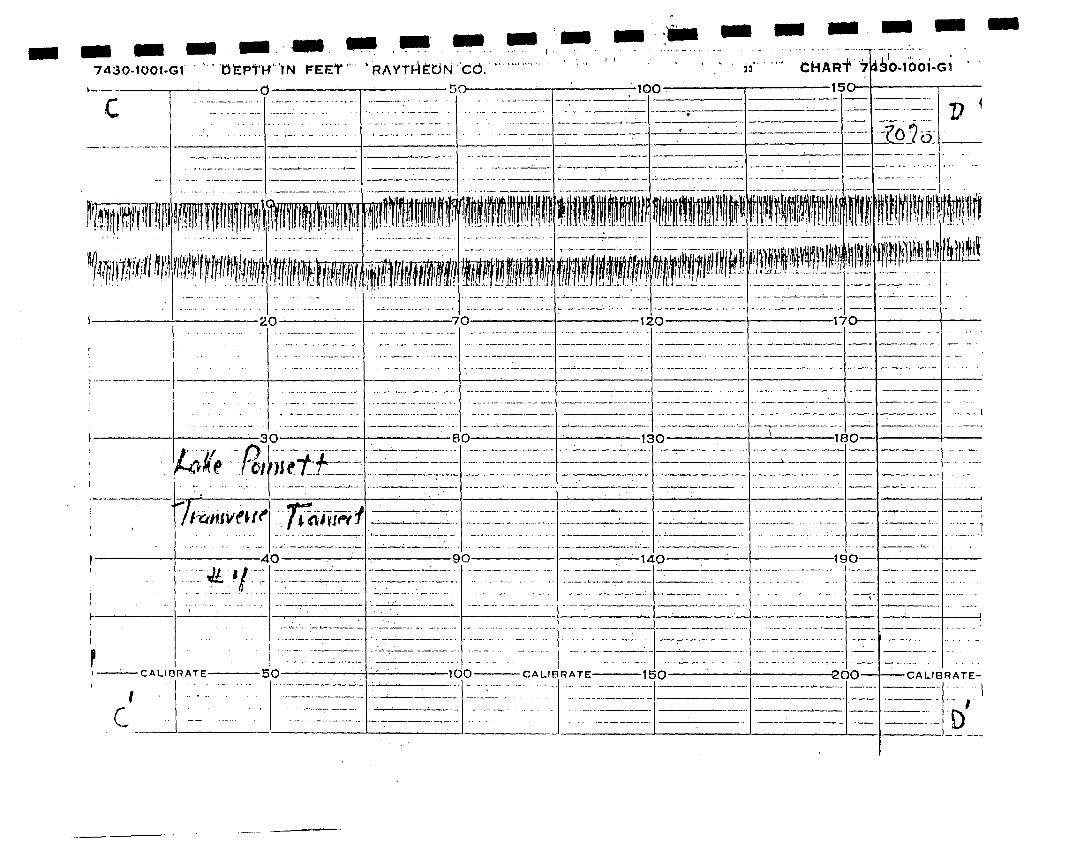
7430-1001.G1 ' ' DEPTH IN FEETv , : ,—o
iio-iboi-Gi
3O- -eo- -13O- -18O-
-4O- -90- -14O- -190-
I • CALinRATE- -5O- -1OO CALIBRATE -15O- -2OO- •CALIBRATE-i
C D
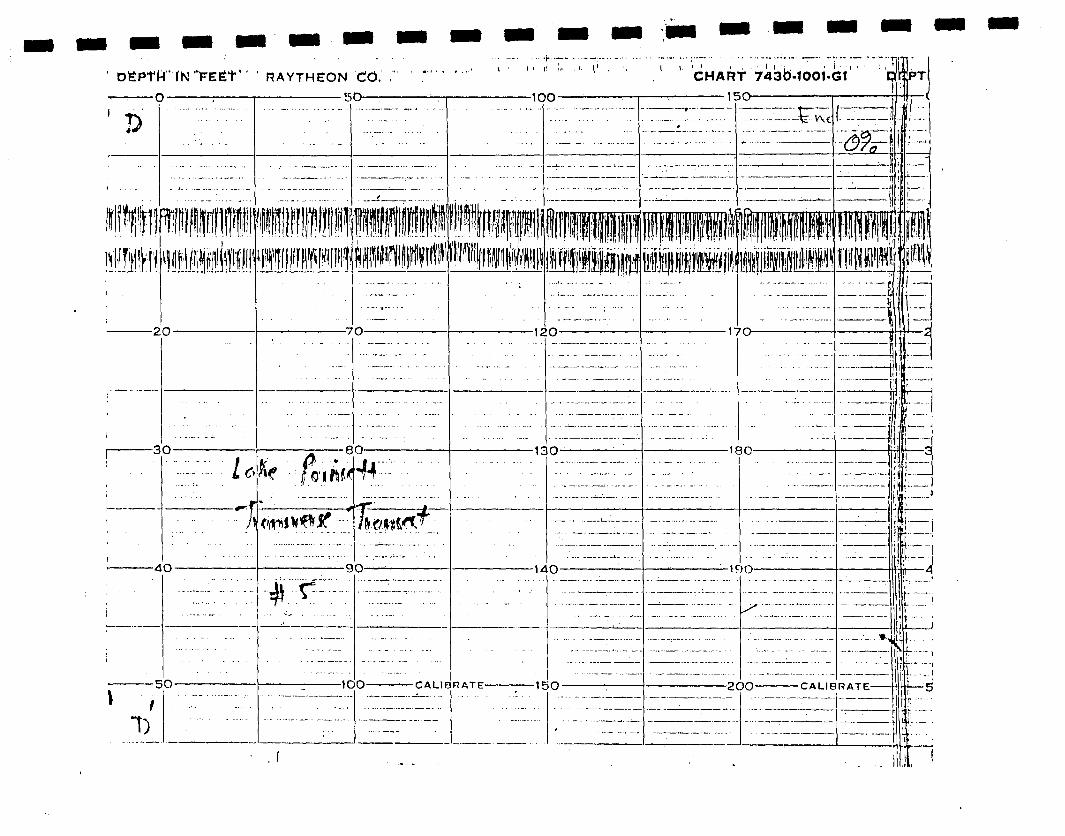
DEPTH" fN "FEET" ' RAYTHEON CO. ," ' "I ' I I I ! ' i.' . I. I1 , ', I - V 'J
-100
I ICHART 7436-1001-Gt
ISO-

IO01-G1 DEPTH IN FEET RAYTHEON CO.
5O
I'/
/-
-3O-•'
-4O-
CALIURATE 5O-
-80-
-9O-
-100-23 CHART 743O-10O1-G1
150
-13O-
-14O-
^OO CALIBRATE 15Q
f
m
-18O-
M9O-
JOO CALIBRATE-
DEPTH
O
1'f
£<
-4i
-r>(