Service Riser Service Riser Maintenance: Maintenance Program

Analysis of Riser Loads during BOP sailing.
Sigmund Anders Isaac Søgnesand
Subsea Technology
Supervisor: Bernt Johan Leira, IMT
Department of Marine Technology
Submission date: June 2015
Norwegian University of Science and Technology


NTNU
Norwegian University of Science and Technology
Department of Marine Technology
1
Master thesis, Spring 2015
for
Master Student Sigmund Anders Isaac Søgnesand
Analysis of Riser Loads during BOP sailing.
Analyse av belastninger på stigerør for undervanns flytting av BOP.
Running and retrieving the drilling riser column and subsea Blowout Preventer (BOP) is time
consuming. The deeper the water depths, the more time is required for such operations. Hence,
there is a potential to save a significant amount of time if the deployment and retrieval of the
drilling riser column and subsea BOP is minimized.
When a Mobile Offshore Drilling Unit (MODU) is done at a well site, it usually retrieves the
marine drilling riser column and subsea BOP. The MODU then moves to a new well location
and runs the same drilling riser and subsea BOP. An alternative method has been explored in
this thesis. This includes raising the subsea BOP some distance above the seabed, then
transferring the BOP and marine drilling riser column to a new well location without having to
pull all of the equipment to the drillfloor. While the platform is moving or ‘sailing’ from one
well site to another, the riser with the BOP at the bottom will be hanging/suspended from the
MODUs drillfloor.
During the BOP sailing activity there will be large hydrodynamic and inertial forces exerted on
the suspended riser column and subsea BOP. In the present master thesis, the load effects as a
function of significant wave height, current speed and sailing speed on different riser column
lengths will be analyzed. The thesis will also discuss operations in detail, contains modeling
and simulation results, sailing constraints, as well as risks and potential risk mitigation
measures.
The candidate will be using the computer program RIFLEX in order to perform static and dynamic
analysis of slender marine structures. There should also be a short and concise summary of the
program and the theoretical background upon which it is based. Another computer program, called
SIMO, will also be applied, which is a time domain simulation program for multi body systems

NTNU Faculty of Engineering Science and Technology
Norwegian University of Science and Technology Department of Marine Technology
2
that allows non-linear analysis of this system for various sailing speeds, current speeds as well as
wave conditions.
It is proposed that the work is performed according to the following plan:
1. Relevant literature in relation to analysis of riser and BOP response is to be reviewed. A
summary of important publications is to be given. A description of the relevant subsea
components and the sailing operation is also to be included.
2. The candidate is to get acquainted with the computer program SIMA/RIFLEX which is
applied for static and dynamic response analysis of marine risers. An outline of this
computer program and the corresponding theoretical basis is to be given.
3. A model for a specific riser and BOP configuration is to be created. This model is
subsequently to be analyzed by application of SIMO/RIFLEX. Static and dynamic
response analyses are performed for a set of particular wave- and current conditions.
Parameter studies are subsequenty to be performed for this same system to the extent that
time allows. Parameters that can be varied are e.g. riser column length, current- and wave-
parameters as well as MODU sailing speed.
4. Relevant ultimate limit states for the riser pipe are to be investigated with respect to
reserve margin. This applies to the combined effect of tension and bending moment. The
influence of current, wave height and wave period on this reserve margin is to be
investigated.
The work-scope may prove to be larger than initially anticipated. Subject to approval from the
supervisor, topics may be deleted from the list above or reduced in extent.
In the thesis the candidate shall present his personal contribution to the resolution of problems
within the scope of the thesis work. Theories and conclusions should be based on mathematical
derivations and/or logic reasoning identifying the various steps in the deduction. The candidate
should utilize the existing possibilities for obtaining relevant literature.
The thesis should be organised in a rational manner to give a clear exposition of results,
assessments, and conclusions. The text should be brief and to the point, with a clear language.
Telegraphic language should be avoided.
The thesis shall contain the following elements: A preface, list of contents, summary, main body
of thesis, conclusions with recommendations for further work, list of symbols and acronyms,
references and (optional) appendices. All figures, tables and equations shall be numerated.

NTNU Faculty of Engineering Science and Technology
Norwegian University of Science and Technology Department of Marine Technology
3
The supervisor may require that the candidate, at an early stage of the work, presents a written plan
for the completion of the work. The plan should include a budget for the use of computer and
laboratory resources which will be charged to the department. Overruns shall be reported to the
supervisor.
The original contribution of the candidate and material taken from other sources shall be clearly
defined. Work from other sources shall be properly referenced using an acknowledged referencing
system.
The thesis shall be submitted in electronic form:
- Signed by the candidate
- The text defining the scope included
- Drawings and/or computer prints can be organised in a separate folder.
Supervisor: Professor Bernt J. Leira
Start: January 16th, 2015 Deadline: June 10th, 2015
Trondheim, January 16th, 2015
Bernt J. Leira


i
PREFACE
This thesis is the final work for completing a two-year master’s degree program in Marine
Subsea Engineering at the Norwegian University of Science and Technology (NTNU) in
Trondheim, Norway. The thesis was written during the last academic semester at NTNU and
counts for 30 credits.
There are several people whom has helped and given me support throughout working on this
thesis whom I would like to extend my sincere gratitude and thankfulness to. First of all, I would
like to thank my supervisor Professor Bernt J. Leira at the Department of Marine Technology
for his guidance and input.
I would also like to thank my parents, Sigmund Søgnesand and Paula Prlina Søgnesand, for
their support throughout my entire academic career.
June 10th, 2015
Sigmund Anders Isaac Søgnesand
Trondheim, June 2015

ii
ABSTRACT
Transferring a drilling rig and its subsea equipment from one location to another by
conventional means tends to be time consuming. With low oil prices and increasing rig rates,
operators are looking into making drilling rigs more efficient. This thesis will examine a method
called BOP sailing, which may expedite the process of moving a drilling rig and its subsea
equipment from one location to another. It will also make sure that the BOP sailing method is
feasible from a safety and design point of view.
The BOP sailing operation is modelled and simulated in the riser analysis software RIFLEX for
three riser column lengths:
311 m
800 m
1225 m
The riser joints for each of the riser column length have the same diameters and submerged
weight per unit length. Weather conditions, current profiles and sailing speeds were defined
prior to running the simulations. The results obtained from RIFLEX is then further analyzed by
calculating a usage factor, 𝜂, based on the combined loading equation from the DNV-OS-F201
standard. This equation is used to perform riser analysis using tension and bending moments,
and the value of the calculated usage factor may not exceed a critical value.
The usage factor is calculated at two locations on each of the riser columns for all of the weather
conditions. One of the locations is located at the top of the riser column where the riser column
is attached to the drilling vessel. The second location is where the maximum dynamic bending
moment takes place.
Based on the simulation results, it is found that the value of 𝜂 increases with an
Increase in sailing speed
Increase in wave height
Increase in riser column length
However, the value of 𝜂 did not exceed the limiting value in any of the simulations. One can
therefore conclude that it is safe to sail with a suspended marine drilling riser and subsea BOP
for all of the weather conditions and sailing speeds used in the RIFLEX simulations.

iii
ABSTRAKT
Å flytte en borerigg fra en lokasjon til en annen ved bruk av konvensjonelle metoder kan ta mye
tid. Med lave oljepriser og høye rigg rater ser operatører på forskjellige måter å gjøre
boreplattformene mer effektive. Denne masteroppgaven undersøker en metode kalt BOP
seiling, som kan forkorte tiden brukt på å flytte en boreplattform og dens undervanns utstyr
(stigerør og BOP) fra en lokasjon til en annen. Masteroppgaven vurderer om det er mulig å
gjennomføre en slik operasjon innenfor design- og sikkerhetsmessige aspekter.
BOP seiling er modellert og simulert i et stigerør analyse program kalt RIFLEX. Tre
stigerørslengder er evaluert:
311 m
800 m
1225 m
Komponentene for de tre forskjellige stigerørskolonner har samme diameterne og vekt per
lengde nedsunket i vann. Værforhold som vind og bølgehøyde, strømningsprofiler og
seilehastigheter er parametere som inngår i simuleringene. Resultatene fra RIFLEX er analysert
ved å beregne en bruksfaktor, 𝜂 , basert på en kombinert last ligning fra DNV-OS-F201
standarden. Nevnte last ligning er anvendt i stigerørsanalyse ved å beregne strekk- og
bøyemoment, og bruksfaktor som ikke kan ikke overskride en kritisk verdi.
Bruksfaktoren er beregnet ved to forskjellige lokasjoner på stigerørene for alle værforhold antatt
i dette studiet. En lokasjon er på toppen av stigerøret hvor det er festet til boreplattformen. Den
andre lokasjonen er hvor stigerøret utsettes for maks dynamisk bøye moment.
Basert på simuleringene, er det funnet ut at verdien av 𝜂 øker med
Økning i seilehastighet
Økning i bølgehøyde
Økning i stigerørslengde
Verdien av 𝜂 overskrider ikke kritisk verdi i noen av simuleringene. Derfor kan man konkludere
med av det er trygt å seile med hengende stigerør og BOP under alle værforhold og
seilehastigheter som er evaluert i masteroppgaven.

iv
ACRONYMS
ALS Accidental Limit State
API American Petroleum Institute
BOP Blowout Preventer
DNV Det Norske Veritas
FEA Finite Element Analysis
FEM Finite Element Method
FLS Fatigue Limit State
HXT Horizontal Christmas Tree
ISO International Organization for Standardization
JONSWAP JOint North Sea WAve Project
LMRP Lower Marine Riser Package
MODU Mobile Offshore Drilling Unit
NCS Norwegian Continental Shelf
RAO Response Amplitude Operator
SCM Subsea Control Module
SLS Serviceability Limit State
SMTS Specified Minimum Tensile Strength
SMYS Specified Minimum Yield Strength
ULS Ultimate Limit State
VXT Vertical Christmas Tree
WH Wellhead
XT Christmas Tree

v
SYMBOLS
𝐻𝑠 Significant wave height
𝑇𝑝 Wave period
𝜎𝑣𝑚 Von Mises stress
𝜎𝑦 Yield Strength
𝜔 Angular frequency
𝜁𝑎 Wave amplitude
𝑔 Acceleration due to gravity
𝜙 Velocity potential
𝑝 Pressure
𝑘 Wave number
𝑢 Displacement vector (x-direction)
�̇� Velocity vector (x-direction)
�̈� Acceleration vector (x-direction)
𝜁 Wave elevation
𝜌 Density
ℎ Water depth
𝜖 Phase angle
�̇� Velocity component of riser
�̈� Acceleration component of riser
𝐶𝑀 Mass coefficient
𝐶𝐷 Drag coefficient
𝐴 Cross sectional area
𝑟 Radius
𝜂 Usage factor
𝑀𝑑 Design bending moment
𝑀𝑘 Plastic bending moment resistance
𝑀𝐹 Bending moment from functional loads
𝑀𝐸 Bending moment from environmental loads
𝑀𝐴 Bending moment from accidental loads
𝑇𝑒𝑑 Design effective tension
𝑇𝑘 Plastic axial force resistance

vi
𝑇𝑒𝐹 Effective tension from functional loads
𝑇𝑒𝐸 Effective tension from environmental loads
𝑇𝑒𝐴 Effective tension from accidental loads
𝑇𝑤 True wall tension
𝑝𝑙𝑑 Local internal design pressure
𝑝𝑒 External pressure
𝑝𝑏 Burst resistance pressure
𝜌𝑖 Density of internal fluid
𝜌𝑒 Density of external fluid
𝛼𝑐 Flow stress parameter accounting for strain hardening
𝛼𝑈 Material quality factor
𝑞ℎ Parameter to account for strain hardening and wall thinning
𝛽 Parameter to account for strain hardening and wall thinning
𝛾𝐹 Load effect factor for functional loads
𝛾𝐸 Load effect factor for environmental loads
𝛾𝐴 Load factor for accidental loads
𝛾𝑚 Material resistance factor
𝛾𝑠𝑐 Resistance factor dependent on safety class
𝑓𝑢 Tensile strength to be used in design
𝑓𝑦 Yield strength to be used in design
𝑡2 Pipe wall thickness
𝐷 Nominal outside diameter
𝑂𝑃𝐿𝐼𝑀 Operational environmental limiting criteria
𝑂𝑃𝑊𝐹 Forecasted (monitored) operation criteria
∝ Factor accounting for uncertainty in weather forecast
𝑡 Time variable
TPOP Planned operation period
TR Operation reference period
TC Estimated contingency time

vii
TABLE OF CONTENTS
Preface ......................................................................................................................................... i
Abstract ...................................................................................................................................... ii
Abstrakt ..................................................................................................................................... iii
Acronyms .................................................................................................................................. iv
Symbols ...................................................................................................................................... v
Table of Contents ..................................................................................................................... vii
List of Figures .......................................................................................................................... xii
List of Tables ........................................................................................................................... xiv
1 Introduction ......................................................................................................................... 1
1.1 General Background .................................................................................................... 1
1.2 Problems and solutions ................................................................................................ 3
1.3 BOP sailing considerations .......................................................................................... 5
1.3.1 Distances .............................................................................................................. 6
1.3.2 Water Depth ......................................................................................................... 6
1.3.3 Weather Conditions .............................................................................................. 6
1.3.4 Subsea Structures ................................................................................................. 7
1.3.5 Seabed Topography and Wellhead Elevations ..................................................... 7
1.3.6 Riser Column Design and Properties ................................................................... 7
1.3.7 BOP Design .......................................................................................................... 7
1.3.8 Future Work ......................................................................................................... 7
1.4 General Protocols ........................................................................................................ 8
1.5 Previous Work ............................................................................................................. 9
1.6 Organization of Thesis ............................................................................................... 10
2 Relevant Subsea Components ........................................................................................... 11
2.1 BOP General .............................................................................................................. 11
2.1.1 Subsea BOP ........................................................................................................ 12

viii
2.1.2 BOP Jump Tool .................................................................................................. 14
2.2 Drilling Risers ............................................................................................................ 15
2.2.1 Spider and Gimbal .............................................................................................. 17
2.2.2 Tensioner System ............................................................................................... 18
2.2.3 Telescopic Joint .................................................................................................. 18
2.2.4 Flex/ball Joints ................................................................................................... 18
2.3 Other Relevant Subsea Components ......................................................................... 18
2.3.1 Subsea Template ................................................................................................ 19
2.3.2 Subsea Wellhead (WH) System ......................................................................... 20
2.3.3 Subsea Christmas Trees (XTs) ........................................................................... 21
2.3.4 Bore Protector/Wear Bushing ............................................................................ 22
2.3.5 Guide Posts/Wires .............................................................................................. 22
2.3.6 Subsea Manifold ................................................................................................. 22
2.3.7 Multipurpose Tool .............................................................................................. 22
2.3.8 Diverter System .................................................................................................. 22
2.4 Sequence of Operations ............................................................................................. 22
3 Relevant Standards ............................................................................................................ 25
3.1 DNV-OS-F201, Dynamic Risers ............................................................................... 25
3.1.1 Riser Yielding Assessment from DNV-OS-F201 .............................................. 26
3.2 API-RP-16Q .............................................................................................................. 30
3.3 Riser Connectors ........................................................................................................ 31
3.4 DNV-OS-F201, Dynamic Riser ................................................................................ 31
3.5 ISO 13628-7 .............................................................................................................. 32
3.6 DNV-OS-H101, Marine Operations, General ........................................................... 33
3.7 NORSOK D-010N ..................................................................................................... 34
4 Loads on Riser and BOP ................................................................................................... 35
4.1 Currents ..................................................................................................................... 36

ix
4.2 Waves ........................................................................................................................ 36
4.2.1 Basic Assumptions for Potential Theory ............................................................ 36
4.3 Boundary Conditions ................................................................................................. 37
4.3.1 Kinematic Boundary Conditions ........................................................................ 37
4.3.2 Dynamic Free-surface Condition ....................................................................... 38
4.3.3 Regular Waves ................................................................................................... 39
4.3.4 Irregular Sea ....................................................................................................... 40
4.4 Morison’s Equation ................................................................................................... 41
4.5 Effective Tension ....................................................................................................... 41
5 SIMA/RIFLEX ................................................................................................................. 43
5.1 SIMA in General ....................................................................................................... 43
5.2 RIFLEX in General ................................................................................................... 43
5.3 Structure of RIFLEX ................................................................................................. 43
5.3.1 INPMOD Module ............................................................................................... 44
5.3.2 STAMOD Module .............................................................................................. 44
5.3.3 DYNMOD Module ............................................................................................ 44
5.3.4 FREMOD Module .............................................................................................. 45
5.3.5 OUTMOD Module ............................................................................................. 45
5.3.6 PLOMOD Module .............................................................................................. 45
5.4 Static Finite Element Analysis .................................................................................. 45
5.5 Incremental Equilibrium Iterations ............................................................................ 46
5.6 Dynamic Time Domain Analysis .............................................................................. 46
5.6.1 General ............................................................................................................... 46
6 Model in RIFLEX ............................................................................................................. 48
6.1 Modelling and Analysis ............................................................................................. 49
6.1.1 Boundary Conditions .......................................................................................... 50
6.1.2 Elements ............................................................................................................. 51

x
6.1.3 Seed Numbers .................................................................................................... 51
6.1.4 Weather Conditions ............................................................................................ 51
6.1.5 Length of Simulations ........................................................................................ 56
6.2 Riser Columns ........................................................................................................... 56
6.2.1 Riser properties .................................................................................................. 57
6.2.2 Making up Riser Columns .................................................................................. 58
6.2.3 Weight of Riser Joints ........................................................................................ 60
6.2.4 Steel Grades ........................................................................................................ 61
6.3 BOP Stack .................................................................................................................. 62
6.4 Support Vessel ........................................................................................................... 63
6.4.1 Vessel Propagation ............................................................................................. 64
6.5 Verification of Model Results ................................................................................... 65
6.6 Increasing Vessel Speed and Current Speed ............................................................. 67
6.7 Verification of Model Results Using Standard Deviation and Mean ........................ 69
7 Results and Discussion ..................................................................................................... 71
7.1 Convergence Studies ................................................................................................. 72
7.1.1 Element Length .................................................................................................. 72
7.1.2 Time Step ........................................................................................................... 73
7.2 Static forces in Riser Columns .................................................................................. 74
7.3 Riser Yielding Assessment ........................................................................................ 75
7.3.1 1225 m Long Riser Column ............................................................................... 75
7.4 Comparing Bending Moments ................................................................................... 77
7.5 Worst Case Scenario .................................................................................................. 79
7.6 Contributions from Bending Moment and Tension ................................................... 80
7.7 Summary .................................................................................................................... 82
8 Conclusion ........................................................................................................................ 84
9 Recommendations for Further Work ................................................................................ 85

xi
10 References ..................................................................................................................... 86
Appendix A: DNV-OS-F201, Dynamic Risers Equations .......................................................... I

xii
LIST OF FIGURES
Figure 1: Typical subsea setup while drilling a subsea well using a MODU. ........................... 2
Figure 2: Daily rig rates for some rigs on the Norwegian Continental Shelf [3]. ...................... 3
Figure 3: MODU sailing with suspended riser column and subsea BOP. ................................. 5
Figure 4: Pipe ram preventer with the circular cut-outs in the middle [10]. ............................ 12
Figure 5: Typical subsea BOP and LMRP stack [12]. ............................................................. 13
Figure 6: BOP jump tool provided used on Transocean Spitsbergen [13]. .............................. 14
Figure 7: Aluminum drilling-riser joint with peripheral lines [16]. ......................................... 16
Figure 8:GE Vetco Gray MR-6E hydraulic spider [18]. .......................................................... 17
Figure 9: Subsea template manifold other subsea equipment [20]. ......................................... 19
Figure 10: Subsea wellhead with casings and seal assemblies [22]. ........................................ 21
Figure 11: Summary of DNV's limit states [24]. ..................................................................... 26
Figure 12: Axial, hoop and radial stresses ............................................................................... 31
Figure 13: Illustration of a MODU sailing with a suspended riser and BOP with various
environmental forces acting on the system [28]. ...................................................................... 35
Figure 14: Pipe with internal and external fluids and equivalent force systems [30]. ............. 42
Figure 15: Strucutre of the RIFLEX program [32]. ................................................................. 44
Figure 16: MODU with 311 m long riser column. ................................................................... 49
Figure 17: Current profile for 400 meter water depth [37]. ..................................................... 54
Figure 18: Current profile for 800 meter water depth [37]. ..................................................... 54
Figure 19: Current profile for 1300 meter water depth [38]. ................................................... 55
Figure 20: External and internal areas as defined in RIFLEX [40]. ........................................ 61
Figure 21: RAO in surge – Amplitude ratio [40]. .................................................................... 63
Figure 22: RAO in heave – Amplitude ratio [40]. ................................................................... 63
Figure 23: RAO in surge – Phase angle [40]. .......................................................................... 64
Figure 24: RAO in heave – Phase angle [40]. .......................................................................... 64
Figure 25: Force envelope curve for Hs=3 m and Tp=8 sec for the 1225 m long riser column
without current and 0 m/s MODU speed. ................................................................................ 66
Figure 26: Bending moment envelope curve for Hs= 3 m and Tp=3 sec for the 1225 m long
riser column with no current and 0 m/s sailing speed. ............................................................. 68
Figure 27: Bending moment envelope curve for Hs= 3 m and Tp=8 sec for the 1225 m long
riser column with regular current profile and 0.5 m/s sailing speed. ....................................... 69

xiii
Figure 28: Maximum dynamic force at the top of the 311 m long riser column as a function of
element length. ......................................................................................................................... 73
Figure 29: Maximum dynamic force at the top of the 311 m long riser column as a function of
time step. .................................................................................................................................. 74
Figure 30: The static forces for each of the three riser columns without any waves, currents or
forward speed. .......................................................................................................................... 74
Figure 31: 𝜂 vs. sailing speed where the maximum dynamic bending moment occurs on the
1225 m long riser column. ........................................................................................................ 76
Figure 32: 𝜂 vs. sailing speed at the attachment point between the riser and MODU for the 1225
m long riser column. ................................................................................................................. 77
xiv
LIST OF TABLES
Table 1: Load effect factors [24]. ............................................................................................. 29
Table 2: Safety class resistance factors, 𝜸𝒔𝒄 [24]. ................................................................... 29
Table 3: Material resistance factor, 𝜸𝒎 [24]. .......................................................................... 30
Table 4: Boundary conditions for each of the supernodes in RIFLEX. ................................... 50
Table 5: Parameters used for irregular sea analysis in RIFLEX simulations. .......................... 52
Table 6: Scatter diagram for Ekofisk data taken from 1980-1993 [36]. .................................. 52
Table 7: Sea states used for the RIFLEX simulations. ............................................................. 53
Table 8: Dimensions and properties for riser components used for the 311 m riser column in
RIFLEX [39]. ........................................................................................................................... 57
Table 9: Dimensions for riser component used for 800 m and 1225 m riser columns in the
RIFLEX analysis [39]. ............................................................................................................. 58
Table 10: Combination of riser joints used in 311.18 m long riser column. ............................ 59
Table 11: Combination of riser joints used in 800.38 m long riser column. ............................ 59
Table 12: Combination of riser joints used in 1225.58 m long riser column ........................... 60
Table 13: Properties for steel grades API 5L X52, X65, and X80. .......................................... 62
Table 14: Properties for BOP and LMRP stack for modified RIFLEX model. ....................... 62
Table 15: Example of current speeds in RIFLEX for 400 m water depth................................ 65
Table 16: Consistency of dynamic results for the 311 m riser column in RIFLEX. ................ 70
Table 17: Fixed parameters used for the convergence studies. ................................................ 72
Table 18: Depth of maximum dynamic bending moment from the attachment point when Hs=2
m and Tp=7 sec for the 1225 m long riser column. ................................................................. 78
Table 19: Depth of maximum dynamic bending moment from the attachment point when Hs=2
m and Tp=7 sec for the 800 m long riser column. ................................................................... 78
Table 20: Maximum dynamic bending moments for Hs=2 m and Tp=7 sec with regular current
profiles and 2 m/s sailing speed ............................................................................................... 79
Table 21: Percent contribution at location where maximum bending moment occurs for Hs=2
m and Tp= 7 sec for 311 m long riser column. ........................................................................ 81
Table 22: Percent contribution at location where maximum bending moment occurs for Hs=2
m and Tp= 7 sec for 800 m long riser column. ........................................................................ 81
Table 23: Percent contribution at location where maximum bending moment occurs for Hs=2
m and Tp= 7 sec for 1225 m long riser column. ...................................................................... 81

xv
Table 24: Significant wave height and corresponding wave period used for the RIFLEX
simulations. .............................................................................................................................. 82


1
1 INTRODUCTION
1.1 GENERAL BACKGROUND
In 1859 the first known oil well was drilled by “Colonel” Edwin Drake in northern
Pennsylvania, USA [1]. This created interests in making further oil discoveries and was the
starting point for further developments in the oil and gas industry.
Accumulations of hydrocarbons are found in porous rocks, usually sandstones or limestones,
below the earth’s surface. These accumulations are commonly referred to as reservoirs. The
rock formations were originally desert sand dunes or seafloors for 100 to 200 million years ago.
Organic materials were deposited on these surfaces and high pressures and high temperatures
over longer periods of time transformed these organic materials into hydrocarbons [1].
In order for a reservoir to form, there has to be a “trap” of a non-porous medium or a layer that
traps and lets the hydrocarbons accumulate. This prevents the hydrocarbons from migrating
upwards. Common non-porous mediums are salt, shale, chalk or mud rocks [1].
The hydrocarbons that are trapped in the reservoirs are pressurized within the pores of the
formation. When a well is drilled into a reservoir, the hydrostatic pressure in the reservoir
pushes the hydrocarbons into the well and makes the well flow. Over time, the reservoir
becomes depleted and the pressure in the reservoir decreases. The results of this is that the well
produces less hydrocarbons [1].
When a reservoir has been proven to be cost efficient through seismic data and exploration
wells, it is time to drill a well or multiple wells down into the reservoir. This is either done
onshore/on land, or offshore. While drilling an offshore well, which is commonly referred to as
a subsea well, a mobile offshore drilling unit (MODU) is often used. A simplified sketch of a
MODU with its subsea equipment is seen in Figure 1.

Analysis of Riser Loads during BOP Sailing
2
Figure 1: Typical subsea setup while drilling a subsea well using a MODU.
A more detailed description of the subsea components and their functions will be given later in
the thesis. Prior to drilling a well, the MODU must deploy a large piece of equipment called a
Blowout Preventer (BOP) stack down to the seabed. This piece of equipment is lowered down
while hanging at the bottom of the riser column. The riser column is a series or pipe joints that
are connected together one by one. When the BOP is on the seabed and is properly connected
to the well, and the riser column connects the BOP stack with the MODU, drilling may start.
When the MODU is done drilling a well and is ready to depart, it must retrieve its BOP and
drilling riser first. The BOP stack is raised off the seabed towards the MODU while the riser
joints are disconnected one by one and laid down. When the BOP stack is on the drill floor and
Sigmund Anders Isaac Søgnesand
3
properly secured, the MODU may proceed to sail to the new well site. This is the conventional
method of running and retrieving the BOP stack and drilling riser at a well site.
1.2 PROBLEMS AND SOLUTIONS
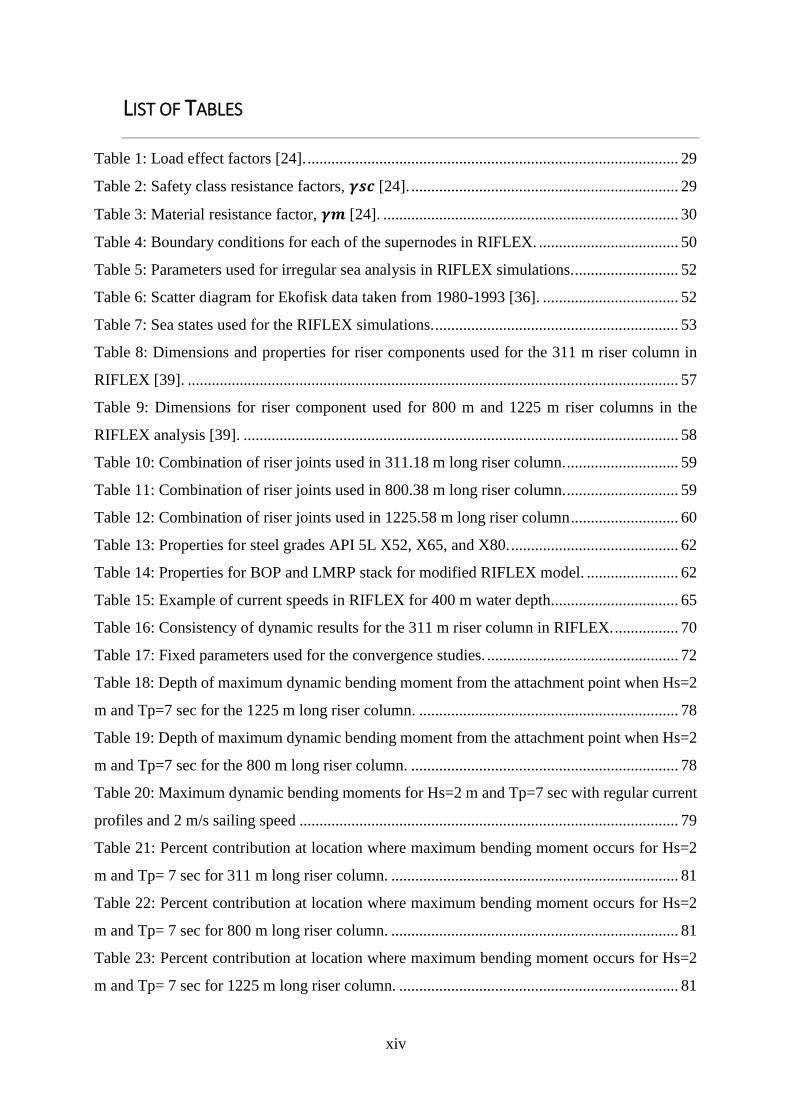
Costs related to renting and operating drilling rigs are high. The day rate for high-spec drilling
rigs on the Norwegian Continental Shelf was 147,500 USD per day in July, 2004 [2]. In
September, 2008, the day rate had increased to 530,820 USD. This is an increase of 260 percent
over a four year time period. In fact, hiring drilling rigs and costs of oil services are dominant
drilling expenses [2]. Figure 2 shows the rental cost per day for some rigs on the Norwegian
Continental Shelf.
Figure 2: Daily rig rates for some rigs on the Norwegian Continental Shelf [3].
The high costs related to renting and operating drilling rigs has made operators focus more on
effectivity. However, an interesting trend has been observed by Osmundsen et al. in the paper
called Drilling Productivity on the Norwegian Continental Shelf. That is, with the increase in
prices for renting and operating drilling rigs there has been a decrease in the drilling efficiency
which can be measured in drilling meters per day. In fact, from 2004 to 2008 exploration drilling
slowed down from an average of 144 to 67 meters per day [2].
0
100
200
300
400
500
600
700
DeepseaAtlantic
COSLInnovator
Songa Trym PolarPioneer
Stena Don West Elara MaerskGiant
Scarabeo 5 TransoceanSpitbergen
CO
ST P
ER D
AY
(IN
$1
00
0)
DAILY RIG RATES

Analysis of Riser Loads during BOP Sailing
4
Drilling meters per day and drilling meters per year are directly proportional to each other.
Drilling one well fast and the next well slow will not solve the current problem of too low
drilling rates. Therefore, operators must think long term and drill more wells per drilling rig per
year. Operations where large amounts of time can be spent is running and retrieving the BOP
and riser column. During these operations, the rig is not able to drill and the drilling meters per
year declines the longer these operations takes.
In order to minimize the time spent moving the drilling rig and its subsea quipment from one
well location to another, one can use the concepts of BOP jumping and BOP sailing. BOP
jumping is when the BOP stack is lifted off of a well using the tensioners at the top of the riser
column and moved over to a neighboring well without pulling the BOP stack to the drillfloor
[4].
BOP sailing is when the BOP stack is lifted up from a well using the riser column. The riser
column with the BOP stack at the bottom is then suspended or hung off from the drill floor. The
platform can then proceed to sail to a new well location without having to retrieve and rerun
the entire riser column and the BOP stack. The concept of BOP jumping/sailing is illustrated in
Figure 3 below.

Sigmund Anders Isaac Søgnesand
5
Figure 3: MODU sailing with suspended riser column and subsea BOP.
The difference between BOP jumping and BOP sailing are the distances covered and equipment
removed from the top of the riser column. Traditionally for a BOP jumping event, none of the
equipment/parts at the top of riser column is removed or as little equipment as possible is
removed. For a BOP sailing event the equipment at the top of the riser column and perhaps a
few riser joints are removed [4].
BOP jumping and BOP sailing can be a huge time saver for operators on the NCS. A general
rule of thumb is that the deeper the water depth, the longer it takes to run the BOP stack and the
marine drilling riser column. So in deeper waters, the more time can be saved.
1.3 BOP SAILING CONSIDERATIONS
Sailing with a suspended riser column and BOP should in the long run help save time and hence
make drilling rigs more efficient in terms of the number of wells drilled per year. However,

Analysis of Riser Loads during BOP Sailing
6
there are some scenarios were the BOP jumping/sailing activity may not be feasible and/or
necessary. Some factors to include while planning such an operation are:
Distances
Water depth
Weather conditions
Subsea structures
Seabed topography and wellhead elevations
Riser column design and properties
BOP design
Future work
1.3.1 Distances
The BOP sailing activity should occur over limited distances. A scenario where sailing with a
suspended riser and BOP is feasible is while travelling between neighboring well slots or well
sites that are close to each other. However, travelling over long distances is not recommended
as unforeseen obstacles and problems may arise.
1.3.2 Water Depth
Water depth is an important factor when choosing whether or not to sail with a suspended riser
column and BOP stack. As mentioned earlier in the thesis, the deeper the water depths the
longer it takes to run the BOP stack and drilling riser column. The equipment at the very top of
the riser column is the most difficult to handle and takes the longest to assemble/disassemble
[4]. Based on this, in shallow water depths, sailing with a suspended BOP stack and riser
column may not save a considerable amount of time compared to retrieving the entire riser
column and BOP stack.
1.3.3 Weather Conditions
Weather conditions have to be favorable for BOP sailing activities to occur. Weather parameters
of importance are significant wave height and wave period, current speed and current direction
as well as wind speed. Although most of the riser column is submerged and wind does not exert
forces directly on the riser column, it may have an effect on the vessels motions which in turn
can have an effect on the response of the riser column.

Sigmund Anders Isaac Søgnesand
7
1.3.4 Subsea Structures
While performing a sailing activity, one should try to avoid crossing any subsea structures,
especially pipelines and subsea templates. In the worst case scenario, the BOP could fall and
damage one of these structures. This should be taken into account and a route that crosses the
least amount of subsea structures should be chosen/considered.
If, however, there are no other alternatives and a subsea structure must be crossed during a
sailing operation, one could call the operating platform and close off the template/pipeline while
the MODU is crossing.
1.3.5 Seabed Topography and Wellhead Elevations
While planning a sailing a sailing activity, the seabed topography should be carefully mapped
out. This is to prevent the bottom of the BOP touching the seabed and/or subsea structures
which could cause damage to the equipment and rig crew.
1.3.6 Riser Column Design and Properties
The riser joints and their corresponding properties are important as they have to be able to
withstand the submerged weight of the BOP stack and the weight of the drilling riser column.
In addition to this, dynamic forces from the surrounding environment will be exerted to the
system.
Drilling riser joints vary in design depending on its water depth rating, manufacturers, criteria
from rig contractors etc. Hence, the riser joints may not be designed for a sailing activity.
Inquiring the designers and manufacturers of whether or not the riser joints have the correct
properties for a sailing activity is recommended.
1.3.7 BOP Design
When the rig is moving forward with a suspended riser column and BOP stack, there will be
large hydrodynamic forces exerted to the system. This could cause damage to fragile parts on
the BOP stack. Also, a BOP jump tool is often used for sailing activity, and is explained in
depth later in the text. However, the pipe rams used to clamp around the BOP jump tool may
not be designed to hold the weight of the submerged BOP stack and drilling riser column.
1.3.8 Future Work
Some jobs performed on wells do not require the BOP stack and the drilling riser column.
Therefore, sailing with a suspended BOP stack and riser column should take place only if the
previous job and the future job requires the BOP stack and drilling riser column.

Analysis of Riser Loads during BOP Sailing
8
1.4 GENERAL PROTOCOLS
Prior to and during a BOP jumping/sailing activity there are some protocols that shall be
followed. These can be specified by either local authorities, company whom owns the rig,
company whom is renting the rig, suppliers of equipment etc. The protocols in this text are
suggestions made by the author and are not legally binding.
One of the protocols is to have updated weather reports. Weather parameters of importance that
should be included in the weather forecasts are:
Current velocity and direction
Wind velocity and direction
Significant wave height and wave period.
Drilling rigs are equipped with at least one ROV in order to check the status while running and
using the subsea equipment. ROVs are equipped with a sonar, echo sounder, lights and cameras.
Sonar is an abbreviation for SOund NAvigation Ranging [5] and can be used to scan the area
in front and on the side of the ROV for any obstacles [6]. The sonar is a useful tool as it usually
has a significantly longer range than the cameras. Hence, it is able to detect obstacles farther
ahead than the cameras are able to.
ROVs are also equipped with echo sounders. The echo sounder can be used to measure the
distance between the ROV and seabed [7]. An ROV or ROVs can be used concurrently during
a BOP sailing operation and could be strategically placed in front of the BOP in order to verify
that there are no upcoming obstacles and that there is an acceptable clearance between the
bottom of the BOP and the seabed at all times. If any unforeseen obstacles are detected, the
ROV(s) should be placed far enough ahead of the BOP so the drilling rig can decelerate and
stop or change directions without damaging the riser and/or BOP.
Another protocol is to have the BOP double secured during a BOP sailing or BOP jumping
activity. This has two effects:
1) Reduce the tension in the riser column
2) Acts as a backup if the riser column is to fail/yield
One way to keep the BOP double secured is using a BOP jumping tool, which is described in
Section 2.1.2.

Sigmund Anders Isaac Søgnesand
9
1.5 PREVIOUS WORK
Studies related to the topic of BOP jumping have been performed. One article in the magazine
Drilling Contractor called Study analyzes response of deepwater riser with suspended BOP.
The study analyzes marine drilling riser response with a suspended BOP in water depths up to
2000 meters [8].
In order to calculate the riser response, a finite element representation of the riser column was
created. The calculations took into account the riser axial tension, environmental loads and
pressure effects due to internal and external fluid pressure. In addition to this sea current, waves,
vessel motions and vessel advancing speed were also taken into consideration. The critical
region of the riser was identified to be at the top of the riser column, where the stresses are the
highest.
The operational criteria for the study were based on API RP 16Q (1993). The operation could
be executed if the maximum von Mises stress in the riser did not exceed the maximum allowable
stress. The maximum allowable stress in the riser was defined as 𝜎𝑣𝑚 ≤ 𝜎𝑦. That is, the von
Mises stress in the riser could not exceed 1/3 of the material yield strength of the riser.
Graphs showing contour lines of the von Mises stress divided by the yield stress for various
significant wave heights and wave periods were plotted for different riser column lengths. From
the graphs, it was determined there was a safe operational limit for significant wave heights less
than 3.5 meters for all the different riser column lengths.
A conclusion brought forth by the study determined that the waves and vessel motions are
important but the sea current profile is essential as it generally defines the maximum stress in
the riser [8].
In another article published BOP-deployed move saves time, money the drill ship Discoverer
Spirit located in the Gulf of Mexico saved about a weeks’ worth of time and possible millions
of dollars by sailing with a suspended riser column and BOP from one well site to another [9].
The activity took place in water depths over 7000 feet, or roughly 2100 meters. The BOP was
pulled up 400 feet above the seabed prior to starting the sailing activity. The vessel reached a
max sailing speed of one knot while the rig crew rig paid close attention to the riser movements.
The rig would usually reach a sailing speed of 9 knots. Despite the slow speed, the rig saved a
considerable amount of time.

Analysis of Riser Loads during BOP Sailing
10
According to the article, sailing with a suspended riser column and BOP has been done on
multiple occasions. For example the R&B Falcon used the same method in February, 2001. The
Discoverer Spirit’s sister vessel Discoverer Enterprise sailed with a suspended riser column and
BOP in the Gulf of Mexico on multiple occasions and had its BOP submerged for the last 7
months in 2000 [9].
1.6 ORGANIZATION OF THESIS
Chapter 2 describes relevant subsea components and their respective functions.
Chapter 3 will look into relevant standards and requirements, specifically for marine drilling
risers.
Chapter 4 will discuss the environmental forces of interest and the corresponding background
theory.
Chapter 5 gives an overview of the programs SIMA and RIFLEX.
Chapter 6 gives an in depth explanation of the model in RIFLEX.
Chapter 7 summarizes and analyzes the results obtained from the simulations in RIFLEX.
Chapter 8 concludes the thesis.
Chapter 9 gives recommendations for further work related to the topic of BOP sailing.
Chapter 10 is an overview of all of the references used throughout the thesis.

11
2 RELEVANT SUBSEA COMPONENTS
2.1 BOP GENERAL
The blowout preventer or BOP was developed to drill for oil and gas [10]. Below the earth’s
surface are high pressure and high temperature oil and gas reservoirs which may be harmful to
equipment and rig crew on the surface if an uncontrolled leak of formation fluids were to occur.
A blowout is when oil and/or gas from the formations that are being penetrated flow
uncontrollably to the surface through the wellbore. The first barrier to prevent this from
happening is drilling mud or drilling fluid. These are weighted so that their specific weights
have a hydrostatic pressure at the bottom of the wellbore that is slightly higher than the static
pressure of the deposits. Having a hydrostatic pressure slightly higher than the formation
pressure will prevent the fluids within the formations to enter the wellbore. If the specific weight
of the drilling mud is not high enough and formation fluids are allowed to enter the wellbore,
the BOP stack will act as the second barrier and has the ability to completely close off the
wellbore using different types of rams [10].
Currently, two different types of BOP stacks are used: 1) subsea BOP stacks and 2)
onshore/surface BOP stacks. The BOP stacks are built up using two different types of rams: 1)
ram preventers and 2) annular preventers [10].
The ram type preventers can either be blind shear rams or pipe rams. The blind shear ram is
able to close off the wellbore by compressing and deforming the drill pipe or any other shareable
tools in the wellbore from both sides until they shear and fail. This will completely seal off the
wellbore and hence prevent any fluids from escaping to the surface either through the inside of
the drill pipe or the outside of the drill pipe. The pipe ram on the other hand is similar to the
blind shear ram, except that it has cut-outs in the middle which can form around the outside of
the drill pipe which will prevent fluids from escaping up between the tool in the wellbore and
the inside of the BOP [10]. An example of a pipe ram with the circular cut-outs in the middle
is seen in Figure 4.

Analysis of Riser Loads during BOP Sailing
12
Figure 4: Pipe ram preventer with the circular cut-outs in the middle [10].
The annular preventer is a rubber donut that forms around the drill pipe, liner, or any tool that
is in the wellbore [10]. It has the ability to seal off the area between the item in the wellbore
and the inside of the BOP.
For a BOP stack, the different rams are usually stacked on top of each other, for redundancy
purposes. That is if one ram fails to seal off the wellbore, there are backup options.
2.1.1 Subsea BOP
Subsea BOPs are utilized when a MODU or a drilling vessel performs well activities. Not all
well activities, however, require the subsea BOP i.e. retrieving the christmas tree (XT). The
subsea BOP stack is located on the seafloor on a subsea structure called a subsea template.
Hence, the rams have to be hydraulically operated since they are located where humans are
unable to physically reach them. The rams are controlled from the MODU and can be closed
off at any time.
Subsea BOPs are large in terms of weight and size. In the 1980s, their wet weight ranged
between 125 to 160 tonnes while their heights varied from 12 to 14 meters. The height and
weight of a subsea BOP has increased in recent years due to more stringent safety standards.
Nowadays, a typical subsea BOP has a wet weight ranging from 270 to 365 tonnes while its
height ranges from 14 to 15.5 meters [11].

Sigmund Anders Isaac Søgnesand
13
A typical schematic of a two-section subsea BOP is seen in Figure 5. The lower part is called
the BOP stack and is circled in red, while the LMRP stack sits on top of the BOP stack and is
circled in green.
Figure 5: Typical subsea BOP and LMRP stack [12].
LMRP stack
BOP stack

Analysis of Riser Loads during BOP Sailing
14
2.1.2 BOP Jump Tool
The BOP jump tool is often used while transporting a hanging/submerged BOP from one well
to another by means of sailing or jumping. A CAD (Computer Aided Design) drawing of the
BOP jump tool provided by Transocean is seen in Figure 6 below.
Figure 6: BOP jump tool provided used on Transocean Spitsbergen [13].
The BOP jump tool is formed as a circular T. The upper end of the BOP jump tool has a female
connection, called “box” which allows for connection with the male connection end of a drill
pipe called the “pin” [14].
The T-shape is meant to be located at the bottom of the string of drill pipes that is run down
through the drilling riser and into the BOP. The depth of the bottom of the string is
calculated/estimated so that one of the pipe rams can be closed and clamped right above the T-
shape. The T-shape will prevent the pipe ram from slipping and possibly separating from the
string of drill pipes.
Using the BOP jump tool can reduce the stresses in the riser column. This is done by pulling
the string of drill pipes upwards, resulting in less stresses being present in the riser column.

Sigmund Anders Isaac Søgnesand
15
Caution should be exercised by the rig personnel as the riser joints are designed to have a certain
amount of tension. If the riser joints become compressed, riser buckling may occur.
The sequence for using the BOP jump tool is in the following order [15]:
Run BOP jump tool on drill pipe
Land BOP jump tool in BOP
Engage BOP jump tool
o This is done by closing a pipe ram around the drill pipe
Lift, move and land BOP
Disengage BOP jump tool by opening pipe ram
Retrieve and lay down drill pipe and BOP jump tool
2.2 DRILLING RISERS
There are many different types of risers used in the offshore industry. Risers are predominantly
used for [16]:
Drilling
Completion/workover
Production/injection
Export
The designs of the different types of risers vary greatly in terms of dimensions, materials etc.
The risers of concern in this thesis are drilling risers. The primary functions of drilling risers is
to [17]:
Provide fluid communication between the wellbore and the MODU
Support the choke, kill and auxiliary lines
Guide tools into the wellbore
Serve as a string for running and retrieving the BOP
There are two types of drilling risers: 1) high-pressure drilling risers and 2) low-pressure drilling
risers [16]. For a MODU using a subsea BOP, a low-pressure drilling riser is conventionally
used. The term low-pressure drilling riser is due to the fact that the riser is not designed to
withstand full wellbore pressure. When the subsea BOP closes off the well, the riser is designed
to withstand the pressure exerted by the hydrostatic mud column. High-pressure risers are used

Analysis of Riser Loads during BOP Sailing
16
with surface BOPs and needs to be able to sustain wellbore pressure when the BOP is closed
off. Hence the name high-pressure drilling riser [16].
Riser joints are high strength, large diameter pipes with couplings at each end [17]. The marine
drilling risers main tube typically has an outside diameter of 21 ¼ in or 539.8 mm. Typical steel
grades used for the riser main tubes is API 5L X-52, X-65, and X-80 where the numbers
represent the minimum yield strength of the material in ksi. Each riser joint is usually 50 to 75
feet long (approximately 15 to 23 meters) [17].
In addition to the main riser tube, there are also four peripheral lines that are clamped to the
main tube [16]. A typical riser joint without buoyancy elements and four peripheral lines is seen
in Figure 7.
Figure 7: Aluminum drilling-riser joint with peripheral lines [16].
The four lines that are clamped to the riser joints are called kill line, choke line, and auxiliary
lines. The kill and choke lines are used to communicate with the wellbore when the rams in the
BOP stack are closed. The auxiliary lines are mud boost lines, hydraulic supply lines and, if
needed, an air supply line to control the buoyancy elements. The mud boost line is used to inject
drilling fluid into the riser right above the BOP stack in order to increase the velocity of the
returning fluids/drill cuttings. The hydraulic lines are multiple lines gathered in one larger
diameter line and is used to carry hydraulic operating fluid to the subsea BOP control pod. In
other words, it carries hydraulic oil that is used to control the different functions of the BOP
stack. The air supply line supplies air for the air can buoyancy elements [16, 17]

Sigmund Anders Isaac Søgnesand
17
Parts of the marine drilling riser column is often equipped with buoyancy elements which
decreases the risers submerged weight and hence reduces the top tension in the riser [17]. The
most common types of buoyancy elements are foam modules and air chambers or air cans. The
design and the number of buoyancy elements depends on the water depth and other design
criteria. Usually, there are multiple foam modules installed per riser joint with cut-outs for the
different lines that go along the riser column. Air cans are usually installed where the risers are
coupled together. Air is injected into the chambers through the air supply line and displaces
seawater which results in an upward force [17].
2.2.1 Spider and Gimbal
While deploying the riser column, the riser joints are coupled to each other on the drill floor
one-by-one then lowered down into the water. When a riser column is in the process of being
retracted, the riser joints are decoupled from each other one-by-one prior to being laid down.
In order to hold the riser column in place during coupling/decoupling, a device called a spider
is installed on the drillfloor and its function is to support the weight of the suspended riser
column and subsea BOP [18].
An example of a spider with hydraulic locking dogs as seen in Figure 8.
Figure 8:GE Vetco Gray MR-6E hydraulic spider [18].
The locking dogs are pushed in towards the outside of the riser joints and locks the riser joint
to the drillfloor.
The gimbal is installed between the spider and the drillfloor and assists in maintaining a
constant load on the riser and the spider as well as reducing the bending moments on the landing
shoulders [17]. When any vessel or riser movements occurs, or any off-center loads are placed

Analysis of Riser Loads during BOP Sailing
18
on the spider, the gimbal absorbs these loads and distributes the loads evenly across the spider
[19].
2.2.2 Tensioner System
The tensioner system is located at the top of the riser column and uses hydraulic rams with large
volume, air-filled accumulators to help maintain a nearly constant force in the tensioner lines.
The system, which usually comprises of multiple tensioner lines, applies a constant, vertical
force on the riser in order to control the stresses and displacements in the riser while the drilling
vessel is moving [17]. The tensioner system is usually a passive system, which means that it
does not require an outside power source in order to function.
2.2.3 Telescopic Joint
The function of the telescopic joint is to account for vertical motions between the static riser
column and the moving drilling vessel [17]. The telescopic joint consists of a tensioner ring, an
outer barrel, which is located at the top of the riser column, and an inner barrel, which is attached
to the drilling vessel. The tensioner ring is usually located at the top of the outer barrel, and
provides connections where the tensioner lines are attached [17].
2.2.4 Flex/ball Joints
Flex and ball joints are usually located on top of the subsea BOP stack and at the topmost part
of the riser column [17]. The function of the flex joint on top of the BOP stack is to allow
deviations in the angle between the BOP stack and the riser. This helps reduce the bending
moments in the riser and the wellhead, which the bottom of the BOP is attached to. In an ideal
situation, the BOP and riser is completely vertical and the drilling vessel is located directly
above the BOP stack. However, due to environmental forces acting on the drilling rig and
marine drilling riser, the angle of the riser may deviate from a perfect vertical position. The flex
joint at the top of the riser column allows for motions of the drilling rig [17].
2.3 OTHER RELEVANT SUBSEA COMPONENTS
Relevant subsea components is pointed out in Figure 9.

Sigmund Anders Isaac Søgnesand
19
Figure 9: Subsea template manifold other subsea equipment [20].
The subsea components in Figure 9 and their functions are described in the following text.
2.3.1 Subsea Template
A subsea template is a structure installed on the seabed. For the NCS subsea developments, the
subsea equipment is located within the subsea template structures [21]. The functions that the
subsea template shall achieve is to
Provide guide and hang-off for the conductor and wellhead in order to support drilling
of the wells
Support and provide a foundation structure to carry the weight of the manifold
Support tie-in of umbilical and export- and/or injection-pipeline
The subsea template supports the wellhead, manifold and control system as well as the
protection structure. The purpose of the protection structure is to protect the equipment installed
on the subsea template from third part damages such as dropped objects, trawl equipment etc.
[21].
Subsea Christmas Trees
Subsea
Manifold
Subsea
Wellheads
Guideposts
Subsea
Template
Seabed/seafloor

Analysis of Riser Loads during BOP Sailing
20
The designs of subsea templates vary such that one well or multiple wells can be drilled and
operated from the template. Each well has its own designated area called a slot. The template
in Figure 9 is a 5 slot template which means that up to 5 wells can be operated from the template.
2.3.2 Subsea Wellhead (WH) System
The location of the subsea wellhead is at the top of the wellbore, on the subsea template, and is
circular in geometry. The purpose of the wellhead system is to provide structural and pressure-
containing interface for the drilling and production equipment [21].
On the inside of the wellhead are a series of grooves where the casings and production tubing
are hung off (production tubing is hung off in the wellhead when vertical XTs are used). In
order to maintain pressure integrity in the open space (annulus) between the casings, seal
assemblies are used around the different grooves where the casings are hung off [21].
A typical 18 3/4 in wellhead with all of the casing strings and seal assemblies installed is seen
in Figure 10.

Sigmund Anders Isaac Søgnesand
21
Figure 10: Subsea wellhead with casings and seal assemblies [22].
Note on the outside of the wellhead on the topmost part is a set of connectors, called H4
connectors, which allows for the subsea BOP or subsea XT to be installed.
2.3.3 Subsea Christmas Trees (XTs)
Subsea XTs are large pieces of equipment with a series of valves that is installed on the subsea
template. The primary function of subsea XTs is to control and direct flow from the wellbore
to the manifold [21].
Two types of subsea trees are currently used: 1) horizontal trees (HXT) and 2) vertical trees
(VXT). The primary difference between the two types of XTs is where the production tubing is
installed. For the horizontal system, the production tubing is installed in the XT while for the
vertical system the production tubing is installed in the wellhead [21].

Analysis of Riser Loads during BOP Sailing
22
2.3.4 Bore Protector/Wear Bushing
Bore protectors and wear bushings are metal cylinders of various outside and inside diameters
that are installed on the inside the wellhead to protect the grooves where the casings and seal
assemblies are hung off from the equipment that is run in or pulled out of the well [22].
2.3.5 Guide Posts/Wires
Guide posts and guide wires are used to guide and align the equipment that is being
lowered/raised from the drill rig onto or from the subsea template. Permanent guide posts are
installed on the subsea template. Guide wires are attached to the top of the guide posts and
extends up to the drilling rig [22].
2.3.6 Subsea Manifold
Conventionally on the NCS, the subsea manifold is located on the subsea template. The purpose
of the subsea manifold is to [21]:
Gather streams from multiple wells into the same flow line
Monitor wellstreams
Control XT valves and manifold valves
2.3.7 Multipurpose Tool
The multipurpose tool is used to run and retrieve the bore protectors and wear bushings. It may
also be used to retrieve seal assemblies in the wellhead. An additional option is to attach a
jetting sub to the tool. The function of the jet sub is to wash and remove any debris inside the
wellbore i.e. within the wellhead and/or BOP [23].
2.3.8 Diverter System
The diverter system on a floating drilling rig is located right beneath the drill floor at the topmost
part of the drilling riser column. It is used to redirect returning flow away from the rigs drillfloor
[17].
2.4 SEQUENCE OF OPERATIONS
There is a general sequence of operations that is followed prior to, during and after a BOP
sailing activity. The sequence of operations depends on many factors. This includes, but is not
limited to, which and what activities have been performed and will be performed on the
upcoming well, the equipment installed in and on the well, the history of the wells (any
problems previously encountered), distance between wells, weather etc.

Sigmund Anders Isaac Søgnesand
23
The following sequence of operations is a generalized sequence of operations that may differ
between BOP sailing cases [15].
Run in hole with multipurpose tool and jetting sub on drill pipe
Wash and remove debris on the inside of wellhead and BOP
Latch on and retrieve wear bushing/bore protector
o If wear bushing or bore protector is installed
Pull out of hole and lay down wear bushing/bore protector, multipurpose tool and jetting
sub
Run in hole with BOP jump tool on drill pipe
Verify depth of BOP jump tool
o Has to be inside of BOP - below pipe ram that is to be closed around drill pipe
Engage BOP jump tool by closing pipe ram
Remove equipment at top of riser column
o Diverter
o Tensioners
o Upper flex joint
o Telescopic joint
Install riser spider
Read and record bulls eye reading(s) prior to disconnecting BOP
Disconnect BOP
Land and lock riser to riser spider
Verify distance between BOP and template using ROV
Release and pull up guide wires
Install corrosion/debris/dust cap on wellhead
Sail with BOP and drilling riser to new well
Open hatch at new well site
Orient rig and BOP
Verify distance between BOP and template using ROV
Install guide wires
Remove corrosion/debris/dust cap on wellhead
Inspect wellhead using ROV
Read and record bulls eyes readings prior to connecting BOP

Analysis of Riser Loads during BOP Sailing
24
Install equipment at top of riser column
o Diverter
o Tensioners
o Upper flex joint
o Telescopic joint
Land and connect BOP to wellhead
Confirm latching/locking of BOP by performing over pull test
Test BOP connector by closing shear ram and pressuring up below BOP against shallow
set plug
Open shear ram
Open pipe ram
Retrieve and lay down BOP jump tool
As mentioned, there may be deviations to the sequence of operations listed above. For example,
a smaller vessel that is cheaper to rent can open and close the protective hatches on the templates
as well as install and remove corrosion/dust/debris caps on the wellhead.

25
3 RELEVANT STANDARDS
The organizations DNV, ISO and API have separate standards for the offshore oil and gas
industry. Relevant standards from each of the respective organizations will be studied in this
section of the thesis. Of particular interest are standards pertaining to risers.
More specifically, the standards that will be looked into are:
DNV-OS-F201
ISO 13628-7
DNV-OS-H101
API-RP-16Q
NORSOK D-010
The DNV-OS-F201 and API-RP-16Q standards will look into various methodologies to
perform riser analyses. DNV-OS-F201 and ISO 13628-7 will be used to define the requirements
related to the design of riser connectors. DNV-OS-H101 contains requirements related to
performing marine operations. The NORSOK D-010 standard will look into testing of the
subsea BOP.
3.1 DNV-OS-F201, DYNAMIC RISERS
The dynamic riser standard is a general standard applicable to all types of offshore risers. The
standard gives criteria, requirements, and guidance on structural design as well as how to
perform analysis of riser systems exposed to static and dynamic loading.
A summary of the different limit states applicable to offshore risers is seen in Figure 11.

Analysis of Riser Loads during BOP Sailing
26
Figure 11: Summary of DNV's limit states [24].
3.1.1 Riser Yielding Assessment from DNV-OS-F201
The results from the simulations are analyzed using Microsoft Excel and equations from the
DNV-OS-F201 Dynamic Risers standard.
3.1.1.1 Summary of Equations Used
The moment and force in the riser column are perhaps the two most important parameters that
are provided by the RIFLEX simulations. Both of these parameters are included when using the
combined loading equation, Equation (3-1), from the offshore DNV-OS-F201 standard [24].
𝜂 = {𝛾𝑠𝑐 ∙𝛾𝑚} {|𝑀𝑑|
𝑀𝑘∙ √1 − (
𝑝𝑙𝑑 − 𝑝𝑒𝑝𝑏(𝑡2)
)2
+ (𝑇𝑒𝑑𝑇𝑘)2
}
+ (𝑝𝑙𝑑 − 𝑝𝑒𝑝𝑏(𝑡2)
)2
≤ 1
(3-1)
Where 𝜂 is the usage factor, 𝑀𝑑 is the design bending moment, 𝑀𝑘 is the plastic bending
moment resistance, 𝑇𝑒𝑑 is the design effective tension and 𝑇𝑘 is the plastic axial force
resistance, 𝛾𝑚 is the resistance factor that takes uncertainties in the material properties into
account, 𝛾𝑠𝑐 is a resistance factor dependent on the safety class or safety requirements of the

Sigmund Anders Isaac Søgnesand
27
design and the consequences of failure, 𝑝𝑙𝑑 is the local internal design pressure, 𝑝𝑒is the local
external pressure while 𝑝𝑏(𝑡2)is the burst resistance.
The original formula from the DNV-OS-F201 standard includes the difference between the
external and internal pressures in the riser. However, during a sailing operation the riser column
is filled with sea water [4]. The sea water column within the riser is assumed to go from mean
seal level to the bottom of the riser column, so the internal and external hydrostatic pressure is
more or less the same. Therefore, the difference in external and internal pressure is negligible.
This simplifies the equation above and subsequently the analysis of the riser. The new equation
where the pressure differences are neglected simplifies to Equation (3-2).
𝜂 = {𝛾𝑠𝑐 ∙𝛾𝑚} {|𝑀𝑑|
𝑀𝑘+ (
𝑇𝑒𝑑𝑇𝑘)2
} ≤ 1 (3-2)
For the equation to be satisfied and to prevent yielding, gross plastic deformation or wrinkling
due to combined loading, the left hand side of the equation must be less than or equal to one.
That is, 𝜂 ≤ 1. The rest of the equations used from the DNV-OS-F201 standard are listed in
Equations (3-3) - (3-11).
𝑀𝑑 = 𝛾𝐹 ∙ 𝑀𝐹 + 𝛾𝐸 ∙ 𝑀𝐸 + 𝛾𝐴 ∙ 𝑀𝐴 (3-3)
𝑀𝑘 = 𝑓𝑦 ∙ 𝛼𝑐 ∙ (𝐷 − 𝑡2)2 ∙ 𝑡2 (3-4)
𝛼𝑐 = (1 − 𝛽) + 𝛽 ∙𝑓𝑢𝑓𝑦
(3-5)
𝑓𝑢 = (𝑆𝑀𝑇𝑆 − 𝑓𝑢,𝑡𝑒𝑚𝑝) ∙ 𝛼𝑈 (3-6)
𝛽 =
{
(0.4 + 𝑞ℎ) 𝑓𝑜𝑟
𝐷
𝑡2< 15
(0.4 + 𝑞ℎ) (60 −𝐷𝑡2)
45 𝑓𝑜𝑟 15 <
𝐷
𝑡2< 60
0 𝑓𝑜𝑟𝐷
𝑡2> 60
(3-7)
𝑞ℎ = {
(𝑝𝑙𝑑 − 𝑝𝑒)
𝑝𝑏(𝑡2)
2
√3𝑓𝑜𝑟 𝑝𝑙𝑑 > 𝑝𝑒
0 𝑒𝑙𝑠𝑒
(3-8)
𝑝𝑙𝑑 = 𝑝𝑑 + 𝜌𝑖 ∙ 𝑔 ∙ ℎ (3-9)
𝑇𝑒𝑑 = 𝛾𝐹 ∙ 𝑇𝑒𝐹 + 𝛾𝐸 ∙ 𝑇𝑒𝐸 + 𝛾𝐴 ∙ 𝑇𝑒𝐴 (3-10)
𝑇𝑘 = 𝑓𝑦 ∙ 𝛼𝑐 ∙ (𝐷 − 𝑡2) ∙ 𝑡2 (3-11)

Analysis of Riser Loads during BOP Sailing
28
A more detailed summary of the equations and the definition of each of the parameters listed in
Equations (3-3) - (3-11) is found in Appendix A.
It should be noted that the plastic bending moment, 𝑀𝑘, and the plastic axial force, 𝑇𝑘, are both
dependent on the temperature derating factor, 𝑓𝑦 . According to DNV, when the operating
temperature increases the effective yield stress and tensile strength of the material will decrease.
Since the seawater in the North Sea is roughly equal to 2-4 °C, the decrease in the effective
yield stress and tensile strength properties is neglected. In other words, the yield stress and
tensile strength can be assumed to be equal to its values at room temperature multiplied by the
material strength factor, 𝛼𝑈.
In order to calculate the plastic bending moment, the values for 𝑀𝐹, 𝑀𝐸 and 𝑀𝐴 which are the
bending moments from functional loads, environmental loads, and accidental loads are needed.
In addition to this, the tension values needed to calculate the axial force are 𝑇𝑒𝐹, 𝑇𝑒𝐸, 𝑇𝑒𝐴 which
are defined as the effective tensions from functional loads, environmental loads and accidental
loads, respectively. The riser analysis performed in this thesis is performed with ULS loading
condition and therefore 𝑀𝐴 and 𝑇𝑒𝐴 have already been accounted for [24].
3.1.1.2 Types of Loads
Functional loads are defined as loads that occur due to the physical existence of the system.
Examples of functional loads are for a riser is [24]:
Weight and buoyancy
Weight of internal fluid
Loads from drilling operations
Thermal loads
Environmental loads are defined as loads imposed directly or indirectly to the system by the
ocean environment. Examples of environmental loads are:
Waves
Currents
Floater motions
Accidental loads are unforeseen loads exerted to the riser system, or when the riser is subjected
to loads in abnormal conditions, incorrect operation or loads due to technical failures. Examples
of accidental loads are [24]:

Sigmund Anders Isaac Søgnesand
29
Collisions
Fires
Failure of system
o Loss of buoyancy elements
o Heave compensator failure
o Loss of DP (Dynamic Positioning) system
Environmental events
o Eartquake
o Tsunami
o Iceberg
3.1.1.3 Safety Factors
The safety factors 𝛾𝐹, 𝛾𝐸, and 𝛾𝐴 for each of the different load types are also needed. The values
for the safety factors depends on the type of limit state used for the analysis. Different limit
states have different safety factors. The safety factors in Table 1 are taken from DNV-OS-F201
and can be used for analyses corresponding to the different limit states.
Table 1: Load effect factors [24].
Limit state F-load effect E-load effect A-load effect
𝜸𝑭 𝜸𝑬 𝜸𝑨 ULS 1.1 1.3 NA
FLS 1.0 1.0 NA
SLS & ALS 1.0 1.0 1.0
There is no 𝛾𝐴 for the ultimate limit state and fatigue limit state due to the fact that accidental
loads are already included in these load designs.
The safety class resistance factor, 𝛾𝑠𝑐, is dependent on how conservative the design is supposed
to be and its values are listed in Table 2.
Table 2: Safety class resistance factors, 𝜸𝒔𝒄 [24].
Low Normal High
1.04 1.14 1.26
Low, normal and high refers to how safe the design is with respect to the resistance factor. The
material resistance factor, 𝛾𝑚, is dependent on the limit state used for the analysis and values
corresponding to each respective limit state are listed in Table 3.

Analysis of Riser Loads during BOP Sailing
30
Table 3: Material resistance factor, 𝜸𝒎 [24].
ULS & ALS SLS & FLS
1.15 1.0
For the analysis of the suspended riser column, the ULS safety factors are used.
3.2 API-RP-16Q
American Petroleum Institute 16Q is the recommended practice for design, selection, operation
and maintenance of marine drilling riser systems [17]. According to the standard, common steel
grades used in risers are X-52, X-65 and X-80, where the numbers represents the minimum
yield strength (in ksi) of the material.
The standard also mentions different riser handling systems and riser hang-off systems for
emergency disconnect situations. It is a possibility that the same systems can be used while
sailing with a suspended riser column and BOP. The diverter handling tool can be used to
support the entire weight of the riser and BOP. The standard states that
“the disconnected riser may be hung off from the hook, the spider, the diverter housing…”.
While choosing the hang-off system, the dynamic loads exerted to the riser should be
considered to ensure that the hang-off system has sufficient strength and make sure there is no
damage imposed on the riser nor the vessel.
The standard has defined operating guidelines for drilling, non-drilling and riser disconnect
modes. The mode of concern for this thesis is the disconnected mode, in which the riser is
disconnected from the template. For each of the respective modes there are two methods;
method A which applies to most water depths and method B which is for deeper water depths.
Due to the small water depths on the Norwegian Continental Shelf, method A is the most
appropriate method.
The stress criteria for method A is 0.67𝜎𝑦 where 𝜎𝑦 is the minimum wield strength of the
material. The stresses in the riser are calculated using von Mises stress criterion which is given
in Equation (3-12).
𝜎𝑣𝑚 = √1
2[(𝜎1 − 𝜎2)2 + (𝜎2 − 𝜎3)2 + (𝜎3 − 𝜎1)2] (3-12)

Sigmund Anders Isaac Søgnesand
31
Where 𝜎1, 𝜎2, and 𝜎3 are the axial bending stress, hoop stress and radial stress [17] as seen in
Figure 12.
Figure 12: Axial, hoop and radial stresses
The axial stress goes along the cylinder length, the hoop stress is the tangential stress, and radial
stress is due to internal and external pressures.
3.3 RISER CONNECTORS
While performing a riser analysis it is important to know whether any other components will
fail prior to the main tube of the riser joint. Therefore, the design standards and requirements
pertaining to riser connectors were looked further into. This was to determine whether the riser
connectors would be a weak or strong link in the riser column.
3.4 DNV-OS-F201, DYNAMIC RISER
The DNV-OS-F201, Dynamic Risers standard covers the design requirements for riser
connectors. In terms of functional requirements, the riser connectors should be able to be made
up and broken apart on multiple occasions without having reliability issues [24]. In addition to
this, the connectors shall not interfere or hinder normal operations that are taking place in and
around the riser.
In terms of design qualifications, the connectors shall be able to withstand the loads exerted to
them while they are being made up and broken down. They should be designed to be able to
withstand a variety of loads, such as loads from thermal effects, internal and external pressure
𝜎𝑟𝑎𝑑𝑖𝑎𝑙
𝜎ℎ𝑜𝑜𝑝 𝜎ℎ𝑜𝑜𝑝
𝜎𝑟𝑎𝑑𝑖𝑎𝑙
𝜎𝑎𝑥𝑖𝑎𝑙
𝜎ℎ𝑜𝑜𝑝

Analysis of Riser Loads during BOP Sailing
32
effects, bending moments, cyclic loading, as well as other internal and external loads exerted
to the riser. The connectors should at least be as strong as the riser main tube with respect to
strength, fatigue, leakage and fire resistance. This implies that the connectors shall not be the
weakest link in the riser column.
There shall be sealing elements between connections points of the riser joints. There are two
types of seals; integral seals which are built into the connector and are non-replaceable, and
non-integral seals which are separate sealing elements that are replaceable. The requirements
for the seals is that they should be able to withstand the operating conditions they are exposed
to. Sealing performance and sealing reliability are important factors while determining the
appropriate sealing elements for the riser [24].
3.5 ISO 13628-7
In the connector section in the dynamic riser standard there is a reference made to ISO 13628-
7 for further details on design, analysis and requirements. The ISO 13628 part 7 standard
pertains to completion and workover riser systems [25]. According to this standard, a connector
is defined as:
“mechanical device used to connect adjacent components in the riser system to
create a structural joint resisting applied loads and preventing leakage”.
There are some fundamental design requirements that apply to the connectors such as the
connectors should be able to withstand loads they are subjected to, meet a certain level of safety,
provide sufficient structural resistance, leak-tight, and transfer loads smoothly between riser
joints.
In terms of loads, the connectors should be able to withstand the same loads as the riser joints.
The weakest part, or the part that can withstand the smallest loads, defines the maximum load
that the riser column may be subjected to.
The suitability of the connectors for the specific application shall be based on analytical and
experimental methods. The connectors should be designed to have a margin of safety with
respect to all of the relevant failure modes. Make-up and break-out procedures are to be
specified and followed carefully.
The seal requirements in the ISO standard is the basis for the seal requirements in the DNV
standard. The integrity of the seal shall be intact while exposed to both internal and external

Sigmund Anders Isaac Søgnesand
33
fluids and loading. The seals should have a certain amount of corrosion resistance and the
material of the seals should be paired with the material of the surrounding parts in order to avoid
galvanic corrosion [25].
3.6 DNV-OS-H101, MARINE OPERATIONS, GENERAL
There are two types of marine operations; 1) weather restricted and 2) weather unrestricted
operations [26]. Weather restricted operations normally have a reference period, TR, less than
96 hours and a planned operation period, TPOP, time less than 72 hours. Marine operations that
take longer than 96 hours are normally classified as weather unrestricted operations.
The reference period is defined as the planned operation time plus a maximum estimated
contingency plan, TC. The planned operation time is a conservative estimate of how long the
operation shall take. The contingency plan shall cover uncertainties in the operation as well as
other situations that may require additional time to complete the operation.
A favorable weather forecast has to be issued prior to the start of a weather restricted operation.
During the operation, weather forecasts are monitored continuously. Marine operations may
still be classified as weather restricted although the duration is longer than 96 hours by
continuously monitoring the current and forecasted weather and bringing the object into a safe
condition.
Weather unrestricted operations are operations based on environmental conditions from long-
term statistical data.
For weather restricted marine operations an operating limit, 𝑂𝑃𝐿𝐼𝑀, and an alpha factor, ∝, must
be defined. Operating limit criteria are weather conditions limiting a safe operation, usually
wind and waves. The operational criteria, 𝑂𝑃𝑊𝐹, is defined as Equation (3-13).
𝑂𝑃𝑊𝐹 =∝× 𝑂𝑃𝐿𝐼𝑀 (3-13)
If the values of for example significant wave height exceeds 𝑂𝑃𝑊𝐹, the operation is not feasible.
The alpha factor which is applicable to wind and significant wave height, is found in DNV’s
marine operations guidelines and is dependent on the duration of the planned operation period
and the forecast level.
There are three different types of weather forecast levels which are referred to as level A, B,
and C. Level A forecasts is applicable to major marine operations that are sensitive to
environmental conditions. These types of operations requires a meteorologist on site, while

Analysis of Riser Loads during BOP Sailing
34
level B and level C forecasts do not require a meteorologist on site. Examples of a level A
operation is mating operations, jack-up rig moves, offshore installation operations etc.
Level B forecasts are applicable to environmental sensitive operations that are important with
respect to value and consequences. Examples are offshore lifting and subsea installations. Level
C forecasts are applicable to typical marine operations that are less sensitive to weather and are
carried out on a regular basis. Typical examples of a level C forecasts are onshore/inshore lifting
and standard barge tow without wave restrictions. For all weather forecast levels, the maximum
weather forecast interval is 12 hours. After 12 hours a new weather forecast has to be issued
[26].
3.7 NORSOK D-010N
The NORSOK D-010N standard contains various criteria for testing of subsea BOP’s on the
NCS. Some of the criteria for BOP testing are [27]:
BOP shall be tested to full pressure rating once every 6 months
o Can be performed on the wellhead
Pressure tests shall be performed every 14 days
BOP function test shall be performed when BOP is on the seafloor
BOP function test with kill- and choke lines shall be performed weekly
Pressure test should be stable for 10 minutes during high pressure test and 5 minutes
during low pressure test
Prior to drilling, the BOP shall be tested to the maximum estimated pressure for the
relevant section
A complete overhaul and testing of BOP shall be performed every 5 years
The only point in the NORSOK standard that specifies how often the BOP has to be pulled
to the surface is for the complete overhaul of the BOP which has to occur every 5 years.
Besides this, the BOP can be submerged as long as the BOP function tests and pressure tests
are satisfactory.

35
4 LOADS ON RISER AND BOP
The MODU, marine drilling riser and subsea BOP stack are subjected to various environmental
forces during a BOP sailing activity.
The magnitude of the forces and their effects on the riser column may vary. These forces can
cause an increase/decrease in the forces and bending moments within the riser column. Figure
13 shows the some important environmental forces related to a BOP sailing activity.
Figure 13: Illustration of a MODU sailing with a suspended riser and BOP with various environmental forces acting
on the system [28].
The environmental forces of importance in this thesis is mainly due to:
Current
Significant wave height and wave period
These forces will be discussed more in depth in this part of the thesis.

Analysis of Riser Loads during BOP Sailing
36
4.1 CURRENTS
Ocean currents are bodies of moving water in the horizontal and/or vertical direction. The
direction and speed of ocean currents depends on the following factors [29]:
Tides
Local wind
Stokes drift
Geographical location
Storm surges
Density jumps in the upper ocean
The current direction and speed may change significantly over the length of the riser column.
4.2 WAVES
Waves are of importance with regards to forces exerted to the MODU, drilling riser column and
subsea BOP stack. In addition to this, the weather criteria for the sailing activity is largely based
on the wave properties. Fundamental background information related to waves will therefore
be summarized. All of the information related to wave theory is taken from [29]. This includes
Basic assumptions for potential theory
Boundary conditions
o Kinematic
o Dynamic free-surface
Regular wave theory
Irregular wave theory
4.2.1 Basic Assumptions for Potential Theory
For any given time, a velocity potential, 𝜙, can be used to describe the fluid velocity vector as
in Equation (4-1).
𝑉 = ∇𝜙 = 𝑖
𝜕𝜙
𝜕𝑥+ 𝑗
𝜕𝜙
𝜕𝑦+ 𝑘
𝜕𝜙
𝜕𝑧 (4-1)
Where 𝑖, 𝑗, and 𝑘 are unit vectors along the x-, y-, and z-axes, respectively. One assumption is
that the fluid is irrotational. This is true when Equation (4-2) is zero everywhere within the
fluid.

Sigmund Anders Isaac Søgnesand
37
𝜔 = 𝛻𝑥𝑉 = 0 (4-2)
The continuity equation describes seawaters incompressibility using Equation (4-3).
𝛻 · 𝑉 = 0 (4-3)
Which has to satisfy the LaPlace equation in Equation (4-4).
𝜕2𝜙
𝜕𝑥2+𝜕2𝜙
𝜕𝑦2+𝜕2𝜙
𝜕𝑧2= 𝛻2𝜙 (4-4)
4.3 BOUNDARY CONDITIONS
In the following section the boundary conditions for two scenarios are presented, kinematic
boundary conditions and dynamic free-surface condition.
4.3.1 Kinematic Boundary Conditions
Kinematic boundary conditions ensures that the vertical velocity at the seabed is zero. For a
body that is fixed this is satisfied using Equation (4-5) on the surfaces body.
𝜕𝜙
𝜕𝑛= 0 (4-5)
Equation (4-5) represents impermeability, in other words no fluid enters or leaves the body
surface. If the body is moving forward with a velocity, 𝑈, the equation can be written as
Equation (4-6).
𝜕𝜙
𝜕𝑛= 𝑈 · 𝑛 (4-6)
Where 𝑈 may vary, depending on location on the body surface. Using the substantial derivative
𝐷𝐹/𝐷𝑡 as a function of 𝐹(𝑥, 𝑦, 𝑧, 𝑡) one is able to express the rate of change with time of the
function 𝐹 when a fluid particle is followed in space. Mathematically it is expressed as Equation
(4-7).
𝐷𝐹
𝐷𝑡=𝜕𝐹
𝜕𝑡+ 𝑉 · 𝛻𝐹 (4-7)
Where 𝑉 is the fluid velocity at the point (𝑥, 𝑦, 𝑧) at time 𝑡 . The free surface is also
impermeable, so a particle at the free surface is assumed to stay at the free surface. Therefore,
𝐷𝐹/𝐷𝑡 = 0. The following kinematic boundary condition can then be applied to the free-
surface using Equation (4-8).
∂ζ
∂t+∂ϕ
∂x
∂ζ
∂x+∂ϕ
∂y
∂ζ
∂y−∂ϕ
∂z= 0 (4-8)

Analysis of Riser Loads during BOP Sailing
38
On z=𝜁(x, y, t). Second order terms can be neglected for small wave amplitudes. Then, the
linear expression for kinematic free-surface simplifies to Equation (4-9).
𝜕𝜁
𝜕𝑡=𝜕𝜙
𝜕𝑧 (4-9)
4.3.2 Dynamic Free-surface Condition
In order to satisfy the dynamic free-surface condition, the water pressure at the free-surface is
equal to atmospheric pressure, 𝑝0. This condition can be expressed by the Bernoulli equation in
Equation (4-10).
𝑝 + 𝜌𝑔𝑧 + 𝜌
𝜕𝜙
𝜕𝑡+𝜌
2𝑉 · 𝑉 = 𝐶 (4-10)
Where 𝐶 is an arbitrary function of time. If we choose 𝐶 to be 𝑝𝑜/𝜌 so that the equation holds
with no fluid motion, then the Bernoulli equation is modified to Equation (4-11).
𝑔𝜁 +
𝜕𝜙
𝜕𝑡+1
2((𝜕𝜙
𝜕𝑥)2
+ (𝜕𝜙
𝜕𝑦)2
+ (𝜕𝜙
𝜕𝑧)2
) = 0 (4-11)
On z=𝜁(x, y, t). Prior to solving the problem we do not know where the free-surface is. In this
derivation, we assume that there is no forward speed and that the current is zero. In order to get
a linear relation, the second order terms are neglected and the equation simplifies to Equation
(4-12).
𝑔𝜁 +
𝜕𝜙
𝜕𝑡= 0 (4-12)
On z=0. Combining this equation with the linear expression for the kinematic free-surface we
get Equation (4-13).
𝜕2𝜙
𝜕𝑡2+ 𝑔
𝜕𝜙
𝜕𝑧= 0 (4-13)
On z=0.
If the velocity potential 𝜙 is oscillating harmonically in time with circular frequency 𝜔 we can
write the equation as Equation (4-14).
−𝜔2𝜙 + 𝑔
𝜕𝜙
𝜕𝑧= 0 (4-14)
On z=0.

Sigmund Anders Isaac Søgnesand
39
4.3.3 Regular Waves
Regular wave theory assumes that there is a horizontal sea bottom and an infinitely large
horizontal free-surface. In addition to this regular wave theory is based on potential flow theory,
which means the fluid is considered irrotational, inviscid and incompressible.
For any given time within the fluid a velocity potential, 𝜙, can be used to describe the fluids
velocity vector 𝑉(𝑥, 𝑦, 𝑧, 𝑡) = (𝑢, 𝑣, 𝑤) at a time 𝑡 at a point 𝒙 = (𝑥, 𝑦, 𝑧) in a Cartesian
coordinate system fixed in space. This can be expressed mathematically using Equation (4-15).
𝑉 = ∇𝜙 = 𝑖
𝜕𝜙
𝜕𝑥+ 𝑗
𝜕𝜙
𝜕𝑦+ 𝑘
𝜕𝜙
𝜕𝑧 (4-15)
Where 𝑖, 𝑗, and 𝑘 are unit vectors in the x-, y-, and z-axes. The fluid is considered irrotational
when the vorticity vector in Equation (4-16) is zero everywhere in the fluid.
𝜔 = 𝛻𝑥𝑉 = 0 (4-16)
Also, the seawater is considered incompressible when 𝛻 · 𝑉 = 0 holds true.
The velocity potential for the fluid in finite water depth is expressed using Equation (4-17).
𝜙 =
𝑔𝜁𝑎𝜔
cosh 𝑘(𝑧 + ℎ)
cosh 𝑘ℎcos(𝜔𝑡 − 𝑘𝑥) (4-17)
Where 𝑔 is the acceleration due to gravity, 𝜁𝑎 is the wave amplitude, 𝜔 is the waves angular
frequency, 𝑘 is the wave number, 𝑧 is the vertical coordinate, ℎ is the average water depth, 𝑡 is
a time variable, 𝑧 is the position in the vertical plane is usually set to 0 at the water surface and
𝑥 is the position along the x-axis.
The wave number 𝑘 can be found using Equation (4-18).
𝑘 =𝑔
𝜔2tanh(𝑘ℎ) (4-18)
Where iteration is required to find 𝑘 . The equations above applies for both shallow and
infinitely deep water depths. However, certain simplifications can be made for deep water
depths to make the equations easier to use during analysis. Simplifications for deep water depths
can also be applied to the equation to find the wave number 𝑘 so that an iteration procedure is
no longer required.
The x-component, 𝑢, of the velocity potential is defined in Equation (4-19).
𝑢 = 𝜔𝜁𝑎
cosh 𝑘(𝑧 + ℎ)
sinh𝑘ℎsin(𝜔𝑡 − 𝑘𝑥) (4-19)

Analysis of Riser Loads during BOP Sailing
40
By differentiating the x-component of the velocity, the acceleration in the x-direction, �̇� ,
becomes Equation (4-20).
�̇� = 𝜔2𝜁𝑎
cosh 𝑘(𝑧 + ℎ)
sinh𝑘ℎcos(𝜔𝑡 − 𝑘𝑥) (4-20)
Which can be similarly derived for the y-direction. For the z-direction the velocity potential,
𝑤, is defined in Equation (4-21).
𝑤 = 𝜔𝜁𝑎
sinh 𝑘(𝑧 + ℎ)
sinh 𝑘ℎcos(𝜔𝑡 − 𝑘𝑥) (4-22)
And differentiating the velocity in the z-direction once, the acceleration in the z-direction, �̇�,
becomes Equation (4-23).
�̇� = −𝜔2𝜁𝑎
sinh 𝑘(𝑧 + ℎ)
sinh 𝑘ℎsin(𝜔𝑡 − 𝑘𝑥) (4-24)
Where the wave elevation, 𝜁𝑎, is a sine wave that propagates in the positive x-direction and is
defined in Equation (4-25).
𝜁 = 𝜁𝑎 sin(𝑤𝑡 − 𝑘𝑥) (4-26)
The dynamic pressure exerted by the waves in a finite water depth can be described by Equation
(4-27).
𝑝𝐷 = 𝜌𝑔𝜁𝑎
cosh 𝑘(𝑧 + ℎ)
cosh 𝑘ℎsin(𝜔𝑡 − 𝑘𝑥) (4-28)
Where 𝜌 is the density of seawater.
4.3.4 Irregular Sea
Irregular seas states are used for a large part of the analysis. The irregular waves are long crested
and propagate in the same direction. This type of sea state can be described by regular sea states
of different amplitudes, wavelengths and propagation directions.
The wave elevation for irregular seas can be described by Equation (4-29).
𝜁 =∑𝐴𝑛 sin(𝑤𝑛𝑡 − 𝑘𝑛𝑥 − 𝜖𝑛)
𝑁
𝑗=1
(4-30)
Where
𝑁/𝑛 is the number of wave components
𝐴𝑛 = amplitude of the nth wave component

Sigmund Anders Isaac Søgnesand
41
𝜔𝑛 = angular frequency the nth wave component
𝑘𝑛 = wave number for the nth component
𝜖𝑛 = random phase angle of the nth wave component, value between 0-2π
4.4 MORISON’S EQUATION
Morison’s equation is often used to calculate wave induced loads on slender, circular structures
[29]. The equation gives the horizontal force per unit length on a rigid circular cylinder and is
expressed using Equation (4-31).
𝑑𝐹 = 𝜌
𝜋𝐷2
4𝑑𝑧𝐶𝑀�̇� +
𝜌
2𝐶𝐷𝐷𝑑𝑧|𝑢|𝑢 (4-31)
Where 𝐷 is the cylinder diameter, 𝑢 and �̇� is the horizontal velocity and acceleration of the
fluid strip while 𝐶𝑀 and 𝐶𝐷 are the mass and drag coefficients.
Taking into the account the relative velocity between the cylinder and the fluid, Equation (4-31)
can be modified to Equation (4-32).
d𝐹 =
1
2𝜌𝐶D𝐷dz(𝑢 − �̇�)|𝑢 − �̇�| + 𝜌𝐶𝑀
𝜋𝐷2
4dz𝑎1
− 𝜌(𝐶𝑀 − 1)𝜋𝐷2
4dz�̈�
(4-32)
Where �̇� and �̈� is the velocity and acceleration of the riser. The equations above are for a rigid
cylinder [29].
4.5 EFFECTIVE TENSION
The effective tension is an important parameter with respect to riser analysis. The effective
tension in the riser is defined in Equation (4-33).
𝑇𝑒 = 𝑇𝑊 − 𝑝𝑖𝐴𝑖 + 𝑝𝑒𝐴𝑒 (4-33)
Where 𝑇𝑊 is the true wall tension, 𝑝𝑖 and 𝑝𝑒 is the internal and external pressures, 𝐴𝑖 and 𝐴𝑒 is
the internal and external cross sectional areas [30].
The effective tension of the riser column is the axial force in the riser column when taking into
account the internal and external fluids in and around the riser. An example of a pipe with
internal and external fluids with corresponding force systems can be seen in Figure 14.

Analysis of Riser Loads during BOP Sailing
42
Figure 14: Pipe with internal and external fluids and equivalent force systems [30].
The weights per unit length of the tube, the internal fluid column, the displaced fluid column
and the equivalent system is represented by 𝑤𝑡, 𝑤𝑖, 𝑤𝑒, and 𝑤𝑎.

43
5 SIMA/RIFLEX
The information in this chapter is found in the RIFLEX Theory Manual, SIMA User Guide and
RIFLEX User Guide. The theory of the computer programs used to model and simulate the
BOP sailing model is described more in depth
5.1 SIMA IN GENERAL
SIMA is used for modeling and analyzing objects within marine technology [31]. Prior to
SIMA, a text file was used in order to create input to RIFLEX. Now SIMA enables the user to
get a 3D graphical model of the objects being modelled and analyzed. This saves time as the
user is able to visualize the model and get continuous feedback [31].
5.2 RIFLEX IN GENERAL
RIFLEX is a computer program used as a tool to analyze marine riser systems and other slender,
flexible marine structures such as mooring lines, umbilicals, and pipelines [32]. These
structures are characterized by small bending stiffness’s, large deflections, nonlinear cross
sectional properties, and have complex cross sectional structures.
RIFLEX is able to compute the static and dynamic characteristics of the structure and is based
on nonlinear finite element formulation [32].
5.3 STRUCTURE OF RIFLEX
RIFLEX is consists of different modules that communicate via the file system, as seen in Figure
15.

Analysis of Riser Loads during BOP Sailing
44
Figure 15: Strucutre of the RIFLEX program [32].
When RIFLEX is performing analyses, modules are working, communicating and sharing
information with each other. In order for RIFLEX to perform a complete dynamic analysis, all
of the modules have to be run [32].
5.3.1 INPMOD Module
The INPMOD module reads, interprets and organizes the input data into a system description
file called SYSFIL. This includes data for the system and the environment. Multiple analyses
can be performed without rerunning INPMOD [32].
5.3.2 STAMOD Module
The objective of the STAMOD module is to determine the initial configuration for dynamic
analyses. The STAMOD module also performs static analyses. The SYSFIL file, which was
organized and modified by the INPMOD module, describes the system that is to be simulated.
The initial configuration for the dynamic analyses is written to the INIFIL file, which is to be
used by the DYNMOD module [32].
5.3.3 DYNMOD Module
The main function of the DYNMOD module is to initialize dynamic simulations and perform
time domain simulations of the system with the initial condition specified by the STAMOD
module in the INIFIL file. Time domain simulations is used to solve the equation of motion.
Different excitation forces may be applied to the system and its responses are determined. The
DYNMOD module is also able to calculate the natural frequencies and modeshapes of the
system [32].

Sigmund Anders Isaac Søgnesand
45
5.3.4 FREMOD Module
The FREMOD is not part of the current RIFLEX version and will therefore not be described
[32].
5.3.5 OUTMOD Module
The OUTMOD module is used for post-processing of the time series data. It generates a printout
of the results generated from the INPMOD, STAMOD and DYNMOD modules. It then
prepares a plot file called PLOFIL which can be used by the plot module, PLOMOD [32].
5.3.6 PLOMOD Module
The PLOMOD module uses the IFNP LO file to plot the results [32].
5.4 STATIC FINITE ELEMENT ANALYSIS
The purpose of the static analysis is to determine the nodal displacement vector so that the
complete system is in static equilibrium [30]. Solving Equation (5-1) will give the equilibrium
configuration.
𝑹𝑆(𝑟) = 𝑹𝐸(𝑡) (5-1)
Where
𝑟 – is a vector for the nodal displacements that includes all degrees of freedom for the system.
For a bar element this will include translations while for a beam element this will include
translations and rotations. Both the translation and rotations are relative to the stress free
configuration of the bar/beam element.
𝑹𝑆(𝑟) – Reaction force vector within the structure found by summing up all of the element
contributions. Contact forces are internal reaction forces.
𝑹𝐸(𝑟) – Vector due to external forces. The vector accounts for specific forces such as rigid
body forces for representation of buoys, clump weights etc. It also takes into account the
distributed loading (i.e. weight, buoyancy and current forces) from all elements.
In general, the internal reaction forces and the external loads are non-linear functions of the
nodal displacement vector. In order to find static equilibrium numerically, there will be an
incremental loading procedure with an equilibrium iteration at each load step. This is also
referred to as incremental-iterative procedure. This approach accumulates the external loads
through a number of small load increments then uses the displacement vector [30].

Analysis of Riser Loads during BOP Sailing
46
5.5 INCREMENTAL EQUILIBRIUM ITERATIONS
The force imbalance vector at incremental load step 𝑘 is introduced using Equation (5-2) [30].
𝑅𝑘(𝑟) = 𝑅𝑘𝑠(𝑟) − 𝑅𝑘
𝐸(𝑟) (5-2)
The static equilibrium configuration at load step 𝑘 is governed by zero imbalance force. The
first step to find this is to calculate a start value based on the static equilibrium configuration
computed at the previous load step using Equations (5-3) and (5-4).
∆𝑟𝑘
𝑜 = −[𝜕𝑅𝑘−1𝜕𝑟
]−1
(𝑅𝑘−1𝑠 − 𝑅𝑘
𝐸) (5-3)
rk0 = rk−1 − ∆rk
0 (5-4)
Where 𝜕𝑅/𝜕𝑟 is the Jacobian matrix, ∆𝑟 is the incremental displacement vector and subscripts
𝑘 and 𝑘 − 1 denote load step k and 𝑘 − 1.
The iteration method used for static analysis is the Newton-Raphson iteration procedure. The
expressions for correction of the displacement vector at iteration cycle 𝑗 is expressed using
Equations (5-5) and (5-6).
∆𝑟𝑘
𝑗= [
𝜕𝑅𝑘−1𝜕𝑟
]−1
𝑅𝑘𝑗−1
(5-5)
𝑟𝑘𝑗= 𝑟𝑘
𝑗−1− ∆𝑟𝑘
𝑗 (5-6)
It is important to have a well-established and reliable convergence criteria while performing
iterations so one knows when to stop the calculations. If 𝜀 is the predefined convergence
criteria, the Equation (5-7) has to be satisfied before the iteration is terminated.
‖∆𝑟𝑘𝑗‖
‖𝑟𝑘𝑗‖< 𝜀 (5-7)
Where the incremental norm is calculated using Equation (5-8) [30].
‖∆𝑟𝑘𝑗‖ = ‖𝑟𝑘
𝑗‖ − ‖𝑟𝑘
𝑗−1‖ (5-8)
5.6 DYNAMIC TIME DOMAIN ANALYSIS
Dynamic analysis is important to find out the maximum and minimum values for tension and
bending moments.
5.6.1 General
The dynamic equilibrium external force vector may be expressed using Equation (5-9) [30].
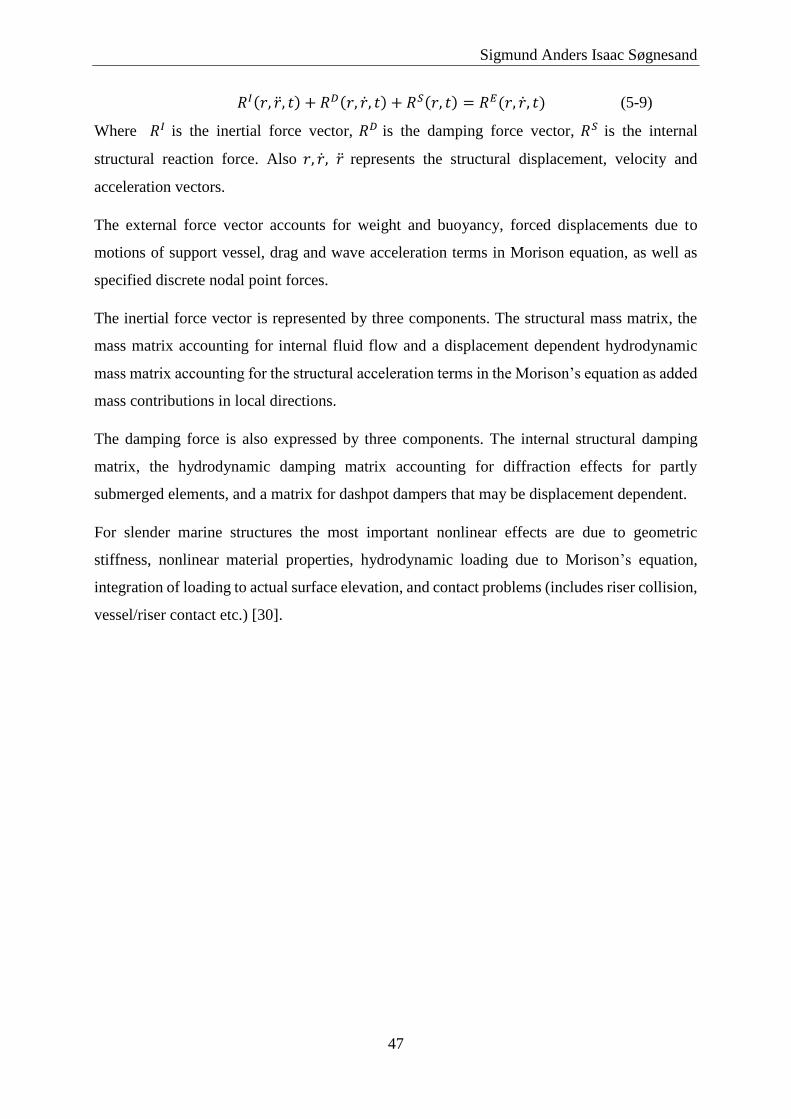
Sigmund Anders Isaac Søgnesand
47
𝑅𝐼(𝑟, �̈�, 𝑡) + 𝑅𝐷(𝑟, �̇�, 𝑡) + 𝑅𝑆(𝑟, 𝑡) = 𝑅𝐸(𝑟, �̇�, 𝑡) (5-9)
Where 𝑅𝐼 is the inertial force vector, 𝑅𝐷 is the damping force vector, 𝑅𝑆 is the internal
structural reaction force. Also 𝑟, �̇�, �̈� represents the structural displacement, velocity and
acceleration vectors.
The external force vector accounts for weight and buoyancy, forced displacements due to
motions of support vessel, drag and wave acceleration terms in Morison equation, as well as
specified discrete nodal point forces.
The inertial force vector is represented by three components. The structural mass matrix, the
mass matrix accounting for internal fluid flow and a displacement dependent hydrodynamic
mass matrix accounting for the structural acceleration terms in the Morison’s equation as added
mass contributions in local directions.
The damping force is also expressed by three components. The internal structural damping
matrix, the hydrodynamic damping matrix accounting for diffraction effects for partly
submerged elements, and a matrix for dashpot dampers that may be displacement dependent.
For slender marine structures the most important nonlinear effects are due to geometric
stiffness, nonlinear material properties, hydrodynamic loading due to Morison’s equation,
integration of loading to actual surface elevation, and contact problems (includes riser collision,
vessel/riser contact etc.) [30].

48
6 MODEL IN RIFLEX
This part of the thesis presents how the suspended riser column and BOP stack is modelled.
The model is created using the following procedure:
1. Obtain relevant riser and BOP data
2. Creating a suspended riser column and BOP model in SIMA/RIFLEX
3. Run simulations in SIMA/RIFLEX
4. Post processing the riser response provided by SIMA/RIFLEX
The following computer programs is used
RIFLEX: Used for static and dynamic analyses of the suspended riser column and BOP
stack.
Microsoft Excel 2013: For calculating and post processing data returned from the
simulation in RIFLEX.
Microsoft Word 2013: To write and present data from RIFLEX and Microsoft Excel.
A total of three different riser columns are created and the lengths of each riser column is:
311 m
800 m
1225 m
Figure 16 shows the model of the drilling rig with the suspended riser and BOP stack from the
side with the 311 m long riser column. The color scale to the left is not of importance with
respect to this thesis. In the bottom, left hand corner is the coordinate system referred to in the
text. Note that the x- and y-axis comprise the horizontal plane while the z-axis is the vertical
axis.

Sigmund Anders Isaac Søgnesand
49
Figure 16: MODU with 311 m long riser column.
For the BOP sailing activity the slip joint, tensioner system, upper flex joint and other parts
that make up the topmost part of the riser column are removed as mentioned in Section 1.2.
6.1 MODELLING AND ANALYSIS
In order to analyze the riser during a BOP sailing event, a physically correct model of a
suspended riser column with a subsea BOP stack is created. The Drilling riser example in
RIFLEX is used as a starting point for the BOP sailing model. However, the majority of the
parameters defining this system is changed at some point.
Some considerations to take into account while creating the new and altered model include:
Boundary conditions
Number of elements
Weather conditions
Length of simulations
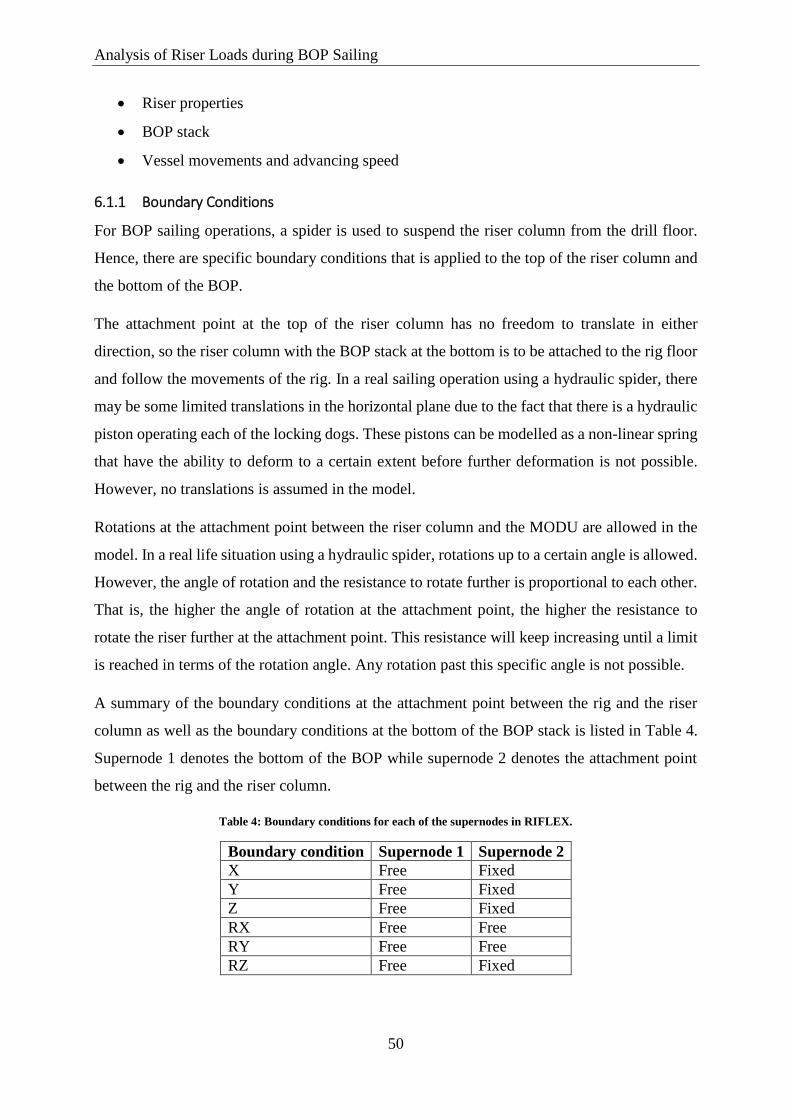
Analysis of Riser Loads during BOP Sailing
50
Riser properties
BOP stack
Vessel movements and advancing speed
6.1.1 Boundary Conditions
For BOP sailing operations, a spider is used to suspend the riser column from the drill floor.
Hence, there are specific boundary conditions that is applied to the top of the riser column and
the bottom of the BOP.
The attachment point at the top of the riser column has no freedom to translate in either
direction, so the riser column with the BOP stack at the bottom is to be attached to the rig floor
and follow the movements of the rig. In a real sailing operation using a hydraulic spider, there
may be some limited translations in the horizontal plane due to the fact that there is a hydraulic
piston operating each of the locking dogs. These pistons can be modelled as a non-linear spring
that have the ability to deform to a certain extent before further deformation is not possible.
However, no translations is assumed in the model.
Rotations at the attachment point between the riser column and the MODU are allowed in the
model. In a real life situation using a hydraulic spider, rotations up to a certain angle is allowed.
However, the angle of rotation and the resistance to rotate further is proportional to each other.
That is, the higher the angle of rotation at the attachment point, the higher the resistance to
rotate the riser further at the attachment point. This resistance will keep increasing until a limit
is reached in terms of the rotation angle. Any rotation past this specific angle is not possible.
A summary of the boundary conditions at the attachment point between the rig and the riser
column as well as the boundary conditions at the bottom of the BOP stack is listed in Table 4.
Supernode 1 denotes the bottom of the BOP while supernode 2 denotes the attachment point
between the rig and the riser column.
Table 4: Boundary conditions for each of the supernodes in RIFLEX.
Boundary condition Supernode 1 Supernode 2
X Free Fixed
Y Free Fixed
Z Free Fixed
RX Free Free
RY Free Free
RZ Free Fixed

Sigmund Anders Isaac Søgnesand
51
X, Y and Z denotes translations in the x-, y-, and z-axes while RX, RY RZ denotes rotations
about the x-, y-, and z- axes, respectively. The x- and y-axes comprise the horizontal plane
while the z-axis is the vertical axis.
6.1.2 Elements
SIMA/RIFLEX uses finite element method to calculate the forces and bending moments within
structures. A rule of thumb for the finite element method is that with smaller element lengths,
the more accurate the results. In other words, the more elements per unit length, the more
accurate the results become. The reason is that the calculations are iterative, where the results
calculated for the next element is dependent on the results obtained from the last element.
It is important to note that when increasing the number of elements, the computational time
used to calculate the results for the simulations will increase. Therefore it was concluded that
element lengths of roughly 1 m is sufficient based on an element convergence study conducted
in Section 7.1.1.
6.1.3 Seed Numbers
The seed number has to be specified prior to performing the simulation. The seed number is an
input parameter for the DYNMOD module and specifies the number of random phase angles
that are created during the dynamic calculation. By varying the seed number, one will vary the
number of generated time series for wind and waves [33].
6.1.3.1 PRNG to Create Seed Numbers
Random number generators (RNGs) are generators used to generate random numbers. The term
pseudo means not real or a sham [34]. Based on this, pseudorandom number generators or
PRNGs produce “fake” random numbers. The reason for its name is due to the fact that PRNGs
use algorithms to generate “random” numbers [35].
Based on feedback from representatives in Marintek, it was concluded that Microsoft Excel is
the best program to generate random numbers for the simulations. For each sea state, a total of
5 random numbers are generated and then exported to RIFLEX. These numbers are then used
as inputs for the seed values in each of the respective runs for each sea state.
6.1.4 Weather Conditions
The loads exerted to the riser, BOP and LMRP are predominantly due to waves and currents.

Analysis of Riser Loads during BOP Sailing
52
6.1.4.1 Sea Spectrum
To describe the irregular sea state for the dynamic analysis in SIMA/RIFLEX, a 3-parameter
JONSWAP spectrum is used. The significant wave height, 𝐻𝑠 , and peak period, 𝑇𝑝 , were
parameters that are varied between runs. The gamma value of 3.3 is the default value in the
original RIFLEX model and is not changed throughout the runs. A summary of the parameters
for the irregular sea states used in the simulations is listed in Table 5.
Table 5: Parameters used for irregular sea analysis in RIFLEX simulations.
Parameter Value
Direction 0.0
Spreading Code Unidirectional
Spreading 0.0
Significant Wave Height Variable
Peak Period Variable
Gamma 3.3 (default value)
6.1.4.2 Determining Sea States
The significant wave heights, 𝐻𝑠 , and the corresponding wave periods, 𝑇𝑝, is taken from a
scatter diagram. These parameters are decided based on which significant wave height and wave
period is most likely to occur. An excerpt of the scatter diagram used is seen in Table 6.
Table 6: Scatter diagram for Ekofisk data taken from 1980-1993 [36].
Significant
Wave
Height, 𝑯𝒔
Wave Period, 𝑻𝒑
<4 5 6 7 8 9 10 11 12 13
0.50 219 247 98 56 108 139 85 53 38 28 1.00 462 1444 1332 551 394 409 362 255 153 126 1.50 54 763 1991 1654 703 436 327 258 176 86 2.00 1 114 994 2015 1329 583 260 246 193 91 2.50 0 7 189 1122 1532 734 261 182 165 124 3.00 0 0 14 329 1082 958 309 137 139 96 3.50 0 0 0 59 533 983 382 140 87 72 4.00 0 0 0 10 133 660 418 144 65 36 4.50 0 0 0 0 28 313 417 149 41 25 5.00 0 0 0 0 2 113 271 190 40 19 5.50 0 0 0 0 0 23 154 136 49 23 6.00 0 0 0 0 0 4 61 109 52 26 6.50 0 0 0 0 0 0 20 58 35 14 7.00 0 0 0 0 0 0 6 23 35 14 7.50 0 0 0 0 0 0 2 21 16 13 8.00 0 0 0 0 0 0 0 4 8 9

Sigmund Anders Isaac Søgnesand
53
8.50 0 0 0 0 0 0 0 2 8 3 9.00 0 0 0 0 0 0 0 0 2 5 9.50 0 0 0 0 0 0 0 0 1 5 10.00 0 0 0 0 0 0 0 0 0 0
For the simulations, three states were chosen based on the likelihood of occurrence. The sea
states used in the simulations is listed in Table 7.
Table 7: Sea states used for the RIFLEX simulations.
Significant wave height, 𝑯𝒔 [m] Wave Period, 𝑻𝒑 [sec]
1 5
2 7
3 8
Significant wave heights higher than three meters is not used for the simulations. The reason
being that the likelihood of occurrence decreases by a large amount for significant wave heights
higher than three meters, based on the scatter diagram in Table 6. Another reason is that BOP
sailing activities are weather restricted and performing such an operation for significant wave
heights higher than three meters seems unlikely from an engineering point of view.
6.1.4.3 Currents
The currents used for the simulations are realistic but at the same time considered a worst case
scenario for each of the respective water depths. The reason for why the worst case scenario
currents are used is due to the assumption that this will have larger contributions to the
combined loading equation then for currents of smaller magnitudes.
The current profile used in the RIFLEX models for the three different riser columns is seen in
Figure 17 - Figure 19.

Analysis of Riser Loads during BOP Sailing
54
Figure 17: Current profile for 400 meter water depth [37].
The current velocity in Figure 17 has its maximum velocity at the surface and decreases linearly
with water depth.
Figure 18: Current profile for 800 meter water depth [37].
-400
-350
-300
-250
-200
-150
-100
-50
0
0 0.1 0.2 0.3 0.4 0.5 0.6 0.7 0.8
Dep
th [
m]
Current Speed [m/s]
Current profile for 400 m water depth
-800
-700
-600
-500
-400
-300
-200
-100
0
0 0.1 0.2 0.3 0.4 0.5 0.6 0.7 0.8
Dep
th [
m]
Current Velocity [m/s]
Current profile for 800 m water depth

Sigmund Anders Isaac Søgnesand
55
The current profiles for the 400 m and 800 m water depth resemble each other. That is, the
current decreases linearly from 0.8 m/s to 0.6 m/s from the surface to 300 m below mean sea
level. From 300 m to the seabed, the current decreases from 0.6 m/s to 0 m/s.
Figure 19: Current profile for 1300 meter water depth [38].
Notice that all of the current profiles have the same velocity at the surface. The velocity
decreases linearly to 0.6 m/s at 300 m water depth. For the 1300 m water depth, the current
decreases linearly from 0.6 m/s to 0.2 m/s between 300 m and 400 m water depth. From 400 m
to 1300 m water depth, the current decreases from 0.2 m/s to 0 m/s.
The current profile 1300 m water depth is chosen based on the current profile from Aasta
Hansteen field and the velocities for the different water depths are provided by Professor Carl
Martin Larsen. The current profiles and corresponding velocities for the 400 m and 800 m water
depths are current profiles that the author of the thesis and Professor Bernt J. Leira mutually
agreed upon.
All of the current profiles are identical down to 300 m water depth so the results are comparable
with each other. Note that RIFLEX can only model linear current profiles.
-1300
-1100
-900
-700
-500
-300
-100
0 0.1 0.2 0.3 0.4 0.5 0.6 0.7 0.8
Dep
th [
m]
Current Velocity [m/s]
Current profile for 1300 m water depth
Analysis of Riser Loads during BOP Sailing
56
6.1.5 Length of Simulations
The length of the simulations for each run depends on the length of the riser column. For the
1225 m long riser column, a simulation length of 1000 sec is used while for the 311 m and 800
m long riser column, simulation lengths of 2000 sec is used. The reason for the long simulation
lengths is that for irregular seas there are a number of waves with varying wave heights and
wave periods. The maximum wave height and wave period may or may not occur during this
time interval.
The simulations could be run for a longer period of time. However, due to limited computational
power it is not feasible with respect to time, especially for the longer riser columns i.e. 800 m
and 1225 m. The reason is due to the number of elements on the riser column. The element
lengths for each of the three riser columns is set to one meter. Hence, with increasing riser
column length is a corresponding increase in the number of elements which results in longer
computational times.
The time step also effects the computational time for the dynamic simulations. The time step is
the time interval between each calculation. That is, the time that is allowed to pass between the
previous calculation and the upcoming calculation. The smaller the time step, the more
calculations are performed during the dynamic simulation which results in a longer
computational time. The time step for the simulations was set to 0.1 sec for the 800 m and 1225
m long riser column, while the time step was 0.05 seconds for the 311 m long riser column. The
length of the time step used for the simulations is justified through a convergence study
performed in Section 7.1.2. This type of study is performed prior to running the simulations and
analyzing the data.
6.2 RISER COLUMNS
The riser column lengths used for the simulations is 311 m, 800 m and 1225 m.
A riser tally sheet and other information for a riser column used by the MODU Transocean
Spitsbergen while drilling in roughly 1300 m water depth is the basis for the riser joint
properties in this thesis. In the documents from Transocean, three different types of buoyancy
joints is used, each with different submerged weights as well as water depth ratings. The water
depth ratings are [39]:
7500 ft (2286 m
4500 ft (1372 m)
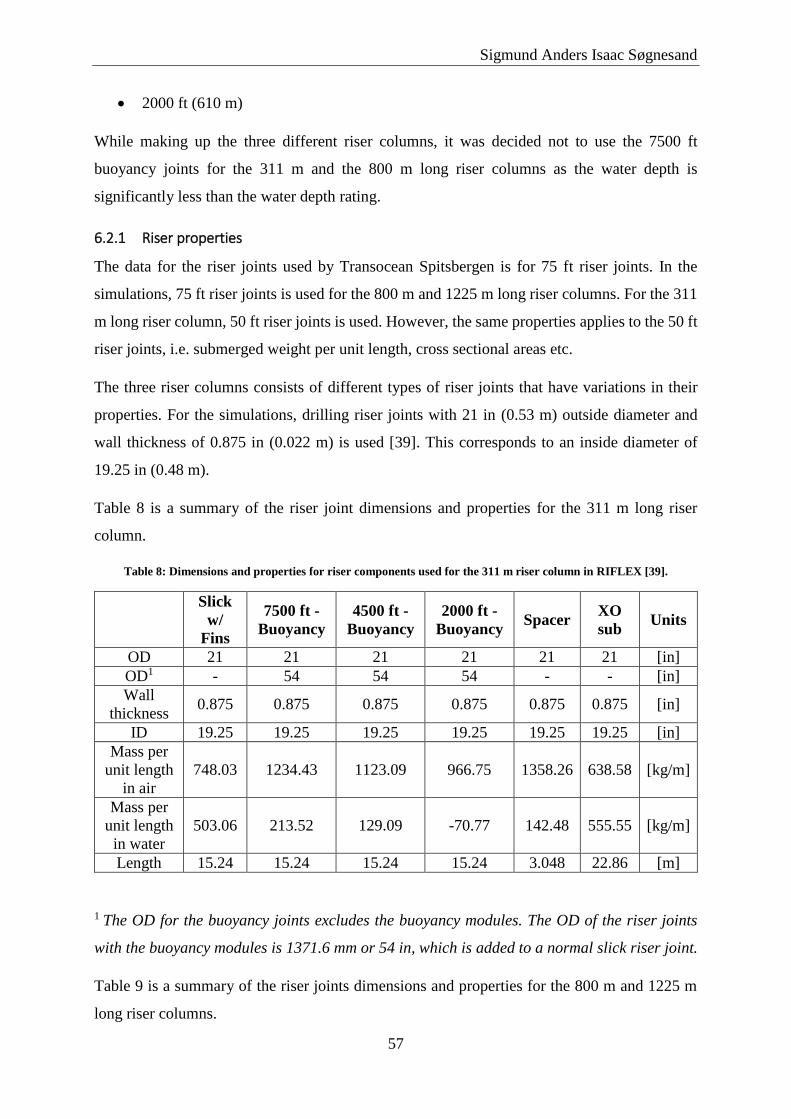
Sigmund Anders Isaac Søgnesand
57
2000 ft (610 m)
While making up the three different riser columns, it was decided not to use the 7500 ft
buoyancy joints for the 311 m and the 800 m long riser columns as the water depth is
significantly less than the water depth rating.
6.2.1 Riser properties
The data for the riser joints used by Transocean Spitsbergen is for 75 ft riser joints. In the
simulations, 75 ft riser joints is used for the 800 m and 1225 m long riser columns. For the 311
m long riser column, 50 ft riser joints is used. However, the same properties applies to the 50 ft
riser joints, i.e. submerged weight per unit length, cross sectional areas etc.
The three riser columns consists of different types of riser joints that have variations in their
properties. For the simulations, drilling riser joints with 21 in (0.53 m) outside diameter and
wall thickness of 0.875 in (0.022 m) is used [39]. This corresponds to an inside diameter of
19.25 in (0.48 m).
Table 8 is a summary of the riser joint dimensions and properties for the 311 m long riser
column.
Table 8: Dimensions and properties for riser components used for the 311 m riser column in RIFLEX [39].
Slick
w/
Fins
7500 ft -
Buoyancy
4500 ft -
Buoyancy
2000 ft -
Buoyancy Spacer
XO
sub Units
OD 21 21 21 21 21 21 [in]
OD1 - 54 54 54 - - [in]
Wall
thickness 0.875 0.875 0.875 0.875 0.875 0.875 [in]
ID 19.25 19.25 19.25 19.25 19.25 19.25 [in]
Mass per
unit length
in air
748.03 1234.43 1123.09 966.75 1358.26 638.58 [kg/m]
Mass per
unit length
in water
503.06 213.52 129.09 -70.77 142.48 555.55 [kg/m]
Length 15.24 15.24 15.24 15.24 3.048 22.86 [m]
1 The OD for the buoyancy joints excludes the buoyancy modules. The OD of the riser joints
with the buoyancy modules is 1371.6 mm or 54 in, which is added to a normal slick riser joint.
Table 9 is a summary of the riser joints dimensions and properties for the 800 m and 1225 m
long riser columns.

Analysis of Riser Loads during BOP Sailing
58
Table 9: Dimensions for riser component used for 800 m and 1225 m riser columns in the RIFLEX analysis [39].
Slick
w/
Fins
7500 ft -
Buoyancy
4500 ft -
Buoyancy
2000 ft -
Buoyancy Spacer
XO
sub Units
OD 21 21 21 21 21 21 [in]
OD1 - 54 54 54 - - [in]
Wall
thickness 0.875 0.875 0.875 0.875 0.875 0.875 [in]
ID 19.25 19.25 19.25 19.25 19.25 19.25 [in]
Mass per
unit length
in air
748.03 1234.43 1123.09 966.75 1358.26 638.58 [kg/m]
Mass per
unit length
in water
503.06 213.52 129.09 -70.77 142.48 555.55 [kg/m]
Length 22.86 22.86 22.86 22.86 3.048 22.86 [m]
1 The OD for the buoyancy joints excludes the buoyancy modules. The OD of the riser joints
with the buoyancy modules is 1371.6 mm or 54 in, which is added to a normal slick riser joint.
Slick riser joints with fins are regular riser joints equipped with fins to reduce the induced drag
forces. The fins are not modelled in RIFLEX. Spacer joints are short, regular riser joints used
to make the length of the riser column fit the distance between the drill floor and wellhead. For
example, if there is a distance of roughly 10 m that is missing to make up the riser column, it is
more appropriate to use three spacer joints that are 3.048 m in length then one riser joint that is
22.86 meters.
Based on Table 8 and Table 9 above, one can see that the mass per unit length in air of each of
the riser joints varies by a large amount for each of the respective riser joints. The buoyancy
joints have the largest mass per unit length in air as well as the largest external area. The large
external area results in a larger volume of seawater being displaced and hence creates a smaller
weight in water. The axial stiffness, bending stiffness, and torsional stiffness are identical for
all the different types of riser joints.
6.2.2 Making up Riser Columns
This section will give an overview of the combination of riser joints that makeup each of three
riser columns. While deciding how to make up the different riser columns, it is important to
take into account that the top of the buoyancy section is below the mean sea level during the
sailing operation. If the top of the buoyancy section extends above the mean sea level, there
will be a large added mass exerted to the riser column due to the relatively large outer diameter

Sigmund Anders Isaac Søgnesand
59
of the buoyancy modules. Another reason that the top of the buoyancy section shall be below
the mean sea level is due to the fact that the weight of the buoyancy joints in air is significantly
larger than regular riser joints. This may cause a large addition to the force at the top of the riser
column.
A summary of the combination of riser joints used for the 311 m long riser column is seen in
Table 10.
Table 10: Combination of riser joints used in 311.18 m long riser column.
Riser Joint
Unit
Length
[m]
Number of
joints
Length of
section
[m]
Accumulated length
[m]
Slick w/ fins 15.24 2 30.48 30.48
Buoyancy -
2000 15.24 4 76.2 106.68
Buoyancy –
4500 15.24 7 106.68 213.36
Slick w/fins 15.24 2 30.48 243.84
XO sub 22.86 1 22.86 266.7
Slick w/ fins 15.24 2 30.48 297.18
BOP stack 14 1 14 311.18
The order of the each of the respective riser joints corresponds to the order of the joints used
for the RIFLEX simulations. At the very top of the riser column, where the attachment point is
located to below the mean sea level, are slick riser joints. Further below the mean sea level are
different types of buoyancy joints etc. The BOP stack is located at the bottom of the riser
column. The distance between RKB and MSL is 17 meters, so the bottom of the BOP is located
at 294.18 meters below mean sea level.
A summary of the combination of riser joints used for the 800 m long riser column is seen in
Table 11.
Table 11: Combination of riser joints used in 800.38 m long riser column.
Riser Joint
Unit
Length
[m]
Number of
joints
Length of
Section
[m]
Accumulated Length
[m]
Spacer 3.048 3 9.144 9.144
Slick w/ fins 22.86 3 68.58 77.724
Buoyancy -
2000 22.86 7 160.02 237.744
Buoyancy –
4500 22.86 18 411.48 649.224

Analysis of Riser Loads during BOP Sailing
60
Slick w/fins 22.86 2 45.72 694.944
XO sub 22.86 1 22.86 717.804
Slick w/ fins 22.86 3 68.58 786.384
BOP stack 14 1 14 800.384
The bottom of the BOP stack for the 800 m long riser column is located 783.384 meters below
the mean sea level.
The 1225 m long riser column used in the simulations resembles the riser column that
Transocean Spitsbergen used while drilling in 1300 m water depth. A summary of the
combination of riser joints used for the 1225 m long riser column is seen in Table 12.
Table 12: Combination of riser joints used in 1225.58 m long riser column
Riser Joint
Unit
Length
[m]
Number of
joints
Length of
Section
[m]
Accumulated Length
[m]
Slick w/ fins 22.86 6 137.16 137.16
Buoyancy -
2000 22.86 8 182.88 320.04
Buoyancy -
4500 22.86 30 685.8 1005.84
Buoyancy -
7500 22.86 3 68.58 1074.42
Slick w/fins 22.86 2 45.72 1120.14
XO sub 22.86 1 22.86 1143.00
Slick w/ fins 22.86 3 68.58 1211.58
BOP stack 14 1 14 1225.58
For the 1225 m long riser column, the bottom of the BOP stack is 1208.28 meters below mean
sea level.
6.2.3 Weight of Riser Joints
Based on the information provided by Transocean, the weight per unit length in water and in
air of the riser joints are known. However, the input parameter for the riser joints weight in
RIFLEX is in terms of mass per unit length in air. If the mass per unit length in air taken from
the riser information is put directly into RIFLEX, the result will be an incorrect mass per unit
length in water. Hence, some calculations are performed such that the mass per unit length in
water would be the same as in the riser information sheet.
This can be done through the buoyancy relationship in Equation (6-1).

Sigmund Anders Isaac Søgnesand
61
𝑊𝑤𝑎𝑡𝑒𝑟 = 𝑔 (𝑚 −
𝑉𝜌𝑠𝑤𝑙) (6-1)
Where 𝑊𝑤𝑎𝑡𝑒𝑟 is the weight per unit length in water, 𝑔 is the acceleration due to gravity, 𝑚 is
the mass coefficient or mass per unit length of the riser joint in air, 𝑉 is the volume of the riser
joint, 𝜌𝑠𝑤 is the density of seawater and 𝑙 is the length of the riser joint. Solving the equation
for 𝑚 will given the mass coefficient in air which is needed as an input in RIFLEX. The mass
coefficient, 𝑚 , is defined in Equation (6-2).
𝑚 =
𝑊𝑤𝑎𝑡𝑒𝑟
𝑔+𝑉𝜌𝑠𝑤𝑙
(6-2)
Where 𝑉
𝑙 is the cross sectional area of the specific riser joint and is defined as 𝐴 =
𝑉
𝑙= 𝜋(𝑟𝑜
2 −
𝑟𝑖2). The outside radius of the riser joint is defined as 𝑟𝑜 while the inside radius of the riser joint
is defined as 𝑟𝑖. An illustration with the illustrating the external and internal areas of a hollow
cylinder with a certain wall thickness taken from SIMA is seen in Figure 20.
Figure 20: External and internal areas as defined in RIFLEX [40].
It should be noted that this procedure for finding the equivalent weight of the riser joints in air
is only valid if the riser column is filled with seawater. If another medium is present, such as
drilling mud or air, a more complex procedure for finding the equivalent weight of the riser
joints is required.
6.2.4 Steel Grades
As mentioned in Section 3.2, the three most common steel grades used for riser joints are API
5L X52, X65 and X80. It is concluded that API 5L X52 is the most common type of steel grade
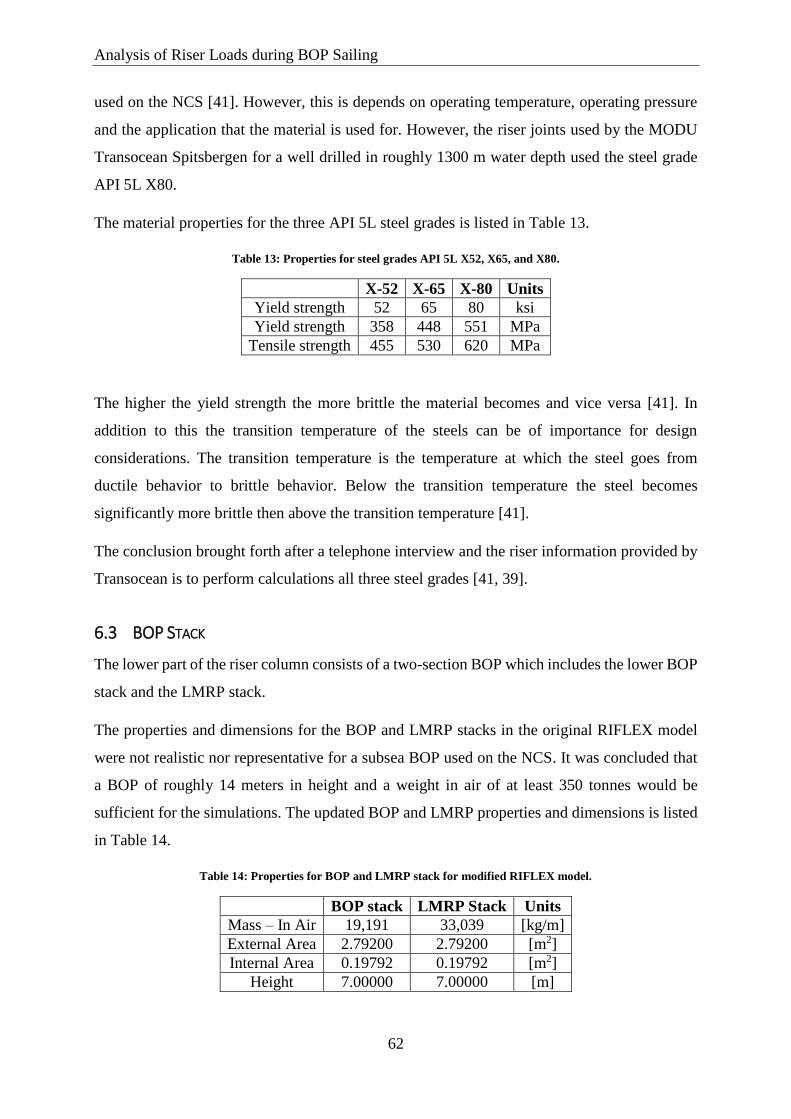
Analysis of Riser Loads during BOP Sailing
62
used on the NCS [41]. However, this is depends on operating temperature, operating pressure
and the application that the material is used for. However, the riser joints used by the MODU
Transocean Spitsbergen for a well drilled in roughly 1300 m water depth used the steel grade
API 5L X80.
The material properties for the three API 5L steel grades is listed in Table 13.
Table 13: Properties for steel grades API 5L X52, X65, and X80.
X-52 X-65 X-80 Units
Yield strength 52 65 80 ksi
Yield strength 358 448 551 MPa
Tensile strength 455 530 620 MPa
The higher the yield strength the more brittle the material becomes and vice versa [41]. In
addition to this the transition temperature of the steels can be of importance for design
considerations. The transition temperature is the temperature at which the steel goes from
ductile behavior to brittle behavior. Below the transition temperature the steel becomes
significantly more brittle then above the transition temperature [41].
The conclusion brought forth after a telephone interview and the riser information provided by
Transocean is to perform calculations all three steel grades [41, 39].
6.3 BOP STACK
The lower part of the riser column consists of a two-section BOP which includes the lower BOP
stack and the LMRP stack.
The properties and dimensions for the BOP and LMRP stacks in the original RIFLEX model
were not realistic nor representative for a subsea BOP used on the NCS. It was concluded that
a BOP of roughly 14 meters in height and a weight in air of at least 350 tonnes would be
sufficient for the simulations. The updated BOP and LMRP properties and dimensions is listed
in Table 14.
Table 14: Properties for BOP and LMRP stack for modified RIFLEX model.
BOP stack LMRP Stack Units
Mass – In Air 19,191 33,039 [kg/m]
External Area 2.79200 2.79200 [m2]
Internal Area 0.19792 0.19792 [m2]
Height 7.00000 7.00000 [m]

Sigmund Anders Isaac Søgnesand
63
This results in a BOP stack height of 14 meters and weight of 365 tonnes in air. These numbers
are more representative for a BOP used on the NCS.
The entire BOP stack was modelled using beam elements. The axial stiffness, bending stiffness
and torsional stiffness can be assumed to be infinitely high, which will result in small
deformations of the BOP stack.
The BOP jumping tool is not included in the simulations. The reason is that it will have a
relatively small influence on the dynamic behavior of the system.
6.4 SUPPORT VESSEL
The support vessels RAOs followed with the RIFLEX program. The RAO files describe the
vessels movements in all six degrees of freedom and is vessel specific. The vessel movement
in heave and surge is of particular interest in this thesis. Figure 21 shows the RAO in surge as
a function of wave period.
Figure 21: RAO in surge – Amplitude ratio [40].
Figure 22 shows the RAO in heave as a function of wave period.
Figure 22: RAO in heave – Amplitude ratio [40].

Analysis of Riser Loads during BOP Sailing
64
Figure 23 shows the RAO in surge as a function of wave period.
Figure 23: RAO in surge – Phase angle [40].
Figure 24 shows the RAO in surge as a function of wave period.
Figure 24: RAO in heave – Phase angle [40].
As aforementioned, RAOs are vessel specific. Some MODUs are extremely weather sensitive
while other are less weather sensitive. The RAO of the MODU may have a significant effect
the forces and bending moments present in the riser column.
6.4.1 Vessel Propagation
It is important to be able simulate a MODU moving forward with a suspended drilling riser
column and subsea BOP so that the dynamic effects due to forward movements of the vessel is
included in the analyses of the riser column. After meeting with professors, fellow students and
representatives from Marintek, it is concluded that the easiest and perhaps the most accurate
way to simulate a MODU sailing with a certain forward speed is to add the vessel speed to the
current speed.
An example of adding the vessel speed to original current speed in 400 m water depth is seen
in Table 15. In this example it is assumed that the vessel is moving with a speed of 1 m/s against
the current. That is, if the current is moving in the +x direction in the horizontal plane, the vessel
is moving in the –x direction.

Sigmund Anders Isaac Søgnesand
65
Table 15: Example of current speeds in RIFLEX for 400 m water depth.
Depth [m] Original current speed [m/s] New current speed [m/s]
0 0.8 1.8
-300 0.6 1.6
-400 0.0 1.0
By adding the vessel speed to the current speed and assuming that the direction of the vessel
and current is opposite to each other, one is able to simulate the worst case sailing scenario. The
reason being that this will result in the largest relative velocity between the riser column and
the surrounding water particles.
It should be noted that the effects of the thrusters on the riser column during the sailing activity
is not modelled in the simulations.
6.5 VERIFICATION OF MODEL RESULTS
After completing the model of the MODU with the suspended riser column and subsea BOP,
some simulations are run in order to check if the results agree with engineering intuition. Prior
to analyzing the results, convergence studies related to the element length and time step are
investigated and the results are summarized in Section 7.1.
At the attachment point, the riser column is allowed to rotate about the axes in the horizontal
plane while no translation is allowed in either of the three directions. Based on this, it is
expected that the highest tension in the riser column should occur at the top of the riser column
where the riser is attached to the drilling vessel. The reason for this is because the attachment
point holds the entire weight of the submerged and non-submerged parts of the riser column.
The tension per unit length is expected to increase by the largest amount over the BOP and
LMRP stacks since these have a large submerged mass per unit length coefficient. On the
contrary, the tension per unit length is expected to increase the least, or perhaps even decrease,
over the buoyancy sections. This is due to the buoyancy riser joints which are designed to have
a small submerged weight per unit length, and may in some instances have a negative
submerged weights in order to minimize the tension at the top of the riser column.
Evidences of these trend lines is seen in Figure 25.

Analysis of Riser Loads during BOP Sailing
66
Figure 25: Force envelope curve for Hs=3 m and Tp=8 sec for the 1225 m long riser column without current and 0 m/s
MODU speed.
The blue line in Figure 25 is the maximum dynamic force in the riser column as a function of
depth, while the green line is the minimum dynamic force in the riser column. The left hand
side of the graph, where both tensions are at a minimum, is the deepest point on the riser column
or at the bottom of the BOP. The right hand side of the graph is highest point on the riser
column, or at the attachment point between the riser column and the MODU.
The results from the simulations did agree with expectations. The minimum tension in the riser
column is at the bottom of the BOP. The tension then increases drastically over the length of
the BOP compared to the increase in tension per unit length over the rest of the riser column.
The increase in tension per unit length was the least over the buoyancy sections. The start and
end of the buoyancy sections is identified in Figure 25.
The BOP sailing simulations is also run in various sea states with different sailing and current
speeds in order to observe the trend lines with respect to where the highest tension in the riser
column occurs as well as how the maximum and minimum tensions varies as a function of these
parameters. In each of the runs, the maximum tension is located at the attachment point between
the riser column and the MODU.
The minimum tension experienced in the riser column at the attachment point decreased with
increasing significant wave height and corresponding wave period, but remained positive in all
Start of
buoyancy
section
End of
buoyancy
section

Sigmund Anders Isaac Søgnesand
67
sea states. It is important to check whether the force in the riser column reaches a negative
value or not. If the riser joints become compressed, buckling may occur. Especially if the riser
joints are not designed to withstand compressive loads. This, however, did not occur in any of
the simulations.
6.6 INCREASING VESSEL SPEED AND CURRENT SPEED
The trend lines for the maximum dynamic bending moment over the length of the riser column
is analyzed during the runs. Since the riser column at the attachment point is allowed to rotate
about the axes on the horizontal plane it is expected that the largest bending moments occurs in
the water zone, or on the buoyancy section.
The magnitude of the maximum dynamic bending moment exerted to the riser column is
strongly dependent on the sailing and current speed. Based on the results, the maximum
dynamic bending moment occurs either in the water zone or on the buoyancy section, depending
on the sailing and current speed. Some of the simulations have the maximum dynamic bending
moment in the water zone while some have the maximum dynamic bending moment at the
buoyancy sections.
Figure 26 shows a moment envelope curve from RIFLEX illustrating the bending moments
about the different axes as a function of riser column depth for the 1225 m long riser column.

Analysis of Riser Loads during BOP Sailing
68
Figure 26: Bending moment envelope curve for Hs= 3 m and Tp=3 sec for the 1225 m long riser column with no
current and 0 m/s sailing speed.
The green line represents the maximum total bending moment and is the line of interest as it
takes the bending moments about all the of the three axes into account. The left hand side of
the plot in Figure 26 is at the bottom of the BOP stack while the right hand side is the attachment
point between the MODU and the riser column. For this run, the maximum dynamic bending
moment at the topmost part of the riser column occurs roughly 25 meters below the attachment
point. The largest dynamic bending moment takes place on the BOP and is not of concern as
this piece of equipment is robust and has a high resistance to deformations due to bending
moments. The large bending moment at the topmost part of the riser column occurs a few meters
below the water/wetted zone, where the riser comes in contact with the water.
Figure 27 shows a moment envelope curve from RIFLEX illustrating the bending moments
about the different axes as a function riser column depth for the 1225 m long riser column.
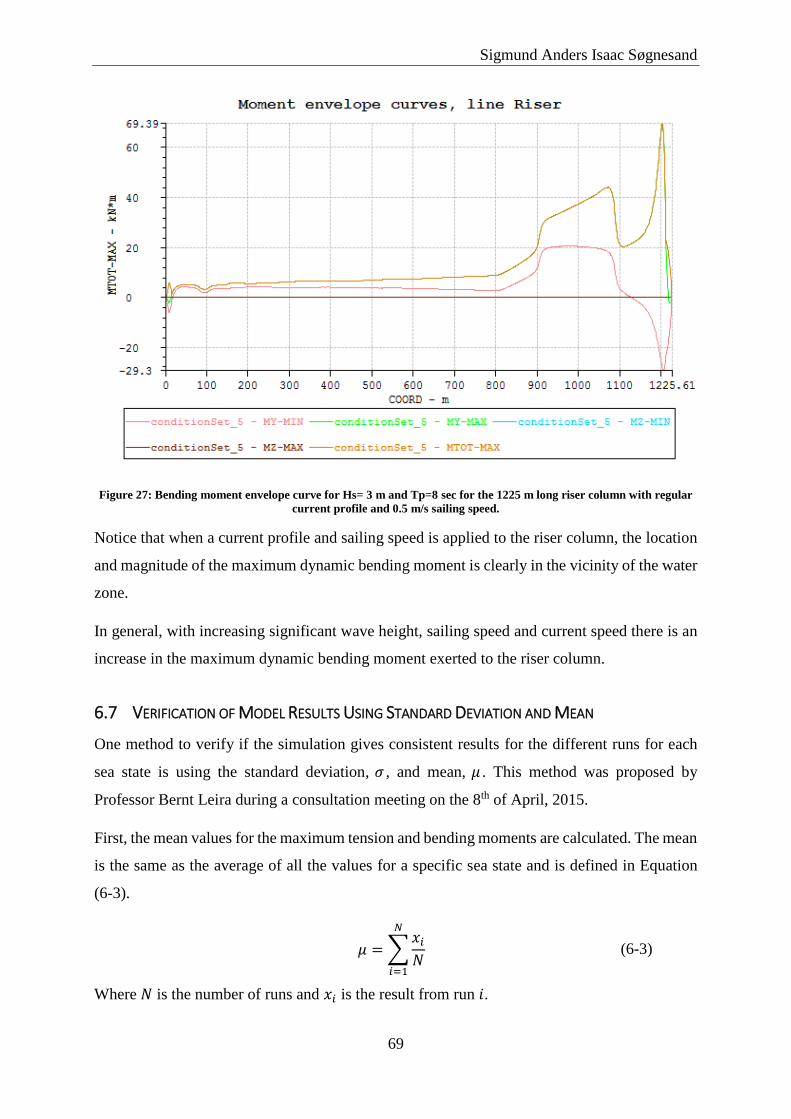
Sigmund Anders Isaac Søgnesand
69
Figure 27: Bending moment envelope curve for Hs= 3 m and Tp=8 sec for the 1225 m long riser column with regular
current profile and 0.5 m/s sailing speed.
Notice that when a current profile and sailing speed is applied to the riser column, the location
and magnitude of the maximum dynamic bending moment is clearly in the vicinity of the water
zone.
In general, with increasing significant wave height, sailing speed and current speed there is an
increase in the maximum dynamic bending moment exerted to the riser column.
6.7 VERIFICATION OF MODEL RESULTS USING STANDARD DEVIATION AND MEAN
One method to verify if the simulation gives consistent results for the different runs for each
sea state is using the standard deviation, 𝜎 , and mean, 𝜇 . This method was proposed by
Professor Bernt Leira during a consultation meeting on the 8th of April, 2015.
First, the mean values for the maximum tension and bending moments are calculated. The mean
is the same as the average of all the values for a specific sea state and is defined in Equation
(6-3).
𝜇 =∑𝑥𝑖𝑁
𝑁
𝑖=1
(6-3)
Where 𝑁 is the number of runs and 𝑥𝑖 is the result from run 𝑖.

Analysis of Riser Loads during BOP Sailing
70
The standard deviation for the maximum tension and bending moments are calculated using
Equation (6-4).
𝜎 = √∑(𝑥𝑖 − 𝜇)
𝑁 − 1
𝑁
𝑖=1
(6-4)
The standard deviation is then divided by the mean values in order to see the amount that the
results deviates relative to the average or mean value. A rule of thumb is that this value should
be equal to or less than 10 percent or 0.1.
Table 16 shows results for various runs in SIMA/RIFLEX and are included to show that the
simulations provides consistent results. The results are taken from different envelope curves.
The direction of propagation of the vessel and currents are opposite to each other. The current
profile is the current profile for 400 m water depth defined in Section 6.1.4.3. The values for
the tension and bending moments in Table 16 are taken at the location where the dynamic
bending moment has its maximum value.
Table 16: Consistency of dynamic results for the 311 m riser column in RIFLEX.
Significant Wave Height, 𝐻𝑠 1 2 3 [m]
Wave Period, 𝑇𝑃 5 7 8
Vessel speed, U 1 1 1 [m/s]
μmax force 3916.00 3963.20 3997.6 [kN]
σmax force 0.71 6.83 18.61 [kN]
σmax forceμmax force
1.80e-4 1.7e-3 4.66e-3 [-]
μmaxBM 93.84 131.30 176.84 [kN m]
σmax force .58 3.60 10.97 [kN m] σmaxBMμmaxBM
6.20e-3 2.74e-2 6.20e-2 [-]
Based on the calculations above, the models provides results that are consistent within the
defined criteria although the variations in bending moment are close to the 10 percent rule.
Some readings may off by a few decimals, due to human error. This, however, should have
negligible effects on the results listed above.

71
7 RESULTS AND DISCUSSION
This section of the thesis will present and discuss the results, observations and general trend
lines from the simulations. The results are found in an Excel file called MSc.results in the
electronic attachment.
A procedure is established that determines the loads in the simulations:
1. Run simulation without any waves, current or forward speed.
2. Run simulation with waves
3. Run simulation with waves and currents
4. Run simulation with currents, waves, and forward speed
This procedure gives an insight to which parameters will have the largest effect on the response
of the riser column. Another reason to run the simulations in this sequence is due to the
parameters required for the DNV calculations. Prior to subjecting the riser column to any
environmental loads, the functional loads must be determined, which are found by running the
simulations without any current, waves or forward speed.
When a current is applied, there are two critical spots on the riser column:
1) the top of the riser column at the attachment point between the riser column and the
MODU
2) where the maximum moment occurrs on the riser column
For each run, these two locations are identified and the tension and moment values are read off
for each of the respective spots. Note there is no moment at the attachment point between the
riser column and the MODU since the riser column is allowed to rotate at this point. The
maximum dynamic bending moment on the riser column tends to occur either on the buoyancy
section or in the water/wetted zone. The location of the maximum bending moment has a
tendency to move downwards with increasing sailing speed.
While calculating the usage factor from the combined loading equation, it is important to use
the wall thickness of the pipe portion of the riser joints and exclude the buoyancy modules
thickness. It can therefore be assumed that the forces and bending moments are absorbed by the
pipe wall itself and not the buoyancy modules. That is, the buoyancy elements to not contribute
the structural integrity of the riser column.

Analysis of Riser Loads during BOP Sailing
72
7.1 CONVERGENCE STUDIES
The element length and the time step used for the simulations is justified in this section through
convergence studies. The purpose of a convergence study is to ensure that the results do not
change, or the change is negligible, for decreasing element length and/or time step.
In order to perform these two studies, there is no forward speed of the vessel. There is a regular
current profile for 400 m water depth. The seed number is the same for all of the runs and the
only variable is the element length and the time step. Table 17 is a summary of the parameters
that are kept constant throughout both of the convergence studies.
Table 17: Fixed parameters used for the convergence studies.
Parameter Value Units
Significant wave height, 𝐻𝑠 1 [m]
Wave period, 𝑇𝑝 5 [sec]
Seed number 38918 [-]
For both convergence studies, the maximum dynamic force at the top of the riser is investigated.
First, a relatively large element length or time step, depending on which convergence study is
being investigated, is run and the corresponding forces of interest are recorded. The element
length or time step is then decreased and it is expected that the forces over the length of the
riser column will change. After several iteration steps, the maximum dynamic force at the top
of the riser should start converging towards a certain value. Decreasing the element length or
time step any further will then result in small changes in the maximum dynamic force at the top
of the riser.
Another important reason for the convergence studies is to minimize the computational time
for each run. If, for example, halving the element length or time step will result in a negligible
difference in the results but increase the computational time exponentially, it is not considered
feasible or necessary to do so.
7.1.1 Element Length
For the convergence study of the element length, the time step is set 0.1 sec while the element
length is changed between the runs. With decreasing element lengths, there will be an increase
in the number of elements present over the length of the riser column.
The force at the top of the riser column as a function of element length is plotted in Figure 28.
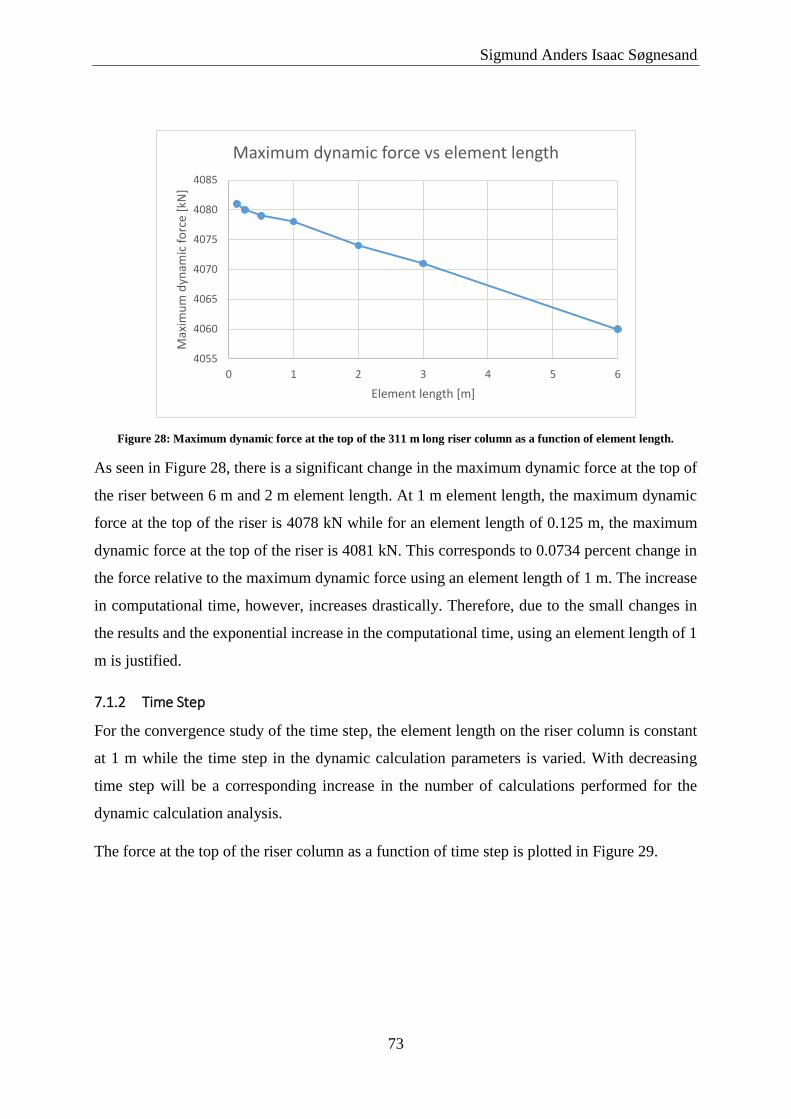
Sigmund Anders Isaac Søgnesand
73
Figure 28: Maximum dynamic force at the top of the 311 m long riser column as a function of element length.
As seen in Figure 28, there is a significant change in the maximum dynamic force at the top of
the riser between 6 m and 2 m element length. At 1 m element length, the maximum dynamic
force at the top of the riser is 4078 kN while for an element length of 0.125 m, the maximum
dynamic force at the top of the riser is 4081 kN. This corresponds to 0.0734 percent change in
the force relative to the maximum dynamic force using an element length of 1 m. The increase
in computational time, however, increases drastically. Therefore, due to the small changes in
the results and the exponential increase in the computational time, using an element length of 1
m is justified.
7.1.2 Time Step
For the convergence study of the time step, the element length on the riser column is constant
at 1 m while the time step in the dynamic calculation parameters is varied. With decreasing
time step will be a corresponding increase in the number of calculations performed for the
dynamic calculation analysis.
The force at the top of the riser column as a function of time step is plotted in Figure 29.
4055
4060
4065
4070
4075
4080
4085
0 1 2 3 4 5 6
Max
imu
m d
ynam
ic f
orc
e [k
N]
Element length [m]
Maximum dynamic force vs element length

Analysis of Riser Loads during BOP Sailing
74
Figure 29: Maximum dynamic force at the top of the 311 m long riser column as a function of time step.
Based on Figure 29, there is a large change in the maximum dynamic force at the top of the
riser column to between time steps 4 sec and 0.5 sec. For time steps smaller or equal to 0.5 sec,
the maximum dynamic force stays constant at 4078 kN. Hence, a time step of 0.1 sec for the
simulations is justified.
7.2 STATIC FORCES IN RISER COLUMNS
The static forces for the three riser column lengths varies due to the difference riser column
lengths as well the difference in the riser column make up. The static forces for each of the three
riser columns without any currents applied to them is seen in Figure 30.
Figure 30: The static forces for each of the three riser columns without any waves, currents or forward speed.
4070
4080
4090
4100
4110
4120
4130
4140
4150
4160
4170
0 0.5 1 1.5 2 2.5 3 3.5 4
Max
imu
m d
ynam
ic f
orc
e [k
N]
Time step [sec]
Maximum dynamic force vs time step
0 200 400 600 800 1000 1200 1400
0
1000
2000
3000
4000
5000
6000
Depth [m]
Effe
ctiv
e Te
nsi
on
[kN
]
Static forces vs depth
311m riesr column
800m riser column
1225m riser column

Sigmund Anders Isaac Søgnesand
75
The bottom of the BOP is to the left, at 0 m depth. There is a large increase in the effective
tension during the first 14 meters due to the large submerged weight per unit length from the
BOP and LMRP stacks. The BOP and LMRP have the same dimensions and properties for all
three of the riser columns and therefore the effective tension increases by the same amount for
the first 14 meters.
Above the BOP and LMRP stacks are slick riser joints and the XO sub. This contributes to a
smaller increase in the effective tension per unit length than the contributions from the BOP
and LMRP stacks due to a smaller submerged weight per unit length. The buoyancy joints are
above the slick joints and XO sub. The relatively small submerged weight per unit length of the
buoyancy joints compared to the slick riser joints, XO sub, the BOP and the LMRP stack
contribute to a smaller increase in the effective tension per unit length. In fact, for each of the
riser columns there is a decrease in the effective tension towards the top of the riser column.
The reason for this is due to a type of buoyancy joint that is used, which has a negative
submerged weight per unit length. The topmost part of each of the riser columns have slick riser
joints and spacer joints which will contribute to a slightly larger increase in the effective tension
per unit length compared to the buoyancy joints.
7.3 RISER YIELDING ASSESSMENT
The assessment of the riser column is carried out using Microsoft Excel 2013 and equations
from the DNV-OS-F201 Dynamic Risers standard.
Prior to the starting the simulations and further analysis of the data, a critical value for 𝜂 is to
be defined. As mentioned earlier in the thesis when the usage factor is equal 1, it is assumed
that the riser will deform and/or damage to the riser will occur. No safety factors other than the
safety factors introduced in the DNV calculations are used in the analyses.
Combined loading calculations is performed for each of the three steel grades, API 5L X-52,
X-65 and X-80. The results for the X-52 steel grade is presented since it is the steel grade with
the poorest properties with respect to yield strength and ultimate tensile strength. Similar
calculations are performed for each of the respective riser lengths.
7.3.1 1225 m Long Riser Column
The results for the 1225 m long riser column are presented since it has the largest values of 𝜂
for all the riser column lengths. This is due to a combination of large forces in the riser column
and bending moments exerted to the riser column.

Analysis of Riser Loads during BOP Sailing
76
The results are plotted in 2 dimensional plots with the sailing speed on the horizontal axis and
the usage factor, 𝜂, on the vertical axis. Each of the three lines corresponds to a sea state chosen
from the scatter diagram. When the vessel speed is 0 m/s, there is still a current present.
The usage factor as a function of the MODU sailing speed at the location where the maximum
dynamic bending moment occurs for the 1225 m long riser column is plotted in Figure 31.
Figure 31: 𝜂 vs. sailing speed where the maximum dynamic bending moment occurs on the 1225 m long riser column.
Based on Figure 31, the general trend line for the locations where the maximum dynamic
bending moment occurs is that the value of the usage factor increases with increasing MODU
sailing speed. The reason for the decrease in the usage factor for increasing rig speed when
𝐻𝑠=1 m and 𝑇𝑝= 5 sec is because the maximum bending moment takes place farther below
mean sea level with increasing rig speed. This means that the effective tension where the
maximum bending moment occurs is or can be significantly lower which may result in a smaller
usage factor value.
The usage factor as a function of the MODU sailing speed at the attachment point between the
1225 m long riser column and the MODU is plotted in Figure 32.
0 0.5 1 1.5 2
0.2
0.22
0.24
0.26
0.28
0.3
0.32
0.34
0.36
0.38
0.4
MODU speed [m/s]
𝜂[-
]
𝜂 vs. MODU speed, API 5L X-52
Hs=3 m, Tp=8 sec
Hs=2 m, Tp= 7 sec
Hs=1 m, Tp=5 sec

Sigmund Anders Isaac Søgnesand
77
Figure 32: 𝜂 vs. sailing speed at the attachment point between the riser and MODU for the 1225 m long riser column.
There are small variations in the usage factor with increasing MODU speed. In addition to this,
the usage factor is significantly lower than the limiting value of 1 both at the location where the
maximum bending moment occurs and at the attachment point between the riser column and
the MODU.
The calculated usage values from the combined loading equation for the X-65 and X-80 steel
grades for the 1225 m long riser column are significantly lower than for the X-52 steel grade.
Hence, the plots for these steel grades are not included since the usage factor values are as small
as they are.
It should be noted that Figure 31 and Figure 32 above do not necessarily follow a linear trend
line. A best fitted line can be applied to the data points to estimate the trend line for the
utilization factor.
7.4 COMPARING BENDING MOMENTS
The maximum bending moments are recorded under the conditions
Only waves present
Waves and current present with 0 m/s sailing speed
0 0.5 1 1.5 2
0.25
0.27
0.29
0.31
0.33
0.35
0.37
MODU speed [m/s]
𝜂[-
]𝜂 vs. MODU speed, API 5L X-52
Hs=3 m, Tp=8 sec
Hs=2 m, Tp= 7 sec
Hs=1 m, Tp=5 sec

Analysis of Riser Loads during BOP Sailing
78
Waves and current present with varying sailing speeds
This is done in order to evaluate the riser joints at the location where the maximum bending
moments occurs and to observe the effects of currents and increasing sailing speed.
When only waves are present, and, when there are waves and current present with 0 m/s sailing
speed, the maximum dynamic bending moment occurs the highest on the riser column. That is,
right around the water or wetted zone. The length or distance on the riser column from the
attachment point between the riser column and RKB where the maximum dynamic bending
moment occurs for the 1225 m long riser column when 𝐻𝑠=2 m and 𝑇𝑝=7 sec is presented in
Table 18.
Table 18: Depth of maximum dynamic bending moment from the attachment point when Hs=2 m and Tp=7 sec for
the 1225 m long riser column.
Sailing speed [m/s] Depth [m]
Only waves (no current) 21.63
0.0 21.63
0.5 23.23
1.0 159.90
2.0 166.53
Waves are present for all of the sailing speeds. When there is 0 m/s sailing speed there is still
waves and current present. The buoyancy section for the 1225 m long riser column is roughly
137 m below the drillfloor. As the sailing speed increases from 0.5 m/s to 1 m/s, the location of
where the maximum dynamic bending moment occurs shifts from the water zone or wetted
zone on the riser column to the buoyancy section of the riser column. The length or distance on
the riser column from the attachment point between the riser column and RKB where the
maximum dynamic bending moment occurs for the 800 m long riser column when 𝐻𝑠=2 m and
𝑇𝑝=7 sec is presented in Table 19.
Table 19: Depth of maximum dynamic bending moment from the attachment point when Hs=2 m and Tp=7 sec for
the 800 m long riser column.
Sailing speed [m/s] Depth [m]
Only waves (no current) 20.97
0.0 21.17
0.5 95.45
1.0 98.25
2.0 106.46

Sigmund Anders Isaac Søgnesand
79
The buoyancy section for the 800 m long riser column starts roughly 77 m below the attachment
point between the riser column and RKB. As the sailing speed increases from 0 m/s to 0.5 m/s,
the location of the maximum bending moment shifts from the water zone or wetted zone on the
riser column to the buoyancy section of the riser column.
For the 311 m long riser column in irregular seas with 𝐻𝑠=2 m and 𝑇𝑝=7 sec, the maximum
bending moment takes place on the buoyancy section in all of the respective runs, including
when there are only waves present and no current.
One interesting observation is that the magnitude of the maximum dynamic bending moment
subjected to the riser column has a tendency to increase with decreasing riser column length.
The maximum bending moment subjected to each of the three riser column lengths for 𝐻𝑠=2 m
and 𝑇𝑝=7 sec with regular current profile and 2 m/s sailing speed is listed in Table 20.
Table 20: Maximum dynamic bending moments for Hs=2 m and Tp=7 sec with regular current profiles and 2 m/s
sailing speed
Length of riser column [m] Maximum bending moment [kN m]
311 242.68
800 167.60
1225 141.98
Based on the results in Table 20 and results for other wave heights and sailing speeds, the trend
line is that the shorter the riser column the larger the maximum dynamic bending moment
exerted to the riser column.
The relationship between the riser column length and the magnitude of the maximum dynamic
bending moment may be subject for further analysis and discussion. However, this trend line
was obvious after the simulations were completed and the results recorded, and is therefore
mentioned in the text.
7.5 WORST CASE SCENARIO
From the predefined weather conditions there is a worst case scenario run for each of the riser
column lengths. This is when
𝐻𝑠=3 m and 𝑇𝑝=8 sec
Regular current profile
Direction of vessel propagation and current are opposite of each other

Analysis of Riser Loads during BOP Sailing
80
As mentioned earlier, the maximum dynamic bending moment exerted to the riser column is
larger for the shorter riser columns then for the longer riser columns. This statement holds true
for the worst case scenario runs as well. In fact, the magnitude of the maximum bending
moment in the shortest riser column is twice of the maximum bending moment in the longest
riser column.
For all three riser columns, the maximum dynamic force in the riser column at the attachment
point between the MODU and the riser column increased with increasing sailing speed and
increasing significant wave height, and reached its maximum in the worst case scenario run.
Based on this, an assumption made is that the general trend line will continue and sailing in
higher significant wave heights and sailing speeds will increase the maximum dynamic force at
the top of the riser column.
The contributions from the bending moment to the combined loading equation is also dominant
in these runs. This is an effect that will be discussed more in depth in a following section,
however, for the 311 m long riser column the maximum dynamic bending moment contributes
nearly 62 percent to the usage factor calculated from the combined loading equation. This is
the highest contribution to the usage factor from the maximum dynamic bending moment for
any of the predefined sailing speeds and weather conditions. If the significant wave heights and
sailing speed increases further, there could be damage to the buoyancy elements and/or riser
pipe joints due to deformations caused by the maximum dynamic bending moment.
7.6 CONTRIBUTIONS FROM BENDING MOMENT AND TENSION
The percent that the bending moment contributes to the usage factor in the combined loading
equation is presented in this section.
At the top of the riser there is no bending moments present so the only contribution on the
combined loading equation is from the tension in the riser column. Hence, there is no need to
present the percent contribution from the bending moment at this location. If the boundary
conditions at the attachment point where such that the riser is unable to rotate, it is expected
that the bending moment would have a major contribution to the combined loading equation.
At the location where the maximum bending moment occurs, there are contributions due to
bending moment and tension. The percentage of each respective contribution is summarized in
Table 21 - Table 23 for the three riser column lengths as a function of sailing speed when 𝐻𝑠=2
m and 𝑇𝑝=7 sec.
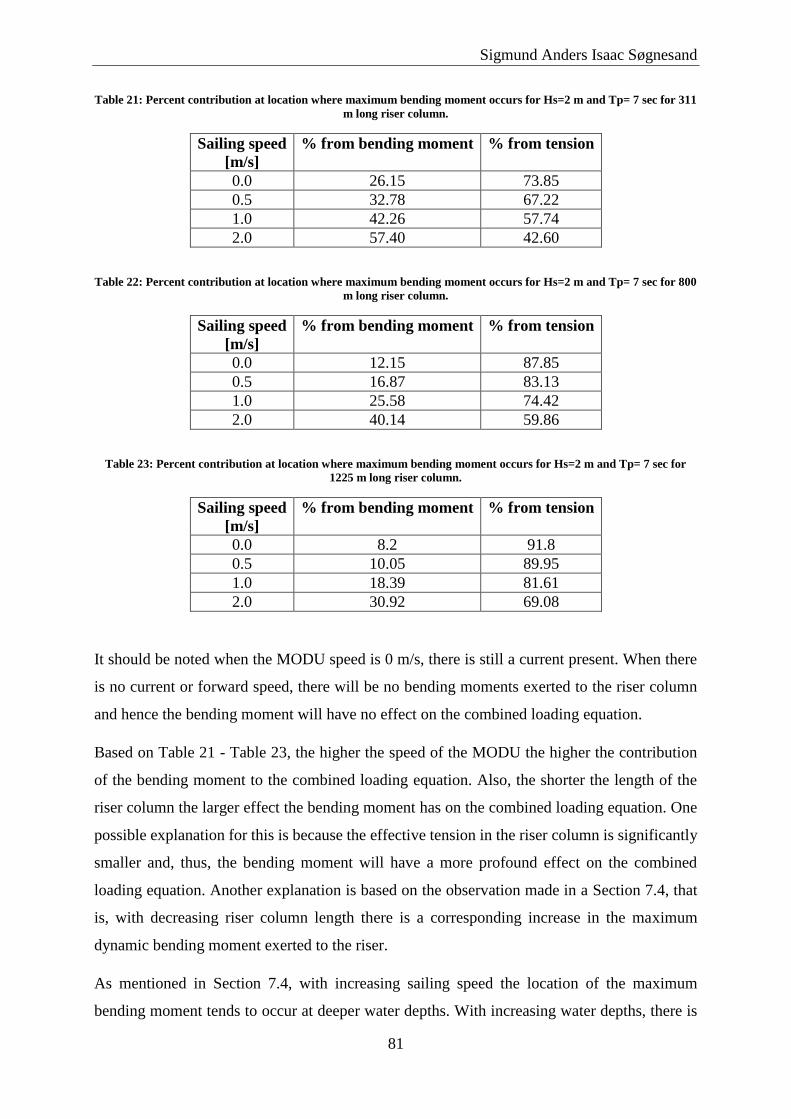
Sigmund Anders Isaac Søgnesand
81
Table 21: Percent contribution at location where maximum bending moment occurs for Hs=2 m and Tp= 7 sec for 311
m long riser column.
Sailing speed
[m/s]
% from bending moment % from tension
0.0 26.15 73.85
0.5 32.78 67.22
1.0 42.26 57.74
2.0 57.40 42.60
Table 22: Percent contribution at location where maximum bending moment occurs for Hs=2 m and Tp= 7 sec for 800
m long riser column.
Sailing speed
[m/s]
% from bending moment % from tension
0.0 12.15 87.85
0.5 16.87 83.13
1.0 25.58 74.42
2.0 40.14 59.86
Table 23: Percent contribution at location where maximum bending moment occurs for Hs=2 m and Tp= 7 sec for
1225 m long riser column.
Sailing speed
[m/s]
% from bending moment % from tension
0.0 8.2 91.8
0.5 10.05 89.95
1.0 18.39 81.61
2.0 30.92 69.08
It should be noted when the MODU speed is 0 m/s, there is still a current present. When there
is no current or forward speed, there will be no bending moments exerted to the riser column
and hence the bending moment will have no effect on the combined loading equation.
Based on Table 21 - Table 23, the higher the speed of the MODU the higher the contribution
of the bending moment to the combined loading equation. Also, the shorter the length of the
riser column the larger effect the bending moment has on the combined loading equation. One
possible explanation for this is because the effective tension in the riser column is significantly
smaller and, thus, the bending moment will have a more profound effect on the combined
loading equation. Another explanation is based on the observation made in a Section 7.4, that
is, with decreasing riser column length there is a corresponding increase in the maximum
dynamic bending moment exerted to the riser.
As mentioned in Section 7.4, with increasing sailing speed the location of the maximum
bending moment tends to occur at deeper water depths. With increasing water depths, there is

Analysis of Riser Loads during BOP Sailing
82
corresponding decrease in the effective tension in the riser column. Based on this observation,
a small increase in the bending moment will have a larger effect on the combined loading
equation. If the maximum bending moment occurred at the same location on the riser column,
the percent contribution to the combined loading equation due to the maximum bending
moment would decrease slightly in Table 21 - Table 23. However, the same trend line would
take place. That is, with increasing rig speeds there is a higher contribution from the bending
moment to the combined loading equation.
7.7 SUMMARY
Three riser column lengths are used for the simulations:
311 meters
800 meters
1225 meters
Each of the riser columns are run with all the significant wave heights and corresponding wave
periods listed in Table 24.
Table 24: Significant wave height and corresponding wave period used for the RIFLEX simulations.
𝑯𝒔 [m] 𝑻𝒑 [sec]
1 5
2 7
3 8
Each of the riser column lengths had its own current profiles and with sailing speeds:
0.0 m/s
0.5 m/s
1.0 m/s
2.0 m/s
The results are then recorded and subsequent riser analyses is performed.
Based on the observations, parameters important for evaluating BOP sailing are:
Rig sensitivity to weather
Rig type
Riser properties

Sigmund Anders Isaac Søgnesand
83
Riser dimensions
Length of riser column
Sailing distance
Thruster-riser interaction
Risk and HSE evaluation
Crossing of subsea structures and installations
Each of the respective points should be considered carefully prior to starting a BOP sailing
event.

84
8 CONCLUSION
This thesis examines an alternative method of moving a drilling rig from one well location to
another with a suspended marine drilling riser and subsea BOP. The loads on the riser column
during the BOP sailing event have been analyzed for different rig speeds and weather
parameters.
Interesting observations and trend lines have been observed. However, it can be concluded that
it is safe to sail with a suspended riser column and BOP for the three different riser column
lengths in all of the weather conditions and sailing speeds listed above for the specific RAO
transfer function used for the analyses. In fact, based on the results the MODU could sail in
harsher weather conditions and faster sailing speeds, which can be studied further in another
study. From a safety point of view, this is reassuring as costly and large pieces of equipment
are involved. It is undesirable to be dangerously close to the critical usage factor value, which
did not occur in any of the runs.
The most important parameters while sailing with a suspended marine drilling riser and subsea
BOP are:
1) Sailing speed
2) Current speed
3) Sailing direction
4) Current direction
5) Significant wave height and wave period
Where the order of importance based on the results are listed accordingly.
In order to decide weather criteria’s for BOP sailing events, rig and riser specific data is
necessary in order to perform the required simulations and analyses.

85
9 RECOMMENDATIONS FOR FURTHER WORK
This thesis is the first to explore the concept of BOP sailing and there is a great deal of further
work that may be explored in the future for BOP sailing and BOP jumping.
The forces and moments present in the riser column vary with the MODU used due to the
difference in RAO transfer functions. Simulations with BOP sailing and/or BOP jumping for
specific vessels are interesting studies, especially for a MODU that plans to used BOP sailing
and/or BOP jumping frequently.
Riser joints are provided by different service companies and the properties may vary as a
function of the service company and design considerations. Simulations and further analyses of
riser joints with differing properties is also a possibility to study further.
Another possible study that can be conducted is an extreme value study during irregular seas
using the Gumbel or Rayleigh distribution. This is an option which can be performed in the
RIFLEX post processor.
The BOPs used on the NCS vary in height and weight, which may influence the forces and
bending moments present in the riser column. Studies related to different BOP sizes is an
option.
3D plots featuring significant wave height, wave period and current speed for specific MODUs
or riser columns is another interesting study. The mapping in the 3D plot can have various
colors depending on whether it is considered safe to sail under the specific weather conditions
or not.
Studies related to fatigue and damage assessment of the riser joints and other relevant
components during a sailing operation can also be studied more extensively.

86
10 REFERENCES
[1]. Devold, H. (2013). Oil and gas handbook – An introduction to oil and gas production,
transport, refiing and petrochemical industry. Oslo, Norway: ABB Oil and Gas.
[2]. Osmundsen, P., Roll, K. H., Tveterås, R. Drilling Productivity on the Norwegian
Continental Shelf. Stavanger, Norway: University of Stavanger.
[3]. Offshore.no. (2015). Riggdata. Retrieved on April 13th, 2015, from:
http://www.offshore.no/Prosjekter/riggdata.aspx.
[4]. Statoil ASA employee. (2015). Interview on April 30th, 2015.
[5]. Encyclopædia Britannica. (2015). Sonar (from “sound navigation ranging”). Retrieved on
May 9th, 2015, from; http://global.britannica.com/EBchecked/topic/554214/sonar.
[6]. Kongsberg Mesotech Ltd. (2015). Underwater Vehicle Instrumentation. Vancouver,
Canada: Kongsberg Maritime.
[7]. Kongsberg Mesotech Ltd. (2015). Echo sounders. Vancouver, Canada: Kongsberg
Maritime.
[8]. Sevillano, L. C., Mendes, J. R. P., Miura, K., & Morooka, C. K. (2013). Drilling riser
analysis during installation of a wellhead equipment. Nantes, France: ASME 32nd International
Conference on Ocean, Offshore and Artic Engineering.
[9]. Offshore Magazine. (2002). BOP-deployed move saves time, money. Tulsa, OK: PennWell
Corporation.
[10]. Lyons, W. C., Guo, B., Graham, R. L., Hawley, G. D. (2009). Air and Gas Drilling Manual
– Applications for Oil and Gas Recovery Wells and Geothermal Fluids Recovery Wells (3rd ed.).
Elsevier Inc: Burlington, MA. 48-52.
[10]. Schlumberger Oilfield Glossary. (2015). Pipe ram. Houston, Texas: Schlumberger
Limited. Retrieved on May 26th, 2015, from;
http://www.glossary.oilfield.slb.com/en/Terms/p/pipe_ram.aspx
[11]. Sangesland, S. (2008). Drilling and completion of subsea wells. TPG 4200, NTNU;
Trondheim, Norway.

Sigmund Anders Isaac Søgnesand
87
[12]. Whitby, M. F., Mangan, J. T. (2007). U.S. Patent No. 7,300,033. U.S. Patent and
Trademark Office: Washington, DC.
[13]. Transocean Spitsbergen. (2010). BOP jump tool. Vernier, Switzerland: Transocean Ltd.
[14]. DrillingFormulas. (2013). Basic Understanding about Drill Pipe. Retrieved on May 26th,
2015, from; http://www.drillingformulas.com/basic-understanding-about-drill-pipe/.
[15]. Transocean Spitsbergen. (2010). Detailed operational procedure – Jump BOP. Vernier,
Switzerland: Transocean Ltd.
[16]. Sparks, C. P. (2007). Fundamentals of Marine Riser Mechanics: Basic Principles and
Simplified Analysis (1st ed.). PennWell Corporation: Tulsa, OK.
[17]. API. (2010). API RP16Q – American Petroleum Institute Recommended Practice for
Design, Selection, Operation and Maintenance of Marine Drilling Riser Systems (1st ed.). :
Washington, DC: American Petroleum Institute. 5-14.
[18]. VetcoGray Inc. (2008). Capital drilling equipment. Houston, Texas: General Electric. 3,
18.
[19]. Jones, H. W. (1976). U.S. Patent No. 3,984,990. Washington, DC: U.S. Patent and
Trademark Office.
[20]. DNV GL. (2014). Introduction to Subsea Production Systems. Høvik, Norway: DNV GL
Oil and & Gas. Retrieved on April 19th, 2014, from:
http://www.uio.no/studier/emner/matnat/math/MEK4450/h14/undervisningsmateriale/module
-2/mek4450-dnvgl-05-templates-and-manifolds.pdf.
[21]. DNV. (2014). Subsea Facilities – Technology Developments, Incidents and Future
Trends. Høvik, Norway: DNV GL Oil and & Gas.
[22]. Petrowiki. (2014). Subsea wellhead systems. Society of Petroleum Engineers. Retrieved
on April 10th, 2015, from: http://petrowiki.org/Subsea_wellhead_systems.
[23]. Petrowiki. (2014). Multipurpose tool and accessories. Society of Petroleum Engineers.
Retrieved on April 10th, 2015, from:
http://petrowiki.org/Subsea_wellhead_systems#Multipurpose_tool_and_accessories.
[24]. DNV. (2010). Offshore Standard DNV-OS-F201, Dynamic Risers. Høvik, Norway: DNV
GL Oil and & Gas. 1-33, 42-43.

Analysis of Riser Loads during BOP Sailing
88
[25]. ISO. (2005). Konstruksjon og drift av produskjonssystemer under vann Del 7:
Kompletterings- og arbeidsstigerør med tilhørende systemer (ISO 13628-7:2005). Lysaker,
Norway: Standard Norge. 107-110.
[26]. DNV. (2010). Offshore Standard DNV-OS-H101, Marine Operations, General. Høvik,
Norway: DNV GL Oil and & Gas. 12, 28-35.
[27]. NTS. (1998). NORSOK standard D-010N - Boring og brønnoperasjoner (Rev. 2). Oslo,
Norway: Norsk Teknologisenter. 26.
[28]. Drilling Contractor. (2014). Study analyzes response of deepwater riser with suspended
BOP. Houston, TX: Drilling Contractor.
[29]. Faltinsen, O. M. (1990). Sea loads on ships and offshore structures. Cambridge, UK:
Cambridge University Press. 13-33, 37, 223-225.
[30]. Ormberg, H., Passano, E. (2014). RIFLEX Theory Manual (V4.2v0). Marintek:
Trondheim, Norway. 41-43, 53, 74-75.
[31]. Marintek. (2014). SIMA User Guide. Marintek: Trondheim, Norway.
[32]. Marintek. (2014). RIFLEX User Guide. Marintek: Trondheim, Norway.
[33]. Marintek. (2014). SIMO User Guide. Marintek: Trondheim, Norway.
[34]. Dictionary.com. (2015). Pseudo. Retrieved on June 5th, 2015, from:
http://dictionary.reference.com/browse/pseudo.
[35]. Whatis.com. (2011). Pseudo-random number generator. Retrieved on June 5th, 2015,
from: http://whatis.techtarget.com/definition/pseudo-random-number-generator-PRNG.
[36]. Myrhaug, D. (2007). Marin dynamikk – uregelmessig sjø. TMR 4180, NTNU: Trondheim,
Norway. 63.
[37]. Leira, B. J. (2015). Consultation meeting.
[38]. Larsen, C. M. (2015). Meeting.
[39]. Transocean Spitsbergen. (2010). TSB Roald Rygg. Vernier, Switzerland: Transocean Ltd.
[40]. RIFLEX model. (2015). Modelled by Sigmund Anders Isaac Søgnesand.
[41]. Sele, J. (2015). Telephone conversation on April 22nd, 2015.

I
Appendix A: DNV-OS-F201, Dynamic Risers Equations
The formula for the design bending moment is given by Equation (A-1).
𝑀𝑑 = 𝛾𝐹 ∙ 𝑀𝐹 + 𝛾𝐸 ∙ 𝑀𝐸 + 𝛾𝐴 ∙ 𝑀𝐴 (A-1)
Where 𝑀𝐹, 𝑀𝐸 and 𝑀𝐴 are the bending moments from functional loads, environmental loads,
and accidental loads and 𝛾𝐹, 𝛾𝐸, and 𝛾𝐴 are the corresponding safety factors for each of the
different load types.
The plastic bending moment resistance is given by Equation (A-2).
𝑀𝑘 = 𝑓𝑦 ∙ 𝛼𝑐 ∙ (𝐷 − 𝑡2)2 ∙ 𝑡2 (A-2)
Where 𝑓𝑦 is the characteristic yield strength of the material, 𝛼𝑐 account for strain hardening and
wall thinning of the material, 𝐷 is the nominal outside diameter and 𝑡2 is the wall thickness of
the riser joint.
𝑓𝑦 is defined in Table 5-5 in the DNV Dynamic Risers standard and is given by Equation (A-
3).
𝑓𝑦 = (𝑆𝑀𝑌𝑆 − 𝑓𝑦,𝑡𝑒𝑚𝑝) ∙ 𝛼𝑈 (A-3)
Where SMYS is the minimum yield strength of the material and is normally specified at room
temperature, 𝑓𝑦,𝑡𝑒𝑚𝑝 is the yield stresses temperature derating factor (as temperatures increases
the yield stress usually decreases which the derating factor takes into account), and 𝛼𝑈 is the
material strength factor and under normal conditions equal to 0.96.
As mentioned earlier, 𝛼𝑐 is a parameter that accounts for strain hardening and wall thinning
which is given by Equation (A-4).
𝛼𝑐 = (1 − 𝛽) + 𝛽 ∙
𝑓𝑢𝑓𝑦
(A-4)
Where 𝑓𝑢 represents the characteristic tensile strength of the material that is to be used in the
design and is given by Equation (A-5).
𝑓𝑢 = (𝑆𝑀𝑇𝑆 − 𝑓𝑢,𝑡𝑒𝑚𝑝) ∙ 𝛼𝑈 (A-5)
Where SMTS is the minimum tensile strength which is usually given at room temperature and
𝑓𝑢,𝑡𝑒𝑚𝑝 is the temperature derating factor for the materials tensile strength. 𝛽 and 𝑞ℎ are
parameters that account for strain hardening and wall thinnning and are defined in Equations
(A-6) and (A-7).

Appendix A: DNV-OS-F201, Dynamic Risers Equations
II
𝛽 =
{
(0.4 + 𝑞ℎ) 𝑓𝑜𝑟
𝐷
𝑡2< 15
(0.4 + 𝑞ℎ) (60 −𝐷𝑡2)
45 𝑓𝑜𝑟 15 <
𝐷
𝑡2< 60
0 𝑓𝑜𝑟𝐷
𝑡2> 60
(A-6)
𝑞ℎ = {
(𝑝𝑙𝑑 − 𝑝𝑒)
𝑝𝑏(𝑡2)
2
√3𝑓𝑜𝑟 𝑝𝑙𝑑 > 𝑝𝑒
0 𝑒𝑙𝑠𝑒
(A-7)
Where 𝑝𝑙𝑑 is the local internal design pressure, 𝑝𝑒 is the external pressure and 𝑝𝑏 is the burst
resistance of the riser pipe.
The local internal design pressure, 𝑝𝑙𝑑, is given by Equation (A-8).
𝑝𝑙𝑑 = 𝑝𝑑 + 𝜌𝑖 ∙ 𝑔 ∙ ℎ (A-8)
Where 𝑝𝑑 is the pressure at the top of the riser column, 𝜌𝑖 is the density of the fluid inside of
the riser column, g is the acceleration due to gravity and h is the vertical height from the top of
the riser column to the point of interest.
The design effective tension, 𝑇𝑒𝑑, is defined in Equation (A-9).
𝑇𝑒𝑑 = 𝛾𝐹 ∙ 𝑇𝑒𝐹 + 𝛾𝐸 ∙ 𝑇𝑒𝐹 + 𝛾𝐴 ∙ 𝑇𝑒𝐴 (A-9)
Where 𝑇𝑒𝐹, 𝑇𝑒𝐸, 𝑇𝑒𝐴 are the effective tensions from functional loads, environmental loads and
accidental loads.
The plastic axial force resistance, 𝑇𝑘, is given by Equation (A-10).
𝑇𝑘 = 𝑓𝑦 ∙ 𝛼𝑐 ∙ (𝐷 − 𝑡2) ∙ 𝑡2 (A-10)