Analysis of Raman lidar and radiosonde … Early discrepancies between Raman lidar and radiosonde...
65
Analysis of Raman lidar and radiosonde measurements from the AWEX-G field campaign and its relation to Aqua validation D. N. Wteman', F. Russo2, B. Demoz', L. M. Miloshevich3, I. Veselovskii2, S. Harmon2, Z. Wang4, H. Vome15, E Schmidlin', B. Lesht6, P. J. Moore7, A. S. Beebe', A. Gambacorta2, C. Barnetg 'NASNGSFC, Greenbelt, MD 20771 2University of Maryland, Baltimore County, Baltimore, MD 3National Center for Atmospheric Research, Boulder, CO 4University of Wyoming, Laramie, wY 5University of Colorado, Boulder, CO 'DOE/Argonne National Laboratory, Chicago, IL 7LJT and Associates, Wallops Island, VA. 'SGT, Inc., 'NOM, Camp Springs, MD Contact: David Whiteman, NASNGSFC, Code 61 3.1 , Greenbelt, MD 2077 1 , 3 0 1 -6 1 4-6703 , david.n. whi temananasa. gov To be submitted to the Journal of Geophysical Research 1 https://ntrs.nasa.gov/search.jsp?R=20050210069 2018-06-12T17:36:17+00:00Z
-
Upload
trinhthuan -
Category
Documents
-
view
229 -
download
1
Transcript of Analysis of Raman lidar and radiosonde … Early discrepancies between Raman lidar and radiosonde...
Analysis of Raman lidar and radiosonde measurements from the
AWEX-G field campaign and its relation to Aqua validation
D. N. Wteman' , F. Russo2, B. Demoz', L. M. Miloshevich3, I. Veselovskii2, S. Harmon2, Z.
Wang4, H. Vome15, E Schmidlin', B. Lesht6, P. J. Moore7, A. S. Beebe', A. Gambacorta2, C.
Barnetg
'NASNGSFC, Greenbelt, MD 20771
2University of Maryland, Baltimore County, Baltimore, MD
3National Center for Atmospheric Research, Boulder, CO
4University of Wyoming, Laramie, wY
5University of Colorado, Boulder, CO
'DOE/Argonne National Laboratory, Chicago, IL
7LJT and Associates, Wallops Island, VA.
'SGT, Inc.,
'NOM, Camp Springs, MD
Contact: David Whiteman, NASNGSFC, Code 61 3.1 , Greenbelt, MD 2077 1 ,
3 0 1 -6 1 4-6703 , david. n. whi temananasa. gov
To be submitted to the Journal of Geophysical Research
1
https://ntrs.nasa.gov/search.jsp?R=20050210069 2018-06-12T17:36:17+00:00Z
1 Table of Contents
1 Table of Contents 2
2 Introduction and Background 5
AIRS 7
4 AIRS Water Vapor Experiment-Ground 11 4.1 The NASNGSFC Scanning Raman Lidar (SRL) .................................... 14 4.2 The AWEX-G water vapor reference: CFH ......................................... 15 4.3 SuomiNet GPS PW comparison with ARM MWR .................................. 16 4.4 Corrections to Raman Lidar and Radiosondes derived from AWEX-G . . . . . . . . . . . . . . . . 18
4.4.1 Corrections for Raman lidar water vapor measurements ...................... 18 4.4.2 Corrections for Vaisala radiosondes .......................................... 20 Water vapor profile comparisons ................................................... 21 4.5.1 Data selection . . . . . . . . . . . . . . . . . . . . . . . . . . . . . . . . . . . . . . . . . . . . . . . . . . . . . . . . . . . . . . 22 4.5.2 SRL profile comparisons with fidly-corrected Vaisala RS9X . . . . . . . . . . . . . . . . . . 23
4.6 Mean AWEX-G Upper Tropospheric Accuracy Assessment ......................... 25 4.6.1 Comparisons with respect to CFH ........................................... 26 4.6.2 Comparisons of SRL with respect to fully-corrected RS90/92 . . . . . . . . . . . . . . . . . 28
vapor amount and altitude ...................................................... 29
3 Early discrepancies between Raman lidar and radiosonde measurements and
4.5
4.7 Lidar and radiosonde water vapor measurements compared as a function of water
5 The relationship of AWEX-G and AFWEX results 31
6 The effect of the Raman lidar and radiosonde corrections derived from AWEX
6.1 6.2
on AIRS radiance comparisons 33 Raman lidar overlap and temperature dependence corrections ........................ 33 Vaisala RS-90 Corrections ......................................................... 34
7 Comparison of GPS and corrected SRL measurements from fall 2002 to Aqua version 4 retrievals 35
8 Summary and Conclusions 36
2
43
43 9 Acknowledgements
10 References
11 Appendix: Efforts to address the spatiotemporal mismatch between lidar and 48 radiosonde data
12 Figure Captions
13 Tables
14 Figures
51
54
55
3
Abstract
Early work within the Aqua validation activity revealed there to be large differences in water
vapor measurement accuracy among the various technologies in use for providing validation data.
The validation measurements were made at globally distributed sites making it difficult to isolate
the sources of the apparent measurement differences among the various sensors, which included
both Raman lidar and radiosonde. Because of this, the A I R S Water Vapor Experiment-Ground
(AWEX-G) was held in October - November, 2003 with the goal of bringing validation technolo-
gies to a common site for intercomparison and resolution of the measurement discrepancies. Using
the University of Colorado Cryogenic Frostpoint Hygrometer (CFH) as the water vapor reference,
the AWEX-G field campaign resulted in new correction techniques for both Raman lidar, Vaisala
RS80-H and RS90/92 measurements that significantly improve the absolute accuracy of those mea-
surement systems particularly in the upper troposphere. Mean comparisons of radiosondes and
lidar are performed demonstrating agreement between corrected sensors and the CFH to generally
within 5% thereby providing data of sufficient accuracy for Aqua validation purposes. Examples
of the use of the correction techniques in radiance and retrieval comparisons are provided and
discussed.
4
2 Introduction and Background
The Aqua satellite validation activity funded by NASA includes the use of different water vapor
profiling radiosondes and Raman lidar systems for acquisition of measurements during Aqua over-
passes. Numerous special measurement campaigns have been staged in order to acquire data of
the highest quality for calibration and validation of the satellite measurements and retrievals. It is
fundamentally important that these special datasets possess higher absolute accuracy than required
of the satellite data products for t h s validation technique to work. Early comparisons of many vali-
dation measurements with the Atmospheric Infrared Sounder (AIRS), through the use of the AIRS
fast forward radiative transfer model, SARTA [7], revealed apparent large calibration differences
among the various water vapor profiling technologies being used. The differences were largest in
the upper troposphere (UT) where differences between AIRS radiances and calculations of AIRS
radiance using SARTA, when translated to UT relative humidity (RH), implied differences in the
calibration of the water vapor measurement systems that exceeded 25% in some cases. This is
to be contrasted with the Aqua retrieval accuracy goal, where a retrieval involves a minimization
of differences between observed and calculated radiances, of 10% in 2 krn layers. The apparent
inadequacy of many of the validation measurement systems to provide data of sufficient quality
to validate retrievals at this accuracy level created questions both about the validation sensor tech-
nologies and how to improve the quality of water vapor measurements used for Aqua validation.
For t h s reason, a dedicated field program called the A I R S Water Vapor Experiment - Ground
(AWEX-G) was held in October - November, 2003 with the goal of resolving the measurement
differences observed among Vaisala radiosonde and Raman lidar and to develop new analytical
tools to improve the absolute accuracy of those measurement systems.
This paper provides the motivation for the AWEX field campaign, discusses the field activi-
ties and the major results of the field activity and then puts those results in the context of Aqua
validation. It is organized as follows. Early AIRS radiance validation comparisons are presented
to illustrate some of the first discrepancies that were uncovered in the validation activity and that
helped to motivate AWEX-G. The AWEX-G field campaign is then described and the major results
summarized. This paper will focus mostly on the Raman lidar measurements and results, which
included new corrections to Raman lidar upper tropospheric water vapor measurements. A com-
panion paper [5] provides the details of the radiosonde intercomparisons and radiosonde accuracy
assessment that occurred during AWEX-G and new correction techniques for Vaisala RS80-H and
RS90/92 measurements that were derived from AWEX measurements. The radiosonde and lidar
sensors are compared here both in terms of profiles and layer mean upper tropospheric precipitable
water. These results are compared with the corresponding results from a similar lidarhadiosonde
intercomparison experiment that was held in 2000. The effect of the new Raman lidar and ra-
diosonde corrections on Aqua validation activities is then demonstrated using examples of both
radiance and retrieval comparisons.
6
3 Early discrepancies between Raman lidar and radiosonde mea- surements and AIRS
NASA has funded special launches of Vaisala RS90 radiosondes to coincide with Aqua satel-
lite overpasses of the DOE Department of Energy (DOE) Atmospheric Radiation Measurements
(ARM) facilities on the North Slope of Alaska (NSA), the Southern Great Plains (SGP) and the
Tropical Western Pacific (TWP). A total of 90 overpasses were targeted in each of three sets of
these special launches with the goal of providing validation data in a variety of seasons and from
different geographic locations [8]. For each targeted satellite overpass, the goal was to launch two
radiosondes separated in time so that one was in the upper troposphere and one in the lower tro-
posphere at the actual time of overpass. Using these sonde measurements and other ancillary data,
a best estimate (BE) product is generated that performs a temporal and spatial interpolation over
an Aqua retrieval region [8]. This database is one of the main sources of validation data for the
Aqua validation activity.
Other validation measurement campaigns were held including one at NASNGoddard Space
Flight Center (GSFC) in the fall of 2002 involving water vapor, temperature and pressure measure-
ments coordinated with 26 nighttime overpasses of the Aqua satellite under both clear and partially
cloudy conditions. For these measurements, the Scanning Raman Lidar ( S U ) was used for the
water vapor profiles, Sippican radiosonde for temperature and pressure profiles and SuomiNet
Global Positioning System (GPS) [ 171 for the total precipitable water. The Raman lidar profiles
7
were calibrated so that the integrated water vapor amount agreed with the total precipitable water
measured by GPS [20].
The BE product generated from the first set of the special Aqua radiosonde launches and the
GSFC validation data were among those validation data sources studied in early 2003 using ver-
sion 3 of SARTA. Figure 1 presents a comparison of the mean brightness temperature differences
between AIRS measurements (denoted "Obs") and the output of version 3 of SARTA (denoted
Talc"), where the water vapor profile used in SARTA was one of the validation datasets, for three
different sets of AIRS observations. The range of frequencies displayed covers the water band.
The first comparison, shown with a solid line, is the mean difference (in degrees K of equiva-
lent brightness temperature) between 82 AIRS fields of view (FOV) from 15 different overpasses
of NASNGSFC between September and November, 2002 and the SARTA-calculated brightness
temperature based on the corresponding GSFC SRL water vapor and Sippican radiosonde tem-
perature measurements. The second, shown with a dashed line is the mean difference between
approximately 41 0 A I R S FOVs from approximately 75 different nighttime overpasses of the ARM
SGP site in late 2002 and the calculations based on the BE product using Vaisala RS90 data as
water vapor input. The third set of measurements, shown in a dash-dot style, is similar to the sec-
ond set except that it focusses on daytime overpasses of SGP during the same time period. Manual
cloud-clearing has been performed on these ensembles.
In general the water vapor line strengths increase moving toward higher wavenumbers in the
8

water band shown in figure 1. Therefore, progressing from lower to higher wavenumbers, the
equivalent brightness temperature, BT, for spectral locations that correspond to the centers of
water vapor absorption lines will increasingly be influenced by the amount of water vapor present
in the upper troposphere and lower stratosphere. Between the lines, where absorption is lower, the
brightness temperatures reflect water vapor concentrations lower in the atmosphere. Thus, given
perfect knowledge of trace gas and continuum absorption spectra and accurate radiative transfer
calculations based on them, differences in BT in figure 1 either on the line centers or in between
the lines can be taken to represent differences in the amount of water vapor inducing the radiances
measured by AIRS (Obs) and the water vapor measured by the validation sensor (Calc).
Several points can be made from figure 1. The first is that approximately a 25% range in ap-
parent water vapor calibration is implied by the -2K uncertainty observed through much of the
water band using the approximate rule of thumb that a 1K difference in brightness temperature in
the upper troposphere corresponds to a relative difference in UT water vapor amount of approx-
imately 12% [6] (12% absolute, not to be confused with a difference of 12% RH). It should be
mentioned here that Obs-Calc comparisons based on other Aqua validation datasets (not shown),
some acquired using Vaisala RS90s as well, implied even larger uncertainties in apparent water
vapor calibration. The correlation of the high frequency structure in all the measurements seen in
figure 1 implied, considering that the radiosonde and lidar measurements were acquired from dif-
ferent locations and at different times, that there likely were errors in the absorption cross sections
9
of the water vapor lines used in SARTA. But, given the 2K range of brightness temperature differ-
ences displayed in figure 1, it was not clear what should be used as validation data to help isolate
the spectroscopy errors and to judge the overall accuracy of SARTA calculations. The questions
of what data source to use for AIRS validation seemed largest in the upper troposphere where cold
temperatures make reliable radiosonde measurements of water vapor more difficult and since the
disagreement of the measurements shown in figure 1 was largest in the higher wavenumber portion
of the water band, which corresponds roughly to the upper troposphere.
These large apparent discrepancies in water vapor measurements were contrasted, however,
with previous field mission experience that indicated that it was possible for several water vapor
sensors to be used in a coordinated fashion over a period of several weeks at the same location
and achieve mean upper tropospheric water vapor calibration in agreement at the +/- 5% level.
This was the result of the ARM-First International Satellite Cloud Climatology Project (ISCCP)
Regional Experiment (FIRE) Water Vapor Experiment (AFWEX), which was held in the fall of
2000 at the DOE ARM SGP Climate Research Facility (CRF) site in northern Oklahoma [3].
The sensors that agreed at the 5% level from AFWEX were the airborne NASA LaRC Lidar
Atmospheric Sensing Experiment (LASE) water vapor lidar and Diode Laser Hygrometer (DLH),
the Vaisala RS80-H radiosonde (after application of corrections for calibration bias and sensor
time-lag), the DOE CART Raman Lidar (CARL) and the SRL. Although, the SRL was one of the
instruments that was found to agree with the reference sensor to within 5%, the SRL hardware
10
configuration changed between the time of AFWEX and the fall of 2002 when the Aqua validation
measurements shown in figure 1 were performed. Therefore, there was uncertainty about the cur-
rent calibration of the SRL upper tropospheric measurements. Also, the Vaisala RS90 radiosonde
was not tested during AFWEX. The RS90 calibration accuracy, time-response, and susceptibility
to sensor icing in clouds is improved substantially over those of the RS80-H and the RS90 has had
changes in its calibration model in the time between AFWEX and the present [ 5 ] . And finally the
CARL lidar began to experience degradation in its performance in mid-2001 making conclusions
about it’s performance after this date based on AFWEX results difficult. Therefore, instrument
alterations, degradations or calibration changes implied that it was not possible to apply the results
of AFWEX to help resolve the measurement differences illustrated in figure 1. The AWX-G field
campaign thus was held with the goal of providing AFWEX quality accuracy assessments of water
vapor measurement technologies in the Aqua era.
4 AIRS Water Vapor Experiment-Ground
Drawing on the success of the AFWEX field campaign, the AIRS Water Vapor Experiment -
Ground (AWEX-G) was held at the ARM SGP site between October 27 and November 16,2003
in order to:
1. Bring a majority of the water vapor measurement technologies in use for Aqua and AIRS
validation together at the ARM SGP site for intercomparison. The technologies that were
11
used during AWEX-G included radiosondes (of various technologies including frostpoint
hygrometer), Raman lidars, GPS (Global Positioning System) and microwave radiometer
(MWR).
2. Operate these instruments over a three-week period of time focussing on nighttime, clear
weather conditions including many instances of multiple radiosondes launched on the same
balloon. The nighttime period was chosen so as to permit Raman lidar measurements to
extend into the upper troposphere and also to avoid the issues relating to daytime heating of
radiosondes that can create a dry bias in the measurements [5] .
3. Characterize the measurement differences of the water vapor technologies and use this in-
formation to better understand the existing differences in the Aqua validation activity and to
develop schemes for improving the accuracies of those measurements.
The "G" designation in the name AWEX-G indicated the possibility that ground-based measure-
ments alone might not resolve the measurement discrepancies that motivated AWEX-G and that
it might be necessary in the future to hold another experiment involving airborne instrumentation.
The fall period was chosen for AWEX-G since this is the season that offers the highest probability
of clear skies due to the frequency strong frontal passages. It also was the season during which
AFWEX occurred.
During AWEX-G, 56 balloons carrying 112 radiosonde packages were launched. The ra-
diosonde technologies that were tested were: Vaisala RS80-H, RS90, RS92, University of Colorado
12
- Cryogenic Frost point Hygrometer CFH) [ 151, Meteolabor SnowWhite hygrometer [ 161, Modem
GL98 (manufactured in France) and Sippican Mark IIa (formerly VIZ). In addition, more than 40
hours of Scanning Raman Lidar measurements of water vapor were acquired in coordination with
the radiosonde launches. The DOE CRF Raman Lidar (CARL) [9] ran continuously through the
experiment as did the C W Microwave Radiometer (MWR) and a SuomiNet GPS system that was
deployed along with the SRL and was the source of calibration of the SRL profiles from the fall
2002 measurements. It was determined early in the AWEX-G effort, however, that the CARL lidar
did not appear to be operating nominally. It was later found that degradation of the system had
significantly affected its water vapor measurement capability such that CARL data were not useful
for Aqua validation. The CARL data are therefore not included in this analysis. CARL refurbish-
mer,t was completed in June 2004 and the initial indications are that the water vapor measurement
performance has been improved over its previous nominal configuration.
The primary goal of AWEX was to inter-compare water vapor technologies and not to provide a
statistically meaningful set of validation measurements during Aqua overpasses. Nonetheless, the
operational plan of AWEX was to operate in coordination with nighttime Aqua overpasses as much
as possible. A heightened period of solar activity caused a shutdown of the AIRS sensors between
October 29 and November 2, however. It was not until November 19 that AIRS re-calibrated
and declared operational. Therefore, there was only one useful Aqua overpass during the AWEX
experiment.
13
In the following sections, the Scanning Raman Lidar and the AWEX-C reference instrument, the
CFH, are briefly described. Then there is a comparison of GPS and MWR total precipitable water
measurements. The corrections for both Raman lidar and Vaisala radiosonde that were derived
from the AWEX-G field campaign are then summarized followed by comparisons of corrected
lidar profiles with fully-corrected Vaisala RS90/92 radiosondes. Mean percentage differences in
upper tropospheric water vapor measurements are studied for Vaisala radiosondes, SnowWhite and
SFU using three techniques for comparison. The results of the AFWEX and AWEX experiments
are compared and, finally, the effects of the AWEX-G Raman lidar and radiosonde corrections on
Aqua validation studies are detailed through both radiance and retrieval comparisons.
4.1 The NASNGSFC Scanning Raman Lidar (SRL)
The SRZ, is a mobile Raman lidar system designed to measure water vapor, aerosols, clouds and
other quantities. It was first deployed in the field in 1991 for the Spectral Radiance Experiment
(SPECTRE) [2] in Coffeyville, KS sponsored by DOE and NASA. It has received numerous up-
grades since that time and now consists of a Nd:YAG laser operating at the tripled frequency of
354.7 nm, a 0.76 m horizontally mounted telescope that is co-aligned with a single axis scanner
that permits horizon to horizon measurements. The 0.76 m telescope is used for the high alti-
tude measurements, while a second, co-aligned 0.25 m telescope mounted inside of the 0.76 m
telescope measures aerosol depolarization and the low altitude Raman signals. Measurements of
water vapor and other quantities are performed during the day and night using the narrow field
14
of view, narrow spectral band technique [20]. The SRL was in essentially the same experimental
configuration as during the International H20 Project - 2002 (IHOP) that occurred in May - June,
2002. Many more details of the instrumental configuration of the SRL and the analysis techniques
used to process the data can therefore be found in references for the IHOP field experiment [20]
WI. 4.2 The AWEX-G water vapor reference: CFH
The CFH is an improved version of the N O M cryogenic frostpoint hygrometer [ 141, which has
long been a standard for balloon-borne stratospheric water vapor measurement. Its operation is
based on the chilled-mirror principle, where a small mirror is electrically heated or cryogenically
cooled to maintain a constant thin layer of frost that is optically detected, in which case the frost
layer is in equilibrium with the environment and the mirror temperature is equal to the frostpoint
temperature of the air. The mirror temperature is measured by a tiny thermistor embedded in the
surface of the mirror. During AWEX-G, it was always launched with Vaisala RS80-H and Meteo-
labor SnowWhite packages attached. Most of the launches included a Vaisala RS92 sensor as well.
An analysis of the measurement errors of the CFH [5] indicates that the mean percentage uncer-
tainty in the CFH RH measurements over the AWEX-G temperature range is approximately 4%
when RS92 temperature measurements were used to convert the frostpoint measurements to RH
and approximately 6% when RS80-H temperature measurements were used. This reduction in ab-
solute error when using the RS92 temperatures is due to the smaller mean temperature uncertainty
15
in the RS92 radiosonde versus the RS80-H (-0.2 vs -0.5 K):
4.3 SuomiNet GPS PW comparison with ARM MWR
The technique that has been adopted for calibrating both Vaisala radiosonde [ 1 13 and Raman lidar
[lo] within the U. S. DOE ARM program is to constrain the vertical profile of water vapor mea-
sured by lidar to possess the same total precipitable water as that measured by collocated MWR.
Research done within the DOE ARM program indicates that carefully calibrated and analyzed
microwave radiometer data possess an accuracy of approximately 2-3% or 0.4 mm, whichever is
larger. Therefore, under dry conditions the absolute accuracy of the MWR PW measurement can
rise above the 2-3% figure stated but for measurements with PW exceeding approximately 13 mm
the accuracy specification should hold. The high accuracy of the MWR under most atmospheric
conditions encountered at a location like the A N I SGP site makes it an excellent calibration stan-
dard for atmospheric research.
A SuomiNet GPS system measuring total precipitable water was used in a similar fashion for
total column water calibration of the SRL during the fall 2002 validation measurements shown in
figure 1. One of the AWEX-G research objectives, therefore, was to compare the measurements of
the GPS system with that of the ARM MWR and investigate if biases in the GPS measurements
might help to explain the differences observed in figure 1 between SARTA calculations based on
SRL, water vapor profiles and AIRS observations. The GPS measures over a much larger vol-
ume than the MWR so that individual comparisons can show considerable disagreement under
16
conditions of atmospheric inhomogeneity. Line of site comparisons of the two instruments have
been performed to address these differences in measurement techniques and have shown excellent
agreement [ 11. During AWEX-G, an approximately month-long comparison of 30-minute average
GPS and MWR vertical precipitable water measurements was performed in order to minimize the
effects of short term spatial inhomogeneities. The results of that comparison are shown in figure 2.
The plot on the left of the figure shows that the PW from GPS was on average 2.4% higher than
MWR due to an offset of -0.4 mm in the best fit regression. However, the slope of the regression
between GPS and MWR was essentially unity. This overall agreement of the two sensors is within
the uncertainty of the MWR, supporting the use of the 'GPS system as an independent source for
calibration. This comparison was done after reducing the MWR PW by 3% to account for recent
updates in the ARM MWR PW processing [12]. The plot on the right of figure 2 presents the
comparison of MWR and GPS PW throughout the 24-hr period. The moist bias of the GPS with
respect to MWR can be seen throughout the diurnal period. The moist bias is approximately 1%
larger during daytime than nighttime.
This analysis indicates that the GPS calibration agrees well with the ARM MWR and offers sim-
ilar absolute accuracy as a source for Raman water vapor lidar calibration provided sufficient statis-
tics are accumulated to reduce the effects of spatial inhomogeneities in the atmosphere. Therefore,
the disagreements observed in figure 1 between the calculations based on the Raman lidar water
vapor profile and AIRS observations are unlikely to be due to the use of GPS as the water vapor
17
calibration reference. The corrections to Raman lidar measurements that were derived from the
AWEX-G experiment and that do offer an explanation for most of this disagreement will now be
discussed along with the AWEX-derived corrections to Vaisala radiosonde data.
4.4 Corrections to Raman Lidar and Radiosondes derived from AWEX-G
One of the achievements of the AWEX-G effort was to develop new correction techniques for
Raman Lidar and Vaisala RS80-H and RS90/92 radiosondes. The Raman lidar corrections in-
clude accounting for the temperature dependence of Raman scattering from water vapor and have
been discussed in detail recently in the context of the International H2O Project (IHOP) [20] [21].
Therefore the details of the correction technique will only be summarized here. The corrections
developed for the Vaisala RS80-H and RS90/92 radiosonde are based on comparisons of Vaisala
radiosondes and the CFH when launched on the same ba!!oon. The details of the those corrections
are described in a companion paper [ 51 in this volume and will be described briefly.
4.4.1 Corrections for Raman lidar water vapor measurements
Two significant corrections for SRL water vapor measurements were developed and tested during
the AWEX-G field campaign. Lidar measurements at short range are usually influenced by what
is known as the "overlap function". The overlap function accounts for the fact that for ranges
close to the lidar system, there is a non-linear relationship between the received power in a Raman
lidar and the number density of the scatterers being probed. This non-linearity is due to both
geometrical and optical effects and is difficult to compute from first principles with high accuracy.
18
Therefore, an empirical correction for residual effects of the lidar overlap function was made based
on comparisons of water vapor mixing ratio measured by SRL and Vaisala RS90 radiosondes. This
technique has been previously described [20] and is similar to what has been applied to the CARL
lidar system [3]. It resulted in a single, mean overlap correction vector that was applied to all
SRL water vapor measurements during AWEX. The net result of this overlap correction for the
AWEX-G experiment was to reduce the SRL calibration factor by approximately 5%.
In addition, a correction for the temperature dependence of the Raman lidar measurement of
water vapor mixing ratio was also performed. This temperature dependence is primarily due to
the temperature dependence of Raman scattering by water vapor, which changes significantly as
a function of temperature [18]. The use of narrow spectral band detection for Raman water va-
por measurements, as is done in the SRL, significantly improves the signal-to-noise of upper tro-
pospheric water vapor measurements and thereby improving the accuracy of measurements of the
type required for Aqua validation. However, due to the spectral width of the Raman water vapor
spectrum and its temperature dependence, it is possible that the effective cross section of water
vapor can change significantly over the range of temperatures present in the troposphere. The
temperature correction technique is based on a new form of the lidar equation [18] and its use in
the calculation of water vapor mixing ratio [19]. This equation involves the ratio of two factors,
F N ( T ) and F H ( T ) , that account for the temperature dependence of Raman Nz ( N ) and HZO ( H )
scattering. The entire temperature dependence of the water vapor mixing ratio measurement by
19
Raman lidar is contained in the ratio FN ( T ) / F H (7') , examples of which have recently been pub-
lished [20]. All of the SRL measurements made during AWEX-G were acquired during the times
of radiosonde launches permitting this ratio to be calculated for each of the SRL measurement pe-
riods during AWEX-G. In the mean, the effect of the temperature correction during AWEX-G was
to reduce the magnitude of the upper tropospheric water vapor mixing ratio measurements with
respect to those in the lower troposphere. This effect reaches a maximum of approximately 8% at
14 km. The standard deviation of the temperature correction at any altitude was less than 1 % with
the largest standard deviation existing in the boundary layer. It should be pointed out that for the
configuration of the SRL, F N ( T ) /FH ( T ) can be made nearly temperature independent by use of a
water vapor center wavelength of 407.45 nm [20]. Since the time of the AWEX-G measurements,
the SRL water vapor filter has been tilt-tuned to this shorter wavelength so that future SRL water
vapor measurement should be nearly temperature independent.
4.4.2 Corrections for Vaisala radiosondes
During AWEX-G, most of the balloons launched carried multiple sonde packages permitting si-
multaneous measurements to be acquired by Vaisala RS80-H, RS-92 and the reference CFH sensor
while travelling through the same atmosphere. This dataset was analyzed by Miloshevich et. al.
[5] by first applying previously known time lag and, in the case of the RS80-H, temperature de-
pendence corrections for Vaisala radiosondes [4] in order to characterize residual mean differences
in the measurements of the Vaisala RS80-H and RS92 with respect to the CFH reference sensor.
20

These differences were characterized as a function of relative humidity (RH) and temperature, in
terms of which the Vaisala calibration functions are defined, in order to derive what is referred to
as the "AWEX empirical calibration correction". The AWEX corrections are therefore applied to
Vaisala RS80-H and RS92 as a function of relative humidity and temperature and minimize the
mean differences between the Vaisala radiosonde measurements and those of the CFH. After ap-
plying these corrections, the mean comparison of both RS80-H and RS92 and CFH agree within
&lo% (at worst and usually much better) up to the tropopause and in the case of the RS92, into
the lower stratosphere making both radiosonde sensors suitable for Aqua validation work if the
corrections are applied. Other tests performed during AWEX-G indicated that the Vaisala RS90
and RS92 are virtually identical in their water vapor measurement performance permitting the cor-
rection function derived based on simultaneous measurements of RS92 and CFH to be applied to
RS90 measurements as well. See Miloshevich et. al. [5] for more details.
4.5 Water vapor profile comparisons
Water vapor measurements acquired by SRL and six radiosonde sensors (Vaisala RS80-H, Vaisala
RS90, Vaisala RS92, Sippican Inc. Mark 11-a, Modem GL-98 and Snow White chilled mirror
hygrometer) were compared with the reference CFH profiles. The profile comparisons of the
different radiosondes with CFH are fully described in a companion paper [ 5 ] , so the assessment
of lidar profile accuracy will be focussed upon in this section. The results of that study that are
pertinent to the analysis done here are:
21

1. AWEX testing indicated that the Vaisala RS90 and 92 sensors have essentially identical water
vapor measurement performance due to the use of nearly identical capacitance RH sensors
in the two instruments. Because of this, these sensors will be referred to as RS9X in this
analysis.
2. Overall, the most accurate operational radiosonde tested was the Vaisala RS9X, whose mean
percentage accuracy relative to CFH, after all corrections, was < 1 % in the lower troposphere
(LT), <2% in the mid-troposphere (MT) and <3% in the upper troposphere (UT). It was
judged that only the Vaisala RS9X is sufficiently accurate in the mean for Aqua water va-
por validation throughout the troposphere (given the 10% absolute accuracy goal for Aqua
retrievals), especially if the corrections are applied.
3. The SnowWhite is incapable of measuring very dry coiidiiions (<6% RH), and substzgtial er-
rors in the lower troposphere are possible if the proper phase of condensate on the mirror can-
not be determined. After eliminating measurements subject to these errors, the SnowWhite
that flew on the same balloon as the CFH showed excellent mean agreement with the CFH
and therefore the SnowWhite is a suitable Aqua validation sensor under this limited set of
conditions.
4.5.1 Data selection
In the comparison of Scanni .born g Raman Lidar profiles with the balloo sensors during the
AWEX field campaign, certain data rejection criteria were used. Many of the AWEX measurement
22
periods had at least some periods of cloudiness. In general, in comparisons of lidar and radiosonde,
if the lidar senses a cloud at a certain altitude there is no guarantee that the radiosonde, which has
drifted downwind, is also sensing a cloud at the same altitude. Therefore a cloud-mask product
was created from the SRL aerosol scattering ratio data and used to screen out cloudy comparisons
during AWEX. Comparisons between SRL and sonde were not performed for altitudes at which
the SRL aerosol scattering ratio indicated the presence of a cloud. Furthermore, if the random
error in the SRL water vapor mixing exceeded loo%, these SRL data were rejected. Certain points
were rejected from the SnowWhite and CFH data records because of icing or controller instability
and from the RS9X due to anomalously large disagreements with SRL that indicated different air-
masses were likely being sampled. SnowWhite data below 6% RH were rejected from the analysis
due to the inability of the Peltier cooler to consistently maintain a. frost layer in very dry conditions,
as previously mentioned.
4.5.2 SRL profile comparisons with fully-corrected Vaisala RS9X
The profile comparison of SRL with the reference CFH showed agreement generally within 10% up
to an altitude of 9 km, but poor statistics above this altitude due to the presence of clouds prevented
a robust characterization of SRL performance above this altitude. However, one of the conclusions
of the AWEX-G radiosonde analysis [5] was that the mean, fully-corrected RS9X agreed with the
CFH to better than 3% at all altitudes. The fully-corrected RS9X sensor, therefore, can be used as
a transfer standard of the CFH calibration to assess the accuracy of the SRL measurements since
23

there were significantly more comparisons of S I U and RS9X than with CFH.
The mean percentage difference between the SRL and RS9X using three methods of analyzing
the SRL data are therefore shown in figure 3 using the data rejection criteria described earlier. The
three methods of analyzing the SRL data, referred to as "Sum","Var", and "Track", are described
more filly in Appendix 11. Briefly, the "Sum" method uses the same temporal averaging period
independent of altitude, "Var" uses a variable temporal average as a function of altitude and "Track"
implements a techtuque that attempts to compensate for the fact that the radiosonde drifts with the
wind. For this comparison, the definition of the layer mean percentage difference is Mean[(S, -
l4)/l4] where S indicates the SRL measurement and V indicates the Vaisala RS9X measurement
and where each ith layer is 1 -km thick. Table 1 provides the mean comparison of the sensors based
on a regression analysis where the percentage difference between SRL and RS9X is calculated
based on order pairs formed at l-km resolution, the same as used in the profile analysis shown in
figure 3.
Referring to figure 3, the three methods of analyzing the SRL data with respect to RS9X show
agreement to better than 10% at all altitudes below 13 km. Below 6 km, all methods agree to better
than 5-7% with the RS9X measurements. In this altitude range, the track sonde technique yields
a near 0% bias and the variable and straight sum techniques show the largest differences of 5 7 %
between 3 and 4 km. Above 6 km, the variability in the track sonde comparisons increases so
that the track sonde analysis in general yields the largest differences with RS9X. The straight sum
24
and variable sum comparisons perform similarly throughout the profiles. The regression analysis
shows nearly unity slope for all three methods of reducing the lidar data and mean percentage
difference of less than 3% for all techniques. However, this traditional technique of comparing
lidar and radiosonde data averages dry and wet profiles within the same altitude region together in
the ensemble. This may have the effect of masking errors that increase under dry conditions. In
section 4.7, a technique that permits these effects to be isolated in the analysis will be explored.
4.6 Mean AWEX-G Upper Tropospheric Accuracy Assessment
Because of the importance of upper tropospheric (UT) water vapor for Aqua validation and the
difficulty in accurately measuring it, the UT measurement accuracy of the Vaisala RS80-H, RS9X,
SnowWhite and SRL were studied. Only those radiosonde measurements made on the same bal-
ioon were used in the accuracy assessment with rcspect to CFH. The SRL accuracy was assessed
with respect to fully corrected RS9X due to the larger number of comparisons available.
The accuracy assessment was performed in three different ways: the first was based on the
total precipitable water measured by the various sensors from 7 km to the tropopause (typically
between 14 - 15 km during AWEX). This technique gives greater weight to the lower altitudes
where most of the precipitable water is located. The second was based on a linear regression
of ordered pairs of values from the two sensors being tested and uses a similar approach as in
the AFWEX analysis [3], where the mean percentage differences were determined using the for-
mula X , - REF,/REF,, where REF, refers to the mean of the reference sensor measurements
25
in the entire 7 km to tropopause layer. This technique for calculating mean percentage differ-
ence tends to suppress the influence of dry layers. The third technique was based on the same
linear regression results but used a different formula for calculating mean percentage difference:
(Xi - REFi)/REFi, so that in this method the percentage difference is determined strictly layer
by layer. This technique equally weights dry and wet layers in the computation of the mean. For
these regressions of same-balloon radiosonde data, ordered pairs of points were formed using ap-
proximately 20 m vertical resolution where all qualifying points within the altitude range of 7
km to the tropopause were used. For the regressions of SRL and RS9X data, both 200 m and 1
km resolution data were studied. The regressions presented here use 1-km resolution; the 200 m
resolution regressions gave similar results but with higher variability.
4.6.1 Comparisons with respect to CFH
Because of the potential influence of atmospheric variability on the assessment of relative perfor-
mance of sensors that are not sampling the same atmosphere, only sensors carried on the same
balloon as the CFH are analyzed here. The mean percentage differences of the Vaisala RS80-H,
Vaisala RS92 and Meteolabor SnowWhite water vapor mixing ratio measurements with respect to
CFH are shown in figure 4. Water vapor mixing ratio was calculated using the respective tem-
perature and pressure information from each individual sensor. For the CFH, which was always
launched with an RS80-H attached and usually also with an RS92, the RS92 temperature and pres-
sure were used when available due to there higher accuracy. For the SnowWhite, the RS80-H
26

temperatures were used since these are the temperatures that are available in its nominal con-
figuration when launched with the CFH. Ordered points were formed at a vertical resolution of
approximately every 20 m. The Vaisala radiosondes have received the full corrections described
above including MWR scaling. The SnowWhite profiles have only been microwave-scaled. The
results are summarized in Table 2.
Figure 4 and Table 2 indicate that the various methods of analysis show approximately a 1-2%
dry bias of RS92, a 3-6% dry bias of RS80-H and a 2-8% wet bias of SnowWhite with respect to
CFH. Nearly all of these comparisons, however, are within one standard error of the reference CFH
value. Only the comparison of RS80-H and CFH based on precipitable water shows a statistically
significant, small dry bias. As would be expected, the variability in the three mean percentage
differences (E( %)) presented (PW, AFWEX, AWEX) increases consistently from left to right.
The PW method of calculating percentage difference generates one value for each profile, thus
increasing the statistical robustness. The AFWEX method calculates a mean percentage difference
but uses the same mean value from 7km to the tropopause to normalize each of the differences used
in the mean whde the AWEX method normalizes each of these differences by the CFH value used
in each difference. Thus from left to right the results shown in Table 2 of the different methods of
calculating percentage difference are increasingly more subject to the influence of small absolute
differences (and corresponding large percentage differences) in dry layers.
27

4.6.2 Comparisons of SRL with respect to fully-corrected RS90/92
In Miloshevich et. al., [ 5 ] , it was shown that, in the mean, the fblly-corrected RS9X could be used
as a transfer of the CFH absolute calibration with mean uncertainties less than 3% in the upper
troposphere. Because of the much larger number of comparisons of SRL and RS9X than with
CFH, therefore, the analysis of SRL upper tropospheric measurements was done with respect to
RS9X. For the regression analyses shown here, the ordered pairs were formed using 1 -km averages
to decrease the influence of small differences in dry layers that can result in large percentage dif-
ferences. The results of the PW and bias comparisons are presented in figure 5. The corresponding
tabular information is provided in Table 2.
Figure 5 presents the upper tropospheric precipitable water comparison of the fully corrected
SRL and RS9X data using the three methods of analyzing the SRL measurements. Aii methods
of analysis show agreement to better than &5.4% with the standard error indicating no significant
difference between the mean UT measurements of the SRL and RS9X. There is, however, a dis-
tinct tendency for the tracksonde method to produce higher variability than the other methods of
reducing the SRL, data. It is interesting to note that the slope of the best fit line using all three
methods of processing the SRL, data is less than unity, whereas the full profile regression results
shown in Table 1 indicated a nearly unity slope. The upper tropospheric regression will be studied
in more detail in the next section.
Of the three techniques, the variable sum technique yields a slope that is closest to unity, the
28
intercept that is closest to zero shows the lowest mean variability, and also provides the best overall
agreement with the fully corrected RS9X. It is for these reasons that the variable sum technique of
analyzing the SRL data will be used to demonstrate the effect of the corrections to the lidar data
later in the paper.
4.7 Lidar and radiosonde water vapor measurements compared as a function of water vapor amount and altitude
As previously described, the AWEX corrections to Vaisala radiosonde data were developed as
functions of RH and T since these are the fundamental variables that both influence radiosonde
accuracy and that Vaisala uses in its own calibration functions that are applied automatically to the
datastream by the ground station. In a similar fashion, it is interesting to consider what are the fun-
damental variables influencing the random uncertainty of Raman lidar water vapor measurements
where the random error is determined assuming Poisson statistics. In simple terms, assuming sim-
ilar background light levels, as should be the case for these nighttime profiles, the random error in
Raman lidar measurements of water vapor are influenced by 1) the amount of water vapor present
at a given altitude and 2) the altitude of the comparison. However, a mean comparison of lidar
and radiosonde as a function of altitude, as shown in figure 3, results in averaging wet and dry
layers in the same altitude range but from different profiles. This can have the effect of combining
measurements in the same layer that may be characterized by very different random uncertainties.
In order to address this, figure 6 shows a comparison of SRL and RS9X as a function both of water
29
vapor mixing ratio and altitude. The variable sum technique was used to process the SRL data used
here.
In figure 6, the percentage differences between fully-corrected SRL and fully-corrected RS9X
between the altitudes of 7-9 km, 9-1 1 km and 1 1 - 13 km are presented. After using the data selec-
tion techniques described earlier, the ordered pairs of points were divided into 5 equally populated
categories based on the RS9X water vapor mixing ratio values. The percentage difference is then
plotted for the mean of each of these 5 categories within each of three altitude regions. Although
this comparison is based on only 13 sonde profiles, there is an indication that the SRL measure-
ments become moister than the radiosonde as mixing ratio amount decreases. This tendency ap-
pears to exist independent of altitude and is in agreement with the 7 km to tropopause regression
slopes shown in Table 2, which were all less than unity. A further study of these same percentage
differences versus both RH and T (not shown) indicated that there is no temperature sensitivity
to the differences, but that a moistening trend of similar magnitude in the SRL is observed when
viewed in terms of RH. The lack of a temperature dependence in these results implies that the cor-
rection for the temperature dependence of Raman scattering is not the source of the disagreement.
The percentage differences between SRL and RS9X are present in approximately equal magnitude
whether studied in terms of mixing ratio or RH (to be expected given the general relationship of
these two quantities), Therefore, the 20-40% mean differences observed in figure 6 for the very
driest layer studied is larger than the uncertainty in the correction of the RS9X with respect to the
30
CFH under dry conditions. The implication is that there is a true tendency for the SRL to measure
moist under very dry conditions. Fluorescence of some organic contaminant or optical component
in the lidar system is a possible explanation for a moist bias that would not show a temperature
dependence since fluorescence would have a long decay time and tend to elevate the signal above
the background and be most visible in dry layers. We will study this effect in the future although
it is important to point out that even with this moist bias, the SRI, and RS9X agreed generally to
better than 5% in their upper tropospheric water vapor measurements.
5 The relationship of AWEX-G and AFWEX results
Both AWEX-G and AFWEX resulted in a core group of sensors that agree within 4~5% based
on several analysis methods. The AFWEX field campaign used the LASE airborne DIAL instru-
ment as its reference and AWEX-G used the CFH. These two instruments have not been directly
compared but an analysis of the results of the two field campaigns can give some indication of the
relative performance of the LASE and CFH and thus of the conclusions of AWEX-G and AFWEX.
There were two water vapor profilers common to the two field campaigns that operated nominally
and for which there are sufficient statistics to make useful conclusions about their operations.
Those sensors were the SRL and the Vaisala RS80-H.
As detailed in Miloshevich et. al. [ 5 ] , the RSSO-H calibration accuracy is a function of RH and,
prior to application of the AWEX correction, shows a moist bias under dry conditions and a dry bias
31
under moist conditions. The results of both AFWEX and AWEX are in agreement with the RH-
dependent accuracy curves [ 5 ] derived for the RS80-H. Apparent differences in the performance
of the RS80-H sensor prior to applying corrections in the two experiments are attributed to the
generally moister profiles that occurred in AFWEX versus AWEX. Therefore, after considering the
differences in the measurement conditions found in AFWEX and AWEX, the RS80-H performance
was similar in the two experiments.
Considering the SRL results, the mean UT bias of the SRZ, with respect to LASE in AFWEX
(based on a regression of points between 7 km and the tropopause using what we have referred
to as the AFWEX technique here) was approximately +4% [3]. We have re-analyzed the SRL
measurements from AFWEX using the correction techniques developed here and found that the
mean upper tropospheric bias of the SRL decreased by 3% using the same methods employed
in the AFWEX analysis. This brings the mean calibrations of LASE and SRL to within 1% of
each other during AFWEX. Table 2 shows that using the variable sum technique, the SRL agreed
within 1-4% of the fblly-corrected RS9X, which agreed with CFH to better than 3%. Therefore, the
implication of these relative comparisons is that the AFWEX water vapor reference sensor (LASE)
and the AWEX water vapor reference sensor (CFH, which in Miloshevich et. al. was judged to
have absolute accuracy of 4-6% depending on RH) are equivalent to within approximately 5%.
6 The effect of the Raman lidar and radiosonde correc-
32
tions derived from AWEX on AIRS radiance comparisons
Analytical correction techniques were derived during AWEX to improve the absolute accuracy of
both radiosonde and Raman lidar measurements and have been described above. In this section,
the inhence of those corrections on AIRS radiance comparisons is illustrated.
6.1 Raman lidar overlap and temperature dependence corrections
The radiance comparison shown in figure 1 has been re-analyzed using the Raman lidar correc-
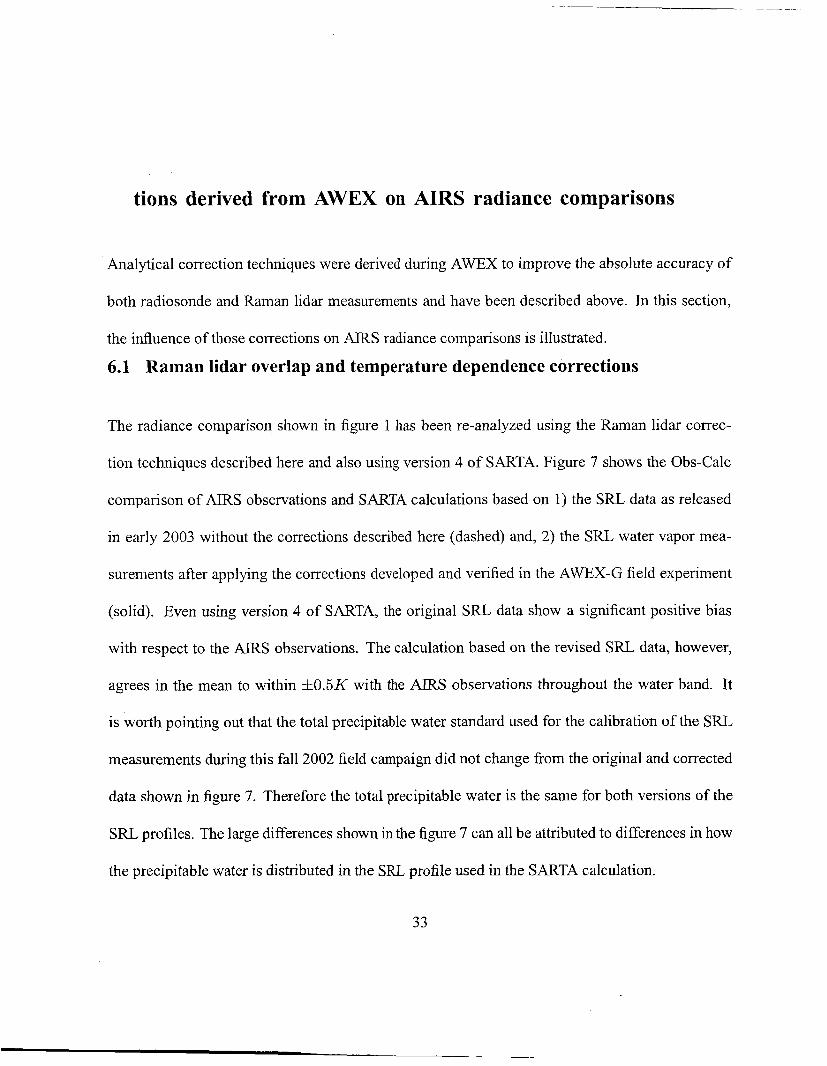
tion techniques described here and also using version 4 of SARTA. Figure 7 shows the Obs-Calc
comparison of AIRS observations and SARTA calculations based on 1) the SRL data as released
in early 2003 without the corrections described here (dashed) and, 2) the SRL water vapor mea-
surements after applying the corrections developed and verified in the AWEX-G field experiment
(solid). Even using version 4 of SARTA, the original SRL data show a significant positive bias
with respect to the A I R S observations. The calculation based on the revised SRL data, however,
agrees in the mean to within f0.5K with the A I R S observations throughout the water band. It
is worth pointing out that the total precipitable water standard used for the calibration of the SRL
measurements during t h s fall 2002 field campaign did not change fiom the original and corrected
data shown in figure 7. Therefore the total precipitable water is the same for both versions of the
SRL profiles. The large differences shown in the figure 7 can all be attributed to differences in how
the precipitable water is distributed in the SRL profile used in the SARTA calculation.
33
6.2 Vaisala RS-90 Corrections
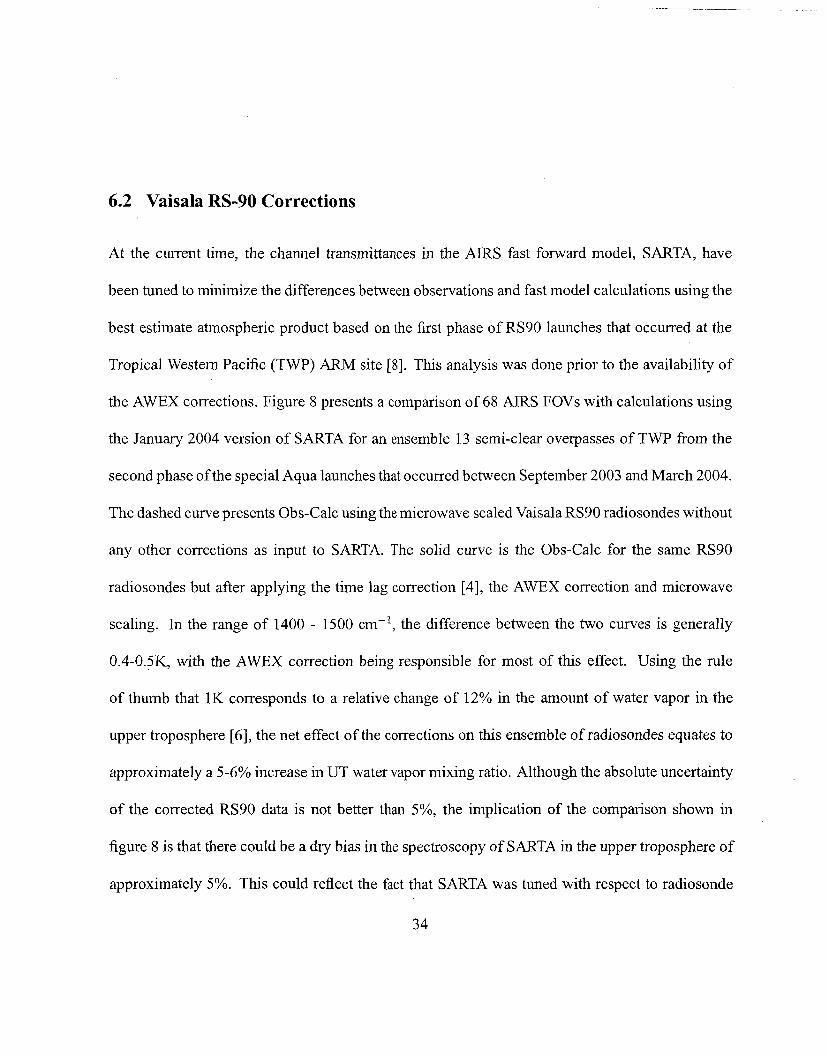
At the current time, the channel transmittances in the AIRS fast forward model, SARTA, have
been tuned to minimize the differences between observations and fast model calculations using the
best estimate atmospheric product based on the first phase of RS90 launches that occurred at the
Tropical Western Pacific (TWP) ARM site [8]. This analysis was done prior to the availability of
the AWEX corrections. Figure 8 presents a comparison of 68 AIRS FOVs with calculations using
the January 2004 version of SARTA for an ensemble 13 semi-clear overpasses of TWP from the
second phase of the special Aqua launches that occurred between September 2003 and March 2004.
The dashed curve presents Obs-Calc using the microwave scaled Vaisala RS90 radiosondes without
any other corrections as input to SARTA. The solid curve is the Obs-Calc for the same RS90
radiosondes but after applying the time lag correction [4], the AWEX correction and microwave
scaling. In the range of 1400 - 1500 cm-l, the difference between the two curves is generally
0.4-0.5KY with the AWEX correction being responsible for most of this effect. Using the rule
of thumb that 1K corresponds to a relative change of 12% in the amount of water vapor in the
upper troposphere [6], the net effect of the corrections on this ensemble of radiosondes equates to
approximately a 5 6 % increase in UT water vapor mixing ratio. Although the absolute uncertainty
of the corrected RS90 data is not better than 5%, the implication of the comparison shown in
figure 8 is that there could be a dry bias in the spectroscopy of SARTA in the upper troposphere of
approximately 5%. This could reflect the fact that SARTA was tuned with respect to radiosonde
34

data prior to applying the corrections developed here. Although the comparison with respect to the
lidar profiles shown in figure 7 shows slightly better overall agreement with the AIRS observations
than figure 8 based on RS90 radiosondes from TWP, both comparisons tend to indicate a dry bias
to SARTA spectroscopy of approximately 5% in absolute water amount in the high wavenumber
region of the water band. Although the absolute accuracy of the CFH sensor used to generate the
AWEX calibration correction for the RS90 is also approximately 5%, the implication of both of
these comparisons based on independently calibrated validation data is that there is a small dry
bias in the SARTA spectroscopy.
It is important to point out that figure 8 represents the mean comparison of an ensemble of mea-
surements. This is quite useful for radiance validation experiments where large sets of statistics are
desired. However, the magnitude of the corrections for individual radiosondes can be considerably
larger than the -5-6% noted above. Loolung at the individual radiosondes that were launched at
TWP during phase 2 of the special Aqua radiosonde launches, for example, the changes in upper
tropospheric water vapor values due to the corrections developed from AWEX exceed 40% in some
cases [5] . Therefore, if studies are to be done on single overpass cases or with small datasets it is
particularly important to work with fully corrected radiosonde data.
7 Comparison of GPS and corrected SRL measurements from fall 2002 to Aqua version 4 retrievals
Using corrected SRL data, the 26 overpass measurements acquired at GSFC in the fall of 2002
35
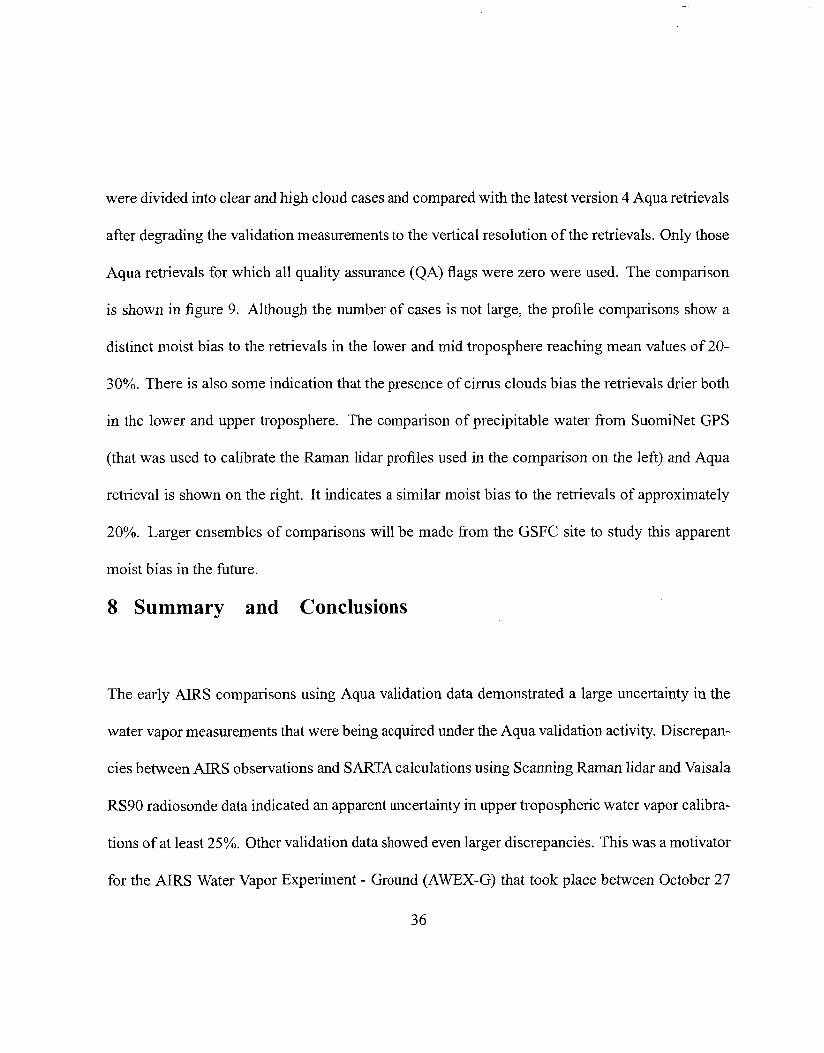
were divided into clear and high cloud cases and compared with the latest version 4 Aqua retrievals
after degrading the validation measurements to the vertical resolution of the retrievals. Only those
Aqua retrievals for which all quality assurance (QA) flags were zero were used. The comparison
is shown in figure 9. Although the number of cases is not large, the profile comparisons show a
distinct moist bias to the retrievals in the lower and mid troposphere reaching mean values of 20-
30%. There is also some indication that the presence of cirrus clouds bias the retrievals drier both
in the lower and upper troposphere. The comparison of precipitable water from SuomiNet GPS
(that was used to calibrate the Raman lidar profiles used in the comparison on the left) and Aqua
retrieval is shown on the right. It indicates a similar moist bias to the retrievals of approximately
20%. Larger ensembles of comparisons will be made from the GSFC site to study this apparent
moist bias in the future.
8 Summary and Conclusions
The early AIRS comparisons using Aqua validation data demonstrated a large uncertainty in the
water vapor measurements that were being acquired under the Aqua validation activity. Discrepan-
cies between ALRS observations and SARTA calculations using Scanning Raman lidar and Vaisala
RS90 radiosonde data indicated an apparent uncertainty in upper tropospheric water vapor calibra-
tions of at least 25%. Other validation data showed even larger discrepancies. This was a motivator
for the AIRS Water Vapor Experiment - Ground (AWEX-G) that took place between October 27
36

and November, 19, 2003. The objective of AWEX-G was to bring together in one place various
water vapor technologies in use for Aqua validation and operate them over an extended period in
order to resolve the discrepancies observed.
During AWEX-G various radiosonde (Vaisala RS80-H, RS90, RS-92, Modem, Sippican, SnowWhite)
and Raman lidars (SRL and CARL,) were operated along with the reference Cryogenic Frostpoint
Hygrometer (CFH). The total precipitable water measurements of GPS were also studied with re-
spect to MWR. The month long comparison of GPS and MWR precipitable water measurements
during AWEX indicated mean agreement of better than 3%. The conclusion was that GPS is an
accurate precipitable water calibration source that can be used to constrain profile measurements
of water vapor mixing ratio by Raman lidar, provided that ensembles of cases are used to reduce
variability that can be introduced by the large volume average used by GPS.
Corrections for the effects of the lidar overlap function and the temperature dependence of Ra-
man scattering on Raman water vapor measurements were also developed using the AWEX-G
measurements. The combined effects of the overlap and temperature dependence corrections on
the SRL water vapor measurements was to reduce the water vapor mixing ratio in the upper tro-
posphere by 10-15% at the highest altitudes. The temperature dependence correction is a sensitive
function of the exact transmission characteristics of the lidar system. In the case of the SRL, the
temperature dependence of the water vapor mixing ratio measurements can be essentially elimi-
nated with careful selection of the bandpass characteristics of the water vapor interference filter.
37
Atmospheric variability was found to be potentially a significant source of error in this study.
For this reason radiosonde comparisons with CFH were limited to sensors flown on the same
balloon as the CFH. Comparisons of sensors with CFH launched simultaneously but on differ-
ent balloons consistently showed significantly higher variability. The contribution of atmospheric
variability to the comparison of lidar and radiosonde was noticeable and required some manual
rejection of data. Based on our experience in AWEX-G, it is suggested that, if possible, accuracy
assessments of radiosondes be done with respect to sensors on the same balloon and that accuracy
assessments of lidar be done with respect to other lidar systems so as to minimize the effects of
sampling different atmospheres on the results. In order to avoid the need for manual rejection
of data, much larger ensembles of lidarhadiosonde comparisons than acquired in AWEX-G are
cncouraged in future experiments.
The AWEX-G radiosonde intercomparison activity is detailed in a companion paper [5] in this
same issue. Among the conclusions of that effort were that the Vaisala RS90 and 92 have es-
sentially identical measurement performance and thus could be treated as identical sensors. A
significant result of that detailed accuracy assessment effort was the development of new empiri-
cal corrections for Vaisala RS80-H and RS9X that address errors in the Vaisala calibration model
and bring these Vaisala sensors into excellent mean agreement with the CFH. For RH > lo%, the
RS80-H agrees in the mean
< lo%, the mean agreement
with CFH to within &5% and the RS-9X to withn f2%. For RH
between RS80-H and CFH is within &lo%, while that for RS-9X is
38

withm &5%. It was judged that only the Vaisala RS9X is sufficiently accurate for Aqua water vapor
validation throughout the troposphere (given the 10% absolute accuracy goal for Aqua retrievals),
especially if the corrections are applied.
Using the newly developed correction techniques for both radiosonde and Raman lidar, the
mean upper tropospheric water vapor calibrations of the Vaisala RS-SOH, Vaisala RS92 and Mete-
olabor SnowWhite were calculated using three techniques versus the reference CFH. Full profile
and upper tropospheric comparisons were also made between the SRL and fully-corrected RS9X.
For the purposes of this study, the upper troposphere was defined as extending from 7 lun to the
tropopause; the same as in the AFWEX study [3]. Three techniques were used to compare upper
tropospheric water vapor measurement performance. The first of these was in terms of integrated
precipitable water hetween 7 km and the tropopase, the second and third were both in terms of
biases determined fiom the linear regression of ordered pairs of points within the same altitude
range, where two different formulas were used to calculate the biases. Using data selection crite-
ria, mean agreement within 5% was generally achieved between the operational radiosondes and
the CFH using any of the methods of comparison.
Of the three methods of characterizing sensor UT accuracy, the one based on precipitable water
may be more important for assessing the influence of measurement error on outgoing longwave
radiation (OLR) calculations since it has been shown [3] that errors of 5% in the integrated PW
above 7 km introduce errors in OLR calculations of -0.5 W/m2. It should be pointed out, however,
39
that the PW above 7 Icm is typically dominated by the water vapor found within a region 1-2 Icm
above this altitude. So this technique of comparing sensors will be less sensitive to measurement
differences at high altitudes where water vapor concentrations generally are lower. The regression
analyses can therefore provide more information about the relative performance of sensors in the
upper portions of the upper troposphere than can the PW approach. Only if regression results reflect
relative performance of sensors that is independent of altitude may they be taken as a substitute
for an accuracy assessment done directly in terms of precipitable water. Accuracy assessments
based both on total precipitable and regression biases provide a more complete characterization of
a sensors' relative Performance than either approach separately.
Miloshevich et. al. [ 5 ] showed that the fully corrected RS9X agrees in the mean with CFH to
generally better than 3% throughout the troposphere (better in the lower and middie tropospnerej.
Therefore, because of a small number of direct SRL/CFH comparisons in the UT, the RS9X was
used as an accurate transfer standard of the water vapor calibration of the CFH reference sensor
in order to characterize the water vapor measurement performance of the SRL. There were three
techniques of analyzing the Raman lidar data used in order to address the inherent spatiotem-
poral measurement differences between lidar and radiosonde. These techniques are referred to as
"Var", "Sum",and "Track".. The 1-km average profile comparison of fully-corrected SRL and fully-
corrected RS9X showed mean agreement between the two sensors of generally better than 5% up
to an altitude of 12 km using any of the techniques. The tracksonde showed larger variability than
40
the straight sum and variable sum methods resulting in agreement of better than 10% to the same
altitude. The conclusion regarding the three methods of analyzing the Raman lidar data is that,
based on this ensemble of measurements, there is a small advantage to the use of the variable sum
technique over the straight sum technique, but that the track sonde approach of analyzing the data
introduced larger variability in the results than either of the other techniques. It is apparent, at least
for this set of measurements, that the assumption of the track sonde approach - that the atmosphere
translates uniformly and unchanging at each altitude - was violated such that this technique of
analyzing the data actually degraded the comparisons.
Both standard deviation and standard error of the mean percentage differences are presented in
the results provided here. The use of standard error assumes that the relative difference between
two sensors being compared is independent of the ordered pairs used in the regression even though
these pairs may represent very different measurement conditions (RH, T, mixing ratio, altitude)
that can influence measurement performance. Based on the results here, this assumption is more
true for the same-balloon radiosonde comparisons than the lidarhadiosonde comparisons. It is not
clear if the tendency for the upper tropospheric lidadradiosonde regressions to yield slopes less
than unity reflects a measurement problem in the lidar or the radiosonde or if some element of
atmospheric variability not removed through data selection might be the cause. Despite the less
than unity slopes in the UT comparison of SRL and RS9X, mean agreement in the UT comparisons
was achieved generally at the 5% level using all methods of comparison.
41
Based on this analysis, a core group of sensors was found to agree at approximately the &5%
level after applying all corrections that were developed from AWEX. These sensors were the
Vaisala RS80-H, RS90, RS92, SnowWhite, SRL and the CFH. In the case of the RS80-H, cloud
contamination must be eliminated to achieve this accuracy. In the case of the SnowWhite, cloud
contamination must be eliminated and the RH comparisons must further be restricted to values
above 6% RH. The comparison of fully corrected SRL and RS9X indicated agreement generally
to better than 5% both in the full profile comparisons and in the upper tropospheric water vapor
comparisons. A study of the common results of AFWEX and AWEX-G experiments implies that
the reference sensors from AFWEX (LASE) and the CFH reference sensor from AWEX-G should
agree within approximately 415%. The effect of the corrections was demonstrated both in radiance
zmd retrieval comparisons using SRL data Erom NASNGSFC and Vaisala RS90 data from the
ARM TWP site. The radiance comparison indicate agreement with the AIRS fast forard model,
SARTA, at the 5% level. Comparison of Aqua retrievals and corrected Raman lidar data indicate
a moist bias to the retrieval of approximately 20% and that the presence of cirrus clouds may
influence these results.
The main research goal of the AWEX-G field campaign was to study and resolve apparent
measurement differences among Vaisala radiosonde and Raman lidars in use in the Aqua validation
effort. The results presented here indicate that measurement errors of significant magnitude were
found in both the Vaisala radiosondes and Scanning Raman Lidar and that the correction techniques
42
developed for these instruments bring them into agreement both with each other and with the
reference sensor, the Cryogenic Frostpoint Hygrometer, to approximately 5%. Given that the goal
for Aqua retrieval absolute accuracy is lo%, the corrected profiles provided by Vaisala RS80-H,
RS9X and Scanning Raman Lidar are found to be suitably accurate for Aqua validation efforts.
9 Acknowledgements
The support of the Research Division of NASA's Office of Earth Science, managed by Dr. Jack
Kaye, and the EOS Validation Activity managed by Dr. David Starr are gratefully acknowledged.
10 References
[l] Braun J, Rocken Cy Liljegren J, 2003: Comparisons of line-of-sight water vapor observations
using the global positioning system and a pointing microwave radiometer, J. Atmos. Ocean.
Tech. 20 (5 ) : 606-612.
[2] Ellingson R. G. , W. J. Wiscombe, 1996: The spectral radiance experiment (SPECTRE):
Project description and sample results, Bull. Amer. Meteor. SOC. 77 (9): 1967-1985.
[3] R. A. Ferrare, E. V. Browell, S. Ismail, S. A. Kooi, L. H. Brasseur, V. G. Brackett, M. B.
Clay-ton, J. D. W. Barrick, G. S. Diskin, J. E. M. Goldsmith, B. M. Lesht, J. R. Podolske, G.
W. Sachse, F. J. Schmidlin, D. D. Turner, D. N. Whiteman, D. Tobin, L. M. Miloshevich, H.
E. Re-vercomb, B. B. Demoz, P. Di Girolamo, Characterization of Upper-Troposphere Water
43
Vapor Measurements during AFWEX Using LASE, J. Atmos. Ocean. Tech., Vol 21, 1790-
1808, (2004)
[4] Miloshevich, L.M., A. Paukkunen, H. Voemel, and S.J. Oltmans, 2004: Development and
validation of a time-lag correction for Vaisala radiosonde humidity measurements. J. Atmos.
Oceanic Technol. 21, 1305-1327.
[5] Miloshevich, L. M., H. Vomel, D. N. Whiteman, B. M. Lesht, F. J. Schmidlin, F. Russo,
Absolute Accuracy of Water Vapor Measurements from Six Operational Radiosonde Types
Launched During AWEX-G, and Implications for AIRS Validation, this issue.
[6] Soden B, Tjemkes S, Schmetz J, Saunders R, Bates J, Ellingson B, Engelen R, Garand L, Jack-
son D, Jedlovec G, Kleespies T, Randel D, Rayer P, Salathe E, Schwarzkopf D, Scott N, S o h
B, de Souza-Machado S, Strow L, Tobin D, Turner D, van Delst P, Wehr T, An intercomparison
of radiation codes for retrieving upper-tropospheric humidity in the 6.3-mu m band: A report
from the first GVaP workshop,BULLETIN OF THE AMERICAN METEOROLOGICAL SO-
CIETY, 81 (4): 797-808 APR 2000
[7] L.L. Strow, S.E. Harmon, S. De Souza-Machado, H.E. Motteler, and D. Tobin, "An Overview
of the AIRS Radiative Transfer Model", IEEE Transactions On Geoscience And Remote Sens-
ing, volume 41, number 2,303-313 (2003).
44

[SI Tobin, David C. Tobinl, Henry E. Revercomb, Robert 0. Knuteson, Wayne F. Feltz, Barry
Lesht, Ted Cress, L. Larrabee Strow, Scott E. Harmon, Eric J. Fetzer, ARM Site Atmospheric
State Best Estimates for AIRS Forward Model and Retrieval Validation, this issue.
[9] Turner D.D., J. Goldsmith, 1999: Twenty-four-hour Raman lidar water vapor measurements
during the Atmospheric radiation Measurement program’s 1996 and 1997 water vapor inten-
sive observation periods, J. Atmos. Ocean. Tech. 16 (8): 1062-1076.
[ 1 OITurner D. D., Ferrare RA, Brasseur LAH, Feltz WF, 2002: Automated retrievals of water vapor
and aerosol profiles from an operational Raman lidar, J. Atmos. Ocean. Tech. 19 (1): 37-50.
[11]Tumer DD, Lesht BM, Clough SA, Liljegren JC, Revercomb HE, Tobin DC, 2003: Dry bias
and variability in Vaisala RS80-H radiosondes: The ARM experience, J. Atmos. Ocean. Tech.
20 (1): 117-132.
[12]Tumer, D. D., K.L. Gaustad, S.A. Clough, E.J. Mlawer, 2004: Improved PWV and LWP Re-
trievals from the Microwave Radiometer for ARM, Fourteenth ARM Science Team Meeting
Proceedings, Albuquerque, New Mexico, March 22-26,2004.
[ 1 3]Turner, D. D., T. R. Shippert, D. C. Tobin, R. 0. Knuteson, and H. E. Revercomb,S. A. Clough,
P. D. Brown, E. J. Mlawer, M. W. Shephard, R. G. Ellingson, W. L. Smith, 2004: The QME
AERI LBLRTM: A Closure Experiment for Downwelling High Spectral Resolution Infrared
45
Radiance, J. Atmos. Sci., Vol. 61, No. 22, pp. 2657-2675.
[14]Vomel, H., S.J. Oltmans, D.J. Hofinann, T. Deshler, and J.M. Rosen, 1995: The evolution of
the dehydration in the Antarctic stratospheric vortex, J. Geophys. Res., 100, 13919-1 3926.
[15]Vomel H, Fujiwara M, Shiotani M, Hasebe F, Oltmans SJ, Barnes JE, The behavior of the
Snow White chilled-mirror hygrometer in extremely dry conditions, JOURNAL OF ATMOSPHERIC
AND OCEANIC TECHNOLOGY 20 (1 1): 1560-1567 NOV 2003
[16]Wang JH, Carlson DJ, Parsons DB, Hock TF, Lauritsen D, Cole HL, Beierle K, Chamberlain
E, Performance of operational radiosonde humidity sensors in direct comparison with a chilled
mirror dew-point hygrometer and its climate implication, GEOPHYSICAL RESEARCH LET-
TERS 30 (16): Art. No. 1860 AUG 27 2003
[ 17lWare RH, Fulker DW, Stein SA, Anderson DN, Avery SK, Clark RD, Droegemeier KK, Kuet-
tner P, Minster JB, Sorooshian S, 2000: SuomiNet: A real-time national GPS network for
atmospheric research and education", Bull. h e r . Meteor. SOC. 81 (4): 677-694.
[ 1 8]Whteman, David N., 2003: Examination of the traditional Raman lidar technique. I. Evaluat-
ing the temperature-dependent lidar equations, Applied Optics, 42, No. 15,2571-2592.
[19]Whiteman, David N., 2003: Examination of the traditional Raman lidar technique. 11. Evalu-
46
ating the ratios for water vapor and aerosols, Applied Optics, 42, No. 15,2593-2608.
[20]Whlteman, D. N., B. Demoz, P. Di Girolamo, J. Comer, I. Veselovskii, K. Evans, Z. Wang,
M. Cadirola, K. Rush, D. Sabatino, G. Schwemmer, B. Gentry, S. H. Melfi, B. Mielke, D.
Venable, T. Van Hove, E. Browell, R. Ferrare, S. Ismail, J. Wang, 2005: Raman Water Vapor
Lidar Measurements During the International H 2 0 Project. I. Instrumentation and Analysis
Techniques, accepted by J. Ocean. Atmos. Tech.
[21]Whiteman, D. N., B. Demoz, P. Di Girolamo, J. Comer, I. Veselovskii, K. Evans, Z. Wang,
M. Cadirola, K. Rush, D. Sabatino, G. Schwemmer, B. Gentry, S. H. Melfi, B. Mielke, D.
Venable, T. Van Hove, E. Browell, R. Ferrare, S. Ismail, J. Wang, 2005: Raman Water Vapor
Lidar Measixements During the International H20 Project. 11. Case Studies, accepted by J.
Ocean. Atmos. Tech.
47
11 Appendix: Efforts to address the spatiotemporal mismatch be- tween lidar and radiosonde data
A fundamental difference in the water vapor measurement techniques of Raman lidar and ra-
diosonde is that the lidar measures along a straight line and radiosondes drift with the wind.
Furthermore, mixing ratio measurements by Raman lidar require varying amounts of averaging
time to provide similar signal to noise characteristics as a function of altitude. For example, under
nighttime conditions such as those studied during the AWEX field campaign, figure 10 shows a
typical example of the number of one-minute profiles that must be summed together to achieve no
more than 10% random error as a function of altitude. By contrast, the radiosonde makes all of
its measurements nearly instantaneously but requires approximately 30 minutes to ascend to the
upper troposphere. Due to the fundamental differences in water vapor measurement resolution of
Raman lidar and radiosonde, three techniques of averaging the Raman lidar data were explored in
the comparisons with radiosonde data.
The first technique of averaging the Raman lidar data consisted of using a straight sum of
a fixed number of profiles independent of altitude. This is the technique that has been used in
similar intercomparison studies such as AFWEX [3] and is referred to here as "Sum". The second
technique of averaging used a variable number of profiles in the summation as a function of altitude
so as to maintain the random error at each altitude below some threshold value, here set to be 10%.
This technique has been described recently [21] and is referred to as "Var". The third technique
48
attempted to compensate for the fact that the radiosonde drifts with the wind. The height of the
radiosonde as a function of time was used to shift, as a function of altitude, the timelheight series
of lidar mixing ratio. This shifting was done so that the data used at a certain altitude was that
which was measured by the lidar at the time corresponding to when the radiosonde passed through
that same altitude. This technique of attempting to track the sonde is referred to as "Track". It
essentially assumes a homogeneous atmosphere uniformly translating horizontally as a function of
altitude over the averaging period. Any change in wind speed or direction at a given altitude is not
accounted for in this scheme. After performing this translation of the lidar data, the same variable
averaging technique used in the "Var" method was then used. Figure 10 illustrates the use of these
different techniques in a comparison with a Vaisala RS90 radiosonde on the night of November 19
at the m d of the mission.
The left panel presents the comparison of the individual profiles, while the middle panel shows
the percentage difference of the three methods of processing the SRL data with respect to RS90.
On the right is shown the number of one-minute profiles used as a function of altitude for the
three lidar averaging techniques. There is good general agreement among all 4 profiles plotted.
However, on the left one can see that between the altitudes of 7-8 k m the straight summation
technique, which used a 29 minute average at all altitudes, diverges from the other measurements
by more than 50%. Both the variable sum and track-sonde techniques used between 3 and 7 profiles
in this altitude range implying that there was significant atmospheric variation during the period
49
sampled by the "Sum" technique that was not sampled using the other techniques. Between 1
and 2 km, both the simple-sum and track-sonde techniques diverge from the radiosonde and the
variable-sum results due presumably to atmospheric variation captured by those techniques that
was not sampled by the variable-sum technique. The comparisons detailed in Table 1 indicated
that, of the three techniques, the variable sum technique yielded a slope that is closest to unity,
an intercept that is closest to zero, shows the lowest mean variability, and also provides the best
overall agreement with the fully corrected RS9X. For these reasons the variable sum technique of
analyzing the SRL data was judged to be preferable based on the AWEX measurements.
50
12 Figure Captions
1. Ensemble comparisons of radiances observed by AIRS and calculations of radiances using
version 3 of the AIRS fast model, SARTA, to demonstrate the state of the AIRS fast model
validation effort as of February, 2003. Three sets of water vapor input data acquired in co-
ordination with Aqua overpasses are studied: 1) SRL water vapor measurements from fall
2002 at GSFC, 2) nighttime RS-90 radiosondes launched at the SGP site, 3) daytime RS-90
radiosondes launched at the SGP site.
2. Left: An analysis of the precipitable water measurements from the SuomiNet GPS and the
U.S. DOE microwave radiometer at the Southern Great Plains Climate Research Facility.
There is a mean offset of -2.4%, which is withm the absolute uncertainty of the MWK. The
best fit regression is shown with a dashed line. The solid line indicates perfect 1-1 correlation.
Right: The same data as plotted on the left except this time divided by time of day. The data
are grouped in bins of 1 hour each. The error bars indicate the standard deviation of the
comparison within each 1 hour interval. Sunrise and sunset were at approximately 12 and 24
UT. A small diurnal bias between GPS and MWR is observed.
3. Mean profile comparisons of SRL and the RS9X using the three methods of analyzing the
SRL profiles described in the text. Layer averages of l-km have been used and the error bars
indicate standard deviation within each l-km interval. On the right is shown the number of
51

comparisons at each altitude.
4. A comparison of the mean precipitable water measured by the various sensors during AWEX
and the reference CFH sensor. A comparison of the mean bias between the various sensors
and the reference CFH sensor during AWEX based on a regression analysis.
5 . A comparison of mean upper tropospheric measurements of SRL (using the three different
methods of averaging the SRL data described in the text) and RS-9X after fully correcting
both sensors. Three methods of quantifying percentage difference are displayed and ex-
plained in the text. In general, agreement between SRL and RS9X is better than 5% using
any of the techniques. The error bars represent the standard deviation, while the shaded region
represents twice the standard error.
6. The percentage difference between SRL water vapor mixing ratio and RS9X as a function of
mixing ratio amount and altitude. This comparison isolates the two variables that influence
the magnitude of the random uncertainty in the Raman lidar water vapor measurements during
AWEX-G.
7. An Obs-Calc comparison of the original SRL water vapor profiles from September - Novem-
ber 2002 and those released in late 2004 after applying the corrections described here. Both
comparisons use the january 2004 version of the A I R S fast model. The calculations based on
the updated Sl2L profiles agree in the mean with the AIRS observations within f0.5K.
8. Left: Comparison of water vapor profiles from SRL and Aqua retrieval. There is a persistent
52
moist bias to the retrievals in the mid-troposphere. Right: Comparison of precipitable water
from a SuomiNet GPS and Aqua retrievals showing a similar wet bias to the retrievals
9. An illustration of the three profile averaging schemes that were investigated for the processing
of the Raman lidar water vapor mixing ratio data. "Sum1' refers to using the same temporal
averaging as a function of altitude, in this case 29 minutes. "Var" refers to using a variable
temporal average as a function of altitude in order to maintain the random error below a
fixed value here chosen to be 10%. An upper limit of 29 profiles is also selected in this
case. "Track" refers to a technique that attempts to address the fact that the radiosonde move
downwind with altitude whereas the lidar can measure purely vertically. A variable temporal
smoothing is also employed in this technique.
53
~~
SRL vs RS9X Regression Statistics PercDiff
Table 3: Full profile regression comparison of SRL water vapor mixing ratio profiles and RS9X during AWEX. The columns, in order are, the number of profiles compared, the number of ordered pairs of points used in the regressions, the slope and intercept of the best fit line. The correlation coefficient of the regression and the mean difference between the best fit line and the SRL data. The last column gives mean percentage difference, defined as 100* Mean[(SRL-RS9X)/CFH]. The standard deviation and, in parentheses, the standard error of the mean percentage differences are also given
SRL. (Sum)
SRL (Var)
SRL (Track)
I
13 160 1.01 -0.013 0.998 0.004 1.3&23.9(6.6)
13 160 1.01 -0.007 0.998 0.009 1.7&1 4.8(4.1)
12 155 1.01 0.014 0.998 0.004 2 . 4 1 15.2(4.4)
UT( 7kni-trop)vsCFH
Sensor
RS-92
RS80-H
Table 2: Upper troposphere bias comparison of various sensors and CFH during AWEX based on three analysis methods. The slope, intercept, number of ordered pairs and correlation coefficient are given. Also provided are the mean difference (Mean[X-CFH]) between the individual sensors and CFH in units of g/kg, the percentage difference calculated two ways, the standard deviation, and in parentheses, the standard error of the mean difference.
Regression Statistics
PW.-PWc MR S , -MR Ci M R S , - M R CL - N p r o f s N p t s m b ( g W R2 a(S/k7) ;‘wc M R C, M R-Ci
2370 0.988 -0.0002 0.997 -0.0024 -1.73k4.86(1.7) -1.31&8.96(3.2) -0.71 &19.5(6.9)
2940 0.976 -0.0040 0.994 0,0080 -5.92&6.71(2.2) -4.86&13.6(4.5) -2.95&27.6(9.2)
8
9
13 Tables
SnowWhite
54
\ 2346 I 0.978 1 00055 1 0.994 1 0.0012 1 1.71&6.93(2.6) I 0.60&9.99(3.8) I 8.48&37.9(14.3) 1 7
Table 3: Upper troposphere bias comparison of the three methods of analyzing SRL data and RS-9X during AWEX. See Table 1 for the definitions of the quantities.
14 Figures
5 5

Obs-Calc (Feb, 2003). SRL (solid), RSSON (dash). RSSOD (dot-dash) 3 I
I
1300 1350 1400 I 450 ,I 500 1550 1 EO0 Wavenumber icin-’)
Figure 1 : Ensemble comparisons of radiances observed by AIRS and calculations of radiances us- ing version 3 of the A I R S fast model, SARTA, to demonstrate the state of the AIRS fast model validation effort as of February, 2003. Three sets of water vapor input data acquired in coordina- tion with Aqua overpasses are studied: 1) SRL water vapor measurements fi-om fall 2002 at GSFC, 2) nighttime RS-90 radiosondes launched at the SGP site, 3) daytime RS-90 radiosondes launched at the SGP site.
56
y = 0 465 + 0 999 x
# = 1187
1 .a
1 1
1 0 5
0 m K
._ I
1 2 z v) a 0
0.95
0 9
I I '
0 10 20 30 40 0 5 10 15 :0 MWR PW (mml Time I UT)
Figure 2: Left: An analysis of the precipitable water measurements from the SuomiNet GPS and the U.S. DOE microwave radiometer at the Southern Great Plains Climate Research Facility. There is a mean offset of -2.4%, which is within the absolute uncertainty of the MWR. The best fit regression is shown with a dashed line. The solid line indicates perfect 1-1 correlation. Right: The same data as plotted on the left except this time divided by time of day. The data are grouped in bins of 1 hour each. The error bars indicate the standard deviation of the comparison within each 1 hour interval, Sunrise and sunset were at approximately 12 and 24 UT. A small diurnal bias between GPS and MWR is observed.
57
12
10 --c Sum
4
2
Figure 3: Mean profile comparisons of SRL and the RSBX using the three methods of analyzing the SRL profiles described in the text. Layer averages of l-km have been used and the error bars indicate standard deviation within each l-km interval. On the right is shown the number of comparisons at each altitude.
58
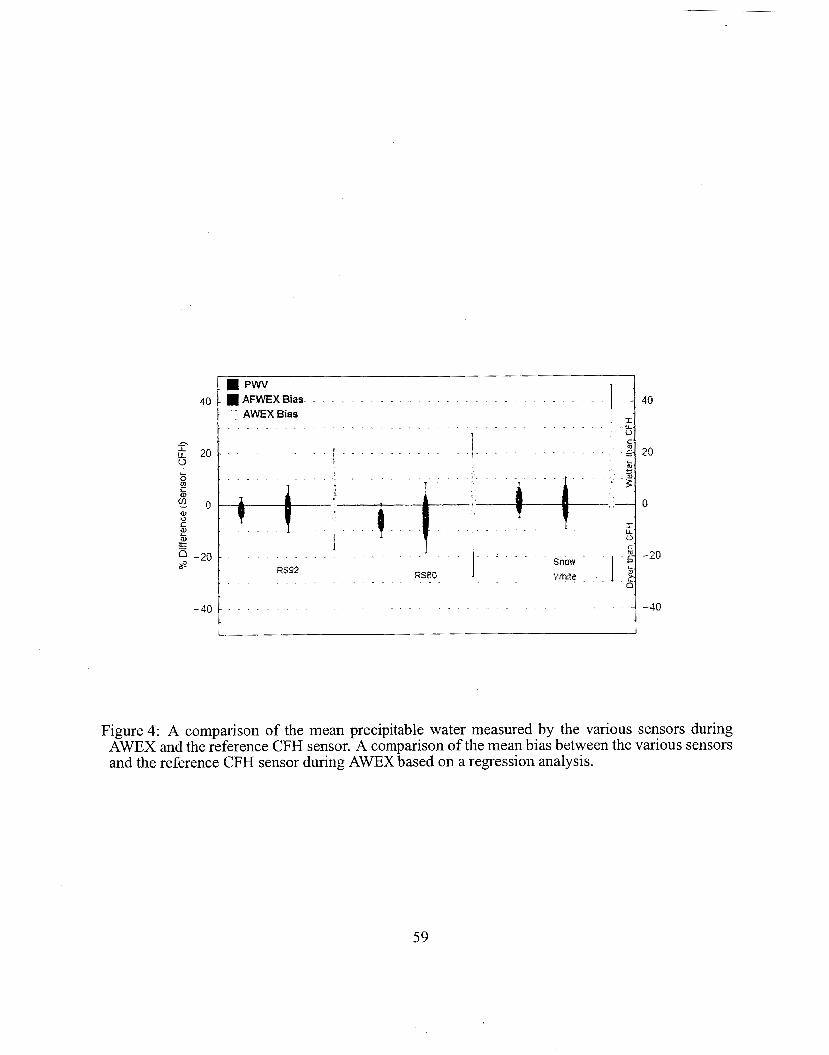
Figure 4: A comparison of the mean precipitable water measured by the various sensors during AWEX and the reference CFH sensor. A comparison of the mean bias between the various sensors and the reference CFH sensor during AWEX based on a regression analysis.
59
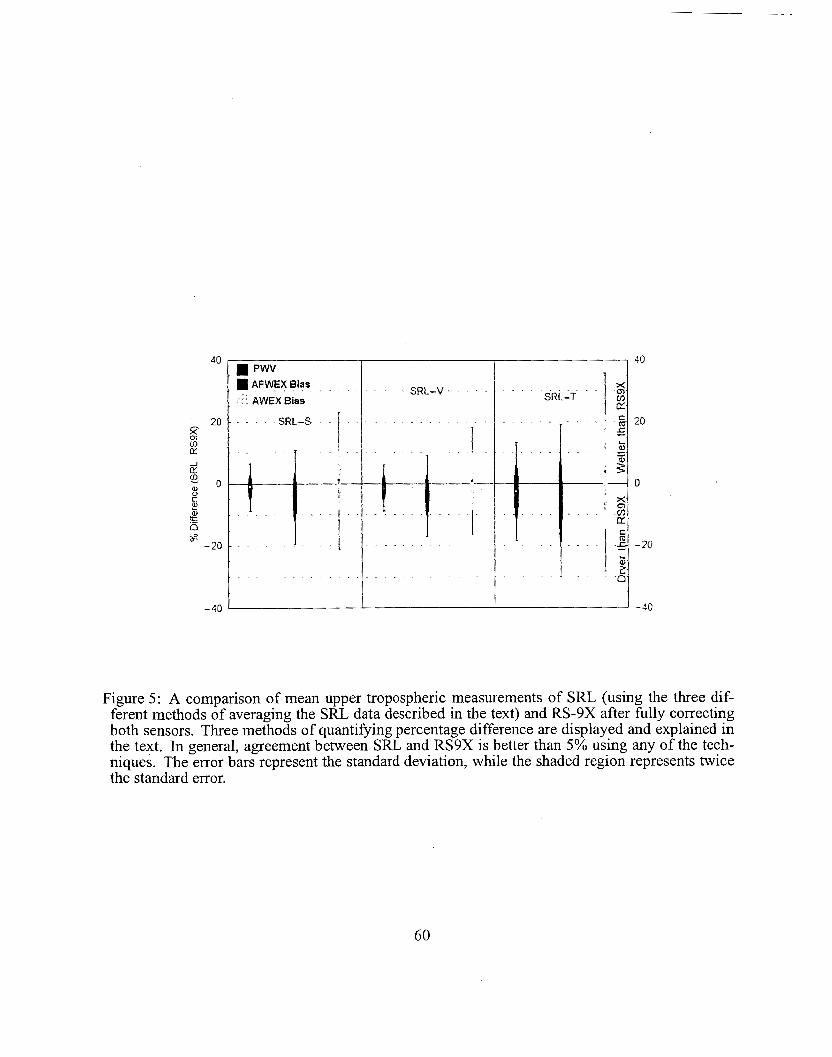
Figure 5 : A comparison of mean upper tropospheric measurements of SRL (using the three dif- ferent methods of averaging the SRL data described in the text) and RS-9X after fully correcting both sensors. Three methods of quantifying percentage difference are displayed and explained in the text. In general, agreement between SRL and RS9X is better than 5% using any of the tech- niaues. The error bars represent the standard deviation, while the shaded region represents twice th i standard error.
60
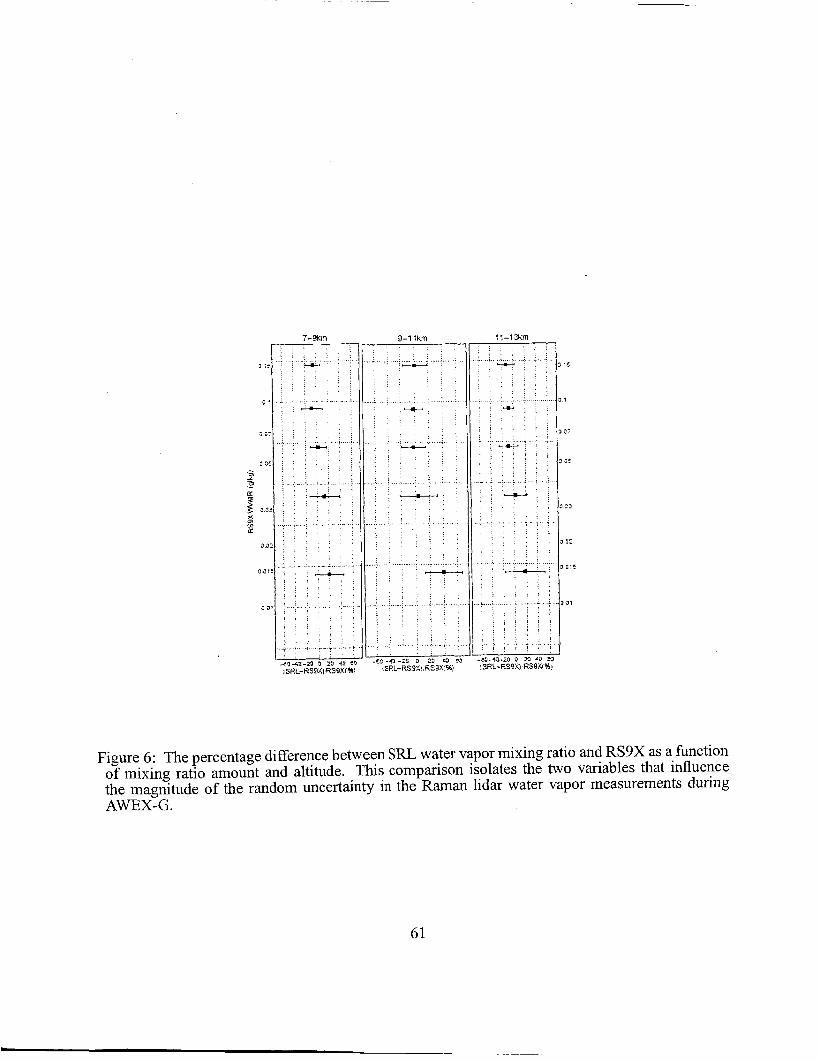
- ...
..
. ,.
..
....
. ".
I ; .-?, I
-13 I SI
. . . .........................
. . . . . . . .
. . . . . ......................... - .
. . . . . . . . . . . .
. . . . . , . . . . . . * . . . . ....... , ..................
. . .- . . . . . . . . . . . . . . . . . . . .
. . . . . . . . . . . . . . . . . . . . . . . . . . . . . . . . . . .
. . . . . . . . . . .
. . . . . . . I . . . . . . . . . ................ .- ...........
. . . . . . . . . . . . . ,
~ , . , . . . . _ . . . . . . ................................... . . . . . . . . . I . . . . . . .
. . . . . . . . . . . . I
! ! : , ,.:. . . . . . / . . . . ! ' . . - ~ 3 - m - a P LO &a w
tSRL-RS3X?RZJXi%)
i i : i . j . . . . .
. . , . . . . . . . . . . . . . . . . _. ......... ~. : . . .I . . . . . . . . . . .
; . - :
. . . : . :
. . : . . : . , I : :
. . . . . . . . . - . . . . . . . . . . . . .
. . . . . . . : > I ; . . . . . . . . :
. . . . . I . . _ ....... - ....... / ..
: , : : ; . . , . . . . . . . .
: 3 =
3 3 3
3 3 1 5
Figure 6: The percentage difference between SRI, water vapor mixing ratio and RS9X as a function of mixing ratio amount and altitude. This comparison isolates the two variables that influence the magnitude of the random uncertainty in the Raman lidar water vapor measurements during AWEX-G.
. . . . . . . . . . . . . . . : ; , I , ! . . . : , : . : .
, . . : . , : . . , , . . I . > . . . . . ' . . . . . . . . . . .
! ! ! t ! >, I
61
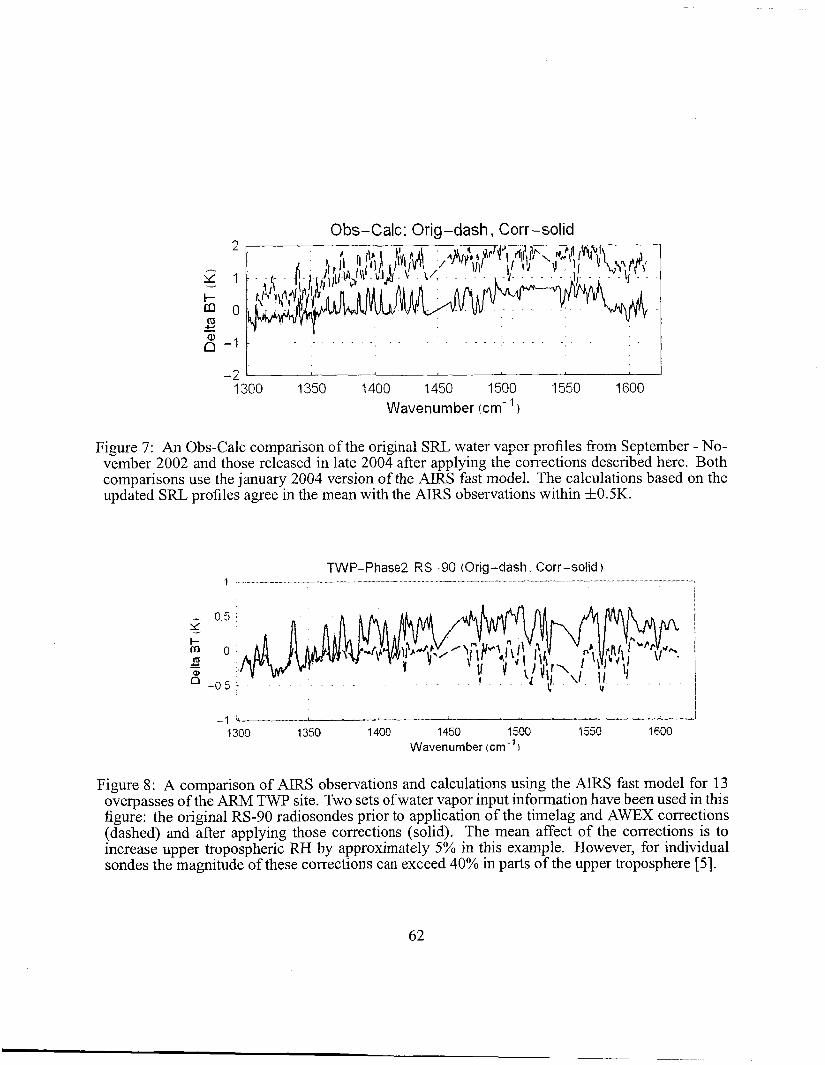
Obs-Calc: Orig-dash, Corr-solid
6 -1 -
Figure 7: An Obs-Calc comparhon of the original SRL water vapor profiles from September - No- vember 2002 and those released in late 2004 after applying the corrections described here. Both comparisons use the January 2004 version of the AIRS fast model. The calculations based on the updated SRL profiles agree in the mean with the AIRS observations within 4~0.5K.
TWP-Phase2 RS-90 (Orig-dash Corr-solid 1 -I _ _ _ ~ I ____ _ _ _ - I _ I I - - 1
I
-_---- A -I 4
1300 1350 1400 1450 1500 1550 1600 Wavenumber icrn-'\
Figure 8: A comparison of AIRS observations and calculations using the AIRS fast model for 13 overpasses of the ARM TWP site. Two sets of water vapor input information have been used in this figure: the original RS-90 radiosondes prior to application of the timelag and AWEX corrections (dashed) and after applying those corrections (solid). The mean affect of the corrections is to increase upper tropospheric RH by approximately 5% in this example. However, for individual sondes the magnitude of these corrections can exceed 40% in parts of the upper troposphere [ 5 ] .
62

12
10
8 E Y,
$ 6 3 I Y ._
2
All
Clear
Cirrus
0.5 1 1.5 2 2.5 Aqua SRL
0
35
30
25 - E 5 20 3 a W 15 LT 3
10
5
0
# = 2 1 :
0 5 10 15 20 25 30 35 GPS PW (mm)
Figure 9: Left: Comparison of water vapor profiles from SRL and Aqua retrieval. There is a persis- tent moist bias to the retrievals in the mid-troposphere. Right: Comparison of precipitable water from a SuomiNet GPS and Aqua retrievals showing a similar wet bias to the retrievals.
63
12
10
a I
E Y,
2 6 3 c c
T 4
2
0.001 0 0 1 0.1 1 Mixing Ratio cy ky)
. . . . . .
-100 -50 0 50 100 100.1 (SRL-RSSO), RS90
12
10
8 - E 1,
2 6 3 c c - Q
4
2 Track - ._ . -
5 10 15 20 25 30 Nutnher Of Profiles
Figure 10: An illustration of the three profile averaging schemes that were investigated for the processing of the Raman lidar water vapor mixing ratio data. 'Y3urn" refers to using the same temporal averaging as a function of altitude, in this case 29 minutes. "Var" refers to using a vari- able temporal average as a function of altitude in order to maintain the random error below a fixed value here chosen to be 10%. An upper limit of 29 profiles is also selected in this case. "Track" refers to a technique that attempts to address the fact that the radiosonde move downwind with altitude whereas the lidar can measure purely vertically. A variable temporal smoothing is also employed in this technique.
64
Analysis of Raman lidar and radiosonde measurements from fhe AWEX-G field campaign and its relation to Aqua validation -
Popular Summary
Downward looking infrared satellite sensors such as the Atmospheric Infrared Sounder (AIRS) on the AQUA satellite, record light emitted from the earth and atmosphere at high spectral resolution. These measurements can be used to infer the atmospheric concentrations of numerous trace gasses including water vapor. In order to validate the measurements of AIRS, numerous profile measurements of water vapor and other quantities have been made. However, early in the AQUA validation effort it was learned that profiling technologies possessed measurement errors that made the AIRS validation effort difficult. The AIRS Water Vapor Experiment - Ground (AWEX-G) was held in October - November, 2003 in order to study the technologies in use in AQUA validation and improve the accuracy of these measurements for validation purposes. This paper describes those activities and the results that Raman lidar and Vaisala RS90/92 radiosondes are found to agree in their water vapor measurements to within 5% of the reference sensor, which is calculated to absolute accuracy of approximately 5%.