ANALYSIS OF PSYCHOLOGYCAL FACTORS INFLUENCING THE …
97
ANALYSIS OF PSYCHOLOGYCAL FACTORS INFLUENCING THE CONSUMER PURCHASE DECISION OF INDOFOOD INSTANT NOODLES IN CIKARANG, INDONESIA By Nguyen Tran Quang Anh ID No. 014201100241 A skripsi presented to the Faculty of Business President University in partial fulfillment of the requirements for Bachelor Degree in Economics Major in Management March 2015
Transcript of ANALYSIS OF PSYCHOLOGYCAL FACTORS INFLUENCING THE …

ANALYSIS OF PSYCHOLOGYCAL FACTORS
INFLUENCING THE CONSUMER PURCHASE DECISION
OF INDOFOOD INSTANT NOODLES
IN CIKARANG, INDONESIA
By
Nguyen Tran Quang Anh
ID No. 014201100241
A skripsi presented to the
Faculty of Business President University
in partial fulfillment of the requirements for
Bachelor Degree in Economics Major in Management
March 2015

i
PANEL OF EXAMINERS
APPROVAL SHEET
The Panel of Examiner declares that the Skripsi entitled “ANALYSIS OF
PSYCHOLOGYCAL FACTORS INFLUENCING THE CONSUMER
PURCHASE DECISION OF INDOFOOD INSTANT NOODLES IN
CIKARANG, INDONESIA” that was submitted by Nguyen Tran Quang
Anh majoring in Management from the Faculty of Business was assessed
and approved to have passed the Oral Examinations on 16th March, 2015.
Liswandi, MBA
Chair – Panel of Examiners
Filda Rahmiah, BBA., MBA.
Examiner I
Yunita Ismail, M.SI.
Examiner II

ii
SKRIPSI ADVISER
RECOMMENDATION LETTER
This Skipsi entitled “ANALYSIS OF PSYCHOLOGYCAL FACTORS
INFLUENCING THE CONSUMER PURCHASE DECISION OF INDOFOOD
INSTANT NOODLES IN CIKARANG, INDONESIA” prepared and
submitted by Nguyen Tran Quang Anh in partial fulfillment of the
requirements for the degree of Bachelor in the Faculty of Business has
been reviewed and found to have satisfied the requirements for a Skripsi
fit to be examined. I therefore recommend this Skripsi for Oral Defense.
Cikarang, Indonesia, March 2015
Acknowledged by, Recommended by,
Vinsensius Jajat K., SE. MM. MBA Ir. Yunita Ismail Masjud, M.SI
Head of Management Study Program Skripsi Advisor

iii
DECLARETION OF
ORIGINALITY
I declare that this Skripsi, entitled “ANALYSIS OF PSYCHOLOGYCAL
FACTORS INFLUENCING THE CONSUMER PURCHASE DECISION OF
INDOFOOD INSTANT NOODLES IN CIKARANG, INDONESIA”is, to the
best of my knowledge and beliefs, an original piece of work that has not
been submitted, either in a whole or in a part, to another university to
obtain a degree.
Cikarang, Indonesia,March,2015
Nguyen Tran Quang Anh

iv
ABSTRACT
The purpose of this study is to explore the adoption and investigates the impact of
psychological on consumer purchasing decision making within the Indofood‟s
consumer. A theoretical model developed based on the Framework of Purchase
Decision making through four factors – Motivation, Perception, Learning, and Belief
& Attitude. In this research, the author used primary data and secondary data.
Questionnaires were distributed to 100 customers, located Giant supermarket and
Citywalk area in Cikarang, Indonesia. This research use quantitative method analysis.
The research method used in this research is multiple regression models. The total of
sample is 100 respondents which is 47% is male and 53% is female. The independent
variables of psychological factors are motivation, perception, learning, belief and
attitude. The result of the research is that there are 76.9% influence of psychological
factors towards consumer purchase decision. The independent variable with the most
significant influence towards consumer purchase decision.The conclusion of the
research is that psychological factors simultaneously has influence towards consumer
purchase decision. But partially, only three independent variables of psychological
factors were significant towards consumer purchase decision, which are motivation,
perception, belief and attitude.
Keywords: Psychological, Motivation, Perception, Learning, Belief and Attitude,
Consumer Purchasing Decision.

v
ACKNOWLEDGEMENT
Research would like to express their earnest and sincerest gratitude and appreciation
to the noteworthy people who had greatly contributed to the success of this study.
To Mrs. Yunita, my thesis advisor who help me to finish this thesis, guidance and
patience, thank you very much Mrs. Yunita.
My thanks to President University include all the lectures, staffs who always
supported me throughout the thesis process. This thesis would not have been existed
without much helps from them.
I would like to send my immense gratefulness towards my family, my close friends
in Vietnam who always stood beside me days and nights, no matter what happened, I
always received motivation and support from them.
Last but not least, they were my colleagues, Vietnamese friends in President
University who were sources of believes, motivation, helps, especially my friends for
what we have been through.
Finally, for those whom have contributed yet could not be mentioned, you know who
you are. No word could truly express my gratitude. Thank you very much.

vi
TABLE OF CONTENTS
PANEL OF EXAMINERS ............................................................................................ i
APPROVAL SHEET ..................................................................................................... i
SKRIPSI ADVISER ...................................................................................................... i
RECOMMENDATION LETTER ................................................................................ ii
DECLARETION OF ................................................................................................... iii
ORIGINALITY ............................................................................................................ iii
ABSTRACT ................................................................................................................. iv
ACKNOWLEDGEMENT ............................................................................................ v
TABLE OF CONTENTS ............................................................................................. vi
LIST OF TABLES ....................................................................................................... ix
LIST OF FIGURES ...................................................................................................... x
CHAPTER I - INTRODUCTION ................................................................................1
1.1. Background of the Study ................................................................................1
1.2. Problem Identification ....................................................................................4
1.3. Statement of the Problem ...............................................................................4
1.4. Research Objective .........................................................................................5
1.5. Definition of Terms ........................................................................................5
1.6. Research Limitation .......................................................................................6
1.7. Research Benefit ............................................................................................7
a) For Indofood Company ..................................................................................7
b) For Researcher ................................................................................................7
c) For Further Research ......................................................................................7
CHAPTER II - LITERATURE REVIEW ....................................................................8
2.1. Theoretical Review ........................................................................................8
2.1.1.Consumer Purchase Decision .......................................................................8

vii
2.1.2. Characteristic Affecting Consumer Purchase Decision .............................11
2.1.3. Psychological Factors ................................................................................11
2.2. Previous Research ..........................................................................................18
2.3. Theoretical Framework ....................................................................................20
2.4. Operational Definition ....................................................................................21
2.5. Hypothesis ....................................................................................................22
CHAPTER III - RESEARCH METHODOLOGY .....................................................23
3.1. Research Design ...........................................................................................23
3.1.1. Research Method ......................................................................................23
3.1.2.Research Framework ..................................................................................23
3.2. Sampling Design ..........................................................................................26
3.2.1.Population ...................................................................................................26
3.2.2.Sampling Technique Applied .....................................................................26
3.2.3. Sample Size ...............................................................................................27
3.3. Research Instrument .....................................................................................28
3.3.1.Design of Questionnaire .............................................................................29
3.3.2.Measurement of Variables ..........................................................................31
3.4. Validity and Reliability ................................................................................32
3.4.1.Validity Testing ..........................................................................................32
3.4.2.Reliability Testing ......................................................................................33
3.5. Data Collection Procedure............................................................................34
3.5.1.Primary Data ............................................................................................ 344
3.5.2.Second Data ............................................................................................. 355
3.6. Hypothesis Testing .......................................................................................36
3.6.1.Multiple Regression Analysis .................................................................. 366
3.6.2.Classical Assumption .............................................................................. 377
3.6.3.Testing the Hypothesis ...............................................................................39
CHAPTER IV - ANALYSIS AND INTERPRETATION ...................................... 433

viii
4.1. Company Profile ....................................................................................... 433
4.1.1.PT Indofood Sukses Makmur .................................................................. 433
4.1.2 Vision and Mission .................................................................................. 444
4.1.3 Product Information ................................................................................. 444
4.2. Data analysis ............................................................................................. 466
4.2.1. Variable Frequency ................................................................................. 466
4.2.2. Demographic Profile ..................................................................................49
4.2.3. Descriptive Analysis ............................................................................... 533
4.2.4. Classic Assumption Test......................................................................... 533
4.2.5. Hypothesis test ...........................................................................................57
4.3. Interpretation of Result .................................................................................. 611
CHAPTER V - CONCLUSION AND RECOMMENDATION ............................. 644
5.1. Conclusion ................................................................................................. 644
5.2. Recommendation ....................................................................................... 655
REFERENCES ...........................................................................................................67
APPENDIX A: QUESTIONAIRES ........................................................................ 711
APPENDIX B: DATA ............................................................................................. 715

ix
LIST OF TABLES
Table 2.1. Previous Researches .................................................................................................. 18
Table 2.2. Variable and Definition ............................................................................................ 20
Table 3.1. Pre-Questioner ............................................................................................................ 30
Table 3.2. Likert Scale ................................................................................................................. 32
Table 3.3. Cronbach's Alpha Cofficient .................................................................................. 34
Table 4.1. Kind of Indofood Products ...................................................................................... 45
Table 4.2. Reliability test ............................................................................................................. 46
Table 4.3. Validity Test ................................................................................................................ 47
Table 4.4. Descriptive statistics ................................................................................................. 53
Table 4.5. Coefficient Determinant (R2) ................................................................................. 58
Table 4.6. F-test .............................................................................................................................. 59
Table 4.7. T-test .............................................................................................................................. 60

x
LIST OF FIGURES
Figure 1.1. Market share of Indofood product in Indonesia 2009 - 2012. .................... 2
Figure 1.2. World‟s biggest noodle markets. ................................................................ 3
Figure 2.1. Consumer Purchase Decision Process ........................................................ 8
Figure 2.2. Characteristics affecting Consumer Purchase Decision ........................... 11
Figure 2.3. Maslow's hierarchy of needs .................................................................... 12
Figure 2.4. The Learning Process ............................................................................... 15
Figure 2.5. Attitude Components and Manifestations ................................................ 16
Figure 2.6. Theoretical framework ............................................................................. 20
Figure 3.1. Research Framework ................................................................................ 25
Figure 3.2. Data Collection Method ........................................................................... 29
Figure 4.1. Gender of Respondents ............................................................................. 49
Figure 4.2. Age of Respondents .................................................................................. 50
Figure 4.3. Monthly income/ Allowance Levels ........................................................ 51
Figure 4.4. Frequency of Purchase instant noodle products during a month .............. 52
Figure 4.5. Histogram Chart ....................................................................................... 54
Figure 4.6. P-P Normality Plot ................................................................................... 55
Figure 4.7. VIF Result ................................................................................................ 56
Figure 4.8.Heteroscedascity Test ................................................................................ 57

1
CHAPTER I
INTRODUCTION
1.1. Background of the Study
Increasingly busy lifestyles, especially in urban areas, cause consumers having
limited time to prepare their foods. Those consumers view instant noodles as
alternative meal solution, due to their simple preparation. The affordable price also
drives popularity among low-income groups, which are highly price sensitive.
Among the low-income groups in rural areas, instant noodles are commonly known
as a substitute for rice, especially during poor harvests. Other than rice substitution,
some consumers also view instant noodles as side dishes, a complement to rice.
Being a very common food in Indonesia, especially among low- and lower-middle
income groups, these rising trends contributed to the dynamic growth of instant
noodles, which dominate the food category in terms of value sales.
Instant noodle industry is a very promising business opportunities in the current
global era. With the increase in economic growth will ultimately improve society
aggregate consumption level, in this sector of the instant noodle industry the most
benefit. In a report published in mid-2012, McKinsey estimates that Indonesia would
become the 7th largest economy in the world in 2030, up from his current position at
No. 16, partly driven by domestic consumption continues to increase as rising
income per capita, and rapid urbanization.
Instant noodles were first introduced into the Indonesian market in 1969. Indofood is
one of Indonesia's largest pre-packaged food companies, and was founded in 1982 by
Sudono Salim, a Chinese Indonesian tycoon that also owned Bogasari flour mills.
Indomie instant noodle brand was first launched in 1982 with Indomie Kuah Rasa
Kaldu Ayam (Chicken stock) flavour, followed by Indomie Kuah Rasa Kari Ayam
(Chicken curry) flavour. In 1983 Indomie launched its first dry (served without soup)

2
Indomie Mie Goreng variant, which quickly become popular in Indonesian market.
Indomie has become a household name for instant noodle in Indonesia, and
accounted for around 70 percent of instant noodle market shares in Indonesia
Indofood was quite successful in its early years, capitalizing most of the market
share. This is primarily due to mass promotion and advertising. The instant noodles
are very cheap and suitable to the taste of Indonesian people. usually when
Indonesian travel abroad and find that foods abroad are not suitable for them, they'll
carry Indomie to accompany their meal. When natural disaster strikes, Indonesian
often donate like foods like Indomie instant noodles for the victims, of course along
with other necessary items.
Indofood CBP (Consumer Branded Product) is established as a separate entity in
September 2009 and it did initial public offering in Jakarta Stock Exchange in 2010.
The company is a part of group of Indofood which have various business segments in
food, beverage and palm oil from downstream to upstream. This entity operates in
packaged food and packaged beverage for all age.
Figure 1.1 Market share of Indofood product in Indonesia 2009 - 2012
(Source: Indofood Indonesia Website, 2012)
X: percentage
Y: year

3
Figure 2.2 World’s biggest noodle markets
(Source: World Instant Noodles Association, 2012)
Base on the figure 1.1, the products of ICBP have five segments: noodles, Dairy,
Food Seasoning, Snack Food and nutrition and special food. In 2012, the biggest
segment in contribution of revenue of each is 69 % for noodles compare with 18 %
for dairy and 6.9% for Snack Food.
For instant noodle, compared to Thailand, Vietnam and Japan, Indonesia (figure 1.2)
has bigger market size and it is still growing. Since 1999 until to 2009, the instant
noodle increase 40 % larger, from US 2,221 million up in to US 3,191.4 million. In
project the market size will increase at USD 3,600 million in 2012 that means instant
noodle is still having good opportunity to grow.

4
1.2. Problem Identification
Economic prospect in the instant noodle sector in Indonesia is very promising for the
increasing competition, both from existing players and new players. Not only that,
increase in per capita income will increase society welfare and changing
consumption patterns and consumer spending. Consumer will be inclined to choose a
premium quality product at an affordable price. The competitors in the food and
beverage industry tried to seize the opportunity by compiling a number of strategy
establish business excellence to meet the challenges of an increasingly competitive
market. This situation occurs because of the behavior of consumer. Different
consumers have different characteristics that influence their buying behavior. Social
factors, personal factors, cultural factors and psychological factors are those
characteristics that could manipulate the buyer behavior in making final decision.
Particularly in this research, the researcher is going to explore the role of
psychological (including motivation, perception, learning, belief and attitude) in
order to know how they would influence to the consumer purchase decision of
Indofood instant noodle in Cikarang, Indonesia. Therefore, the researcher would like
to research about: “Analysis of psychological factors influencing the consumer
purchase decision of Indofood instant noodles in Cikarang, Indonesia”
1.3. Statement of the Problem
From the explanation above, researcher intend to solve problem as follows:
1. Is there any partial significant influence of motivation toward consumer
purchase decision of Indofood instant noodle in Cikarang, Indonesia?
2. Is there any partial significant influence ofperception toward consumer
purchase decision of Indofood instant noodle in Cikarang, Indonesia?
3. Is there any partial significant influence oflearning toward consumer purchase
decision of Indofood instant noodle in Cikarang, Indonesia?

5
4. Is there any partial significant influence of belief and attitude toward
consumer purchase decision of Indofood instant noodle in Cikarang,
Indonesia?
5. Is there any simultaneously significant influence ofmotivation, perception,
learning, and belief and attitude toward consumer purchase decision of
Indofood instant noodle in Cikarang, Indonesia?
1.4. Research Objective
The objectives of this research are:
1. To find out partial significant influence of motivation toward consumer
purchase decision.
2. To find out partial significant influence of perception toward consumer
purchase decision.
3. To find out partial significant influence oflearning toward consumer purchase
decision.
4. To find out partial significant influence of belief and attitude toward
consumer purchase decision.
5. To find out the simultaneously significant influence of motivation,
perception, learning, and belief and attitude toward consumer purchase
decision.
1.5. Definition of Terms
Attitude is a person„s consistently favorable or unfavorable evaluations, feelings,
and tendencies toward an object or idea (Kotler & Armstrong, 2012).
Belief is a descriptive thought that a person holds about something (Kotler &
Armstrong, 2012).

6
Consumer behavioris the buying behavior of final consumer (Kotler &
Armstrong, 2012).
Consumer purchase decision is the buyer„s decision about which brand to
purchase (Kotler & Armstrong, 2012).
Instant noodle isa mass of dried precooked noodles fused with oil, usually eaten
after being soaked in boiling water for 3 to 5 minutes
(http://www.yourdictionary.com)
Learning is changes in an individual„s behavior arising from experience (Kotler
& Armstrong, 2012).
Motivation is a need that is sufficiently pressing to direct the person to seek
satisfaction of the need (Kotler & Armstrong, 2012).
Perception is the process by which people select, organize, and interpret
information to form a meaningful picture of the world (Kotler & Armstrong, 2012)
Psychologicalis a person„s purchasing choices are influenced by four major
psychological factors; motivation, perception, learning, and beliefs and attitudes
(Kotler & Armstrong 2012)
1.6. Research Limitation
In order to keep this research on the right track and avoid the unrelated factors, the
scope of the research has to be limited on several areas. Firstly, the author only
focuses on customer of Indofood are from 16 years old and older that presented at
Giant supermarket and Citywalk area in Cikarang instead of any other instant noodle
brands and area. The questionnaire will be distributed from 7th - 15th January 2015
at Giant supermarket and Citywalk area.Secondly, the researcher only used
psychological factors as the independent variables, other factors which are not listed
in this research are not observed.

7
1.7. Research Benefit
a) For Indofood Company
Have a good understanding and knowledge about psychological variables that
influence to consumer purchase decision, which it can be used to determine the next
step in marketing their product.
b) For Researcher
This research allows the researcher to gain more understanding about the consumer
behavior theories as well as the consumer purchase decision theories
c) For Further Research
This study will serve as an additional guidance or references for other researcher and
give information about factors influencing the customer purchase decision of
Indofood instant noodle.

8
CHAPTER II
LITERATURE REVIEW
2.1. Theoretical Review
2.1.1. Consumer Purchase Decision
Consumer behavioris the buying behavior of final consumer (Kotler & Armstrong,
2012). Consumer behavior is an important consideration in fields such as economics
and marketing, since understanding how consumers make their decisions so can help
predict how consumers will react to different situations(Mohan, 2014).
Consumers are individuals and households that buy the firms product for personal
consumption (Kotler and Amstrong, 2012). The activities these consumers undertake
when obtaining, consuming, and disposing of products and a service is known as
consumer behavior. Consumer behavior involves studying how people buy, what
they buy, when they buy and why they buy(Walczuch and Lundgren, 2004). The
consumer Behaviorism model suggested that when a consumer wanted to make the
purchase decision, they will pass through the process through needs recognition,
information search, and evaluation of alternatives, purchase decision and post-
purchase behavior. At last, the consumer will choose a product or brand to consume
from various choices in the market.
Figure 2. 1 Consumer Purchase Decision Process
(Source: Kotler and Armstrong, 2012)

9
Kotler and Amstrong (2012) suggest that consumers pass through all five stages in
every purchase. But in more routine purchases, consumers often skip or reverse some
of these stages. A woman buying her regular brand of toothpaste would recognize the
need and go right to the purchase decision, skipping information search and
evaluation. However, the model in Figure 2.1 is recommended because it shows all
the considerations that arise when a consumer faces a new andcomplex purchase
situation.
According to Kotler and Armstrong (2012), the first stage of the buyer decision
process, in which the consumer recognizes a problem or need is the need recognition.
Need recognition is the result of a discrepancy between a desired state and an actual
state that is sufficient to arouse and activate the decision process (See, 2001). Based
on Hawkins, Best and Coney (2004), an actual state is the way an individual
perceives his or her feelings and situation to be at the present time. A desired state is
the way an individual wants to feel or be at the present time. On the other hand, the
need can be triggered by internal stimuli when one of the person„s normal needs
(hunger, thirst) raises to level high enough to become a drive. A need can also be
triggered by external stimuli (an advertisement or information about the product from
friends) (Kotler et.all, 2009).
The next stage is the information search. Kotler and Armstrong (2012) define the
information search stage as the stage of the buyer decision process in which the
consumer is aroused to search more information; the consumer may simply have
heightened attention or may go into active information research. Consumer can
obtain information from any several sources. These include personal sources (family,
friends, neighbors), commercial source (advertising, sales people, websites), public
sources (mass media, consumer-rating organization, internet searches), and
experiential source (handling, examining, using the product).
During and after the time that consumer gathers information about various alternative
solutions to a recognized problem; the consumers evaluate the alternatives and select

10
the course of action that seems most likely to solve the problem (Hawkins &
Mothersbaugh, 2010). That is evaluation of alternatives, the third step of consumer
decision-making process. According to Kotler and Armstrong (2012), alternative
evaluation is the stage in which the consumer uses information to evaluate alternative
brands in the choice set. The consumer arrives at attitudes toward different brands
through some evaluation procedure. How consumer goes about evaluating purchase
alternatives depends on the individualconsumer and the specific buying
situation(Nagarkoti, 2009).
The fourth step is the purchase decision. In this step, consumer has decided which
brand to purchase. Based on Kotler and Armstrong„s concept (2012), there are two
factors that could come between the purchase intention and the purchase decision.
The first factor is the attitudes of others. For example, when a person give advices to
his or her friend to buy a low-prices food product, then his or her friend would reduce
the chances to buy a more-expensive food product. The second factor is unexpected
situational factor(Sainy, 2014). The consumer may from a purchase intention based
on factors such as expected income, expected price, and expected product benefit.
However, unexpected events may change the purchase intention.
The last step of the consumer decision-making process is the post-purchase behavior.
According to Kotler and Armstrong (2012), post-purchase behavior is the stage of the
buyer decision process in which the consumers take further action after purchase,
based on their satisfaction or dissatisfaction. McDaniel et.al (2006) stated that when
people recognize inconsistency between their values or opinions and their behavior,
they tend to feel an inner tension called cognitive dissonance. There are many ways
to reduce the dissonance both for the consumers and the marketers. The consumers
can justify decision, seek for new information, avoid contradictory information, or
return product(Satriadi, 2010). The marketers can send post-purchase thank you or
letter, display product superiority in ads, or offer guarantees.

11
2.1.2. Characteristic Affecting Consumer Purchase Decision
According to Kotler and Amstrong (2012), consumer purchase decision is very much
influenced by cultural, social, personal, and psychological factors. Below all four
main factors will be presented shortly, but the main focus will be set on the
psychological elements because they include the most relevant discussion for this
research. The factors presented in the psychological and social part are: motivation,
perception, learning, beliefs and attitudes.
Figure 2. 2 Characteristics affecting Consumer Purchase Decision
(Source: Kotler and Armstrong, 2012)
2.1.3. Psychological Factors
2.1.3.1. Motivation
A motive is a need that is sufficiently pressing to direct the person to seek
satisfaction (Kotler & Armstrong, 2012). According to Perreault and McCarthy
(2005), Needs are the basic forces that motivate a person to do something. Some
needs are concerned with a person„s physical well-being; other with the individual„s
self-view and relationship with others. Needs are more basic than wants. Wants are
“needs” that are learned during a person„s life, and when need is not satisfied, it may

12
lead to drive. A drive is strong stimulus that encourages action to reduce a need.
Drives are internal; they are the reasons behind certain behavior patterns. In
marketing, a product purchase is the result of a drive to satisfy need.One popular
theory of needs is Maslow„s hierarchy of needs.
Figure 2. 3 Maslow's hierarchy of needs
(Source: Kotler and Armstrong, 2012)
According to McDaniel et.al (2006), Maslow„s hierarchy of needs is a method of
classify human needs and motivations into five categories in ascending order of
importance. The most basic human needs are physiological, that is the needs for
food, water, and shelter. These needs must be satisfied first because it is very
essentials. Safety needs include security and freedom from pain and discomfort.
After physiological and safety needs have been fulfilled, social needs, especially love

13
and sense of belonging, become the focus. Self-esteem needs include prestige, frame
and recognition of one„s accomplishment. The highest human needs are self-
actualization.
Motivation relationship to consumer purchase decision
With motivation being such a major influence on consumption pattern of the
consumer, there is a strong need to study it as part of marketing research. Qualitative
techniques of observation, focus groups and in-depth interview and analysis are used
to understand the latent motives of a consumer. The level of involvement (how
interested the consumer was about a product) determines the degree of motivation a
consumer had to buy that product. The source of stimulation and the particular
situation the consumer is in when he or she comes into contact with the product also
determine the level of involvement (Kotler & Armstrong, 2012).
The marketer has to understand how interested his consumer is and accordingly
formulate strategies and advertising. To conclude, the marketer who understands the
various needs that motivate a consumer make a decision in purchasing a product or
service and is able to design and showcase his products accordingly will be
successful.
2.1.3.2. Perception
According to Kotler and Armstrong (2012), Perception is the process by whichpeople
select, organize, and interpret information to form a meaningful picture of the world.
McDaniel et.al (2006), defined perception as the process by which people select,
organize, and interpret stimuli into a meaningful and coherent picture. In other
words, Perception determines what people see and feel. People can form different
perceptions of the same stimulus because of three perceptual processes:
Selective attention: our eyes and minds seek out and notice only information that
interests us.

14
Selective distortion: we screen out or modify ideas, messages, and information that
conflict with previously learned attitudes and beliefs.
Selective retention: we remember only what we want to remember.
Perception relationship to consumer purchase decision
Perception is the process through which a person forms an opinion about the various
stimuli he receives from his sensory organs. In marketing, perception is concerned
with understanding how the consumer views a product or service. The five senses of
a person help him in this process. The marketer uses various props to stimulate the
consumer, that is, through the use of colors, sound, touch, taste, or smell, to observe
the product(Jafaar, Lalp, and Mohamed, 2012).
Marketers make use of perception to formulate marketing strategies. The marketers
use a perceptual map, wherein they find out the attributes or the characteristics that
the consumer associates with the product and they create the product
accordingly(Kazmi, 2012). Thus, in order to have a purchase decision from
consumer, development of a brand or the logo of the product, packaging of the
product, etc., have to be made keeping the consumer's perception in mind.
2.1.3.3. Learning
Learning is a process that creative changes in behavior, immediate or expected,
through experience and practice, McDaniel et.al (2006). According to Kotler and
Armstrong (2012), learning is a change in a person„s thought processes caused by
prior experience. Learning also determines what response is likely. In figure below,
we can see the learning process based on Kotler and Armstrong (2012).

15
Figure 2.4 The Learning Process
(Source: Kotler and Armstrong, 2012, Principles of Marketing 14 th Edition)
The learning process above shown depending on the cues (products, signs, ads, and
other stimuli in the environment) an individual chooses some specific response. A
response is an effort to satisfy a drive. The specific response chosen depend on the
cues and the person„s past experience. Reinforcement of the learning process occurs
when the response is followed by satisfaction which means reduction in drive.
Reinforcement strengthens the relationship between the cue and the response (Kotler
& Armstrong, 2012).
Learning relationship to consumer purchase decision
Learning is a behavioral modification that occurs through experience or conditioning.
Researchers have carried out studies to understand consumer learning. According to
the behavioral learning theory, learning occurs from exposure to external stimuli
such as advertising and according to the cognitive learning theory, consumer learning
takes place by a process of internal knowledge transfer(Commuri and Gentry, 2000).
Therefore, it will lead the consumer make a decision in purchasing product or
service.
Drive
Cues
Reinforcement
Response

16
2.1.3.4. Belief and Attitude
According to Kotler and Armstrong (2012), a belief is a descriptive thought that a
person has about something. Beliefs may be based on real knowledge, opinion, or
faith and may or may not carry an emotional charge. Beliefs are not so action-
oriented, it is possible to have a belief without really caring what it„s like. Based on
Johanna (2003), attitude describes a person„s relativelyconsistent evaluation, feelings
and tendencies toward an object or idea. Attitudes put people into a frame of mind of
linking or dislike things, of moving forward of away from them. According to
McDaniel et.al (2006), attitude could be defined as a learned tendency to response
consistently toward a given object, such as a brand. Because attitudes are usually
thought so as involving liking or disliking,they have some action implications.
Figure 2. 5 Attitude Components and Manifestations
(Source: Hawkins, Best, and Coney, 2004)

17
Cognitive component consists of a consumer„s beliefs about an object. For most
attitude objects, people have a number of beliefs. Beliefs can be about the emotional
benefits of owning or using a product (one can believe it would be exciting to own or
drive a convertible) as well as about objective features (Ruth, 2001). Many beliefs
about attributes are evaluative in nature. The more positive beliefs associated with a
brand, the more positive each belief is, and the easier it is for the individual to recall
the beliefs, the more favorable the overall cognitive component is presumed to be.
And because all the components of an attitude are generally consistent, the more
favorable the overall attitude is (Wanke, Bohner, & Jurkowitsch, 1997).
Affective component: Feelings or emotional reactions to an object represent the
affective component of an attitude. Marketers are increasingly turning their attention
to the affective or ―feeling‖ component of attitudes to provide a richer
understanding of attitudes than that based solely on the cognitive or ―thinking‖
component. As a consequence, marketers now commonly distinguish utilitarian or
functional benefits and attitudes from hedonic or emotional benefits and attitudes
(Palani and Sohrabi, 2013).
Behavioral component of an attitude is one„s tendency to respond in a certain
manner toward an object or activity Brand interest, as represented by tendencies to
seek out the brand on store shelves or search for brand information, also reflects the
behavioral component. The behavioral component provides response tendencies or
behavioral intentions. Actual behaviors reflect these intentions as they are modified
by the situation in which the behavior will occur (Hawkins & Mothersbaugh, 2010).
Belief and attitude relationship to consumer purchase decision
They are formed as we grow up, based on the environment in which we grow up.
Attitudes can be either of a high or low degree and the intensity depends on the
strength of conviction with which the person believes in them(Sukumar, 2013).
Belief and attitudes are measured to understand how the consumer might behave

18
toward a particular product. Belief and attitudes toward a product can be changed by
highlighting new functions of the product, or by associating them with celebrities, by
changing the beliefs a consumer has regarding the products, or by getting the
consumer more involved in the product (Kotler & Armstrong, 2012). Therefore,
belief and attitudes influence the way we think and behave and are therefore
important for the marketers who study them to understand how a consumer behaves
and make a decision in purchasing product or service.
2.2. Previous Research
Some previous researches related to this study are listed in the table below:
Table 2.1 Previous Researches
No Year Author Title Key Finding
1 2012 Sasongko
The Influence
of Motivation,
Perception and
Attitude
Toward Buying
Decision of
instant noodle
in Semarang
The result shows that the motivation,
perception, attitude relationship and
have with buying decision both
partial and simultaneous.
2 2012
Furaiji,
Łatuszyńska,
&
Wawrzyniak
An Empirical
Study of the
Factors
influencing
Consumer
Behavior in the
This research contributes to the
understanding of consumer buying
behavior in the noodle market. The
major findings of the study indicated
that the overall set of independent
variables was weakly associated
with the dependent variable.

19
noodle market However, the in-depth analysis
found that psychological factors and
marketing mix elements were
strongly associated with the buying
behaviors of Iraq consumers.
3 2009 Wahyuni
Analysis the
effect of
motivation,
perception, and
consumer„s
attitude towards
purchasing
The research found that and
motivation, perception, attitude
influence instant food purchasing
with positively and significantly
through purchasing decision of
instant food both partial and
simultaneous.
4 2012
Lawrence
Mandhlazi
Making
purchase
decision of
consumers in
the purchase of
food in
Kempton
Motivation, perception, learning and
belief & attitude partially and
simultaneously influencing
purchasing decision making.
5 2008
Staykova,
Stejskal &
Toufarova
Factors
Influencing
Consumer
Behavior in
purchase
instant product
The main aim of the article is to
understand the influence of factors
biasing purchase decisions
connected with measurement of
consumers„ involvement. The
performed survey showed that the
most important factors biasing
purchases groups of are all

20
instantproducts„ characteristics and
the perceived quality.
(Source: collected and constructed by researcher)
2.3. Theoretical Framework
In this research, researcher focuses on consumers psychological factors. Other factors
such as culture, social and personal will not be analyzed in this article.
Figure 2.6: Theoretical framework
(Source: adapted from Kotler and Armstrong, 2012)
Motivation (X1)
Perception (X2)
Learning (X3)
Belief & attitude (X4)
Consumer Purchase
Decision (Y) Simultaneously
Partially

21
2.4. Operational Definition
Table 2.2: Variable and Definition
Variable Definition Dimension
Motivation
(X1)
A need that is sufficiently pressing
to direct the person to seek
satisfaction of the need (Kotler and
Armstrong, 2014)
-Physiologicalneeds
-Safety needs
-Social needs
-Esteem needs
-Self-actualizationneeds
Perception
(X2)
The process by which people
select, organize, and interpret
information to form a meaningful
picture of the world (Kotler &
Armstrong, 2012)
- Selective attention
- Selective distortion
- Selective retention
Learning
(X3)
Changes in an individual„s
behavior arising from experience
(Kotler and Armstrong, 2014)
-Drive
-Cues
-Response
-Reinforcement
Belief and Attitude
(X4)
Belief: A descriptive thought that a
person holds about something
(Kotler & Armstrong, 2012)
Attitude: A person„s consistently
favorable or unfavorable
evaluations, feelings and
tendencies toward an object or
idea
-Belief
-Feelings
-Response Tendencies
(Source: constructed by researcher)

22
2.5. Hypothesis
A statistical hypothesis test is a method of making decision using experimental data.
Based on the constructed framework above, the hypothesis of this research are:
Hypothesis 1: Motivation has partial significant influence toward consumer purchase
decision of Indofood instant noodle in Cikarang.
Hypothesis 2: Perception has partial significant influence toward consumer purchase
decision of Indofood instant noodle in Cikarang.
Hypothesis 3: Learning has partialsignificant influence toward consumer purchase
decision of Indofood instant noodle in Cikarang.
Hypothesis 4: Belief and Attitude has partial significant influence toward consumer
purchase decision of Indofood instant noodle in Cikarang.
Hypothesis 5: Motivation, Perception, Learning, Belief and Attitude have
simultaneous significant influence toward consumer purchase decision of Indofood
instant noodle in Cikarang

23
CHAPTER III
RESEARCH METHODOLOGY
3.1. Research Design
3.1.1. Research Method
In doing research there are two research methods that a researcher can use. The two
methods are quantitative and qualitative. The method that is going to choose by the
researcher should be suitable for the problem that the researcher has. Qualitative
methods are often used for exploratory purposes or hypothesis generating while
quantitative ones are to test hypothesis. Qualitative research result in non-
quantification data; and quantitative research gives numerical analysis of the issues.
(Saunders, Lewis & Thornhill 2009).
In accordance with this research, the author used quantitative research method to
analyze factors that may influence to consumer purchase decision of Indofood instant
noodle in Cikarang, Indonesia. It is because Quantitative method is useful in
providing detailed planning prior to data collection and analysis; it provides tools for
measuring concepts, planning design stages and for dealing with population and
sampling issues (Render, Stair, & Hanna, 2006).
3.1.2. Research Framework
Research framework is defined as the flow of the research from the beginning until
the end of the research. The framework is beginning with problem identification.
After that, a literature review was done in order to able to base the research on
specific theories. Because the study used SPSS and quantitative method to analyze
the problems, the researcher needed to construct a questionnaire. The questionnaires
will be test by thirty different people to examine the validity and reliability of the
data. Then, the questionnaires were spread to 100 respondents and the data collection
was conducted by using SPSS 20.0 as a tool to analyze the data. From the data

24
analysis, researcher can give a conclusion and recommendations for the problems.
All steps conducted by the researcher are reflected in the following figure of research
framework.

25
Problem Identification and Problem
Statement
Theoretical Review
Construct
Questionnaire
Validity Test
Reliability Test
Data collection
Data Analysis and Interpretation
Conclusion and Recommendation
Yes
Yes
Figure 3.1: Research Framework
(Source: Self-constructed)

26
3.2. Sampling Design
Sampling design related to taking a portion of the population. Sampling design
categorize as a part of statistical methodology. There are two types of sampling
design probability sampling and nonprobability sampling. Probability sampling, the
elements in the population has some known non-zero chance or probability of being
selected as sample subject. Different with probability sampling, nonprobability
sampling is the element does not have a known or predetermined chance of being
selected as subject (Sekaran & Bougie, 2010).
3.2.1. Population
Population is a collection of groups that have the same characteristic andsample is
the part of group in the population that we choose as object of research. (Cooper and
Schindler, 2011). A population element is the individual participant or object on
which the measurement is taken. The research was conducted in Cikarang,
particularly in customer of Indofood are from 16 years old and older that presented at
Giant supermarket and Resto area.
3.2.2. Sampling Technique Applied
Population is about people, and the dwelling, location and environment that people
live in which can be defined in many ways, for example: by age, ethnicity, or
location. Based on Malhotra (2010) a research population is generally a large
collection of individuals or objects that is the main focus of a scientific query and it
is for the benefit of the population that researcher are done. Particularly in this
research, the population of research is the people from 16 years old and older that
presented at Giant supermarket and Citywalk area at Cikarang, Indonesia.
Sample is defined as a subgroup of the elements of the population selected for
participation in the study (Malhotra, 2010). Sampling is the process of selecting unit
(e.g.: people, organization) from a population of interest so that by studying the

27
sample researcher may fairly generalize result back to the population from which
they were chosen.
In accordance with this research, the author decided to use non-probability sampling.
This method is only giving the opportunity to the certain member of the population,
so it is closed to the other member of the population (Saunders, Lewis, & Thornhill,
2009). Convenience sampling method, finally, is chosen as the sampling technique.
Malhotra (2010) stated that respondent of convenience sampling are selected just
because they are easiest to recruit for the study in the area.
3.2.3. Sample Size
This is the unknown population. Sample size or the number of samples taken to be an
important issue when the type of research to be done is research that uses quantitative
analysis. Sekaran (2010) provided guidance on the determination of the number of
samples should be among 30 to 500 elements. He state that size of the sample can be
determined by calculating with below formula:
n = 5 x q
n = 5 x 20 = 100
With: n: number of sample
q: number of question
By that formula, minimum number of respondent in this research is 100 because
there are 20 questions. Researcher spread 100 just in case there are questionnaires
lost or left unfinished as those will not be counted. The number of 100 is very
applicable according to Sekaran (2010) in which they stated that number of samples
should be among 30 to 500 elements. Population is the whole object or subject in a
region and meets certain conditions and related with the problems which the sample
chosen for an exact purpose. A person is chosen as sample because the researcher

28
assumes that the person has relevant information toward the research and fulfilled the
criteria that are already determined by the researcher.
Based on that explanation, the samples in this study were selected as many as 100
respondents and eligible to be processed there as much as 100 respondents.
3.3. Research Instrument
Research instrument is the tool that used to answer the research questions that stated
in the previous chapter. The researcher intention is to gather the information from as
much various sources. Data can be obtained from primary or secondary data. Primary
data refers to information obtained first-hand by the researcher on the variables of
interest for specific purpose of the research. Secondary data means information
gathered from sources that already exist (Sekaran & Bougie, 2010). In order to fulfill
the validity of this research, the researcher use both primary and secondary data as
shown in the figure below:

29
Figure 3.2 Data Collection Method
(Source: Self-constructed)
3.3.1. Design of Questionnaire
In this case, the writer using the questionnaire enclosed is questionnaire that
presented in a form such that the respondents were asked to choose one answer that
suits the characteristics of him by giving the sign (x) or a checklist (√).The
questionnaire is only given to the consumer who has experienced with Indofood‟s
instant noodle product due to the validity of the answer.
Research
Primary data Secondary data
Data from journals,
articles, websites,…
Survey
Data collection
Data selection

30
Therefore based on the factors described above, research constructs the questionnaire
as following below:
Table 3.2: Pre-Questioner
Variable Indicator Measurement
Technique
Motivation
I bought Indofood instant noodles because it
is full fill my hunger
Likert Scale
This instant noodle ensures my health and
safety needs.
Likert Scale
I feel delicious when eating Indofood instant
noodle
Likert Scale
Eating Indofood instant noodle increases my
satisfaction
Likert Scale
Perception The taste of this instant noodle is better than
other instant noodles.
Likert Scale
Indofood instant noodle sauces are varied Likert Scale
The packaging of Indofood instant noodle are
attractive
Likert Scale
Indofood instant noodle are available in any
supermarket
Likert Scale
Learning I received Indofood instant noodle
information from advertisement
Likert Scale
I received Indofood instant noodle
information from store seller
Likert Scale
I received Indofood instant noodle
information from friends
Likert Scale
I received Indofood instant noodle
information from family members
Likert Scale

31
Beliefs &
Attitudes
I think that the price of Indofood instant
noodle is affordable
Likert Scale
I think Indofood instant noodle is worth
buying
Likert Scale
I think Indofood instant noodle have high
nutrition
Likert Scale
I think Indofood instant noodle have great
packing
Likert Scale
Purchase
Decision
Purchase of Indofood instant noodle is
beneficial for my daily life
Likert Scale
I always compare several alternative instant
noodle brands to choose the most appropriate
Likert Scale
I bought Indofood instant noodle base on my
need
Likert Scale
I willing to recommend my friend to buy
Indofood instant noodle
Likert Scale
(Source: Self-constructed)
3.3.2. Measurement of Variables
Each variable will be measured separately by the level of agreement of the
respondents. Respondents are asked to indicate their agreement with a specific
statement. The most popular agreement scale is the Likert scale (Phillips, Phillips and
Aaron, 2013).
The questionnaire usually uses Likert Scale and all statements that express either a
favorable and unfavorable attitude will be scaled through 5-point rating scale like the
Strongly Disagree, Disagree, Neither Agree nor Disagree, Agree, and Strongly

32
Agree. To answer the questions, respondents only have to mark (check, cross, or tick)
one of the columns. The point rating scale is explained as follow:
Table 3.2: Likert Scale
Description Rating Scale
Strongly Disagree 1
Disagree 2
Neither Agree nor Disagree (Neutral) 3
Agree 4
Strongly Agree 5
(Source: Cooper and Schindler, 2011)
3.4. Validity and Reliability
3.4.1. Validity Testing
Validity test represents how far the measurement can measure what the researcher
wants to measure, are we measure the right thing or not(Cooper and Schindler,
2011). Thus the validity test helps the researcher to ensure that each question asked
in the questionnaire is the right and appropriate. According to Mark, David and
Timothy (2009), there is a formula to test the validity of data by using the Correlation
of Coefficient of Pearson Product Moment based on the actual values of X and Y:
Formula 3.1: Coefficient of Correlation
(∑ ) (∑ )(∑ )
√[ (∑ ) (∑ ) ][ (∑ ) (∑ ) ]
(Source: Mark, David and Timothy 2009)
Where: n = the number or paired observation
∑ = the X variable summed

33
∑ = the Y variable summed
∑ = the X variable squared and the square summed
(∑ ) = the X variable summed and the sum squared
∑ = the Y variable squared and the square summed
(∑ ) = the Y variable summed and the summed square
∑ = the sum of the product of X and Y
In this research, the researcher will use SPSS 20 to calculate and check the validity of
the question based on the data of the pilot test.
3.4.2. Reliability Testing
The first requirement of a good instrument was reliability. The Reliability test of a
measure indicates the extent to which it is without bias (error free) and hence ensures
consistent measurement across the time and across the various items in the
instrument. In other words, the reliability of a measure is an indication of the stability
and consistency with which the instruments measures the concept and helps to assess
the goodness of measure(Sekaran and Bougie, 2010). Accurate questionnaire may
deflect the right question which is means when the question is asked for several
times, the interpretation would be the same from one respondent to another.
Measurement of Reliability (Internal-Consistency) in this research will use the
Cronbach‟s Alpha Coefficient; the equation is(Janzengroup.net , 2013):
Formula 3.2: Cronbach's Alpha
( )
(Source: Janzengroup.net , 2013)
Where: k = number of questions
r = average correlation between any two items

34
α = instrument reliability‟s coefficient
According to Malhotra and Peterson (2010) concluded that to achieve the moderate
scale reliability, the alpha value of all items that indicated the reliability statistics has
to be criterion of at least 0.60. The variable will be categorize as unreliable if the
cronbach‟s alpha of that certain variable is less than 0.60.
Table 3.4: Cronbach's Alpha Cofficient
Cronbach's alpha Internal consistency
α ≥ 0.9 Excellent
0.8 ≤ α < 0.9 Good
0.7 ≤ α < 0.8 Acceptable
0.6 ≤ α < 0.7 Questionable
0.5 ≤ α < 0.6 Poor
α < 0.5 Unacceptable
(Source: Malhotra and Peterson (2010)
3.5. Data Collection Procedure
One of the most important steps in the process of writing a report is gathering
information because a useful data can bring supportive problem answers. In this
particular study, the researcher used two types of data. There are primary data and
second data.
3.5.1. Primary Data
Primary data in this research of “Analysis of psychological factors influencing the
consumer purchase decision of Indofood instant noodle in Cikarang” is obtained
directly from the questionnaires that used for survey. Questionnaires are a technique
of data collection done by giving series of written statements that are consists of
research variables. Questionnaire provided a means of collecting primary data that

35
was quantified to be used in the analysis process in order to draw conclusions based
on the sample. In designing the questionnaire, questions were kept short, simple and
clear to ensure proper understanding of the questions and an ease of answering for
the respondent.
3.5.2. Second Data
Secondary data is the data collected and gathered available sources to support the
research. Second data come from Internet sources cosmetic and instant noodle market
in Indonesia, instant noodle product, reference books, journals and articles, some
previous researches with same topic. However, we mainly rely on reliable sources on
the web to ensure the credibility of our study. This data will provide many benefits to
this research in saving time and cost with useful data.
3.5.3. Descriptive Testing
Standard deviation
The standard deviation is a numerical value used to indicate how widely individuals
in a group vary. If individual observations vary greatly from the group mean, the
standard deviation is big; and vice versa.
Fomula 3.3: Standard deviation
(Source: explorable.com accessed: 2015)
With: σ = standard deviation
xi = each value of dataset
= the arithmetic mean of the data

36
N = the total number of data points
Maximal: Data value that is greater than or equal to all other values in our set of data
Minimum: Data value that is less than or equal to all other values in our set of data
3.6. Hypothesis Testing
3.6.1. Multiple Regression Analysis
In this study, the researcher used multiple regression tools to conduct the research.
According to the Basic Business Statistic book established 2012 by Mark, David and
Timothy, multiple regression models is used for estimating or forecasting the value
of variable Y, which calculated using several variables that affect Y. The research on
relationship between one dependent variable (Y) with four other independent
variables (X1, X2, X3, and X4) used to understand the relationship between them.
The result from this regression analysis will be used to accept or to reject the
hypothesis as to observe whether there is any effect or not between dependent and
independent variables. The underlying multiple regressions model will be used:
Formula 3.4: Multiple Linear Regression Model
(Source: Mark, David and Timothy 2012)
Where: Y = Consumer purchase decision (Dependent Variable)
= Y intercept
- = Regression Coefficient
X1 = Motivation (Independent Variable)
X2 = Perception (Independent Variable)

37
X3 = Learning (Independent Variable)
X4 = Belief and Attitude (Independent Variable)
e = Random Error
In order to see the correlation between dependent variable and independent variable
in this study, there are three tests that have to pass in the regression model which is
called classical assumption.
3.6.2. Classical Assumption
In order to use the multiple regression models, classical assumption test is need to
implement such as normality test, multicollinearity and heteroscedascity test.
3.6.2.1. Normality Test
Normality test is test that is used to determine whether the data is well set-modeled
by a normal distribution or not, or to compute how an unlikely random variable is to
be normally distribute. According to Barbara, Brian and Jonathan (2012), the data
can be defined as normally distributed when it has the curve in the histogram is
shaped like bell. Thus, the researcher will use the graphical method in the normality
test. This test can be done by producing histograms for the residual as well as normal
probability plots, in order to inspect the distribution of the residual values(Mark,
David and Timothy, 2012).
Theory driven plot consist of P-P plot (probability-probability plot), in this part the
researcher will get normal data if the plot is distributed by following the shape of
line. The normality test also can be done by using SPSS 20.0 statistical software.
3.6.2.2. Multicollinearity Test
Multicollinearity test is a test that used to know or detect whether any independent
variable that correlated strongly to each other in the multiple regression models.
Multicollinearity is situation that researcher have to avoid because it will not good

38
for independent variable correlated strongly to each other. Multicollinearity does not
affect the multiple regression equation‟s ability to predict the dependent variable.
However, it might show unexpected results on the relationship between each
independent variables and the dependent variable(Mark, David and Timothy, 2012).
In order to measure multicollinearity, variance inflation factor (VIF) is used to
measure. Normally, VIF measure how much the variance of the estimated
coefficients is increased over the case of no correlation among the X variables. The
formula for VIF is:
Formula 3.5: Variance Inflation Factor model
(Source:Lind, Marchal and Wathen, 2012)
The term refers to the coefficient of determination, where the selected
independent variable is used as a dependent variable and the remaining independent
variables are used as independent variables. The researcher will determine whether is
there any correlation between one or two independent variable by looking at VIF
value. According to Lind, Marchal and Wathen(2012), a VIF greater than 10 is
considered unsatisfactory, indicating that the independent variable should be
removed from the analysis. When VIF is under 10, it means that there is no
multicollinearity problem aroused.
3.6.2.3. Heteroscedasticity Test
One of the classic assumptions of the regression model is that the disturbance
variance is constant, or homogeneous, across observation. If this assumption is
violated, the errors are said to be “heteroscedastic”. Heteroscedaticity often arises in
the analysis of cross sectional data and time series data (Lind, Marchal and Wathen,
2012).

39
Heteroscedaticity test is used for knowing whether the data is not normally
distributed and it also use to know if the variance terms of errors are difference
across observations. It can be seen from the scatter plot by looking at distribution of
residual value toward the predicted value. If the distribution is spread randomly
without any systematic pattern, then the data is passed the heteroscedaticity test.
3.6.3. Testing the Hypothesis
To determine the linear relationship between X and Y, a statistical test (F-Test and T-
Test) is performed. The null hypothesis is that there is no linear relationship between
the two variables (β ≠ 0), and the alternate hypothesis is that there is a linear
relationship (β = 0). If the null hypothesis can be rejected, then we have proven that a
linear relationship does exist.
3.6.3.1. F-Test
F – Test determines whether or not there is a relationship between set of independent
variables and dependent variable. The analysis shall show how effect for all related
variables is. In other words, F- Test is used to statistically test the null hypothesis that
there is no linear relationship between the X and Y variables. For the testing
hypothesis, the researcher used confidence interval of two – tailed 95%, the 5%
significance (α = 0.05) outside the confidence level leads to rejection of null
hypothesis. 5% significance level is applied since the research is within boundary of
social science, in which the 5% significance is customary. In testing the value of α, F
– test is conducted. If the significance level of the F – Test is low (significance level
α used is 0.05), H0 is rejected and concluded there is a linear relationship (Lind,
Marchal, & Wathen, 2012). F – test and significance of F – value, for this test, if the
F – value is significant, this means that a significant difference between the groups
on this variable is found.
H0: β1 = β2 = β3 = β4 = 0, if significant F > 0.05, accept H0

40
Ha: at least there is one (βj ≠ 0), if significant F < 0.05, reject H0
Formula 3.6: F - Test
[ ]
[( ) ( )]
Source:(Lind, Marchal and Wathen, 2012)
Where: F = Statistic test for F distribution
R2 = Coefficient of determination
K = Number of independent variables in the model
N = Number of sample period
3.6.3.2. T-Test
The T-Test is applied to determine the partial relationship between each independent
variable (coefficient) and the dependent variable. The null hypothesis is that the
coefficient of X (i.e., the slope of the line) is 0. If the significance level for the T-Test
is low (significance level α used is 0.05), we reject H0 and conclude there is a linear
relationship, and vice versa(Lind, Marchal and Wathen, 2012).
H0: β1 = 0, if Significant T> 0.05, accept H0
Ha: β1 ≠ 0, if Significant T < 0.05, reject H0
The strength of the relationship between two numerical variables was measured using
correlation coefficient (r), the test for the existence of correlation is using t test
Formula 3.7: T - Test
(Source: Lind, Marchal and Wathen, 2012)

41
With: t = statistic test for t distribution
bj = sample slope
βj = slope of the population
Sbj= standard error of the slope
In this research, the researcher would use the output from SPSS 20.0 from primary
data to analyze for accuracy results.
3.6.3.3. Standardized / Unstandardized coefficient
Standardize regression coefficients are in parentheses. These can be used to compare
the importance of the independent variables within each of the four regressions, that
is, within each of the four ballot measures. The unstandardized coefficients are useful
to compare each variable between the regressions. Remember that a variable‟s
unstandardized coefficients (β) can only be compared with other variables measured
in the same units (like population density for each of the ballots). Standardized
coefficients (Beta) are best for comparing two or more variables that have different
measurement unit. In this research the researcher use unstandardized coefficient.
3.6.3.4. The coefficient of determination (r²)
Adjusted Coefficient of Determination (R2): is a version of R-squared that has been
adjusted for the number of predictors in the model. R-squared tends to over-estimate
the strength of the association especially if the model has more than one independent
variable.

42
Formula 3.8: Adjusted Coefficient of Determination
(Source: Lind, Marchal and Wathen, 2012)
With:
R2adj = Adjusted coefficient of determination
n = number of observations
k = number of independent variables

43
CHAPTER IV
ANALYSIS AND INTERPRETATION
4.1. Company Profile
4.1.1. PT Indofood Sukses Makmur
PT. Indofood Sukses Makmur was established in 1968 under the name of PT.
Panganjaya Intikusuma and changed its name to PT Indofood in 1994. In recent
decades, PT. Indofood has transformed into a Total Food Solutions company with
operations covering all stages of the food production process, from production and
processing of raw material to the final product available in the market. The company
conducted an IPO in 1994 by issuing 763 million shares at par value of Rp. 1000 per
share. In the 25 years of his business, many companies make acquisitions as a way to
make the company's business development as the number one company in the food
and beverage industry in Indonesia. Now, PT. Indofood known as an established and
leading company in each business category. In carrying out its operation, Indofood
gain benefit from business model consisting of four Strategic Business Group which
are complementary, namely Consumer Branded Product (CBP), Bogasari,
Agribusiness Distribution.
As one of the largest food companies in Indonesia, Indofood are in a good position to
be able to seize the opportunities and meet the challenges of the market. With a
market capitalization more than 50 trillion at the end of 2012 makes the PT. Indofood
Sukses Makmur the main player in the food and beverage industry with a market
share of 75%. In accordance with company's vision "Total Food Solutions", PT.
Indofood continue to develop and implement business strategies to be able to create
long-term business success and as an effort to develop company's competitive

44
position amid competition. Business strategy creation for the company done by score
mapping for internal and external factors, score results will be mapped in a matrix
that describes the position and alternative strategies that can be implemented in the
company.
4.1.2 Vision and Mission
Vision: A Total Food Solutions Company.
Mission:
In accordance with Indofood‟s general mission, Indofood Indonesia then established
these following missions:
a) To provide sustainable solutions for food needs
b) To continuously improve our people, processes and technologies
c) To contribute to the welfare of the society
d) To continuously improve stakeholders‟ values.
Value:
“With discipline as the basis of our way of life; we conduct our business with
integrity; we treat our stakeholders with respect; and together we unite to strive for
excellence and continuous innovation.”
4.1.3 Product Information
As one of the world‟s largest instant noodle producers, Indofood‟s Noodles Division
continues to be in the forefront in the instant noodle industry in Indonesia, renowned
for producing high quality, good tasting and value for money products. Our
established brands - Indomie, Supermi, Sarimi, Sakura, and Pop Mie cater to
consumers from all walks of life and command a high degree of customer trust and
loyalty.The kind of Indofood instant noodle product sold in Indonesia that listed as
follows

45
Table 4.1: Kind of Indofood Products
Product Picture Product Name
Indomie has been launched since 1982 and now
available in many countries, such as: USA,
Australia, England, Middle east etc. Just don‟t
miss all Indomie flavors.
You can't claim to be an Indonesian if you
haven‟t heard of Supermi. As an instant noodle,
Supermi has been going through a long journey
and had also had various changes of packaging.
Now Supermi has a more modern feel and
remains in a class of its own.
Sarimi is another product from Indofood that has
long been providing delights for the Indonesian
palate. Don't miss out on the various flavors that
Sarimi has to offer including the latest Sarimi
Soto Koya Jeruk Nipis and Sarimi Soto Koya
Pedas.
Good price and Good taste.
POP Mie a practical form of instant noodles that
is ready to keep beside you at any given time.
Simply pour in hot water, leave for five minutes,
and you're all set!
(Source: Indofood Indonesia Website, 2014)

46
4.2. Data analysis
4.2.1.Variable Frequency
A. Reliability test
According to Malhotra (2010), if the Cronbach‟s alpha is less than 0.6 the variable is
not reliable. The computed Alpha values for the research variables are shown in table
4.2 as follows:
Table 4.1 Reliability test
Variables Cronbach‟s
Alpha
Cronbach‟s
Alpha
Standard
N of
items
Reliability
ALL VARIABLES
Motivation (X1) 0.791 0.6 5 Reliable
Perception (X2) 0.800 0.6 5 Reliable
Learning (X3) 0.900 0.6 5 Reliable
Belief and Attitude (X4) 0.835 0.6 5 Reliable
Consumer purchase decision
(Y)
0.877 0.6 5 Reliable
(Source: Data processing result SPSS 2.0)
B. Validity test
According to Shepherd and Wiklund (2009) based on the correlation coefficient, the
concurrent validity is determined as follows high (r ≥ 0.5), moderate (0.3- 0.5), low (r
= 0.1- 0.3) and no (r ≤0.1) (Brännback, Carsrud, & Kiviluoto, 2013). In this research,

47
with 2- tailed testing, α = 0.05, n = 30 respondents, the critical value of r = 0.361.
The validity test is presented as follows:
Table 4.3 Validity test
Variables Statement r compute
value
R
critical value
Validity
Motivation (X1)
Motivation
Q1 0.784 0.361 Valid
Q2 0.714 0.361 Valid
Q3 0.541 0.361 Valid
Q4 0.758 0.361 Valid
Perception (X2)
Perception
Q5 0.699 0.361 Valid
Q6 0.730 0.361 Valid
Q7 0.748 0.361 Valid
Q8 0.670 0.361 Valid
Learning (X3)
Learning
Q9 0.744 0.361 Valid
Q10 0.903 0.361 Valid
Q11 0.782 0.361 Valid

48
Q12 0.843 0.361 Valid
Belief and Attitude (X4)
Belief and
Attitude
Q13 0.759 0.361 Valid
Q14 0.745 0.361 Valid
Q15 0.634 0.361 Valid
Q16 0.823 0.361 Valid
Consumer Purchase Decision (Y)
Consumer
Purchase
Decision
Q17 0.909 0.361 Valid
Q18 0.635 0.361 Valid
Q19 0.823 0.361 Valid
Q20 0.781 0.361 Valid
(Source: Data processing result SPSS 2.0)
The entire items are valid with r always higher thanrtable. Therefore, the researcher
decided to choose all the questions into the questionnaire for real samples.

49
4.2.2. Demographic Profile
A. Gender
The questionnaire is only given to the one who is purchasing instant noodle products.
And there are 53 Males and 47 Females are respondents for this questionnaire. This
gender description is presented as below:
Figure 4.1 Gender of Respondents
(Source: Primary data)
From this figure above it can be explained that from total 100 respondents,
the results show that 47% are male and 53% are female. Therefore, majority of the
respondents are female.
47%
53%
Gender
Male Female

50
B. Age
In this research, according to data collected from consumers used products. The age
of respondents are almost from 16 – 20 years old which stated 18 respondents, the
next is from 21 – 30 years old which stated 42 respondents and the age above 30
years old was 40 respondents. The following is the description.
Figure 4.2 Age of Respondents
(Source: Primary data)
Based on figure 4.2, we can see that 18% are 16-20 years old, 42% are 21-30 years
old and 40% are above 30 years old. Therefore, majority of the respondents are at the
age of 21-30 years old.
18%
42%
40%
Age 16-20 years 21-30 years >30 years

51
C. Monthly income/ Allowance Levels
Based on the 100 respondents‟ monthly income/ allowance which is divided into 3
levels,so the result of the analysis could be seen in below:
Figure 4.3 Monthly income/ Allowance Levels
(Source: Primary data)
Figure 4.3 demographic profile of the respondent (monthly income). Show that 46%
(46 respondents) have monthly income < Rp. 1.5 million, 48% (48 respondents) have
monthly income Rp. 1.5 – 7.5 million, 6% (6 respondents) have monthly income
>Rp. 7.5 million. Therefore, the majority of the respondents have monthly income
Rp. 1.5 – 7.5 million
46%
48%
6%
Monthly Income/ Allowance < Rp. 1.5 mil Rp. 1.5 mil - 7.5 mil > Rp. 7.5 mil

52
D. Frequency of purchase for instant noodle products during a month
Based on the 100 respondents‟ frequency of purchase for instant noodle products
during a monthis divided into 3 levels,so the result of the analysis could be seen in
below:
Figure 4.4 Frequency of Purchase instant noodle product during a month
(Source: Primary data)
Figures above show that the number of consumers buying the instant noodle of
Indofood from 1 to 2 times by 28%, 3 to 4 times about 25% and about 47% on 4
times. Therefore, majority of the respondents have 4 times frequency of purchase for
instant noodle products during a month.
28%
25%
47%
Frequency
1 or 2 times 3 - 4 times > 4 times

53
4.2.3.Descriptive Analysis
Table 4.4 Descriptive statistics
Descriptive Statistics
N Minimum Maximum Mean Std. Deviation
X1 100 1.50 4.50 3.0520 .64774
X2 100 1.25 4.25 3.1075 .52974
X3 100 1.00 4.50 3.0200 .69874
X4 100 1.25 5.00 3.0825 .73431
Valid N (listwise) 100
(Source: Data Processing Result of SPSS 2.0)
The table shows the respondents‟ responses to four statements about their
susceptibility towards Motivation (X1), Perception (X2), Learning (X3), Belief and
Attitude (X4). Based on the result, the most dominant variablein term of independent
is Perception with mean value of 3.1075.
4.2.4. Classic Assumption Test
1. Normality Test
The normality can be measured by seeing the P-P plot and histogram.

54
Figure 4.5. Histogram Chart
(Source: Primary Data – SPSS 20)
From histogram in figure 4.5, the histogram is bell-curved shared. It means that the
data have variation of value make it normally distributed which can be used to
approximate various discrete probability distributions and eligible to conduct
research.

55
Figure 4.6. P-P Normality Plot
(Source: Primary Data – SPSS 20)
Based on the P-P plot curve that been shown in the Figure 4.6 above, we can assume
that the data was normally distributed as the criteria of the normality in P-P plot is
spreading approximately surrounding the diagonal direction of the line, besides that
data also not seriously deviated from the line that means the distribution is normal
and be ready to test for next step of research.
2. Multicollinearity Test
In order to do Multicollinearity test, the researcher used variance inflation factor
(VIF) to check. VIF has function to measure how much the variance of the estimated
coefficients is increased over the case of no correlation among the variables. On the

56
basis of the criteria, all VIF values should be less than 10.0 (Render, Stair and Hana,
2006).
Model
Collinearity Statistics
Tolerance VIF
1 (Constant)
X1 .242 4.110
X2 .607 1.646
X3 .228 4.379
X4 .377 2.650
Figure 4.7. VIF Result (Source: Primary Data – SPSS 20)
Figure 4.7 shows that all the variables have VIF values which less than 10. It mean
that in this regression model there is no multicollinearity exist.
3. Heteroscedasticity Test
Heteroscedasticity typically occur when the variable is not distributed in a normal
manner or when a data transformation procedure has produced an unanticipated
distribution for a variable (Render, Stair and Hana, 2006).
A data can be excluded as heterocedasticity if the data scatter plot are spread
randomly and does not make certain pattern such as decreasing or increasing pattern.

57
Figure 4.8. Heteroscedascity Test
(Source: Primary Data – SPSS 20)
From this Figure 4.8, the variable are scattered all over the graph. There is no
Heteroscedasticity problem. Hence this regression model is eligible to be used to
predict the product quality based on the independent variables.
4.2.5. Hypothesis test
This research uses multiple linear regression analysis because the model has two
variables. The hypothesis testing is conducted through F- test and t- test. The effect
of independent variable individually toward dependent variable will be used the
partial t-test. F-test will be used to test the influences of all independent variables to

58
dependent variable simultaneously. Each independent variable is significant if p-
value is less than 0.05.
4.2.5.1. Coefficient of Determination (R2)
Table 4.5 Coefficient Determinant (R2)
Model Summaryb
Model R R Square Adjusted R
Square
Std. Error of the
Estimate
Durbin-Watson
1 .882a .778 .769 .34756 1.984
a. Predictors: (Constant), X4, X2, X3, X1
b. Dependent Variable: Y
(Source: Data Processing Result made by SPSS 2.0)
Based on the table above, it shows that the value of Coefficient of determination
(Adjusted R Square) is 0.769. It means that the independent variables (Motivation,
Perception, Learning, Belief and Attitude) can explain 76.9 percent of the variation in
dependent variable (Consumer Purchase Decision). Meanwhile, other variables
(Personal Factors, Social Factors and Cultural Factors) 23.1 percent is unexplained in
this study.
In addition, the coefficient correlation (R) is 0.882 or 88.2 percent which means the
degree of association between all of the independent variables and dependent
variable is very strong since it is above 0.5.

59
4.2.5.2. F-Test
F-test is conducted to test whether all independent variables have simultaneous affect
the dependent variables. The result of F-Test using SPSS 20 is presented below.
Table 4.6 F-test
ANOVAa
Model Sum of Squares df Mean Square F Sig.
1
Regression 40.227 4 10.057 83.251 .000b
Residual 11.476 95 .121
Total 51.703 99
a. Dependent Variable: Y
b. Predictors: (Constant), X4, X2, X3, X1
(Source: Data Processing Result made by SPSS 2.0)
There are two hypotheses that are:
H0: β1 = β2 = β3 = β4 = 0, if significant F > 0.05, accept H0
Ha: at least there is one (βj ≠ 0), if significant F < 0.05, reject H0
From the output of F-test in ANOVA, it shows that F calculated is 83.251 with the
Sig value of 0.000< 0.05, therefore the null hypothesis H0 is rejected and the
alternative hypothesis Ha is accepted.
4.2.4.2 T-test
The t – test is conducted in order to test the significant of each independent variables
towards the dependent variable which mean to examine whether motivation,
perception, learning, belief and attitude influence consumer purchase decision.

60
Table 4.7: T-test
Coefficientsa
Model Unstandardized
Coefficients
Standardized
Coefficients
t Sig. Collinearity Statistics
B Std. Error Beta Tolerance VIF
1
(Constant) -.298 .215 -1.383 .170
X1 .266 .109 .239 2.434 .017 .243 4.110
X2 .281 .085 .206 3.319 .001 .607 1.646
X3 .033 .105 .032 .320 .750 .228 4.379
X4 .512 .077 .520 6.606 .000 .377 2.650
a. Dependent Variable: Y
(Source: Data Processing Result made by SPSS 22.0)
Based on the above table, obtained the model multiple linear regression
Unstandardized Coefficients as follows:
Y= - 0.298+ 0.266 X1 + 0.281 X2 + 0.512 X4
Table 4.7 above shows the significance value of each independent variables of the
research. The results according to the data processing result of SPSS version 20.0 are
as follow:
1. The significance value of Motivation influence according to the table above is
0.017 which is less than the significant level of 0.05. Then, H01, rejected,
which means there issignificant influence from Motivation toward consumer
purchase decision of Indofood instant noodle in Cikarang.
2. The significance value of Perception influence according to the table above is
0.001 which is less than the significant level of 0.05. Then, H02, rejected,
which means there is significant influence from Perception toward consumer
purchase decision of Indofood instant noodle in Cikarang.

61
3. The significance value of Learning influence according to the table above is
0.750 which is greater than the significant level of 0.05. Then, H03 is not
rejected, which means there isno significant influence from Learning toward
consumer purchase decision of Indofood instant noodle in Cikarang.
4. The significance value of Belief and Attitude influence according to the table
above is 0.000 which is less than the significant level of 0.05. Then, H04,
rejected, which means there is significant influence from Belief and Attitude
toward consumer purchase decision of Indofood instant noodle in Cikarang.
4.3. Interpretation of Result
Based on the data analysis above, the researcher can make an interpretation of the
data analysis:
A. Motivation
According to the result of F-test and t-test, motivation influences the consumer
purchase decisionand it is significant toward consumer purchase decision. The t-
value of motivation variable as shown in table 4.7 is 2.434 which means that increase
in motivation variable will influence to increase consumer purchase decision. This
makes motivation variable become one of the factor influence toward consumer
purchase decision. The influence of motivation variable is significant since the
significance level of this variable is 0.017 which is less than 0.05.
Based on the statement above, it is clear that Indofood instant noodle consider
motivation as an important and significant factor that influence toward consumer
purchase decision. It makes sense because consumers need an instant noodle which is
good quality, healthy and safe. Its models are in accordance with the present trend.
Those needs are successfully satisfied by Indofood instant noodle.
B. Perception

62
According to the result of F-test and t-test, perception influences the consumer
purchase decisionand it is significant toward consumer purchase decision. The t-
value of perception variable as shown in table 4.7 is 3.319 which means that increase
in perception variable will influence to increase consumer purchase decision. This
makes perception variable become one of the factor influence toward consumer
purchase decision. The influence of perception variable is significant since the
significance level of this variable is 0.001 which is less than 0.05.
Based on the statement above, it can be concluded thatperception is one of the key
psychological factors that influence consumer purchase decision. The more
information consumers have about a product, the more comfortable they are buying it
(Mack, 2013).Although awareness of a consumers for the instant noodle product will
be limited to the noodle until they started buying the instant noodle
product.Consumers demand will be based on the information that was conveyed to
evaluate and compare their personal needs. Finally they will make a purchase
decision.
C. Learning
According to the result of F-test and t-test, learning variable is categorized as a
variable that influences the consumer purchase decision however it is not significant
towards the consumer purchase decision. It is shown on table 4.7 that is the t-value of
the learning variable is 0.320 which means that increase in learning variable will
influence to increase consumer purchase decision. However, the influence towards
consumer purchase decision it not significant since the significance value of
learningvariable is 0.750 which is greater than 0.05. Despite, it has to be taken into
account that the learning variable has influence on consumer purchase decision.
Based on the statement above, it can be concluded that the consumer or in this
research referred as Indofood instant noodle consumers believed that the process of
learning was not necessary.Factors of learning in the research questionnaires is to

63
describe the changes in the behavior of individuals derived from experience. In fact,
learning is only a small part of the consumers purchase decision as the remaining
factor is much bigger impact when we scrutinized the psychological process of
humans.
D. Belief and Attitude
According to the result of F-test and t-test, belief and attitude influences the
consumer purchase decisionand it is significant toward consumer purchase decision.
The t-value of belief and attitude variable as shown in table 4.7 is 6.606 which means
that increase in belief and attitude variable will influence to increase consumer
purchase decision. This makes belief and attitude variable become one of the factor
influence toward consumer purchase decision. The influence of belief and attitude
variable is significant since the significance level of this variable is 0.000 which is
less than 0.05.
Based on the statement above, it can be concluded that most of consumers have
positive belief and attitude toward Indofood instant noodle which strongly influence
their purchase decision.The beliefs and attitudes factors that the research
questionnaires is to describe the good or bad evaluation based on sustainable
awareness, emotional feelings and the trend of an action for an object or a certain
idea. The various function of attitude lead to the consumer„s overall attitude toward
engaging in the given purchase decision, thus influencing consumer behavior.

64
CHAPTER V
CONCLUSION AND RECOMMENDATION
5.1. Conclusion
The purpose of the study is to identify whether there is an influence of psychological
factors to the consumers‟ purchase decision. The research has answered the statement
of problems and given the forecasting model of consumer purchase decision. The
answers are shown below.
1. Motivation variable represented the susceptibility of the consumer purchase
decision.It is found that motivation variable has significant influence toward
theconsumer purchase decision.
2. Perception variable represented the susceptibility of the consumer purchase
decision.It is found that perception variable has significant influence toward
the consumer purchase decision.
3. Learning variable represented the susceptibility of the consumer purchase
decision.It is found that learning variable has no significant influence toward
the consumer purchase decision.
4. Belief and attitude variable represented the susceptibility of the consumer
purchase decision.It is found that belief and attitude variable has significant
influence toward the consumer purchase decision.
5. The research result simultaneously or jointly showed that the motivation,
perception, belief and attitude have significant influence toward the consumer
purchase decision of Indofood instant noodle in Cikarang.

65
5.2. Recommendation
5.2.1. For the company
As it stated above in the conclusion part, there are three independent variables of
psychology of consumers‟ which have given significance affect toward the
consumers purchase decision of Indofood instant noodle, the first independent
variable is motivation. According to the research that researcher got in this study, a
good quality and design of instant noodle products with supporting from various
unique features will able to boost the product sales of the Indofood. It means that
people can be motive by their satisfaction. Therefore according to the results that the
researcher got from this study is that the better product quality and any other benefits
or advantages that Indofood can offer to their consumers through their products, it
will boost the consumers purchase decision.
The second independent variables is perception, perception is the most significance
independent variable of psychology of consumers' before the consumers decide to
purchase an certain products which can match with their needs and also that can offer
them a sense price. According to the results that researcher got in this study, the
researcher got that consumers will happily or delightfully to purchase a product
which can offer them a price that match with the quality of the instant noodle. The
less expensive cost with more values and benefits that company offers to their
consumers will lead to increasing of consumers buying decision especially for
consumers. The researcher recommended to company to always keeps balance
between the products values and the products price, the products will be able to hit
the market and increasing the consumers buying decision.
For the third is learning variable, according to the results that researcher got on
chapter four and the interpretation of results. Although the people variable is not
significance toward the consumers buying decision of Indofood's instant noodle
products among the consumers however the learning variable still influence the

66
consumers buying decision of Indofood among the consumers. Therefore based on
the results that the researcher got in this study, the researcher would like to
recommend to Indofood to keep gives more training to their consumers with useful
information and interesting experiences of the company gives the consumers.
Indofood should use all resources to help consumers more considerate to consumers
to better understand the products that the company offers. This would be the way to
consumers proactively to the company and the company thus better able to improve
their shortcomings.
The final independent variables is belief and attitude, according to this study, the
researcher found that process also plays roles that also can influence the Indofood
consumer purchase decision. As the results that had been showed on chapter four and
the interpretation of results, the researcher would like to recommend for Indofood to
follow like what have instant noodle producer did. According to the results, the
consumers more prefer to buy a product which not easy to get and necessary for them
to put more effort to buy the product. It might be that they thought the easier for the
products to be bought by the consumers will lead to think of ordinary or not special
products which everyone can buy it.
5.2.2. For the Future Researchers
In this research, the researcher studies psychological. Therefore, the next researcher
should consider other factors which are considered giving influence toward
Consumer Purchase Decision such as social factor, culture factor and personal
factors. The author hopes that adding more variables may give more knowledge in
this field of study.

67
REFERENCES
Books
Barbara, R., Brian, J. and Jonathan, C. (2012) MINITAB Handbook: Update for
Release, Cengage Learning.
Copper, Donald R & Schindler Pamela, S. (2011), Business Research Methods, the
McGraw-Hill Companies.
Hawkins, D. I., Best, R. J., & Coney, K. A. (2004). Consumer Behavior. Building
Marketing Strategy (9th ed.). New York: McGraw-Hill/Irwin.
Hawkins, D. I., & Mothersbaugh, D. L. (2010). Consumer Behavior: Building
Marketing Strategy (11 ed.). New York: McGraw-Hill/Irwin.
Kotler, P., Armstrong, G., Hoon, A. S., Meng, L. S., Tiong, T. C., & Hon-Ming, Y.
O. (2009). Principles of Marketing. A Global Perspective. Singapore:
Pearson Education.
Kotler, Philp & Armstrong, Garyl, (2012).Principle of Marketing, 14th
Edition, Upper
Sadder River,New Jersey: Pearson Prentice Hall.
Malhotra, N.K. and Peterson, M. (2010).Basic Marketing Research: A decision
making approach, 6th edition, New Jersey, USA: Prentice Hall.
Mark, B.L., David, L.M. and Timothy, K.C. (2012) Basic Business Statistic:
Concepts and Applications, New Jersey: Pearson Prentice Hall.
McDaniel, C., Lamb, C. W., & Hair, J. F. (2006). Introduction to Marketing (8th
ed.). Thompson.
Lind, D., Marchal, W. and Wathen, S. (2012) Basic statistic for Business and
Economics, McGraw-Hill Education.
Phillips, P.P., Phillips, J. and Aaron, B. (2013) Survey Basics: A Guide to Developing
Surveys and Questionnaires, American Society for Training & Development
(ASTD).
Perreault, W. D., & McCarthy, E. J. (2005). Essentials of Marketing: A Global
Managerial Approach (10th ed.). Mcgraw-Hill College.

68
Render, B., Stair, R. M., & Hanna, J. M. (2006). Quantitative Analysis for
Management. Pearson.
Saunders, M., Lewis, P., & Thornhill, A. (2009). Research methods for business
students (5th ed.). Essex: Pearson Education Limited.
Sekaran, U. and Bougie, R. (2010) Research Methods for Business: A Skill Building
Approach, 5th edition, John Wiley & Sons.
Sekaran, U. (2010). Research Methods for Business. Chichester: John Willey & Sons.
Shepherd, M., Wiklund, B.E. (2009) Quantitative Analysis for Management, New
Jersey: Pearson Prentice Hall.
Journals
Commuri, S., & Gentry, J. W. (2000). Oppotunitiesfor Family Research in
Marketing. Academy of Marketing Science Review, 1-34.
Furaiji, F., Łatuszyńska, M., & Wawrzyniak, A. (2012). An Empirical Study of the
Factors influencing Consumer Behavior in noodle Market. Contemporary
Economics, 76-86.
Jafaar, S. N., Lalp, P. E., & Mohamed, M. (2012). Consumers„ Perceptions, Attitudes
and Purchase Intention towards Private Label Foods Products in Malaysia.
Journal of Business and Management Sciences, 74-78.
Johanna, F. (2003). Attitudes and Consumer Behaviour Journal of International
Marketing,, 36-57.
Kazmi, S. Q. (2012). Consumer Perception and Buying Decisions (The Pasta Study).
International Journal of Advancements in Research & Technology, 123-132.
Lawrence Mandhlazi (2012). Decision purchase making of consumers in the
purchase of food in Kempton.Journal of Marketing Research, 348-356.
Mohan, A. (2014, May). Consumer Behavior Towards Food Industry in Indian
Market. Journal of Marketing Research, 741- 756.
Nagarkoti, B. (2009). Factors Influencing Consumer Behavior of food buyers.
International Journal of Marketing Studies, 157 - 160.
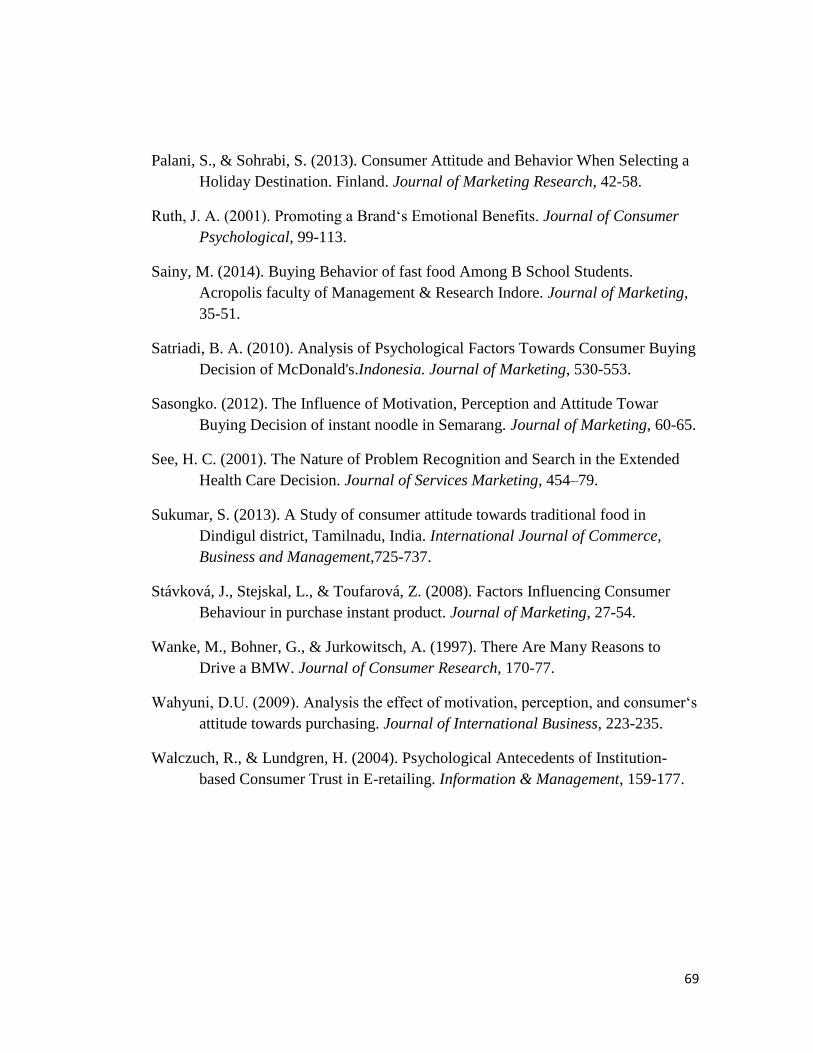
69
Palani, S., & Sohrabi, S. (2013). Consumer Attitude and Behavior When Selecting a
Holiday Destination. Finland. Journal of Marketing Research, 42-58.
Ruth, J. A. (2001). Promoting a Brand„s Emotional Benefits. Journal of Consumer
Psychological, 99-113.
Sainy, M. (2014). Buying Behavior of fast food Among B School Students.
Acropolis faculty of Management & Research Indore. Journal of Marketing,
35-51.
Satriadi, B. A. (2010). Analysis of Psychological Factors Towards Consumer Buying
Decision of McDonald's.Indonesia. Journal of Marketing, 530-553.
Sasongko. (2012). The Influence of Motivation, Perception and Attitude Towar
Buying Decision of instant noodle in Semarang. Journal of Marketing, 60-65.
See, H. C. (2001). The Nature of Problem Recognition and Search in the Extended
Health Care Decision. Journal of Services Marketing, 454–79.
Sukumar, S. (2013). A Study of consumer attitude towards traditional food in
Dindigul district, Tamilnadu, India. International Journal of Commerce,
Business and Management,725-737.
Stávková, J., Stejskal, L., & Toufarová, Z. (2008). Factors Influencing Consumer
Behaviour in purchase instant product. Journal of Marketing, 27-54.
Wanke, M., Bohner, G., & Jurkowitsch, A. (1997). There Are Many Reasons to
Drive a BMW. Journal of Consumer Research, 170-77.
Wahyuni, D.U. (2009). Analysis the effect of motivation, perception, and consumer„s
attitude towards purchasing. Journal of International Business, 223-235.
Walczuch, R., & Lundgren, H. (2004). Psychological Antecedents of Institution-
based Consumer Trust in E-retailing. Information & Management, 159-177.

70
Internet Website
Indofood (2014), Available: http://www.indofood.com/.
World Instant Noodles Association, (2012). Available:
http://www.ft.com/intl/cms/s/0/52b5eb0c-b0dd-11e3-9f6f-
00144feab7de.html#slide0.
Instant noodle definition, (2015). Available: http://www.yourdictionary.com.
Janzengroup.net (2013), Reliability, Available:
http://www.janzengroup.net/stats/lessons/scalevar.html
Weighted mean. (n.d.). Retrieved March 2rd, 2015 from::
http://www.princeton.edu/~achaney/tmve/wiki100k/docs/Weighted_mean.ht
ml.

71
APPENDIX A: QUESTIONAIRES
Purchase decision making in buying Indofood’s instant noodle
This is the questionnaire to collect your motivation, perception, learning, belief &
attitude about the purchase decision making in buying instant noodle. Please tick in
the box as your answer. To serve and provide to customers the best products and
services from Indofood. I highly recommend you to fulfill those questions below
correctly and honestly. All responses will be kept anonymous. All information is
treated as PRIVATE and CONFIDENTIAL and only used for the academic research
purpose. Your cooperation in this degree project is greatly appreciated.
Thank you for your valuable time!!
SECTION A
In this section we would like to find out a little more about the characteristics of
customers who purchase instant noodle productsof Indofood. Please place a cross (x)
in the appropriate block.
1. Gender:
□ Male □ Female
2. Age:
□ 16-20 □ 21-30 □ >30
3. Frequency of purchase instant noodle during a month:
□ < 2 times □ 3-4 times □ > 4 times
4. Monthly income level:
□ < Rp. 1.5 mil □ Rp. 1.5 - 7.5 mil □ > Rp. 7.5 mil

72
5. Have you ever bought Indofood instant noodle?
□ Yes □ No
(If the answer is “No”, you can finish the questionnaire here. If it is “Yes”, please continue following
questions)
SECTION B
To answer each questions, simply circle/cross/mark one of the number that
representing your opinion towards the statement given (1 = strongly disagree, 2 =
disagree, 3 = neutral, 4 = agree, 5 = strongly agree)
No
Motivation
Score
Statements 1 2 3 4 5
1 I bought Indofood instant noodles because of the quality is good.
2 This instant noodle ensures my health and safety needs.
3 I feel delicious when eating Indofood instant noodle
4 Eating Indofood instant noodle increases my satisfaction
No
Perception
Score
Statements 1 2 3 4 5
1 The taste of this instant noodle is better than other instant noodles.

73
2 Indofood instant noodle sauces are varied
3 The packaging of Indofood instant noodle are attractive
4 Indofood instant noodle are available in any supermarket
No
Learning
Score
Statements 1 2 3 4 5
1 I use a lot of time and effort to buy the best quality instant noodle.
2 The more instant noodle product information, the harder it seems to
choose the best.
3 The higher the price of a product, the better its quality.
4 I always get a good value when I purchase in this instant noodle.
No
Beliefs & Attitudes
Score
Statements 1 2 3 4 5
1 I usually buy low price instant noodles.
2 I am satisfied with the purchase of the instant noodles.
3 My standard and expectations on the quality of the instant noodles
I purchased are very high.
4 Nice packaging is very important for me.

74
No Customer Buying Decision Score
Statements 1 2 3 4 5
1 You decide to purchase Indofood‟s instant noodle products
because you need of instant noodle.
2 You choose our instant noodle products because you have seen its
advertisement in print ads or electronic ads.
3 You choose Indofood's instant noodles because Indofood can give
you more benefit, variety of taste, affordable and quality that you
want than others instant noodle products
4 You will purchase our instant noodles product again because you
feel satisfied.
Thank you for time and your cooperation. Your views are much appreciated!

75
APPENDIX B: DATA
Part A. RAW DATA OF QUESTIONNAIRES
Questions Q1 Q2 Q3 Q4 Q5 Q6 Q7 Q8 Q9 Q10 Q11 Q12 Q13 Q14 Q15 Q16 Q17 Q18 Q19 Q20
1 3 3 3 4 3 2 2 3 1 3 4 4 4 5 2 3 3 4 3 3
2 4 3 4 3 4 4 4 4 4 4 2 4 4 4 4 4 4 4 5 4
3 2 2 3 3 3 3 3 3 2 3 3 2 3 3 3 3 3 3 3 2
4 4 3 3 3 4 3 3 4 3 3 3 3 3 3 4 3 4 3 3 4
5 4 4 5 5 3 5 3 3 4 5 3 4 5 5 4 5 5 4 5 5
6 3 3 3 3 4 3 3 3 3 3 4 4 3 3 3 3 3 3 2 4
7 4 4 4 5 4 4 4 3 4 4 5 4 4 4 3 3 3 3 2 4
8 2 3 3 3 3 3 4 2 3 3 3 5 4 4 3 4 3 4 2 2
9 4 4 4 4 3 4 3 5 5 3 4 3 4 2 3 2 5 5 3 3
10 3 4 5 3 3 3 4 4 5 5 2 4 4 4 4 5 4 5 3 3
11 4 4 5 4 4 3 3 3 5 5 3 3 5 4 5 5 5 4 5 5
12 4 4 4 4 4 4 4 4 4 4 4 4 3 4 4 4 4 4 4 4
13 3 4 4 5 3 3 3 5 4 4 5 4 4 1 4 3 5 4 4 4
14 4 4 4 4 3 3 3 4 4 4 4 5 4 4 4 4 3 3 3 3
15 4 3 3 3 2 3 3 3 3 3 3 3 3 2 3 2 3 3 3 3
16 2 2 3 3 3 3 3 3 2 3 3 2 3 3 3 3 3 3 3 2
17 3 3 3 3 2 4 3 3 3 3 3 4 3 4 3 3 3 3 4 3
18 4 3 3 3 3 3 3 4 3 3 2 3 2 2 3 3 3 2 3 3

76
19 3 2 3 2 2 2 2 2 2 2 2 2 2 2 2 2 2 2 2 2
20 3 4 4 4 4 4 4 4 4 3 3 4 4 4 4 4 4 4 4 4
21 3 3 3 3 2 3 3 3 3 4 3 4 1 1 4 4 3 3 2 2
22 2 3 3 3 4 3 3 4 3 3 3 3 4 3 4 4 4 4 3 3
23 3 3 3 3 3 4 3 4 4 3 3 3 4 3 4 4 4 4 4 4
24 3 3 2 2 2 3 3 3 3 3 2 3 2 2 5 5 5 3 5 3
25 2 2 3 3 3 3 3 3 2 3 3 2 3 3 3 3 3 3 3 2
26 3 4 4 4 3 4 4 4 4 4 3 4 4 4 4 5 4 4 4 4
27 3 3 3 2 3 4 4 3 3 3 4 5 4 3 3 3 3 4 3 3
28 5 5 3 4 4 3 4 3 5 3 4 4 4 3 4 4 3 3 3 4
29 3 3 4 3 4 4 4 4 4 4 3 4 3 3 3 4 4 3 5 4
30 3 3 3 3 4 3 3 3 3 3 4 3 3 3 2 3 3 4 2 4
31 4 3 3 2 4 3 3 3 2 3 2 2 3 2 3 3 3 4 4 2
32 2 2 3 3 3 3 3 3 2 3 3 2 3 3 3 3 3 3 3 2
33 2 3 3 2 3 3 4 2 2 4 2 2 2 3 3 2 3 4 3 2
34 3 4 3 3 4 3 4 3 3 3 3 3 4 3 4 3 3 4 4 3
35 2 3 3 3 2 3 2 3 2 4 3 3 3 2 2 3 3 2 3 2
36 3 3 4 3 2 3 2 3 2 4 3 3 3 2 2 3 3 2 3 2
37 3 4 5 5 3 4 3 4 5 5 4 4 5 5 5 5 5 5 5 5
38 2 2 2 2 3 3 4 3 2 3 3 3 2 1 1 1 2 1 1 2
39 3 2 3 2 2 2 3 2 2 2 2 2 2 3 2 3 2 2 3 2
40 2 3 3 3 3 3 4 3 3 3 3 2 3 4 3 3 3 4 3 3
41 3 5 4 5 3 3 3 3 5 5 4 4 5 5 5 5 5 4 5 5

77
42 3 3 3 2 3 2 2 3 3 3 3 3 2 3 3 2 3 3 3 2
43 4 2 4 2 4 3 3 4 2 4 2 3 4 3 2 3 4 2 4 3
44 2 2 3 3 3 3 3 3 2 3 3 2 3 3 3 3 3 3 3 2
45 2 2 3 3 3 3 3 3 2 3 3 2 3 3 3 3 3 3 3 2
46 3 3 2 3 2 3 2 2 3 2 2 3 2 3 2 2 2 2 2 3
47 2 2 2 2 2 2 2 2 2 2 2 2 2 2 2 2 2 2 2 2
48 3 3 3 3 2 4 4 3 2 3 3 2 3 3 3 3 3 2 2 4
49 3 4 3 3 4 3 4 3 4 2 4 3 4 3 4 3 3 3 4 3
50 4 4 4 2 3 3 3 2 4 3 2 3 2 4 3 3 2 3 3 2
51 2 3 4 3 3 2 2 2 3 5 3 4 4 3 4 2 2 5 3 3
52 4 4 4 3 4 4 3 4 4 4 3 3 3 2 4 3 5 4 3 3
53 3 2 3 3 4 3 3 3 2 3 3 3 3 4 3 4 3 3 4 2
54 3 2 4 3 2 4 2 4 2 4 3 3 2 4 2 3 4 2 3 2
55 4 3 2 4 2 4 4 2 3 2 4 3 4 4 4 4 3 2 4 4
56 3 4 3 3 3 4 4 3 4 3 3 4 3 4 3 3 3 3 3 3
57 4 2 3 4 3 5 4 5 2 3 4 3 3 4 3 3 3 3 4 2
58 4 4 5 4 4 3 3 3 5 5 3 3 5 4 5 5 5 4 5 5
59 4 4 4 4 4 4 4 4 4 4 4 4 3 4 4 4 4 4 4 4
60 3 4 3 4 4 3 2 3 4 2 5 4 5 4 4 4 3 3 3 4
61 4 3 3 3 3 3 4 4 3 3 4 4 4 3 3 4 2 4 3 3
62 3 3 2 2 3 4 2 3 2 3 2 3 2 2 2 3 3 3 2 2
63 3 3 4 3 4 3 3 3 3 3 3 2 3 3 3 3 4 3 3 4
64 3 3 3 3 4 3 3 2 2 2 3 3 3 3 2 4 3 3 3 3

78
65 2 3 2 3 4 4 3 2 3 3 3 3 3 3 2 4 2 2 4 3
66 2 4 2 4 3 3 4 2 4 2 4 3 4 3 3 4 3 3 3 3
67 3 3 3 2 4 3 4 3 3 3 2 4 2 3 3 3 3 3 3 2
68 4 4 3 3 3 4 3 4 4 3 3 2 4 3 3 3 4 3 3 3
69 2 3 3 3 3 3 3 3 3 2 4 3 3 2 3 2 3 3 3 2
70 3 4 5 3 3 3 4 4 5 5 2 4 4 4 4 5 4 5 3 3
71 3 3 3 3 3 4 3 3 4 3 3 4 4 3 4 3 4 2 3 3
72 2 3 4 3 4 3 4 3 3 4 3 3 3 3 3 3 3 3 4 4
73 4 4 2 2 2 2 4 4 4 2 2 3 2 3 2 2 2 3 2 3
74 3 2 2 2 3 4 3 3 3 1 1 2 2 2 2 2 3 3 2 2
75 2 1 2 2 3 4 3 2 1 1 1 1 1 2 2 2 2 2 3 2
76 2 2 1 1 1 2 1 1 2 1 1 1 2 2 2 1 1 1 2 1
77 3 3 2 3 3 4 3 4 3 2 2 3 2 4 3 3 2 4 3 3
78 3 4 3 3 4 3 4 3 4 3 3 4 3 3 4 3 3 3 3 3
79 2 2 2 2 2 4 2 3 2 2 2 3 3 3 3 2 3 4 2 2
80 3 2 2 2 2 4 3 3 2 2 2 2 3 2 3 3 3 3 2 2
81 4 2 3 3 3 2 3 2 2 3 3 2 2 3 2 3 2 3 2 2
82 2 2 3 3 3 3 3 3 2 3 3 2 3 3 3 3 3 3 3 2
83 2 4 3 3 4 4 3 3 4 3 3 3 3 3 3 3 3 4 2 4
84 3 3 2 3 4 4 3 3 4 3 3 3 3 3 3 3 3 4 2 4
85 3 3 3 3 2 3 3 2 4 2 3 3 4 3 2 3 3 3 4 2
86 2 2 1 2 3 3 2 2 2 1 2 3 2 2 1 2 1 1 2 1
87 2 2 2 2 2 3 3 2 2 2 3 2 2 3 2 3 2 2 3 2

79
88 3 3 3 2 3 2 4 2 3 2 2 3 3 2 3 2 2 3 2 3
89 2 4 4 2 2 4 4 3 2 3 2 2 2 3 3 3 3 2 3 2
90 3 3 2 3 4 2 3 2 3 2 3 2 3 2 2 2 2 3 2 3
91 5 4 3 4 4 3 3 4 4 3 4 3 4 3 4 3 4 3 3 3
92 4 3 3 3 2 3 3 3 3 3 3 3 3 2 3 2 3 3 3 3
93 4 3 3 3 2 3 3 3 3 3 3 3 3 2 3 2 3 3 3 3
94 2 1 2 2 1 2 1 2 1 2 2 2 2 1 2 1 2 2 2 2
95 4 3 4 4 3 4 4 2 3 3 3 3 3 3 3 3 3 4 4 4
96 2 2 3 2 3 4 2 2 2 3 2 4 3 2 3 2 2 2 3 3
97 3 2 2 2 3 2 1 3 1 2 2 2 2 3 3 3 3 2 2 2
98 4 4 4 2 3 3 3 2 4 3 2 3 2 4 3 3 2 3 3 2
99 4 4 4 4 4 4 4 4 4 4 4 4 3 4 4 4 4 4 4 4
100 4 4 4 2 3 4 4 3 4 3 2 3 2 4 3 3 2 3 3 2

80
Part B. Partial Validity test
Correlation between Q1,Q2,Q3,Q4 and X1
Correlations
Q1 Q2 Q3 Q4 X1
Q1
Pearson Correlation 1 .604** .135 .383
* .784
**
Sig. (2-tailed) .000 .478 .036 .000
N 30 30 30 30 30
Q2
Pearson Correlation .604** 1 .056 .389
* .714
**
Sig. (2-tailed) .000 .769 .034 .000
N 30 30 30 30 30
Q3
Pearson Correlation .135 .056 1 .356 .541**
Sig. (2-tailed) .478 .769 .053 .002
N 30 30 30 30 30
Q4
Pearson Correlation .383* .389
* .356 1 .758
**
Sig. (2-tailed) .036 .034 .053 .000
N 30 30 30 30 30
X1
Pearson Correlation .784** .714
** .541
** .758
** 1
Sig. (2-tailed) .000 .000 .002 .000
N 30 30 30 30 30
**. Correlation is significant at the 0.01 level (2-tailed).
*. Correlation is significant at the 0.05 level (2-tailed).

81
Correlation between Q5,Q6,Q7,Q8 and X2
Correlations
Q5 Q6 Q7 Q8 X2
Q5
Pearson Correlation 1 .219 .447* .292 .699
**
Sig. (2-tailed) .245 .013 .118 .000
N 30 30 30 30 30
Q6
Pearson Correlation .219 1 .567** .334 .730
**
Sig. (2-tailed) .245 .001 .071 .000
N 30 30 30 30 30
Q7
Pearson Correlation .447* .567
** 1 .206 .748
**
Sig. (2-tailed) .013 .001 .275 .000
N 30 30 30 30 30
Q8
Pearson Correlation .292 .334 .206 1 .670**
Sig. (2-tailed) .118 .071 .275 .000
N 30 30 30 30 30
X2
Pearson Correlation .699** .730
** .748
** .670
** 1
Sig. (2-tailed) .000 .000 .000 .000
N 30 30 30 30 30
*. Correlation is significant at the 0.05 level (2-tailed).
**. Correlation is significant at the 0.01 level (2-tailed).

82
Correlation between Q9,Q10,Q11,Q12 and X3
Correlations
Q9 Q10 Q11 Q12 X3
Q9
Pearson Correlation 1 .671** .350 .410
* .744
**
Sig. (2-tailed) .000 .058 .025 .000
N 30 30 30 30 30
Q10
Pearson Correlation .671** 1 .592
** .696
** .903
**
Sig. (2-tailed) .000 .001 .000 .000
N 30 30 30 30 30
Q11
Pearson Correlation .350 .592** 1 .634
** .782
**
Sig. (2-tailed) .058 .001 .000 .000
N 30 30 30 30 30
Q12
Pearson Correlation .410* .696
** .634
** 1 .843
**
Sig. (2-tailed) .025 .000 .000 .000
N 30 30 30 30 30
X3
Pearson Correlation .744** .903
** .782
** .843
** 1
Sig. (2-tailed) .000 .000 .000 .000
N 30 30 30 30 30
**. Correlation is significant at the 0.01 level (2-tailed).
*. Correlation is significant at the 0.05 level (2-tailed).

83
Correlation between Q13,Q14,Q15,Q16 and X4
Correlations
Q13 Q14 Q15 Q16 X4
Q13
Pearson Correlation 1 .634** .244 .327 .759
**
Sig. (2-tailed) .000 .193 .078 .000
N 30 30 30 30 30
Q14
Pearson Correlation .634** 1 .029 .421
* .745
**
Sig. (2-tailed) .000 .879 .021 .000
N 30 30 30 30 30
Q15
Pearson Correlation .244 .029 1 .746** .634
**
Sig. (2-tailed) .193 .879 .000 .000
N 30 30 30 30 30
Q16
Pearson Correlation .327 .421* .746
** 1 .823
**
Sig. (2-tailed) .078 .021 .000 .000
N 30 30 30 30 30
X4
Pearson Correlation .759** .745
** .634
** .823
** 1
Sig. (2-tailed) .000 .000 .000 .000
N 30 30 30 30 30
**. Correlation is significant at the 0.01 level (2-tailed).
*. Correlation is significant at the 0.05 level (2-tailed).

84
Correlation between Q17,Q18,Q19,Q20 and Y
Correlations
Q17 Q18 Q19 Q20 Y
Q17
Pearson Correlation 1 .580** .725
** .575
** .909
**
Sig. (2-tailed) .001 .000 .001 .000
N 30 30 30 30 30
Q18
Pearson Correlation .580** 1 .237 .320 .635
**
Sig. (2-tailed) .001 .207 .085 .000
N 30 30 30 30 30
Q19
Pearson Correlation .725** .237 1 .536
** .823
**
Sig. (2-tailed) .000 .207 .002 .000
N 30 30 30 30 30
Q20
Pearson Correlation .575** .320 .536
** 1 .781
**
Sig. (2-tailed) .001 .085 .002 .000
N 30 30 30 30 30
Y
Pearson Correlation .909** .635
** .823
** .781
** 1
Sig. (2-tailed) .000 .000 .000 .000
N 30 30 30 30 30
**. Correlation is significant at the 0.01 level (2-tailed).

85
TABLE OF CRITICAL VALUES FOR PEARSON’S “r”

86