Analysis of production and environmental effects of Nile tilapia and white shrimp ... et al 2014...
14
Review Analysis of production and environmental effects of Nile tilapia and white shrimp culture in Thailand J.G. Ferreira a, ⁎, L. Falconer b , J. Kittiwanich c , L. Ross b , C. Saurel d , K. Wellman e , C.B. Zhu f , P. Suvanachai c a New University of Lisbon, DCEA, FCT, Portugal b Stirling University, Institute of Aquaculture, Scotland, United Kingdom c Department of Fisheries, Bangkok, Thailand d Danish Shellfish Center, DTUAqua, Øroddevej 80, 7900 Nykøbing Mors, Denmark e Northern Economics, Seattle, USA f South China Sea Fisheries Research Institute, Chinese Academy of Fisheries Sciences, China abstract article info Article history: Received 1 February 2014 Received in revised form 27 August 2014 Accepted 28 August 2014 Available online xxxx Keywords: Nile tilapia white shrimp growth and environmental effects models GIS economic impact IMTA Two case studies from Southeast Asia are used to analyse production, environmental effects, and economic opti- misation of Nile tilapia (Oreochromis niloticus) and white shrimp (Penaeus vannamei) pond culture. A projection of these data is made for the whole of Thailand. The results are analysed on a regional scale based on site selection using multi-criteria evaluation (MCE). Farm-scale culture was simulated for (i) tilapia monoculture in Chiang Rai; (ii) shrimp monoculture in Chanthaburi; and (iii) Integrated Multi-Trophic Aquaculture (IMTA) of tilapia and shrimp in Chon Buri. Together, these provinces produced 17,500 tonnes of tilapia in 2012, with a significant proportion exported to North America and Europe. Growth models for both species were developed, calibrated, and validated, and used to simulate population dynam- ics of cultivated animals, and sediment diagenesis and eutrophication in ponds. Co-cultivation stimulates nitrogen dissolution (134 kg N cycle -1 ), which is greater than in tilapia (96 kg N) or shrimp (52 kg N) monoculture, and doubles the NH 4 + discharge to the environment (10.7 kg in tilapia monoculture, 20.5 kg in co-cultivation). However, eutrophication as a result of shrimp monoculture decreases sharply\chlorophyll emissions fall from 0.17 kg to 0.02 kg. A modelled IMTA scenario including the green seaweed Ulva reduced NH 4 + outflow to 0.32 kg cycle -1 . Scaling to the national level, for a 2010 production of 158,293 t y -1 (tilapia), and 553,899 t y -1 (shrimp), gives calculated emissions of 2,105,118 and 34,904 Population Equivalents (PEQ) respectively. Only part is a negative externality, because rural agro-aqua systems in Thailand reuse discharges in holding ponds, rice culture, etc. Commercial tilapia and shrimp aquaculture have a value added share of total GDP of 0.38, and value added of 96.24, resulting in indirect impacts of the industry on the Thai economy of $35 million, and the creation of 16,000 additional jobs. The MCE scenario analysis suggests sustainable expansion is possible for both species. The highly suitable class for tilapia would triple in the dry season, but halve in the rainy season. For shrimp the corresponding areas would decrease in both seasons. However, the suitable class is two orders of magnitude greater than the current level of tilapia farming, and shrimp could increase tenfold (limited by the rainy season due to low salinity). These pro- jections which are constrained by competing land claims, will be further influenced by socio-economic factors, and would depend upon national or regional policy decisions. These models, together with economic indicators developed for the aquaculture industry in Thailand, provide an overview of this important contributor to world aquaculture, which has a volume production greater than both the US and EU, and explore some of the lessons that may be learnt worldwide at both the local and national scales. © 2014 Elsevier B.V. All rights reserved. Contents 1. Introduction . . . . . . . . . . . . . . . . . . . . . . . . . . . . . . . . . . . . . . . . . . . . . . . . . . . . . . . . . . . . . . . 0 2. Methodology . . . . . . . . . . . . . . . . . . . . . . . . . . . . . . . . . . . . . . . . . . . . . . . . . . . . . . . . . . . . . . 0 2.1. Overview . . . . . . . . . . . . . . . . . . . . . . . . . . . . . . . . . . . . . . . . . . . . . . . . . . . . . . . . . . . . . 0 2.2. Study area . . . . . . . . . . . . . . . . . . . . . . . . . . . . . . . . . . . . . . . . . . . . . . . . . . . . . . . . . . . . 0 Aquaculture xxx (2014) xxx–xxx ⁎ Corresponding author. AQUA-631326; No of Pages 14 http://dx.doi.org/10.1016/j.aquaculture.2014.08.042 0044-8486/© 2014 Elsevier B.V. All rights reserved. Contents lists available at ScienceDirect Aquaculture journal homepage: www.elsevier.com/locate/aqua-online Please cite this article as: Ferreira, J.G., et al., Analysis of production and environmental effects of Nile tilapia and white shrimp culture in Thailand, Aquaculture (2014), http://dx.doi.org/10.1016/j.aquaculture.2014.08.042
Transcript of Analysis of production and environmental effects of Nile tilapia and white shrimp ... et al 2014...

Aquaculture xxx (2014) xxx–xxx
AQUA-631326; No of Pages 14
Contents lists available at ScienceDirect
Aquaculture
j ourna l homepage: www.e lsev ie r .com/ locate /aqua-on l ine
Review
Analysis of production and environmental effects of Nile tilapia andwhite shrimp culture in Thailand
J.G. Ferreira a,⁎, L. Falconer b, J. Kittiwanich c, L. Ross b, C. Saurel d, K. Wellman e, C.B. Zhu f, P. Suvanachai c
a New University of Lisbon, DCEA, FCT, Portugalb Stirling University, Institute of Aquaculture, Scotland, United Kingdomc Department of Fisheries, Bangkok, Thailandd Danish Shellfish Center, DTUAqua, Øroddevej 80, 7900 Nykøbing Mors, Denmarke Northern Economics, Seattle, USAf South China Sea Fisheries Research Institute, Chinese Academy of Fisheries Sciences, China
⁎ Corresponding author.
http://dx.doi.org/10.1016/j.aquaculture.2014.08.0420044-8486/© 2014 Elsevier B.V. All rights reserved.
Please cite this article as: Ferreira, J.G., et al., AAquaculture (2014), http://dx.doi.org/10.101
a b s t r a c t
a r t i c l e i n f oArticle history:Received 1 February 2014Received in revised form 27 August 2014Accepted 28 August 2014Available online xxxx
Keywords:Nile tilapiawhite shrimpgrowth and environmental effects modelsGISeconomic impactIMTA
Two case studies from Southeast Asia are used to analyse production, environmental effects, and economic opti-misation of Nile tilapia (Oreochromis niloticus) and white shrimp (Penaeus vannamei) pond culture. A projectionof these data ismade for thewhole of Thailand. The results are analysed on a regional scale based on site selectionusing multi-criteria evaluation (MCE).Farm-scale culturewas simulated for (i) tilapiamonoculture inChiangRai; (ii) shrimpmonoculture inChanthaburi;and (iii) IntegratedMulti-Trophic Aquaculture (IMTA) of tilapia and shrimp in Chon Buri. Together, these provincesproduced 17,500 tonnes of tilapia in 2012, with a significant proportion exported to North America and Europe.Growthmodels for both specieswere developed, calibrated, and validated, and used to simulate population dynam-ics of cultivated animals, and sediment diagenesis and eutrophication in ponds. Co-cultivation stimulates nitrogendissolution (134 kg N cycle−1), which is greater than in tilapia (96 kg N) or shrimp (52 kg N) monoculture, anddoubles theNH4
+discharge to the environment (10.7 kg in tilapiamonoculture, 20.5 kg in co-cultivation). However,eutrophication as a result of shrimp monoculture decreases sharply\chlorophyll emissions fall from 0.17 kg to0.02 kg. A modelled IMTA scenario including the green seaweed Ulva reduced NH4
+ outflow to 0.32 kg cycle−1.Scaling to the national level, for a 2010 production of 158,293 t y−1 (tilapia), and 553,899 t y−1 (shrimp), givescalculated emissions of 2,105,118 and 34,904 Population Equivalents (PEQ) respectively. Only part is a negativeexternality, because rural agro-aqua systems in Thailand reuse discharges in holding ponds, rice culture, etc.Commercial tilapia and shrimp aquaculture have a value added share of total GDP of 0.38, and value added of96.24, resulting in indirect impacts of the industry on the Thai economy of $35 million, and the creation of16,000 additional jobs.TheMCE scenario analysis suggests sustainable expansion is possible for both species. The highly suitable class fortilapia would triple in the dry season, but halve in the rainy season. For shrimp the corresponding areas woulddecrease in both seasons. However, the suitable class is two orders of magnitude greater than the current levelof tilapia farming, and shrimp could increase tenfold (limited by the rainy season due to low salinity). These pro-jections which are constrained by competing land claims, will be further influenced by socio-economic factors,and would depend upon national or regional policy decisions.Thesemodels, together with economic indicators developed for the aquaculture industry in Thailand, provide anoverview of this important contributor to world aquaculture, which has a volume production greater than boththeUS and EU, and explore some of the lessons thatmay be learntworldwide at both the local and national scales.
© 2014 Elsevier B.V. All rights reserved.
Contents
1. Introduction . . . . . . . . . . . . . . . . . . . . . . . . . . . . . . . . . . . . . . . . . . . . . . . . . . . . . . . . . . . . . . . 02. Methodology . . . . . . . . . . . . . . . . . . . . . . . . . . . . . . . . . . . . . . . . . . . . . . . . . . . . . . . . . . . . . . 0
2.1. Overview . . . . . . . . . . . . . . . . . . . . . . . . . . . . . . . . . . . . . . . . . . . . . . . . . . . . . . . . . . . . . 02.2. Study area . . . . . . . . . . . . . . . . . . . . . . . . . . . . . . . . . . . . . . . . . . . . . . . . . . . . . . . . . . . . 0
nalysis of production and environmental effects of Nile tilapia andwhite shrimp culture in Thailand,6/j.aquaculture.2014.08.042

2 J.G. Ferreira et al. / Aquaculture xxx (2014) xxx–xxx
2.3. Individual and population models for cultivated species . . . . . . . . . . . . . . . . . . . . . . . . . . . . . . . . . . . . . . . . 02.4. Site selection models . . . . . . . . . . . . . . . . . . . . . . . . . . . . . . . . . . . . . . . . . . . . . . . . . . . . . . . . 0
3. Results and discussion . . . . . . . . . . . . . . . . . . . . . . . . . . . . . . . . . . . . . . . . . . . . . . . . . . . . . . . . . . 03.1. Farm-scale models . . . . . . . . . . . . . . . . . . . . . . . . . . . . . . . . . . . . . . . . . . . . . . . . . . . . . . . . . 03.2. Upscaling to the national level . . . . . . . . . . . . . . . . . . . . . . . . . . . . . . . . . . . . . . . . . . . . . . . . . . . 0
3.2.1. Environmental effects . . . . . . . . . . . . . . . . . . . . . . . . . . . . . . . . . . . . . . . . . . . . . . . . . . . 03.2.2. Economic impacts . . . . . . . . . . . . . . . . . . . . . . . . . . . . . . . . . . . . . . . . . . . . . . . . . . . . . 03.2.3. Site suitability models . . . . . . . . . . . . . . . . . . . . . . . . . . . . . . . . . . . . . . . . . . . . . . . . . . . 03.2.4. Comparison of present and potential aquaculture in the regional test area . . . . . . . . . . . . . . . . . . . . . . . . . . . 0
4. Conclusions . . . . . . . . . . . . . . . . . . . . . . . . . . . . . . . . . . . . . . . . . . . . . . . . . . . . . . . . . . . . . . . 0Acknowledgements . . . . . . . . . . . . . . . . . . . . . . . . . . . . . . . . . . . . . . . . . . . . . . . . . . . . . . . . . . . . . . 0References . . . . . . . . . . . . . . . . . . . . . . . . . . . . . . . . . . . . . . . . . . . . . . . . . . . . . . . . . . . . . . . . . . 0
1 . Introduction
Carrying capacity and site selection for aquaculture have receivedincreasing attention over the past decade (e.g. Aguilar-Manjarrez andNath, 1998; Pcbérez et al., 2003; Ross et al., 2013; Silva et al., 2011).This focus has been sharpened by the recent paradigm shift in aquaticfood production, when the harvest of cultivated species overtookcapture fisheries for direct human consumption (Bostock et al., 2010;Ferreira et al., 2013a). In addition, there is an accepted need to substan-tially increase the world supply of aquatic foodstuffs (Costa-Pierce,2002; FAO/NACA, 2012; Godfray et al., 2010) to meet an extra annualdemand of 30 million metric tonnes1 by 2050\this represents a 25%rise in global production, but effectively corresponds to 50% growth inthe aquaculture segment, because capture fisheries have been flatliningfor decades (e.g. FAO, 2012; Pauly et al., 1998; Watson et al., 2001).
Policy-makers recognize that aquaculture must expand significantly(e.g. Diana et al., 2013; Godfray et al., 2010), and scientists and man-agers have been systematically developing (Broch et al., 2013; Cromeyet al., 2002; Ferreira et al., 2007; Stigebrandt, 2011; Stigebrandt et al.,2004) and applying (Nunes et al., 2011, Falconer et al., 2013; Saurelet al., 2014; Zhang et al., 2009) the tools needed to evaluate how this ex-pansion can occur in a sustainable manner, using accepted frameworkssuch as the FAO Ecosystem Approach to Aquaculture (EAA—FAO, 2010).
Although Europe and North America have put in place policies suchas the EU aquaculture strategy (2009, http://ec.europa.eu/fisheries/cfp/aquaculture/strategy/index_en.htm) and the U.S. National aquaculturepolicy (2011, http://www.nmfs.noaa.gov/trade/DOCAQpolicy.htm),the regulatory climate in both regions remains a substantial barrier toaquaculture development. As a consequence, the EU presently imports74% of its aquatic products, while the U.S. imports 84% (FAO, 2012).This is a liability with respect to job creation and balance of trade, andwill tend to becomemore acute due to the dietary shift promoted in de-veloped countries, which creates higher demand for aquatic products.
Furthermore, the nations or regions where the majority of thoseproducts originate, i.e. China, SE Asia, and South/Central America, willinternally consume a higher proportion of their production as per capitaGDP increases and aquatic products become more generally affordable,thereby constraining exports and further increasing prices in the majorimport markets.
Most of the cultivated finfish production worldwide takes placein ponds and reservoirs, for species such as carp, tilapia (mostly Niletilapia,Oreochromis nilocticus), and barramundi (Lates calcifer). In paral-lel, a substantial biomass of shrimp (mainly white shrimp, Penaeusvannamei) is also reared in pond culture. Despite the fact that 70% ofaquaculture takes place on land, in developing nations, the bulk of siteselection and carrying capacity studies have been executed for openwater systems,mainly in thewesternworld, and typically for bays or es-tuaries where stocking density is constrained by social carrying capacity(Ferreira et al., 2013b; Inglis et al., 2000; Mckindsey et al., 2006).
1 All tonnage is expressed in metric tons (tonnes).
Please cite this article as: Ferreira, J.G., et al., Analysis of production and envAquaculture (2014), http://dx.doi.org/10.1016/j.aquaculture.2014.08.042
This asymmetry between the developed and developing nationsoccurs for various reasons, including (in the former) higher dataavailability, access to more sophisticated simulation tools, and greaterregulatory and societal concerns about sustainability\it is thereforeimportant that state-of-the-art instruments be used to promotethe EAA in the parts of the world where it is most needed, i.e. thosewith both substantial aquaculture production and growth potential.
Our aim is to contribute to this broader worldwide assessment ofboth carrying capacity and site selection by analysing one of the majorproducing countries, the Kingdom of Thailand. This nation is consideredan example in SE Asia of proactive development of aquaculture, both interms of production and in its approach to environmental sustainability(Yamprayoon and Sukhumparnich, 2010). Pond culture of Nile tilapiaandwhite shrimp in Thailand represents a combined annual productionof over 770,000 t\overall, inland culture is in excess of 1,000,000 t y−1,roughly the same as the entire E.U. and double that of the U.S. (Table 1).The production data can be normalized on a per capita or an area basis(Table 2), and illustrate how these ratios differ by 1–2 orders of magni-tude between Asia and Western nations.
Tilapia production in Thailand has been mostly targeted at the do-mestic market, whereas white shrimp are produced mainly for export(Fig. 1). However, a number of the tilapia farms visited during thiswork are increasingly focused on export, which required significantchanges to culture practice, and approval by international certificationbodies (Yamprayoon and Sukhumparnich, 2010). The export destina-tions for these products (Fig. 1) illustrate the global nature of themarket\for both species studied, over 50% of exports are destined forEurope and the United States.
The main objectives of this work are to:
1. Use detailed information for different types of tilapia and shrimppond culture in Thailand, including cultivation of both species inIntegrated Multi-Trophic Aquaculture (IMTA), to evaluate regionalproduction and environmental effects;
2. Perform a regional site selection analysis and use the results to pro-ject sustainable aquaculture growth;
3. Determine the ecological and economic impacts of these key seg-ments of aquaculture for the whole of the country;
4. Discuss the results obtained in the context of future development ofworld aquaculture.
2 . Methodology
2.1 . Overview
Our analysis was developed in the following steps, which will bereviewed in detail below.
1. Assess production and environmental effects at the pond scale forNile tilapia and white shrimp bymeans of individual and populationmodels, combined in the Farm Aquaculture Resource Management(FARM) model;
ironmental effects of Nile tilapia andwhite shrimp culture in Thailand,
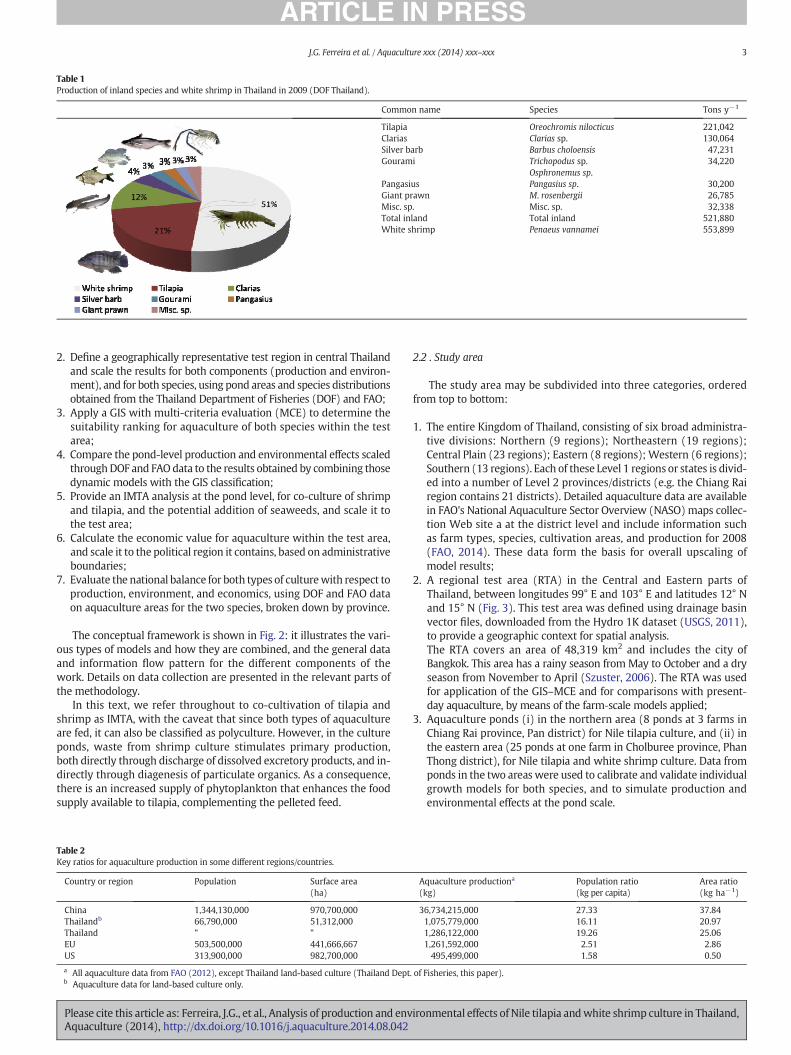
Table 1Production of inland species and white shrimp in Thailand in 2009 (DOF Thailand).
Common name Species Tons y−1
Tilapia Oreochromis nilocticus 221,042Clarias Clarias sp. 130,064Silver barb Barbus choloensis 47,231Gourami Trichopodus sp.
Osphronemus sp.34,220
Pangasius Pangasius sp. 30,200Giant prawn M. rosenbergii 26,785Misc. sp. Misc. sp. 32,338Total inland Total inland 521,880White shrimp Penaeus vannamei 553,899
3J.G. Ferreira et al. / Aquaculture xxx (2014) xxx–xxx
2. Define a geographically representative test region in central Thailandand scale the results for both components (production and environ-ment), and for both species, using pond areas and species distributionsobtained from the Thailand Department of Fisheries (DOF) and FAO;
3. Apply a GIS with multi-criteria evaluation (MCE) to determine thesuitability ranking for aquaculture of both species within the testarea;
4. Compare the pond-level production and environmental effects scaledthroughDOF and FAO data to the results obtained by combining thosedynamic models with the GIS classification;
5. Provide an IMTA analysis at the pond level, for co-culture of shrimpand tilapia, and the potential addition of seaweeds, and scale it tothe test area;
6. Calculate the economic value for aquaculture within the test area,and scale it to the political region it contains, based on administrativeboundaries;
7. Evaluate the national balance for both types of culturewith respect toproduction, environment, and economics, using DOF and FAO dataon aquaculture areas for the two species, broken down by province.
The conceptual framework is shown in Fig. 2: it illustrates the vari-ous types of models and how they are combined, and the general dataand information flow pattern for the different components of thework. Details on data collection are presented in the relevant parts ofthe methodology.
In this text, we refer throughout to co-cultivation of tilapia andshrimp as IMTA, with the caveat that since both types of aquacultureare fed, it can also be classified as polyculture. However, in the cultureponds, waste from shrimp culture stimulates primary production,both directly through discharge of dissolved excretory products, and in-directly through diagenesis of particulate organics. As a consequence,there is an increased supply of phytoplankton that enhances the foodsupply available to tilapia, complementing the pelleted feed.
Table 2Key ratios for aquaculture production in some different regions/countries.
Country or region Population Surface area(ha)
China 1,344,130,000 970,700,000Thailandb 66,790,000 51,312,000Thailand " "EU 503,500,000 441,666,667US 313,900,000 982,700,000
a All aquaculture data from FAO (2012), except Thailand land-based culture (Thailand Deptb Aquaculture data for land-based culture only.
Please cite this article as: Ferreira, J.G., et al., Analysis of production and envAquaculture (2014), http://dx.doi.org/10.1016/j.aquaculture.2014.08.042
2.2 . Study area
The study area may be subdivided into three categories, orderedfrom top to bottom:
1. The entire Kingdom of Thailand, consisting of six broad administra-tive divisions: Northern (9 regions); Northeastern (19 regions);Central Plain (23 regions); Eastern (8 regions); Western (6 regions);Southern (13 regions). Each of these Level 1 regions or states is divid-ed into a number of Level 2 provinces/districts (e.g. the Chiang Rairegion contains 21 districts). Detailed aquaculture data are availablein FAO's National Aquaculture Sector Overview (NASO)maps collec-tion Web site a at the district level and include information suchas farm types, species, cultivation areas, and production for 2008(FAO, 2014). These data form the basis for overall upscaling ofmodel results;
2. A regional test area (RTA) in the Central and Eastern parts ofThailand, between longitudes 99° E and 103° E and latitudes 12° Nand 15° N (Fig. 3). This test area was defined using drainage basinvector files, downloaded from the Hydro 1K dataset (USGS, 2011),to provide a geographic context for spatial analysis.The RTA covers an area of 48,319 km2 and includes the city ofBangkok. This area has a rainy season fromMay to October and a dryseason from November to April (Szuster, 2006). The RTA was usedfor application of the GIS–MCE and for comparisons with present‐day aquaculture, by means of the farm‐scale models applied;
3. Aquaculture ponds (i) in the northern area (8 ponds at 3 farms inChiang Rai province, Pan district) for Nile tilapia culture, and (ii) inthe eastern area (25 ponds at one farm in Cholburee province, PhanThong district), for Nile tilapia and white shrimp culture. Data fromponds in the two areas were used to calibrate and validate individualgrowth models for both species, and to simulate production andenvironmental effects at the pond scale.
Aquaculture productiona Population ratio Area ratio(kg) (kg per capita) (kg ha−1)
36,734,215,000 27.33 37.841,075,779,000 16.11 20.971,286,122,000 19.26 25.061,261,592,000 2.51 2.86495,499,000 1.58 0.50
. of Fisheries, this paper).
ironmental effects of Nile tilapia andwhite shrimp culture in Thailand,

Selection of model farms for tilapia and shrimp
Definition of culturepractice
Development of individual growth models
Integration in the FARM farm-scale model
Validation of production & analysis of externalities
Farm-scale economic analysis
GIS Multi-Criteria Evaluation (MCE) for regional site selection of aquaculture
Regional assessment of production, externalities, and economic indicators
Scaling
National assessment of production, externalities, and economic indicators
Comparisons
Fig. 2.Modelling framework for examining sustainability.
Fig. 3. Regional test area (RTA) in Eastern and Central Thailand for GIS spatial model (green) with administrative borders in black. This region was defined as a hydrological unit. (Forinterpretation of the references to colour in this figure legend, the reader is referred to the web version of this article.)
Fig. 1. Export of tilapia and white shrimp from Thailand.
4 J.G. Ferreira et al. / Aquaculture xxx (2014) xxx–xxx
Please cite this article as: Ferreira, J.G., et al., Analysis of production and environmental effects of Nile tilapia andwhite shrimp culture in Thailand,Aquaculture (2014), http://dx.doi.org/10.1016/j.aquaculture.2014.08.042

5J.G. Ferreira et al. / Aquaculture xxx (2014) xxx–xxx
2.3 . Individual and population models for cultivated species
The ‘Aqua’ series of models (http://www.longline.co.uk/site/products/aquaculture/) was used to simulate individual growth andenvironmental effects. The general approach of these models has beenpreviously described for finfish (Ferreira et al., 2012a) and penaeidshrimp (Franco et al., 2006; Zhu et al., 2007). The AquaFish model wasextended for Nile tilapia based on equations from Yang Yi (1999) fortemperature and dissolved oxygen effects on feeding, and temperatureeffects on basal metabolic rate; Likongwe et al. (1996) present com-bined results for the effect of salinity and temperature on feed conver-sion efficiency (FCR)\these were used to derive a quadratic functionto limit the feeding rate based on salinity (Eq. (1)):
σ ¼ 23:356þ 1:123S−0:1247S2
25:89
σ ¼ 0 if S N18:9
ð1Þ
where:
σ : salinity limitation factor 0−1ð Þ
S : salinity no unitsð Þ
Limits in Eq. (1)were obtained from the positive root and first deriv-ative of the equation.
Tilapia length (L) was calculated from biomass (W) following(Eq. (2)) (Gómez-Márquez et al., 2008):
W ¼ 0:1207L2:469 ð2Þ
Gastric evacuation was simulated based on experimental data fromRiche et al. (2004). The model additionally incorporates filtration of
Fig. 4. Validation of the AquaShrimp individu
Please cite this article as: Ferreira, J.G., et al., Analysis of production and envAquaculture (2014), http://dx.doi.org/10.1016/j.aquaculture.2014.08.042
phytoplankton by tilapia (Eq. (3)) following Perschbacher and Wendell(1993) and Turker et al. (2003).
FR ¼ 779:7W 1−e −0:0679αchlð Þ� �ð3Þ
where:
FR : Filtration rate mg POC h−1� �
α : Carbon to chlorophyll ratio 0:05 for C in g and chlorophyll in mgð Þ
chl : Chlorophyll mg m−3� �
A shrimp individual growthmodel based on Franco et al. (2006), andimproved by Zhu et al. (2007), taking into account experimental workon effects of ionic ratios in seawater (Zhu et al., 2004), and dissolvedoxygen (Zhang et al., 2006), was modified by applying a net energybalance approach, and calibrated to environmental conditions typicalof the ponds selected for this work.
This model had previously been validated for ponds in China wherebiomass data were available throughout the growth cycle (Fig. 4).
One of themain challenges in validating both individual growth andpopulationmodels is a reliable description of culture practice. Extensivesurveys were carried out during field missions to Thailand; these data,after verification of consistency among farms, were used both to vali-date growth end-points for individualmodels and farm-scalemodellingof production and environmental effects, carried out with the FARMmodel. An example of the type of information needed for applicationof these models is summarized in Fig. 5.
The individual models were used to establish that finfish andshrimp growth could be adequately reproduced, and that the environ-mental emissions of organic and inorganicmaterialswere appropriately
al white shrimp growth model in China.
ironmental effects of Nile tilapia andwhite shrimp culture in Thailand,

Fig. 5. Culture practice for IMTA in ponds in Chon Buri province, Eastern Thailand.
6 J.G. Ferreira et al. / Aquaculture xxx (2014) xxx–xxx
calculated. Overall mass and energy balances for the species of interest,over the full culture cycle, are extremely helpful for model verification.
Fig. 6 illustrates the mass balance for Nile tilapia, using growthdrivers for temperature, salinity, and chlorophyll (for the filter-feedingcomponent) measured monthly by DOF. The individual model showsthat an animal grown in a pond over a period of 167 days reaches a bio-mass of about 750 g, and a length of 34 cm; these values compare wellwith the reported harvest weight of 700–900 g for farms sampled inChiang Rai province, and 600–1000 g in Phan Thong district (ChonBuri). The FCR given by the individual model is always lower than forpopulation scale simulations in FARM because uneaten feed is nottaken into account. The energy budget helps verify how the modelorganism partitions catabolism, including the energy devoted to SpecificDynamic Action (SDA) and to locomotion.
Fig. 6. Mass balance for individ
Please cite this article as: Ferreira, J.G., et al., Analysis of production and envAquaculture (2014), http://dx.doi.org/10.1016/j.aquaculture.2014.08.042
The model also allows the determination of other derived parame-ters such as the Apparent Digestibility Coefficient (ADC) for nitrogen.Our tilapia model gives a value of 83%, at the low end of the range(μ = 88 ± 7%) determined experimentally by Moreau (1996).
Pond water quality data from DFO (Kittiwanich, pers. com) wereused to drive the individual and populationmodels. DFOmakes datasetsavailable through the website: http://www.pcd.go.th/download/en_water.cfm.
2.4 . Site selection models
The availability and suitability of the RTA for future developmentand expansion of aquaculture was assessed using GIS based models. Itshould be noted that these site suitability models have been developed
ual growth of Nile tilapia.
ironmental effects of Nile tilapia andwhite shrimp culture in Thailand,

Fig. 7. Structure of site suitability model.
7J.G. Ferreira et al. / Aquaculture xxx (2014) xxx–xxx
using the optimal values for production and indicate the most suitableareas to locate aquaculture on that basis. The models were designed tohelp decision makers select areas for development and to identifyareas which may be less than suitable and require extra support. Thestructure of the models is shown in Fig. 7 (Falconer, 2013).
There are four major submodels (Pond, Species, System and Access)which are added together, along with a constraints layer, to producethe final output; the overall site suitability model. The tiered approachrepresents the key stages in the decisionmaking process when evaluat-ing an area for an aquaculture pond; where are the physical locations apond could be established (Pond submodel), what species can befarmed within the area (Species submodel), could a sustainable systembe establishedwith regard towater availability (Systemsubmodel) and isthe location accessible to transport networks and urban centres (Accesssubmodel). This study focussed on tilapia and shrimp, however theframework can be used for multiple species and/or areas. Detailed infor-mation on model development is provided in Falconer (2013).
Table 3Model results and measured data for tilapia pond monoculture in Chiang Rai, Thailand.
Variable FARM model Farm data
Model inputsSeeding density 3.13 fish per m2
2 rai (3200 m2) pondsSeeding density (kg FW) 801.3 800
Model outputsProduction
Total (TPP) (kg TFW) 5115.6 5400Feed Conversion Ratio (FCR) 1.8 1.69
Environmental externalitiesOutflow of NH4
+ (kg N) 224.5 –
Outflow of chlorophyll (kg chl) 1.27 –
Profit and loss (USD)Income from aquaculture products 8747.69 9234
Total expenditure 7659.5 7388.28Feed cost 6276.77 6324Seed cost 969.25 967.7Energy cost 413.48 96.58
Farm Profit = Income–Expenditure 1088.19 1845.72
Please cite this article as: Ferreira, J.G., et al., Analysis of production and envAquaculture (2014), http://dx.doi.org/10.1016/j.aquaculture.2014.08.042
3 . Results and discussion
3.1. Farm-scale models
Model results for production, environmental effects, and economicperformance of tilapia pond culture are shown in Table 3.
Themodel is able to reproduce the harvestable biomass (Δ=−5%),and the slightly higher Feed Conversion Ratio (FCR) reflects this differ-ence. The economic performance for the farm is underestimated bythe model (Δ = −40%), partly because the simulated biomass yield isa little lower, but principally due to lower costs for aeration. FARMalso determines the negative externalities associated with the activity,which in this case correspond to emissions of over 200 kg of dissolvednitrogen and over 1 kg of chlorophyll, or about 50 kg of particulateorganic carbon (POC).
Fig. 8 (top) shows the fullmass balance for a 167 day cycle, aggregat-ed for an area of 8 rai2 (12,800m2), i.e. four identical culture ponds. Thetotal harvestable tilapia biomass is 22,943 kg (about 39 t ha−1 y−1), andthe dissolved and particulate waste drives a net primary production(NPP) of 102 kg N. If the phytoplankton filter-feeding is switchedoff in the model3 the harvestable biomass falls to 18,591 kg, the NPPdoubles (212 kg N cycle−1), and the resulting emission of chlorophyllincreases by a factor of 5.
Table 4 shows the financial structure of a typical tilapia farm inThailand. As a rule these are family-operated smallholdings, as is thecase also for shrimp farms (mean area of 0.3 ha, FAO/NACA, 2012),and therefore have reduced labour costs\in this case study, only 5% ofthe total expenditure. The remaining costs are feed, seed, and energyfor aeration. Cost estimates range from 74% of revenue (Table 4) to87% of revenue (Table 3, model).
Fig. 8 (bottom) shows a similar analysis for shrimp farming. As in thesimulation for tilapia, detailed environmental driver data, a validated in-dividual growthmodel, and harvest data were used to gauge themodelperformance. The simulated harvest of 4376 kg cycle−1 is higher than
2 The rai is the Thai unit for area, equivalent to 1600 m2.3 Results not shown.
ironmental effects of Nile tilapia andwhite shrimp culture in Thailand,

Fig. 8.Mass balance for pond culture. Top: Nile tilapia pond monoculture in Chiang Rai; bottom: white shrimp pond monoculture in Chanthaburi.
8 J.G. Ferreira et al. / Aquaculture xxx (2014) xxx–xxx
the declared production of 4000 kg. The FCR is about 20% higher in themodel (1.57), which is within themargin of error for simulations of thisnature, given the uncertainties in the measured data.
In parts of central Thailand, such as Chon Buri province, tilapia andshrimp are co-cultivated (Fig. 5), providing a double crop grown bothas polyculture (the two species are artificially fed) and IMTA (tilapiayield is enhanced by microalgal production partly driven by shrimpwaste products, and POC from tilapia provides food for benthic inverte-brates eaten by shrimp).
Fig. 9 shows a simulation of this co-culture (top), togetherwith a hy-pothetical addition of macroalgae (bottom), which would shift the
Table 4Financial structure of a typical tilapia (pond) farm in Thailand.
Economic indicators USD
Labour (household) 82.8Labour (seasonal) 54Total labour 136.56Total expenditures 2274.35Total revenue (income) 3064.32
Please cite this article as: Ferreira, J.G., et al., Analysis of production and envAquaculture (2014), http://dx.doi.org/10.1016/j.aquaculture.2014.08.042
system towards IMTA. The model uses the culture practice shown inFig. 5, but the environmental drivers available were the same as usedfor the standard shrimp monoculture, based on DOF data fromChanthaburi.
For a typical monoculture cycle, themodelled 2.5 rai (4000m2) farmproduces 3317 kg of tilapia, valued at 4140 USD. Fig. 9 (top) representsthe simulated mass balance for the first stage of the culture i.e. 81 daysof shrimp co-cultivation. An additional harvest of about 4 tonnes ofshrimp is obtained, a significant financial boost to the farmer, becauseshrimp farmgate prices are three times higher than for tilapia\totalrevenue becomes 18,277 USD.
The co-cultivation has both environmental costs and benefits. There isan increase in particulate organic sedimentation and diagenesis, resultingin a change in nitrogen regeneration from 137 kg N (for the 81 day sim-ulation) to 200 kg N. Co-cultivation thus stimulates nitrogen dissolution(134 kg N), which is greater than in tilapia (96 kg N) or shrimp(52 kg N) monoculture, and consequently doubles the NH4
+ dischargeto the environment (10.7 kg in tilapia monoculture, 20.5 kg in IMTA).
On the other hand, tilapia provide an effective top-down control ofprimary symptoms of eutrophication (sensu Bricker et al., 2003), with a
ironmental effects of Nile tilapia andwhite shrimp culture in Thailand,

Fig. 9.Mass balance for pond culture. Top: IntegratedMulti-Trophic Aquaculture of tilapia and shrimp in ponds, Chanthaburi; bottom IMTA of tilapia and shrimp, withmacroalgae added.
9J.G. Ferreira et al. / Aquaculture xxx (2014) xxx–xxx
decrease in NPP from 42 kg N in shrimp monoculture to 8 kg N in IMTA.Emissions of chlorophyll drop from0.17 kg to 0.02 kg as a consequence ofthis reduction.
Table 5Modelled environmental externalities from tilapia pond monoculture scaled to Thailand.
Region Tilapia harvest(t y−1)
Primary production(t N y−1)
Northern 36,004 179Northeastern 42,981 214Central plain 16,500 82Eastern 32,957 164Western 21,296 106Southern 8556 43Total 158,293 789RTAb (355 km2) 96,064 479RTA highly suitableDry season (914 km2) 247,304 1233Rainy season (135 km2) 36,527 182
a Population-Equivalent = 3.3 kg N y−1.b Estimated production from current area for tilapia cultivated in ponds.
Please cite this article as: Ferreira, J.G., et al., Analysis of production and envAquaculture (2014), http://dx.doi.org/10.1016/j.aquaculture.2014.08.042
A final scenario with the addition of seaweeds was simulated inFARM by adding Ulva to the culture setup, at a density of 50 ind. m−2.Seaweeds remove the dissolved nitrogen in the outflow (nutrient
Ammonia outflow(t N y−1)
Algal outflow(kg chl y−1)
Equivalent outflow(PEQa)
1580 8939 478,8101886 10,671 571,597724 4096 219,430
1446 8182 438,294935 5 287 283,206375 2 124 113,781
6947 39,299 2,105,1184216 23,849 1,277,547
10,853 61,397 3,288,8621603 9068 485,773
ironmental effects of Nile tilapia andwhite shrimp culture in Thailand,

Table 6Modelled environmental externalities from shrimp pond monoculture scaled to Thailand.
Region Shrimp harvest(t y−1)
Primary production(t N y−1)
Ammonia outflow(t N y−1)
Algal outflow(kg chl y−1)
Equivalent outflow(PEQ)
Central plain 170,975 1641 36 6642 10,774Eastern 41,143 395 9 1598 2593Western 43,063 413 9 1673 2714Southern 298,718 2867 62 11,605 18,824Total 553,899 5316 115 21,518 34,904RTAa (291 km2) 319,820 3070 67 12,424 20,154RTA highly suitableDry season (198 km2) 217,654 2089 45 8465 13,716Rainy season (39 km2) 42,871 411 9 1665 2702
a Estimated production from current area for shrimp cultivated in ponds.
Table 7Direct and indirect economic impacts scaled to Thailand.
Direct indicators Value
Total revenue (106 USD y−1) 253.27Total expenditure (106 USD y−1) 187.98Labour income (106 USD y−1) 10.4Percentage labour 5.5%Direct job creationa 400,000–
650,000Indirect indicatorsVAD ratio 0.38Value added (106 USD y−1) 96.24Indirect job creation determined from revenue (64 per 106 USD) 16,209Total revenue (106 USD y−1) 349.51Additional expenditure for internalization of 2,105,118 PEQ @30 USD (106 USD y−1)b
21.05
Gross profit (106 USD y−1) 65.29Profit taking into account externalities (106 USD y−1) 44.2
a Direct jobs considered (household + harvest): 500,000.b Assuming 1/3 of PEQ correspond to the externality, the rest being internalized in the
agri-aqua-system.
10 J.G. Ferreira et al. / Aquaculture xxx (2014) xxx–xxx
uptake: 218 kg N, or 298 PEQ y−1) and the simulated farm provides acombined crop of 4 t shrimp, 1 t tilapia, and 8 t seaweed for a 81 daycycle, with practically zero discharge.
Inorganic extraction by seaweeds has the twin effect of sharply re-ducing the NH4
+ effluent discharge from 20.5 kg to 0.32 kg, and halvingthe microalgal emissions. Presumably the latter benefit occurs becauseseaweeds outcompete phytoplankton for dissolved nutrients, in a simi-lar way to what is observed at the bay scale in Sanggou Bay, China,where the kelp Saccharina japonica mops up dissolved nutrients fromIMTA of Japanese seabass, Pacific oyster, and Chinese scallop (Xiaoet al., 2007).
3.2 . Upscaling to the national level
3.2.1 . Environmental effectsTilapia production in ponds is higher in the north of Thailand, and
the national harvest for 2010 is 158,293 t y−1. The environmentalexternalities simulated for tilapia and shrimp pond monoculturewere scaled up to all of Thailand (Tables 5 and 6): based on thepond-scale simulations, this corresponds to an aggregate emission of6947 t N y−1, or 2,105,118 PEQ, about a third of the population ofBangkok.
White shrimp aquaculture is located mainly in the central andsouthern parts of the country, due to its dependence on brackish orsaline water. The total production of 553,899 t y−1 corresponds to alower nitrogen emission, equivalent to 34,904 PEQ y−1. Althoughshrimp production is 3.5 times greater than that of tilapia, the totaloutflow of nitrogen from shrimp ponds is 60 times lower than fortilapia\this reflects differences in the culture practice, since waterrenewal in shrimp ponds is an order ofmagnitude lower than for tilapiaculture. In contrast, the outflow of algae is lower for tilapia ponds, partlybecause phytoplankton drawdown due to filter-feeding by the fish(Northcott et al., 1991; Perschbacher and Lorio, 1993) is simulated inthe model.
Although these environmental losses are high, reflecting the con-cerns associated with fed aquaculture (e.g. Burford and Williams,2001; Lacerda et al, 2006), their actual effects should be placed in thecontext of the tight coupling of rural activities in Thailand\much ofthe waste is recycled either within the aqua-system or in agriculture,whereas the remainder is not directly recycled:
(i) part of the discharge is stocked in other ponds for natural waterquality improvement and then re-used in aquaculture;
(ii) part of the discharge is used in agri-aqua, e.g. for rice cultivation;(iii) the remaining pond water is drained into rivers and canals, and
corresponds to the true environmental externalities of pondaquaculture in Thailand, resulting in nutrient enrichment, andconsequent eutrophication effects.
Further work is needed to evaluate the proportion of waste that istypically re-used, in order to assess the economic and environmentalcosts of tilapia and shrimp farming.
Please cite this article as: Ferreira, J.G., et al., Analysis of production and envAquaculture (2014), http://dx.doi.org/10.1016/j.aquaculture.2014.08.042
Eutrophication effects are more clearly visible in cage culture oftilapia in rivers, a practice that is increasingly regulated. In reservoirs,a spatial limit of occupation of 0.5% of the total surface area is imposedfor cage culture of tilapia, aimed at protectingwater resources and com-bating the spread of diseases e.g. caused by Aeromonas sp. (Cai et al,2004).
As for all cultured species, the production of tilapia and shrimp fluc-tuates interannually (Rico et al., 2013) due to market constraints, dis-ease, and other factors\the environmental externalities of culture willchange accordingly. An example of such challenges is the impact ofEarly Mortality Syndrome (EMS) on shrimp production throughout SEAsia; like other diseases, EMS can only be simulated as a stochasticevent, but in the case of Thailand the proportion of infected stock in2013 has already fallen by 44% with respect to 2012, largely due toDOF programmes centred on improvement of hatchery sanitary condi-tions, broodstock management, quality post-larvae (PL) production, PLscreening, and shrimp farm management. Different scenarios can bemodelled to project changes in externalities due to events such as EMS.
3.2.2 . Economic impactsFreshwater tilapia and shrimp aquaculture in Thailand production in
2010 (Table 7) amounted to 194,787 tonnes and 553,899 tonnes re-spectively with a total value of $25 million. In 2010, the total areas inproduction of freshwater inland aquaculture of tilapia and shrimpwere 71,990 and 50,388 ha respectively. Commercial tilapia and shrimpaquaculture employ approximately 400,000 to 650,000 labourers.While output from this subsector in quantity and value is small com-pared to the country's total fish production, data from the National Ac-counts of Thailand, 2012, reflects an increasing trend in productionand value over the past two decades. In addition, the current productionand revenues reflected only represent the direct economic effects to thecountry of Thailand from tilapia and shrimp aquaculture. Based on
ironmental effects of Nile tilapia andwhite shrimp culture in Thailand,

Fig. 10. Site suitability models for tilapia and shrimp monoculture in the dry and rainy seasons. Large water bodies in which ponds cannot be constructed are shown as WATER.
11J.G. Ferreira et al. / Aquaculture xxx (2014) xxx–xxx
estimates derived from expert elicitation and Thailand data sets wewere able to estimate the indirect effects and employment impacts. Be-cause Thailand does not have a national Input/Outputmodel such as theUnited States IMPLAN, these estimates were based on algorithms pre-sented in Hishamunda et al. (2009).
Our analysis suggests that commercial tilapia and shrimp aquacul-ture have a value added share of total Gross Domestic Product of 0.38,and value added of 96.24, resulting in indirect impacts of the industryto the Thailand economy of approximately $35million, and the creationof approximately 16 thousand additional jobs.
3.2.3 . Site suitability modelsThe results of the site suitability model for the RTA are shown in
Fig. 10. The suitability for tilapia decreases in the rainy season, largelydue to higher temperatures which are outside the optimal range forproduction.
There is also a decrease in the availability of suitable or highly suit-able areas for shrimp production in the rainy season—however, thecoastal area in the southeast of the RTA remains suitable in bothseasons. The model indicates there are significant areas available forinland shrimp culture, although the local regulations would have to beconsulted prior to development as the Thai government has placed amoratorium on shrimp farming in many inland locations (Roy et al.,2010).
Fig. 11 shows the areas that are suitable or highly suitable for bothtilapia and shrimp. As in Fig. 10, there are more suitable areas for
Please cite this article as: Ferreira, J.G., et al., Analysis of production and envAquaculture (2014), http://dx.doi.org/10.1016/j.aquaculture.2014.08.042
the culture of both species in the dry season than in the rainy season.Nevertheless, there is the potential for year-round production in suit-able or highly suitable areas across the RTA; particularly in the southeastas highlighted in Fig. 11A and B.
Table 8 shows the area covered by each category.
3.2.4 . Comparison of present and potential aquaculture in the regional testarea
The RTA includes 23 provinces and 198 districts. The current farmareas are 355.04 km2 for tilapia and 290.94 km2 for shrimp (DOF per-sonal communication). There are 15 IMTA farms covering 0.63 km2
(394 rai) in Panthong District, Chonburi Province, working with DOFstaff in order to reduce production costs.
Suitable culture areas during the dry season for tilapia, shrimp, andboth species combined, cover 55 to 60% of the RTA (without constraintssuch as urban area, large water bodies, or protected areas) (Table 8,Fig. 10). During the rainy season, the suitable area for tilapia aquacultureremains about 48% of the RTA, while shrimp and both species in IMTAcover only 12% of the RTA (Figs. 10 and 11). The highly suitable areasfor all combinations represent a small percentage, between b0.1% and2% (Table 8). There is a high potential to increase the current farmareas for both culture of tilapia and shrimp as they only represent 0.8and 0.7% of the RTA. The combined culture of both species is also verypromising as it covers less than 0.01% of the RTA (Table 8).
The MCE scenario analysis indicates optimum site suitability as wellas potential scope for sustainable expansion of aquaculture for both
ironmental effects of Nile tilapia andwhite shrimp culture in Thailand,
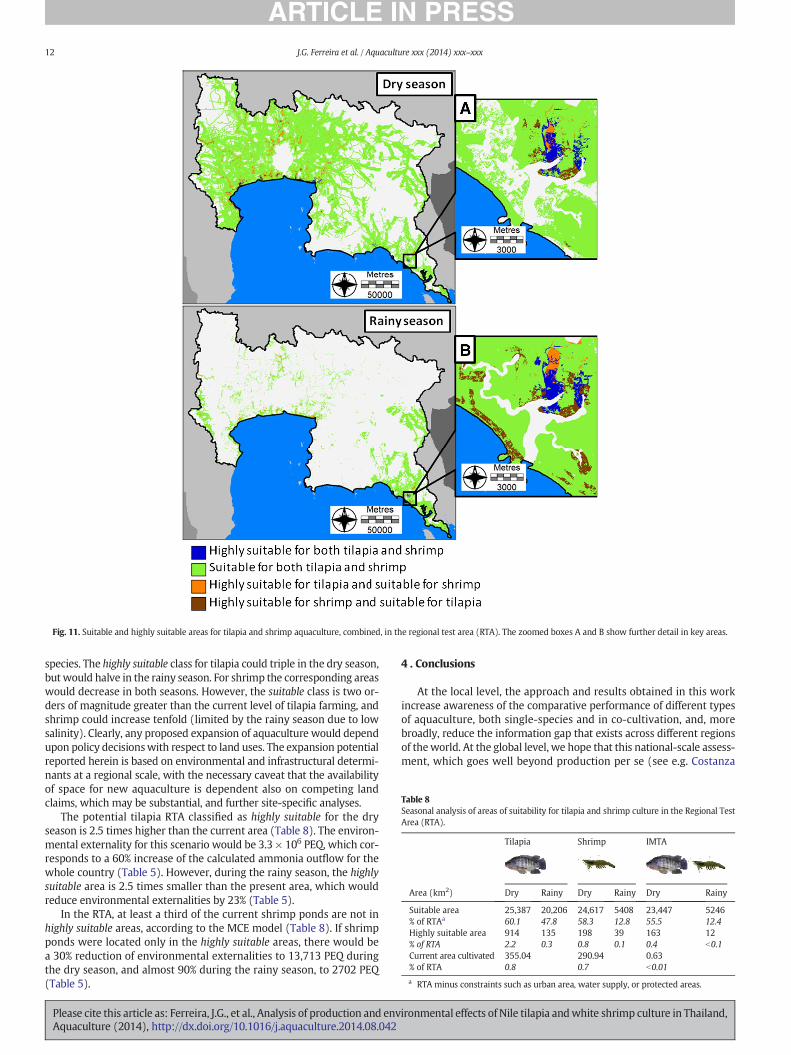
Table 8Seasonal analysis of areas of suitability for tilapia and shrimp culture in the Regional TestArea (RTA).
Tilapia Shrimp IMTA
Area (km2) Dry Rainy Dry Rainy Dry Rainy
Suitable area 25,387 20,206 24,617 5408 23,447 5246% of RTAa 60.1 47.8 58.3 12.8 55.5 12.4Highly suitable area 914 135 198 39 163 12% of RTA 2.2 0.3 0.8 0.1 0.4 b0.1Current area cultivated 355.04 290.94 0.63% of RTA 0.8 0.7 b0.01
a RTA minus constraints such as urban area, water supply, or protected areas.
Fig. 11. Suitable and highly suitable areas for tilapia and shrimp aquaculture, combined, in the regional test area (RTA). The zoomed boxes A and B show further detail in key areas.
12 J.G. Ferreira et al. / Aquaculture xxx (2014) xxx–xxx
species. The highly suitable class for tilapia could triple in the dry season,but would halve in the rainy season. For shrimp the corresponding areaswould decrease in both seasons. However, the suitable class is two or-ders of magnitude greater than the current level of tilapia farming, andshrimp could increase tenfold (limited by the rainy season due to lowsalinity). Clearly, any proposed expansion of aquaculture would dependupon policy decisionswith respect to land uses. The expansion potentialreported herein is based on environmental and infrastructural determi-nants at a regional scale, with the necessary caveat that the availabilityof space for new aquaculture is dependent also on competing landclaims, which may be substantial, and further site-specific analyses.
The potential tilapia RTA classified as highly suitable for the dryseason is 2.5 times higher than the current area (Table 8). The environ-mental externality for this scenario would be 3.3 × 10⁶ PEQ, which cor-responds to a 60% increase of the calculated ammonia outflow for thewhole country (Table 5). However, during the rainy season, the highlysuitable area is 2.5 times smaller than the present area, which wouldreduce environmental externalities by 23% (Table 5).
In the RTA, at least a third of the current shrimp ponds are not inhighly suitable areas, according to the MCE model (Table 8). If shrimpponds were located only in the highly suitable areas, there would bea 30% reduction of environmental externalities to 13,713 PEQ duringthe dry season, and almost 90% during the rainy season, to 2702 PEQ(Table 5).
Please cite this article as: Ferreira, J.G., et al., Analysis of production and envAquaculture (2014), http://dx.doi.org/10.1016/j.aquaculture.2014.08.042
4 . Conclusions
At the local level, the approach and results obtained in this workincrease awareness of the comparative performance of different typesof aquaculture, both single-species and in co-cultivation, and, morebroadly, reduce the information gap that exists across different regionsof theworld. At the global level, we hope that this national-scale assess-ment, which goes well beyond production per se (see e.g. Costanza
ironmental effects of Nile tilapia andwhite shrimp culture in Thailand,

13J.G. Ferreira et al. / Aquaculture xxx (2014) xxx–xxx
et al., 2014) may contribute to more integrated planning, as we lookforward to another 40 years of aquaculture.
Theworld debate on aquaculture is fuelled by a global food shortage,informed (and sometimes misinformed) by special interest groups(Little et al., 2011), and coloured by the fact that both Europe andNorth America now import 80–90% of their aquatic products.
By comparison to the major world aquaculture producers (90%comes from Asia, 60% from China\FAO, 2012), greater concerns existin Europe and North America with respect to sustainability (Ross et al.,2013), resulting in more stringent legislation and better governance.Consequently, the developed world largely imports aquatic productsfrom emerging economies, and exports jobs and negative externalities.
Due to the social and economic limitations, knowledge and modernresearchmeasures on sustainable development of aquaculture have notbeen widely applied in developing countries so far. After decades of fastgrowth in aquaculture, more and more severe environmental problems(e.g. pollution, diseases, water shortage etc.) have occurred in thesecountries, particularly in SE Asia including China, which are the majorproducers.
Despite recent developments such as the US NOAA AquacultureInitiative in 2011, and the European Maritime Fisheries Fund, both ofwhich promote aquaculture growth, it is difficult to envisage significantchanges in production in these regions over the next decade, due to acombination of territorial constraints, both for land and inshore waters,legislative barriers, and social opposition.
Given the extremely skewed distribution in world aquaculture pro-duction, the paradox is that Western nations in general have far moresophisticated tools to assess sustainability, and much greater resourcesto calibrate and validatemodels (see review in Ferreira et al, 2012b). Asa consequence, the relevant scientific literature often refers to studysites and production levels that are not representative of the globalaquaculture panorama; however they exemplify the application ofmodels and other tools that address spatial aspects, production, envi-ronmental, and economic outcomes of alternative cultivation strategies,and integrated catchment and coastal zone management\the chal-lenge therefore lies in making that knowledge available to stakeholdersin theworld's great producing nations, in order ensure that aquaculturegrowth is sustainable, and to avoid boom and bust events, which notonly play havoc in a globalized market, but are also responsible forsubstantial social costs.
Acknowledgements
The authors wish to acknowledge support from the FAO and theDepartment of Fisheries, Thailand for the assistance provided in theFAO project entitled “Aquaculture Information Management Systemin Thailand” (TCP/THA/3304), and are grateful to Miao Weimin,Siri Ekmaharaj, and Prawit Suraniranat, together with staff at DOFBangkok, Songkhla, and Chiang Rai, for their assistance in fieldwork. Inthis context we particularly thank Jose Aguilar-Manjarrez, who contrib-uted substantial comments on an earlier draft. Parts of this work wereinitiated in the FAO project and additional fundswere provided throughthe EU SEAT (GA 222889) project. Some sections on IMTA benefitedfrom work funded through the EU IDREEM (GA 308571) project. Weare grateful to Tony Farrell for physiological data on tilapia. The authorsthank three anonymous reviewers for their comments.
References
Aguilar-Manjarrez, J., Nath, S., 1998. A strategic reassessment of fish farming potential inAfrica. Food and Agriculture Organization of the United NationsCIFA Technical Paper32. FAO, Rome (170 pp.).
Bostock, J., McAndrew, Brendan, Richards, Randolph, Jauncey, Kim, Telfer, Trevor,Lorenzen, Kai, Little, David, Ross, Lindsay, Handisyde, Neil, Gatward, Iain, Corner,Richard, 2010. Aquaculture: global status and trends. Phil. Trans. R. Soc. B 365,2897–2912.
Bricker, S.B., Ferreira, J.G., Simas, T., 2003. An integrated methodology for assessment ofestuarine trophic status. Ecol. Model. 169 (1), 39–60.
Please cite this article as: Ferreira, J.G., et al., Analysis of production and envAquaculture (2014), http://dx.doi.org/10.1016/j.aquaculture.2014.08.042
Broch, O.J., Helene Ellingsen, Ingrid, Forbord, Silje, Wang, Xinxin, Volent, solt, OmholtAlver, Morten, Handå, Aleksander, Andresen, Kjersti, Slagstad, Dag, Inge Reitan,Kjell, Olsen, Yngvar, Skjerm, Jorunn, 2013. Modelling the cultivation and bioremedia-tion potential of the kelp Saccharina latissima in close proximity to an exposed salmonfarm in Norway. Aquac. Environ Interactions 4, 187–206.
Burford, M.A., Williams, K.C., 2001. The fate of nitrogenous waste from shrimp feeding.Aquaculture 198 (1–2), 79–93.
Cai, W.-Q., Li, S.-F., Ma, J.-Y., 2004. Diseases resistance of Nile tilapia (Oreochromisniloticus), blue tilapia (Oreochromis aureus) and their hybrid (female Nile tilapiamale blue tilapia) to Aeromonas sobria. Aquaculture 229, 79–87.
Costanza, R., Kubiszewski, I., Giovannini, E., Lovins, L.H., McGlade, J., Pickett, K.E.,Ragnarsdóttir, K.V., Roberts, D., De Vogli, R., Wilkinson, R., 2014. Time to leave GDPbehind. Nature 505, 283–285.
Costa-Pierce, B., 2002. Ecology as the paradigm for the future of aquaculture. In: Costa-Pierce, B. (Ed.), Ecological Aquaculture: The Evolution of the Blue Revolution. BlackwellScience, Oxford, UK, pp. 339–372.
Cromey, C.J., Nickell, T.D., Black, K.D., 2002. DEPOMOD—modelling the deposition andbiological effects of waste solids from marine cage farms. Aquaculture 214 (1–4),211–239.
Diana, J.S., Egna, H.S., Chopin, T., Peterson, M.S., Cao, L., Pomeroy, R., Verdegem, M., Slack,W.T., Bondad-Reantaso, M.G., Cabello, F., 2013. Responsible aquaculture in 2050:valuing local conditions and human innovations will be key to success. Bioscience63, 255–262.
Falconer, L., 2013. PhD thesis Spatial Modelling and GIS-based Decision Support Tools toEvaluate the Suitability of Sustainable Aquaculture Development in Large Catchments.University of Stirling, (312 pp.).
Falconer, L., Hunter, Donna-Claire, Scott, Philip C., Telfer, Trevor C., Ross, Lindsay G., 2013.Using physical environmental parameters and cage engineering design within GIS-based site suitability models for marine aquaculture. Aquac. Environ. Interactions 4,223–237.
FAO, 2010. Aquaculture development. 4. EcosystemApproach to AquacultureFAO TechnicalGuidelines for Responsible Fisheries 5. Suppl. 4, Rome (53 pp.).
FAO, 2012. The State of World Fisheries and Aquaculture (SOFIA). FAO, Rome 209 pp.FAO, 2014. National Aquaculture Sector OverviewMaps Collection [online], (Rome. [Cited
31 January 2014]. www.fao.org/fishery/naso-maps/naso-home/en/).FAO/NACA, 2012. Farming thewaters for people and food. In: Subasinghe, R.P., Arthur, J.R.,
Bartley, D.M., De Silva, S.S., Halwart, M., Hishamunda, N., Mohan, C.V., Sorgeloos, P.(Eds.), Proceedings of the Global Conference on Aquaculture 2010, Phuket, Thailand.22–25 September 2010. FAO, Rome and NACA, Bangkok (896 pp.).
Ferreira, J.G., Hawkins, A.J.S., Bricker, S.B., 2007. Management of productivity, environ-mental effects and profitability of shellfish aquaculture—the Farm AquacultureResource Management (FARM) model. Aquaculture 264, 160–174.
Ferreira, J.G., Saurel, C., Ferreira, J.M., 2012a. Cultivation of gilthead bream inmonocultureand integrated multi-trophic aquaculture. Analysis of production and environmentaleffects by means of the FARM model. Aquaculture 358–359 (2012), 23–34.
Ferreira, J.G., Aguilar-Manjarrez, J., Bacher, C., Black, K., Dong, S.L., Grant, J., Hofmann, E.,Kapetsky, J., Leung, P.S., Pastres, R., Strand, Ø., Zhu, C.B., 2012b. Progressing aquaculturethrough virtual technology and decision-support tools for novel management. In:Subasinghe, R.P., Arthur, J.R., Bartley, D.M., De Silva, S.S., Halwart, M., Hishamunda, N.,Mohan, C.V., Sorgeloos, P. (Eds.), Farming the waters for people and foodProceedingsof the Global Conference on Aquaculture 2010, Phuket, Thailand. 22–25 September2010. FAO, Rome and NACA, Bangkok, pp. 643–704 (also available at www.fao.org/docrep/015/i2734e/i2734e00.htm).
Ferreira, J.G., Grant, J., Verner-Jeffreys, D., Taylor, N., 2013a. Carrying capacity foraquaculture, modeling frameworks for determination of. In: Meyers, Robert A.(Ed.), Encyclopedia of Sustainability Science and Technology. Springer. ISBN:978-0387894690, pp. 1–32.
Ferreira, J., Ramos, L., Costa-Pierce, B.A., 2013b. Key drivers and issues surrounding carry-ing capacity and site selection, with emphasis on environmental components. In:Ross, L.G., Telfer, T.C., Falconer, L., Soto, D., Aguilar-Manjarrez, J. (Eds.), Site selectionand carrying capacities for inland and coastal aquaculture, FAO/Institute of Aquaculture,University of Stirling, Expert Workshop, 6–8 December 2010. Stirling, the UnitedKingdom of Great Britain and Northern IrelandFAO Fisheries and Aquaculture Proceed-ings 21. FAO, Rome, pp. 47–86 (282 pp.).
Franco, A.R., Ferreira, J.G., Nobre, A.M., 2006. Development of a growth model for penaeidshrimp. Aquaculture 259, 268–277.
Godfray, H.C.J., Beddington, J.R., Crute, I.R., Haddad, L., Lawrence, D., Muir, J.F., Pretty, J.,Robinson, S., Thomas, S.M., Toulmin, C., 2010. Food security: the challenge of feeding9 billion people. Science 327, 812–818.
Gómez-Márquez, J.L., Peña-Mendoza, B., Salgado-Ugarte, I.H., Arredondo-Figueroa, J.L., 2008. Age and growth of the tilapia, Oreochromis niloticus (Perciformes:Cichlidae) from a tropical shallow lake in Mexico. Rev. Biol. Trop. 56 (2),875–884.
Hishamunda, N., Cai, J., Leung, P., 2009. Commercial aquaculture and economic growth,poverty alleviation and food security. Food and Agricultural Organization of theUnited Nations. Fisheries and Aquaculture Technical Paper 512.
Inglis, G.J., Hayden, B.J., Ross, A.H., 2000. An overview of factors affecting the carryingcapacity of coastal embayments for mussel culture. NIWA Client report CHC00/69.Christchurch, New Zealand (31 pp.).
Lacerda, L.D., Vaisman, A.G., Maia, L.P., Silva, C.A.R., Cunha, E.M.S., 2006. Relative im-portance of nitrogen and phosphorus emissions from shrimp farming and otheranthropogenic sources for six estuaries along the NE Brazilian coast. Aquaculture253, 433–446.
Likongwe, J.S., Stecko, T.D., Stauffer Jr., J.R., Carline, R.F., 1996. Combined effects of watertemperature and salinity on growth and feed utilization of juvenile Nile tilapiaOreochromis niloticus (Linneaus). Aquaculture 146, 37–46.
ironmental effects of Nile tilapia andwhite shrimp culture in Thailand,

14 J.G. Ferreira et al. / Aquaculture xxx (2014) xxx–xxx
Little, D.C., Bush, S.R., Bolton, B., Phuong, N.T., Young, J.A., Murray, F., 2011. Whitefishwars: Pangasius, politics and consumer confusion in Europe. Mar. Policy 36 (2012),738–745.
McKindsey, C.W., Thetmeyer, H., Landry, T., Silvert, W., 2006. Review of recent carryingcapacity models for bivalve culture and recommendations for research and manage-ment. Aquaculture 261 (2), 451–462.
Moreau, Y., 1996. Measurement of the apparent digestibility coefficients forOreochromis nilocticus of agro-industrial by-products available in the Côted'Ivoire. In: Pullin, R.S.V., Lazard, J., Legendre, M., Amon Kothias, J.B., Pauly, D.(Eds.), The third international symposium of tilapia in aquaculture. ICLARMConf. Proc 41, pp. 204–210.
Northcott, M.E., Beveridge, M.C.M., Ross, L.G., 1991. A laboratory investigation of the filtra-tion and ingestion rates of the tilapia, Oreochromis niloticus, feeding on two species ofblue-green algae. Environ. Biol. Fish 31, 75–85.
Nunes, J.P., Ferreira, J.G., Bricker, S.B., O'Loan, B., Dabrowski, T., Dallaghan, B., Hawkins, A.J.S., O'Connor, B., O'Carroll, T., 2011. Towards an ecosystem approach to aquaculture:assessment of sustainable shellfish cultivation at different scales of space, time andcomplexity. Aquaculture 315, 369–383.
Pauly, D., Christensen, V., Dalsgaard, J., Froese, R., Torres Jr., F., 1998. Fishing down marinefood webs. Science 279, 860–863.
Pérez, O.M., Telfer, T.C., Ross, L.G., 2003. Use of GIS-based models for integrating and de-veloping marine fish cages within the tourism industry in Tenerife (Canary Islands).Coast. Manag. 31, 355–366.
Perschbacher, P.W., Lorio, W.J., 1993. Filtration rates of catfish pond phytoplankton byNile tilapia Oreochromis niloticus. J. World Aquacult. Soc. 24 (3), 434–437.
Perschbacher, P., Wendell, J.L., 1993. Filtration rates of catfish pond phytoplanktonby Nile tilapia Oreochromis niloticus. J. World Aquacult. Soc. 24 (3), 434–437.
Riche, M., Haley, D.I., Oetker, M., Garbrecht, S., Garling, D.L., 2004. Effect of feedingfrequency on gastric evacuation and the return of appetite in tilapia Oreochromisniloticus (L.). Aquaculture 234, 657–673.
Rico, A., Phu, Tran Minh, Satapornvanit, Kriengkrai, Jiang Min, A.M., Shahabuddin,Patrik J.G., Henriksson, Francis J., Murray, David C., Little, Anders Dalsgaard, Vanden Brink, Paul J., 2013. Use of veterinary medicines, feed additives and probioticsin four major internationally traded aquaculture species farmed in Asia. Aquaculture412–413, 231–243.
Ross, L.G., Telfer, T.C., Falconer, L., Soto, D., Aguilar-Manjarrez, J., 2013. Site selection andcarrying capacities for inland and coastal aquaculture. FAO/Institute of Aquaculture,University of Stirling, Expert Workshop, 6–8 December 2010. Stirling, the UnitedKingdom of Great Britain and Northern IrelandFAO Fisheries and Aquaculture Pro-ceedings 21. FAO, Rome (46 pp. Includes a CD-ROM containing the full document(282 pp.)).
Please cite this article as: Ferreira, J.G., et al., Analysis of production and envAquaculture (2014), http://dx.doi.org/10.1016/j.aquaculture.2014.08.042
Saurel, C., Ferreira, J.G., Cheney, D., Suhrbier, A., Dewey, B., Davis, J., Cordell, J., 2014.Ecosystem goods and services fromManila clam culture in Puget Sound\a modellinganalysis. Aquac. Environ. Interactions http://dx.doi.org/10.3354/aei00109.
Silva, C., Ferreira, J.G., Bricker, S.B., DelValls, T.A., Martín-Díaz, M.L., Yañez, E., 2011. Siteselection for shellfish aquaculture by means of GIS and farm-scale models, with anemphasis on data-poor environments. Aquaculture 318, 444–457.
Stigebrandt, A., 2011. Carrying capacity: general principles of model construction. Aquac.Res. 42, 41–50.
Stigebrandt, A., Aure, J., Ervik, A., Hansen, P.K., 2004. Regulating the local environmentalimpact of intensive marine fish farming. III. A model for estimation of the holdingcapacity in theMOMsystem(modelling-ongrowingfish farm-monitoring). Aquaculture234, 239–261.
Szuster, B.W., 2006. Review of shrimp farming in central Thailand. In: Leung, P.S., Engle, C.(Eds.), Shrimp culture: economics, market and tradeBlackwell Publishing. Iowa, USA,pp. 155–166.
Turker, H., Eversole, A.G., Brune, D.E., 2003. Comparative Nile tilapia and silver carpfiltrationrates of partitioned aquaculture system phytoplankton. Aquaculture 220, 449–457.
USGS, 2011. HYDRO1K. [Internet] USGS, Virgina, USA (Available: bhttps://lta.cr.usgs.gov/HYDRO1K N Date accessed: 19/01/2011).
Watson, R., Pang, L., Pauly, D., 2001. The marine fisheries of china: development andreported catches. Fisheries Centre Research Report 9. 2, Canada.
Xiao, Y., Ferreira, J.G., Bricker, S.B., Nunes, J.P., Zhu,M., Zhang, X., 2007. Trophic assessmentin Chinese coastal systems—review of methodologies and application to theChangjiang (Yangtze) Estuary and Jiaozhou Bay. Estuar. Coasts 30 (6), 1–18.
Yamprayoon, J., Sukhumparnich, K., 2010. Thai aquaculture: achieving quality and safetythrough management and sustainability. J. World Aquacult. Soc. 41, 274–280.
Yi, Yang, 1999. Modeling growth of Nile tilapia, (Oreochromis niloticus) in a cage-cum-pondintegrated culture system. Aquac. Eng. 21 (1999), 113–133.
Zhang, P., Zhang, X., Li, J., Huang, G., 2006. The effects of bodyweight, temperature, salinity,pH, light intensity and feeding condition on lethal DO levels of whiteleg shrimp,Litopenaeus vannamei (Boone, 1931). Aquaculture 256 (1–4), 579–587.
Zhang, J., Hansen, P.K., Fang, J., Wang, W., Jiang, Z., 2009. Assessment of the local environ-mental impact of intensive marine shellfish and seaweed farming—application of theMOM system in the Sungo Bay, China. Aquaculture 287, 304–310.
Zhu, C., Dong, S., Wang, F., Huang, G., 2004. Effects of Na/K ratio in seawater on growthand energy budget of juvenile Litopenaeus vannamei. Aquaculture 234, 485–496.
Zhu, C., Ferreira, J.G., Donato, M., Hawkins, A., Yan, X., Nobre, A., 2007. LMPrawn—a modelfor management of cultivated penaeid shrimp. Estuarine Research Federation's 19thBiennial International Conference—ERF2007’, Providence, Rhode Island, USA, 4–8November 2007.
ironmental effects of Nile tilapia andwhite shrimp culture in Thailand,