Analysis of Power System Impacts and Frequency Response ...
46
1 Analysis of Power System Impacts and Frequency Response Performance: February 1-4, 2011 Texas and Southwestern U.S. Cold Snap September, 2011
Transcript of Analysis of Power System Impacts and Frequency Response ...

1
Analysis of Power System Impacts and Frequency Response Performance: February 1-4, 2011 Texas and Southwestern U.S. Cold Snap
September, 2011


NERC’s Mission
NERC Analysis of February 1‐4, 2011 Texas and Southwestern U.S. Cold Snap i
NERC’s Mission
The North American Electric Reliability Corporation (NERC) is an international regulatory authority established to enhance the reliability of the bulk power system in North America. NERC develops and enforces Reliability Standards; assesses adequacy annually via a ten‐year forecast and winter and summer forecasts; monitors the bulk power system; and educates, trains, and certifies industry personnel. NERC is the electric reliability organization for North America, subject to oversight by the U.S. Federal Energy Regulatory Commission (FERC) and governmental authorities in Canada.1
NERC assesses and reports on the reliability and adequacy of the North American bulk power system, which is divided into eight Regional areas, as shown on the map and table below. The users, owners, and operators of the bulk power system within these areas account for virtually all the electricity supplied in the U.S., Canada, and a portion of Baja California Norte, México.
1 As of June 18, 2007, the U.S. Federal Energy Regulatory Commission (FERC) granted NERC the legal authority to enforce Reliability Standards with all U.S. users, owners, and operators of the bulk power system, and made compliance with those standards mandatory and enforceable. In Canada, NERC presently has memorandums of understanding in place with provincial authorities in Ontario, New Brunswick, Nova Scotia, Québec, and Saskatchewan, and with the Canadian National Energy Board. NERC standards are mandatory and enforceable in Ontario and New Brunswick as a matter of provincial law. NERC has an agreement with Manitoba Hydro making reliability standards mandatory for that entity, and Manitoba has recently adopted legislation setting out a framework for standards to become mandatory for users, owners, and operators in the province. In addition, NERC has been designated as the “electric reliability organization” under Alberta’s Transportation Regulation, and certain reliability standards have been approved in that jurisdiction; others are pending. NERC and NPCC have been recognized as standards‐setting bodies by the Régie de l’énergie of Québec, and Québec has the framework in place for reliability standards to become mandatory. NERC’s reliability standards are also mandatory in Nova Scotia and British Columbia. NERC is working with the other governmental authorities in Canada to achieve equivalent recognition.
NERC Regional Entities
FRCC Florida Reliability Coordinating Council
SERC SERC Reliability Corporation
MRO Midwest Reliability Organization
SPP RE Southwest Power Pool Regional Entity
NPCC Northeast Power Coordinating Council
TRE Texas Reliability Entity
RFC ReliabilityFirst Corporation
WECC Western Electricity Coordinating Council
Note: The highlighted area between SPP RE and SERC denotes overlapping Regional area boundaries. For example, some load serving entities participate in one Region and their associated transmission owner/operators in another.

Table of Contents
NERC Analysis of February 1‐4, 2011 Texas and Southwestern U.S. Cold Snap ii
Table of Contents
NERC’s Mission ................................................................................................................................. i
Table of Contents .............................................................................................................................ii
Executive Summary .......................................................................................................................... I
Introduction .................................................................................................................................... 1
WECC System Analysis .................................................................................................................... 3
Findings ....................................................................................................................................... 3
El Paso Electric ............................................................................................................................ 3
Power flow and Transient Stability Analysis ........................................................................... 4
Sequence of Events ................................................................................................................. 7
New Mexico Impacts................................................................................................................. 14
Public Service Company of New Mexico (PNM) ................................................................... 14
Arizona Impacts ........................................................................................................................ 15
Salt River Project (SRP) .......................................................................................................... 15
Other WECC Entity Impacts ...................................................................................................... 19
Eastern Interconnection Frequency Response Performance ....................................................... 20
Findings ..................................................................................................................................... 20
Western Interconnection Frequency Response Performance ..................................................... 24
Findings ..................................................................................................................................... 24
Texas Interconnection Frequency Response Performance .......................................................... 28
Findings ..................................................................................................................................... 28
Evaluation of Overall Frequency Response Performance ........................................................ 29
Detailed Analysis of Select Generation Trips ............................................................................ 32
NERC Staff ..................................................................................................................................... 38

Executive Summary
NERC Analysis of February 1‐4, 2011 Texas and Southwestern U.S. Cold Snap I
Executive Summary The Texas and southwest region of the United States encountered significant operating challenges during the first week of February 2011 as a result of unusually cold and windy weather. Within the Texas Interconnection record‐breaking winter demand levels were experienced on two different occasions as temperatures hit twenty‐year lows in the region. A portion of the Western Interconnection experienced unusual, subfreezing temperatures (See Figure ES‐1). Extremely cold temperatures during this period also extended into the Southwest Power Pool (SPP) region within the Eastern Interconnection.
In response to these events and operating challenges, the North American Electric Reliability Corporation (NERC) announced that it would prepare an event analysis examining the sufficiency of preparations and identify opportunities for industry learning. In early May 2011, the Federal Energy Regulatory Commission (FERC) and NERC announced they would combine their inquiries.2
Whereas the resulting recently released joint FERC‐NERC report3 gathered information and data to complete an assessment of the electric‐gas impacts of the Texas, Western and Eastern Interconnections, this report analyzes how the electrical system performed during the period of extended cold weather. Performance was determined by analyzing system simulations completed by NERC staff to review system impacts in the El Paso, New Mexico, and Arizona on an individual company basis, and frequency response performance of the Eastern, Western, and Texas Interconnections. The findings and results of both reports are aligned and complementary.
2 Separately, NERC is completing a longer‐term assessment of electric and gas interdependencies in light of the shift toward a greater reliance on natural gas to produce electricity. This assessment will be completed between the 3rd quarter in 2011 and 1st quarter 2012. See http://www.nerc.com/docs/pc/ras/Draft2011GasStudyScope.pdf
3 A separate, companion report has been issued jointly by FERC and NERC addressing event load shedding and curtailments, causes of the outages and supply disruptions, electric and natural gas interdependencies, and key findings and recommendations. See http://www.nerc.com/files/SW_Cold_Weather_Event_Final_Report.pdf
Figure ES‐1: EPE Transmission Limits and Ownership

Executive Summary
II NERC Analysis of February 1‐4, 2011 Texas and Southwestern U.S. Cold Snap
Conclusions and Recommendations The system analysis completed by NERC identified a number of important conclusions:
Analysis of controlled load interruptions:
o ERCOT’s decisions to interrupt firm load was pivotal to maintaining the integrity of
the Texas Interconnection after 05:30 CST4 on February 2nd. Controlled firm load
shedding of 1,000 MW requested at 05:43 enabled ERCOT to survive the resource
losses and counter the impacts of load pickup experienced near the top of the 06:00
hour. Similarly, requested shedding of an additional 1,000 MW of firm load at 06:04
assisted in recovery from the 59.57 Hz low frequency at 06:05. When the frequency
showed signs of further decline at 06:23, ERCOT ordered an additional 2,000 MW of
controlled firm load shedding; the total interrupted was 4,000 MW. This decision
was crucial to the frequency recovery and replenishment of spinning reserves.
o Based on NERC’s voltage stability power flow simulations, El Paso Electric’s decision
and amount of controlled firm load interruption was appropriate to prevent possible
system voltage collapse for the loss of a single 345 kV transmission line.
o The controlled shedding of firm load bye Salt River Project (SRP) was reasonable to
protect the Bulk Electric System. SRP did this to avoid the risk of cascading outages,
maintain system frequency within acceptable bounds and replenish reserves within
required times. SRP’s actions were prudent and appropriate responses to the rapid
series of events on the morning of February 2.
Frequency Response Performance:
o Analysis of both the Eastern and Western Interconnection frequency response
during the period of February 1‐5, 2011 showed that, even for the large unit trips
that occurred during that period, frequency response was in the range of normal
performance, and frequency was well within normal frequency bounds.
During the cold snap, Public Service of New Mexico (PNM) experienced a number of
breaker operations (none resulting in any transmission facility outages) due to low sulfur
hexafluoride (SF6) gas pressure in circuit breakers, resulting in operational challenges.
SF6 breakers at PNM are designed to open before the low gas pressure compromises the
insulation and arc quenching properties of the gas, which may occur during extreme
cold weather if heating systems are insufficient. Recommendations to address this
concern, include:
o SF6 breaker winterization should include tests of breaker heaters and supporting
circuitry to assure that they are adequate to run the heaters and are fully functional.
4 All times in this section for the ERCOT system are in Central Standard Time (CST).

Executive Summary
NERC Analysis of February 1‐4, 2011 Texas and Southwestern U.S. Cold Snap III
o Heaters fed from the station DC system supported by batteries or stations with an
emergency generator to supply the station service will assure breakers remain
functional, should the station be without power for a period of time.
o Transmission Operators need to know the mode of SF6 breaker low‐pressure failure.
In some instances, breakers are programmed to open automatically when the
pressure gets too low, while in others, breaker operation is blocked. 5
5 Surveys of the ECAR region following the 1994 cold snap revealed that these philosophies are not universal by voltage class, manufacturer, or within an individual company http://www.nerc.com/fileUploads/File/Events%20Analysis/94‐Rpt_Cold%20Wave‐cover.pdf


Introduction
NERC Analysis of February 1‐4, 2011 Texas and Southwestern U.S. Cold Snap 1
Introduction
The southwest region of the United States encountered significant operating challenges during the first week of February 2011 as a result of unusually cold and windy weather. Within the Texas Interconnection record‐breaking winter demand levels were experienced on two different occasions as temperatures hit twenty‐year lows in the region. A portion of the Western Interconnection experienced unusual, subfreezing temperatures. Extremely cold temperatures during this period also extended into the Southwest Power Pool (SPP) region within the Eastern Interconnection.
In the Texas Interconnection, ERCOT (the independent system operator) experienced a significant loss of available generation due largely to freezing of instrumentation and sensing lines during the extreme weather events. Over 150 generators faced difficulties handling the below‐freezing temperatures and consequently were forced out of service, failed to start, or operated at a de‐rated capacity. The severe weather conditions resulted in issuance of emergency energy alert (EEA) Level 36 in the Texas Interconnection with a controlled firm load interruption request of 4,000 MW.
Within the Western Interconnection, subfreezing temperatures resulted in the loss of several generation plants in the El Paso (See Figure ES‐1) and west‐Texas areas. El Paso Electric (EPE) customers experienced significant, controlled rotating outages resulting in controlled firm load reductions of up to 273 MW between February 1st and February 5th. Other plant outages in Arizona also resulted in the controlled interruption of service to approximately 300 MW of firm load by Salt River Project (SRP) on February 2nd. The rest of WECC did not experience significant controlled load loss, though challenges existed with cold weather operation of generation and sulfur hexafluoride (SF6) circuit breakers, and the need to initiate operational procedures such as dispatching additional generation to position the system to anticipate potential transmission contingencies.
Within the Eastern Interconnection, three Balancing Authorities in the Southwest Power Pool (SPP) experienced the loss of approximately 2,384 MW of generating capacity resulting from the cold temperatures. These events resulted in Emergency Energy Alerts (EEA) ranging from EEA Level 1 through EEA Level 3. During this timeframe, approximately 5,925 MW of capacity was offline or derated within the SPP footprint due to frozen components.
In response to these events and operating challenges, on February 7, 2011, NERC announced that it would work with the affected Regional Entities to prepare an event analysis examining the sufficiency of event preparations and identify opportunities for industry learning. On February 14, the Federal Energy Regulatory Commission (FERC) also initiated an inquiry into the
6 See http://www.nerc.com/files/EOP‐002‐3.pdf
Introduction
2 NERC Analysis of February 1‐4, 2011 Texas and Southwestern U.S. Cold Snap
outages and service disruptions. The inquiry had two objectives: to identify the causes of the disruptions, and to identify any appropriate actions for preventing a recurrence of the disruptions. From the beginning of these inquiries into the causes of the outages and disruptions, the staffs of FERC and NERC have cooperated in their data gathering and analysis. On May 9, FERC and NERC announced their staffs would combine their inquiries. 7
Whereas the recently joint FERC‐NERC report8 gathered information and data to complete an assessment of the electric‐gas impacts of the Texas, Western and Eastern Interconnections, this report summarizes the analysis of system simulations completed separately by NERC staff to review system impacts in the El Paso, New Mexico, and Arizona an individual company basis, and frequency response performance of the Eastern, Western, and Texas Interconnections. The findings and results of both reports are aligned and complementary.
The impacts in the El Paso, New Mexico and Arizona areas were studied and simulated on an individual company basis, as the nature of the event, such as the voltage‐based load serving capability in the El Paso system, did not have cascading implications across the grid. The performance of system frequency response was studied on an Interconnection‐wide basis.
The following chapters of this report focus on each of the three affected interconnections:
Western, Eastern and Texas. In the Western Interconnection, initially individual company
analysis is completed. This is followed by the frequency response of each of the Western,
Eastern and Texas Interconnections. In each chapter, a Findings section provides an overview
of results from the analysis and study work.
7 Separately, NERC is completing a longer‐term assessment of electric and gas interdependencies in light of the shift toward a greater reliance on natural gas to produce electricity. This assessment will be completed between the 3rd quarter in 2011 and 1st quarter 2012. See http://www.nerc.com/docs/pc/ras/Draft2011GasStudyScope.pdf
8 A separate, companion report has been issued jointly by FERC and NERC addressing event load shedding and curtailments, causes of the outages and supply disruptions, electric and natural gas interdependencies, and key findings and recommendations. See http://www.nerc.com/files/SW_Cold_Weather_Event_Final_Report.pdf

WECC System Analysis
NERC Analysis of February 1‐4, 2011 Texas and Southwestern U.S. Cold Snap 3
WECC System Analysis
The electric system impacts of the February 2011 cold snap varied greatly across the WECC region. Worst hit by the cold snap was El Paso Electric (EPE), which implemented controlled rolling blackouts four times in three days to maintain bulk electric system operational security, and Salt River Project (in Arizona) which temporarily interrupted 300 MW of firm customer load for 32 minutes due to loss of generation resources. The rest of WECC did not experience large scale load loss, but some entities had problems with cold weather operation of generation and sulfur hexafluoride (SF6) circuit breakers, and ran additional generation to protect against potential transmission contingencies.
Findings Analysis of the voltage stability of the El Paso Electric system affirmed the appropriateness of load shedding to prevent possible system voltage collapse for the loss of a single 345 kV transmission line. The analysis evaluated the load serving capability of the El Paso system at eight significant points in time during the cold snap. This analysis affirmed that the amount of load shed to maintain system integrity was appropriate.
Analysis of the Public Service of New Mexico (PNM) system identified concerns with reliable cold‐weather operation of SF6 gas circuit breakers and fuel switching on generation.
Analysis of the controlled load shedding by Salt River Project during a series of rapid tripping of their generating resources was an appropriate response to maintain their load/resource balance, maintain system frequency within acceptable bounds, and replenish reserves within required times.
Breaker maintenance should include tests of SF6 breaker heaters and supporting circuitry to assure that they are adequate to run the heaters and are fully functional. It is desirable to have the heaters fed from the station DC system supported by batteries or provide an emergency generator to supply the station service so that the breakers can remain functional should the station be blacked out for some time. It is also important for the Transmission Operators to know the mode of SF6 breaker low‐pressure failure – specifically, whether upon low pressure the breakers will open automatically or whether operation of the breakers is blocked.
Difficulties in performing fuel switching from natural gas to distillate fuel oil on the Delta Person combustion turbine left the turbine unable to return to service for approximately 24 hours. Measures are needed to assure that units are capable of performing fuel switching in a timely manner during severe weather conditions, when fuel switching capability may be necessary for system reliability.
El Paso Electric The El Paso Electric system that serves part of southern New Mexico and western Texas had to institute rolling blackouts to avoid a potential first contingency system voltage collapse. The

WECC System Analysis
4 NERC Analysis of February 1‐4, 2011 Texas and Southwestern U.S. Cold Snap
EPE system is an electrically peninsular system in the southeastern corner of WECC. During the cold snap, with only one local generating unit, Copper (71 MW winter rating), on‐line to supply needed dynamic voltage support in the El Paso area, EPE system security was heavily dependent on its ability to import generation from the Palo Verde and Four Corners power plants and other systems. Figure 1 shows the key transmission lines, their ownership, and ratings into the El Paso Electric system.
Figure 1: EPE Transmission Limits and Ownership
Power flow and Transient Stability Analysis NERC performed power flow simulations of the voltage stability of the El Paso system during the three‐day event to determine the reliability of the system. Those simulations affirmed the appropriateness of El Paso’s shedding of load to prevent a possible system voltage collapse for the loss of a single 345 kV transmission line, and that the amount of load shed to maintain system integrity was appropriate.
Analysis Process The power flow cases for the simulations were built from the WECC winter peak 2010‐2011 base case (HW2A). Generation dispatch and load levels were adjusted to reflect system conditions in the El Paso area during the February 2‐ 4, 2011 timeframe.
Initial transient stability analysis was performed and proved that the EPE system was not susceptible to transient instability. Therefore, additional transient stability analysis was not warranted. However, the analysis was indicative of a voltage‐collapse limited system, confirming the reasons given by EPE for load shedding.

WECC System Analysis
NERC Analysis of February 1‐4, 2011 Texas and Southwestern U.S. Cold Snap 5
Based on the times (all listed in MST) when load shedding was implemented, eight power flow base cases were constructed to represent key specific points in time during the cold snap: 9
2/2/11 07:00 – just prior to loss of Newman #4 GT2 and ST
2/2/11 07:20 – following loss of Newman #4 GT2 and ST
2/2/11 07:50 – additional load shedding following loss of 130 MW of generation at Luna Energy
Center
2/2/11 18:00 – prior to loss of the Eddy County DC tie
2/2/11 18:07 – following loss of the Eddy County DC tie
2/3/11 09:30 – morning peak load
2/3/11 17:30 – evening load pickup
2/4/11 06:30 – morning load pickup
For each of the eight power flow cases, generation in the EPE area and adjoining portions of PNM was dispatched to match available system data (15‐minute data). Voltages in the cases were benchmarked against the available one‐minute data.
P‐V (real power versus voltage) curves were computed from each of the eight models by constructing a series of additional cases, increasing load in 10 MW increments from one case to the next. Tap changers, area interchange control, phase shifters, and switched shunts were all allowed to adjust in the course of developing each series of cases. Next, single contingencies were applied, and the corresponding power flow solutions were calculated with tap changers, area interchange control, phase shifters, and switched shunts locked. For one particular case (07:20 MST on February 2nd), several contingencies were examined (Figure 2). The single contingency loss of the Luna – Diablo 345 kV transmission line stood as the most severe event, causing potential voltage stability conditions. Further, this contingency was examined for each of the eight cases and used to estimate the maximum load serving capability (Figure 3).
9 All times in this section for El Paso Electric are in Mountain Standard Time (MST).

WECC System Analysis
6 NERC Analysis of February 1‐4, 2011 Texas and Southwestern U.S. Cold Snap
Figure 2: P‐V Curves for Several Key Contingencies
Figure 3: P‐V Curves for a Luna – Diablo 345 kV Line Outage at 8 Time Periods
Figure 4 depicts the El Paso load measured against estimated load serving capability. Also shown are the periods of controlled load shedding throughout the three‐day period analyzed. The estimated import capabilities are discussed further in the Sequence of Events section.
Curves overlap for 2‐Feb‐11 at
06:00 PM & 06:07 PM

WECC System Analysis
NERC Analysis of February 1‐4, 2011 Texas and Southwestern U.S. Cold Snap 7
Sensitivities Analyzed Some sensitivity analysis of the voltage stability findings was also performed:
The voltage stability limits were found to be relatively insensitive to the setting of the
Arroyo phase‐shifting transformer (PST), with the 197 MW setting in the WECC base
case determined to be near optimal for import capability.
Analysis of the time period where the Eddy County DC tie to Southwestern Public
Service (in the Eastern Interconnection) tripped (18:07 MST on February 2)
demonstrates that the load serving capability of the EPE system is also relatively
insensitive to imports on that DC tie.
Figure 4: EPE System Load vs. Estimated Load Serving Capability
Sequence of Events The following is the sequence of events related to the El Paso Electric system for the period of February 1‐6, 2011. All times listed are in MST. Refer to Figure 4 for a comparison of the El Paso Electric system load versus the estimated load serving capability based on NERC power flow analysis between February 2 and February 5, 2011.
Tuesday, February 1, 2011 18:34 – Coyote – Dell City 115 kV Line Tripped
At 18:34, the Coyote – Dell City 115 kV line tripped due to a damaged conductor.
20:07 – Newman 3 Tripped
EPE Estimated Load Serving Capability
Periods of Controlled Rotating Load
Shedding

WECC System Analysis
8 NERC Analysis of February 1‐4, 2011 Texas and Southwestern U.S. Cold Snap
At 20:07, the first of EPE’s gas‐fired generators, Newman Unit 3, tripped when frozen condensation on the fresh air inlet resulted in an air/fuel deviation that caused a master boiler trip. This unit was not initially available afterward due to ice build up on the forced draft fan. Subsequent start‐up attempts failed due to unit equipment and instrumentation freezing at start‐up.
22:15 – Rio Grande 6 Tripped
At 22:15, Rio Grande Unit 6 tripped due to a frozen gas transmitter. A “loss of fuel” condition caused a master boiler trip.
22:15 – WECC RC Contacted – Loss of Local Generation
At 22:15, the EPE System Controllers contacted the WECC Reliability Coordinator in Loveland, Colorado (LRCC) and advised them of the loss of local generation.
22:52 – Requested Interruption of Interruptible Loads
At 22:52, EPE System Controllers requested that interruptible loads be interrupted due to the extreme weather conditions and the loss of local generation.
23:45 – Copper Generating Unit brought on Line
At 23:45, the Copper Generator was brought on‐line and loaded to 55 MW.
Wednesday, February 2, 2011
00:10 – Newman 5 GT3 Tripped at 5 MW
At 00:10, the Newman 5 GT3 tripped. The unit was taken off‐line due to frozen drum level instrumentation sensing lines on the heat recovery steam generator (HRSG).
00:26 – Newman 5 GT 4 Tripped at 5 MW
At 00:26, Newman 5 GT4 tripped. The unit was taken off‐line due to frozen drum level instrumentation sensing lines on the HRSG. After this trip, EPE was capable of serving approximately 1,190 MW of load without exposing the system to a potential single‐contingency voltage collapse, according to NERC power flow analysis.
01:49 – Rio Grande 8 Tripped
At 01:49, Rio Grande Unit 8 tripped due to erroneous fuel gas pressure indication caused by a frozen transmitter sensing line. A “loss of fuel” condition caused a master boiler trip. NERC power flow analysis estimates that EPE could serve 990 MW of load in its area without risking a single‐contingency voltage collapse after this time.
01:53 – WECC LRCC Contacted – Energy Emergency Alert (EEA) Level 1 Declared
At 01:53, EPE System Controllers contacted the WECC LRCC to initiate an Energy Emergency Alert (EEA) Level 1.
02:02 – Eddy County DC Tie Started and Ramped to 100 MW into EPE
At 02:02, EPE purchased power from Southwest Public Service (SPS) and the Eddy DC tie was started and ramped to 100 MW. Powerflow analysis indicates, however, that the
WECC System Analysis
NERC Analysis of February 1‐4, 2011 Texas and Southwestern U.S. Cold Snap 9
maximum load which could be served in the EPE area was still approximately 990 MW. The improvements in load serving capability from the additional transfer of power from the Eddy County DC tie are offset by the reactive power required to support the converter station.
02:27 – Luna Energy Facility (LEF) Generation Synchronized
EPE purchased power from PNM’s Luna Energy Facility, located in Deming, NM. At 02:27, a switching order was given by the System Controller to synchronize the LEF generators to the grid. The additional local reactive power support increased the load serving capability of EPE to 1,130 MW according to NERC power flow analysis.
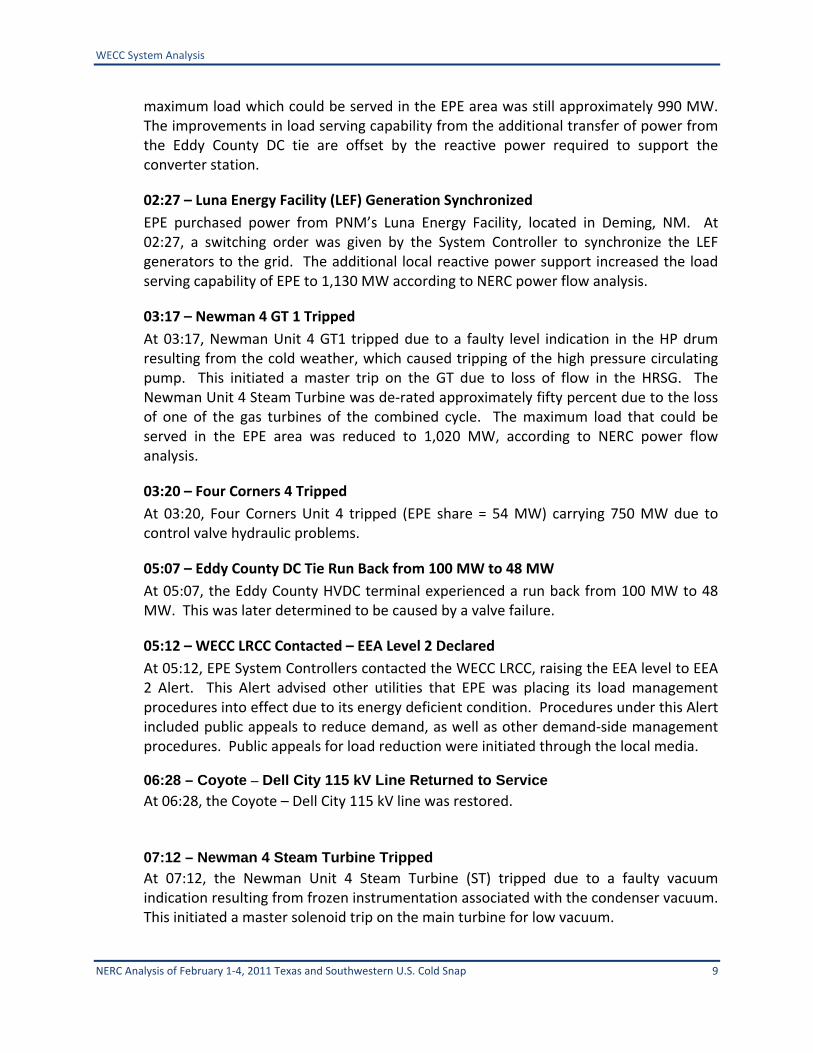
03:17 – Newman 4 GT 1 Tripped
At 03:17, Newman Unit 4 GT1 tripped due to a faulty level indication in the HP drum resulting from the cold weather, which caused tripping of the high pressure circulating pump. This initiated a master trip on the GT due to loss of flow in the HRSG. The Newman Unit 4 Steam Turbine was de‐rated approximately fifty percent due to the loss of one of the gas turbines of the combined cycle. The maximum load that could be served in the EPE area was reduced to 1,020 MW, according to NERC power flow analysis.
03:20 – Four Corners 4 Tripped
At 03:20, Four Corners Unit 4 tripped (EPE share = 54 MW) carrying 750 MW due to control valve hydraulic problems.
05:07 – Eddy County DC Tie Run Back from 100 MW to 48 MW
At 05:07, the Eddy County HVDC terminal experienced a run back from 100 MW to 48 MW. This was later determined to be caused by a valve failure.
05:12 – WECC LRCC Contacted – EEA Level 2 Declared
At 05:12, EPE System Controllers contacted the WECC LRCC, raising the EEA level to EEA 2 Alert. This Alert advised other utilities that EPE was placing its load management procedures into effect due to its energy deficient condition. Procedures under this Alert included public appeals to reduce demand, as well as other demand‐side management procedures. Public appeals for load reduction were initiated through the local media.
06:28 – Coyote – Dell City 115 kV Line Returned to Service
At 06:28, the Coyote – Dell City 115 kV line was restored.
07:12 – Newman 4 Steam Turbine Tripped
At 07:12, the Newman Unit 4 Steam Turbine (ST) tripped due to a faulty vacuum indication resulting from frozen instrumentation associated with the condenser vacuum. This initiated a master solenoid trip on the main turbine for low vacuum.
WECC System Analysis
10 NERC Analysis of February 1‐4, 2011 Texas and Southwestern U.S. Cold Snap
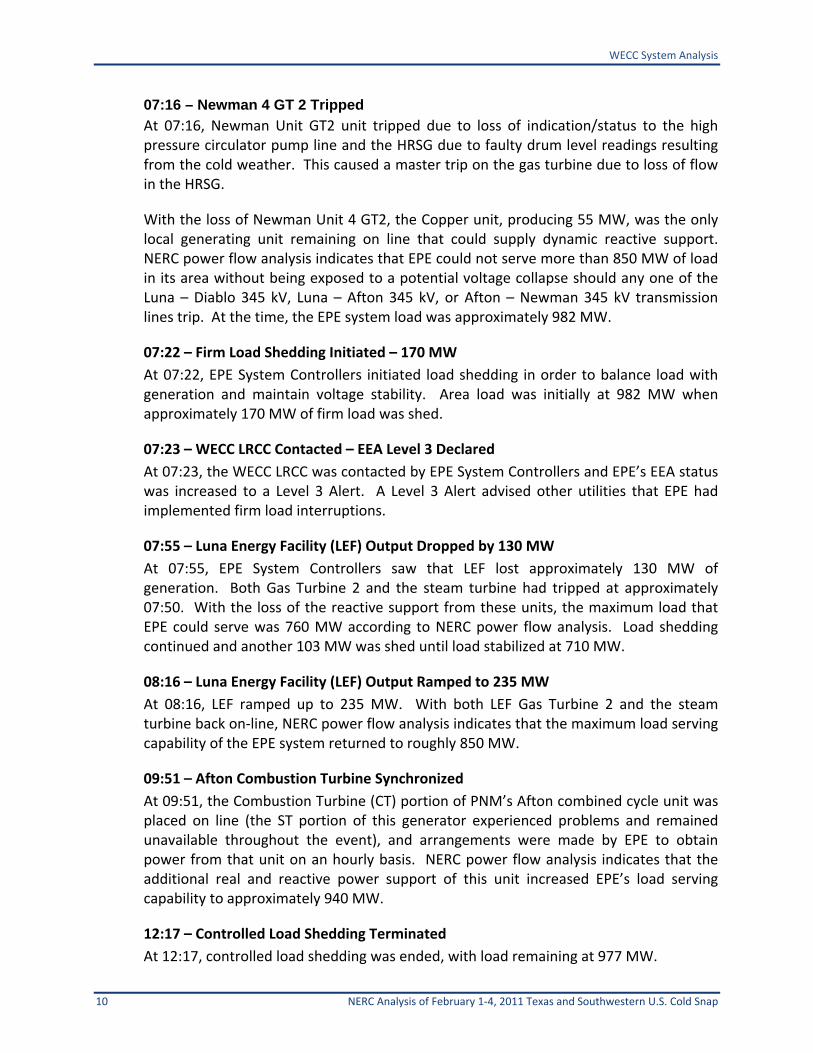
07:16 – Newman 4 GT 2 Tripped
At 07:16, Newman Unit GT2 unit tripped due to loss of indication/status to the high pressure circulator pump line and the HRSG due to faulty drum level readings resulting from the cold weather. This caused a master trip on the gas turbine due to loss of flow in the HRSG.
With the loss of Newman Unit 4 GT2, the Copper unit, producing 55 MW, was the only local generating unit remaining on line that could supply dynamic reactive support. NERC power flow analysis indicates that EPE could not serve more than 850 MW of load in its area without being exposed to a potential voltage collapse should any one of the Luna – Diablo 345 kV, Luna – Afton 345 kV, or Afton – Newman 345 kV transmission lines trip. At the time, the EPE system load was approximately 982 MW.
07:22 – Firm Load Shedding Initiated – 170 MW
At 07:22, EPE System Controllers initiated load shedding in order to balance load with generation and maintain voltage stability. Area load was initially at 982 MW when approximately 170 MW of firm load was shed.
07:23 – WECC LRCC Contacted – EEA Level 3 Declared
At 07:23, the WECC LRCC was contacted by EPE System Controllers and EPE’s EEA status was increased to a Level 3 Alert. A Level 3 Alert advised other utilities that EPE had implemented firm load interruptions.
07:55 – Luna Energy Facility (LEF) Output Dropped by 130 MW
At 07:55, EPE System Controllers saw that LEF lost approximately 130 MW of generation. Both Gas Turbine 2 and the steam turbine had tripped at approximately 07:50. With the loss of the reactive support from these units, the maximum load that EPE could serve was 760 MW according to NERC power flow analysis. Load shedding continued and another 103 MW was shed until load stabilized at 710 MW.
08:16 – Luna Energy Facility (LEF) Output Ramped to 235 MW
At 08:16, LEF ramped up to 235 MW. With both LEF Gas Turbine 2 and the steam turbine back on‐line, NERC power flow analysis indicates that the maximum load serving capability of the EPE system returned to roughly 850 MW.
09:51 – Afton Combustion Turbine Synchronized
At 09:51, the Combustion Turbine (CT) portion of PNM’s Afton combined cycle unit was placed on line (the ST portion of this generator experienced problems and remained unavailable throughout the event), and arrangements were made by EPE to obtain power from that unit on an hourly basis. NERC power flow analysis indicates that the additional real and reactive power support of this unit increased EPE’s load serving capability to approximately 940 MW.
12:17 – Controlled Load Shedding Terminated
At 12:17, controlled load shedding was ended, with load remaining at 977 MW.

WECC System Analysis
NERC Analysis of February 1‐4, 2011 Texas and Southwestern U.S. Cold Snap 11
12:19 – WECC LRCC Contacted – EEA Lowered to Level 2
At 12:19, the WECC LRCC was contacted by EPE System Controllers and EPE’s EEA alert level was decreased to EEA level 2.
18:04 – Eddy County DC Tie Tripped
At 18:04, the Eddy DC terminal tripped.
18:11 – Load Shedding Resumed
At 18:11, EPE System Controllers resumed load shedding.
18:15 – WECC LRCC Contacted – EEA Returned to Level 3
At 18:15, the WECC LRCC was notified by EPE System Controllers and EPE was placed under an EEA Level 3 status.
20:58 – Load Shedding Terminated
20:58 – WECC LRCC Contacted – EEA Lowered to Level 2
At 20:58, load shedding was terminated by the EPE System Controllers because of reduced load demand. EPE contacted the LRCC and EEA alert level was changed back to an EEA Level 2.
23:04 – Eddy County DC Tie Returned to Service
At 23:04, the Eddy DC tie resumed operation. According to Southwest Public Service Company, the DC Terminal Operating Agent, the tie had tripped due to failure of thyristors in the converter.
Thursday, February 3, 2011
15:45 – Afton Combustion Turbine (CT) Tripped
At 15:45, PNM’s Afton CT tripped. This reduced EPE’s load serving capability to about 850 MW, according the NERC power flow analysis.
16:23 – Afton Combustion Turbine Re‐Synchronized
At 16:23, PNM was able to put the Afton CT back on line, restoring EPE’s load serving capability to about 950 MW, according the NERC power flow analysis.
17:00 – WECC LRCC Contacted – EEA Raised to Level 3
At 17:00, as the evening load increased, the WECC LRCC was contacted by EPE System Controllers, and elevated EPE’s alert status to EEA Level 3.
17:30 – Controlled Load Shedding Resumed
At 17:30, the EEP System Controllers resumed the controlled load shedding.

WECC System Analysis
12 NERC Analysis of February 1‐4, 2011 Texas and Southwestern U.S. Cold Snap
18:52 – Newman 4 GT 1 Synchronized
At 18:52, Newman Unit 4 GT1 was brought on‐line in dry mode (i.e., with the HRSG drained of all water). The additional reactive support added 40 MW to EPE’s load serving capability, even without appreciable real power output from the unit.
19:20 – Newman 4 GT 1 Tripped
At 19:20, Newman Unit 4 GT1 tripped due to a leak on boiler feed pump (the lube oil cooler on the boiler feed pump cracked). This initiated a master GT trip.
21:32 – Newman 4 GT 1 Synchronized
At 21:32, Newman Unit 4 GT1 was brought back on‐line. Again, the additional reactive support added 40 MW to EPE’s load serving capability, even without appreciable real power output.
22:30 – Newman 4 GT 2 Synchronized
At 22:30, Newman Unit 4 GT2 was brought on‐line in dry mode (i.e., with the HRSG drained of all water). This unit added another 40 MW to the EPE voltage‐collapse import limit.
22:37 – Controlled Load Shedding Terminated
At 22:37, EPE terminated the controlled rotating load shedding.
22:40 – WECC LRCC Contacted –EEA Lowered to Level 2
At 22:40, the WECC LRCC lowered the EEA level back to EEA 2.
Friday, February 4, 2011
02:02 – Newman 4 GT 2 Tripped
At 02:02, Newman Unit 4 GT2 tripped due to stator high temp alarm. This initiated a master GT trip due to generator stator high temp.
02:04 – Newman 4 GT 1 Tripped
At 02:04, Newman Unit 4 GT1 tripped due to a re‐circulating line rupture on the auxiliary line which is the main cooling source and a leak in the economizer section. The unit operator initiated a master GT trip due to all cooling water being lost. This lowered EPE’s load serving capability to roughly 950 MW according to NERC power flow analysis.
03:17 – Luna Energy Facility Steam Turbine Tripped
At 03:17, PNM’s LEF steam turbine tripped. Without this unit’s reactive support, the load serving capability of EPE fell to about 900 MW, according the NERC’s power flow analysis.
03:23 – Luna Energy Facility Gas Turbines Reduced Output
At 03:23, the LEF gas turbines both dropped from 90 MW to 11 MW each.

WECC System Analysis
NERC Analysis of February 1‐4, 2011 Texas and Southwestern U.S. Cold Snap 13
03:51 – Luna Energy Facility Steam Turbine Resynchronized
At 03:51, the Luna Energy Facility steam turbine was brought back on‐line and slowly ramped up. However, the unit was not capable of supplying reactive power for many hours afterward. Accordingly, NERC power flow analysis showed the maximum load EPE could serve was still about 900 MW.
06:30 – Load Shedding Initiated
06:30 – WECC LRCC Contacted – Energy Emergency Alert (EEA) Raised to Level 3
At 06:30, the WECC LRCC issued an EEA Level 3 for EPE. With Copper again as the only local unit on line, controlled rotating load shedding had to be resumed.
06:49 – Newman 4 GT 2 Synchronized
At 06:49, Newman Unit 4 GT2 was brought on line. The unit apparently was only capable of producing 10 MW at the time. However, the extra reactive support increased EPE’s maximum load serving capability to about 940 MW.
12:05 – Load Shedding Terminated
At 12:05, the controlled rotating load shedding was ended.
12:12 – WECC LRCC Contacted –EEA Lowered to Level 2
At 12:12, the WECC LRCC changed EPE’s alert status to EEA level 2.
15:57 – Newman 5 GT 4 Synchronized
At 15:57, the Newman Unit 5 GT4 unit was brought on line and stabilized at 50 MW output. This increased EPE’s load serving capability to about 1,050 MW.
17:12 – Rio Grande 8 Synchronized
At 17:12, the Rio Grande Unit 8 was brought on line. With the unit supplying 45 MW, EPE could now support approximately 1,160 MW without the risk of a single‐contingency voltage collapse.
Due to the added generation providing the necessary dynamic reactive support, no controlled rotating load shedding was required for the Friday night peak load period nor thereafter.
Saturday, February 5, 2011
16:07 – Newman 5 GT 3 Synchronized
At 16:07, Newman Unit 5 GT3 came on line.
16:30 – WECC LRCC Contacted – EEA Lowered to Level 1
At 16:30, the WECC LRCC lowered EPE’s alert status to EEA Level 1.

WECC System Analysis
14 NERC Analysis of February 1‐4, 2011 Texas and Southwestern U.S. Cold Snap
Sunday, February 6, 2011
09:46 – WECC LRCC Contacted – Energy Emergency Alert (EEA) Lowered to Level0
At 09:46, the WECC LRCC decreased EPE’s alert status to EEA Level 0.
New Mexico Impacts
Public Service Company of New Mexico (PNM) Public Service Company of New Mexico (PNM), which serves the Albuquerque, Santa Fe, Las Vegas, Silver City and Alamogordo load centers in New Mexico, experienced problems with SF6 circuit breakers, difficulties with cold weather operation of some generators, and controlled loss of a small amount of load served in the Alamogordo area in southern New Mexico. PNM also dispatched additional generation to meet operating reliability criteria by offsetting potential transmission system contingencies both on their own system, and to support EPE.
Transmission Equipment Performance
During the cold snap, PNM experienced problems with tripping of a number of circuit breakers when they experienced low SF6 gas pressure. Those breakers were designed to open before the low gas pressure compromises the insulation and arc quenching properties of the gas in the breakers. Low gas pressure may occur during extreme cold weather if heating systems are insufficient. Some of the problems were caused by non‐functional or inadequate heaters in the breakers.
One of the compromised breakers was on a key 345 kV line from the generation in the Four Corners to the Albuquerque area, leaving only one breaker tying the line to the bus. As a result of that issue and very heavy winter loads, PNM dispatched generation at the Reeves, Delta Person and Valencia generating stations to position the system to maintain reliability during the cold weather event.
Reliable cold‐weather operation of SF6 gas circuit breakers depends on maintaining proper pressure in the breakers. As the breakers get cold, the gas itself contracts reducing pressure. Also, with breaker component shrinkage, the gas can leak from the breakers. Breaker maintenance should include tests of SF6 breaker heaters and supporting circuitry to assure that they are adequate to run the heaters and are fully functional. It may also desirable to have the heaters fed from the station DC system, where adequate DC capacity exists, supported by batteries or an emergency station service generator. That would assure that the breakers can remain functional should the station be blacked out for some time.
It is also important for Transmission Operators to know SF6 breaker low‐pressure failure modes. In some instances, breakers open automatically when the pressure gets too low. In others, all operation of the breaker is blocked. Surveys of the ECAR region following the 1994 cold snap revealed that these philosophies are not universal by voltage class, manufacturer, or within an individual company.
WECC System Analysis
NERC Analysis of February 1‐4, 2011 Texas and Southwestern U.S. Cold Snap 15
Fuel Switching on Generation
Natural gas system curtailments throughout New Mexico due to low gas pressure resulted in a number of communities being without any gas for up to 6 days. Fortunately, PNM did not lose any gas‐fired generators due to gas pressure or supply shortages. However, PNM did voluntarily attempt to switch from natural gas to distillate fuel oil at its Delta Person combustion turbine (140 MW winter rating). This attempt was made in response to an appeal by the New Mexico Gas Company to curtail gas usage. However, difficulties in performing fuel switching left the turbine unable to return to service on distillate fuel oil for approximately 4 days. Delta remained available on natural gas during this time. Measures are needed to assure that units are capable of performing fuel switching in a timely manner during severe weather conditions, when fuel switching capability may be necessary for system reliability.
Running Additional PNM‐Owned Generation to Support System Security for EPE
In addition to running generation at Reeves station in Albuquerque, PNM ran its Afton combined cycle plant (one combustion turbine and one steam unit, 238 MW winter rating) near Las Cruces, NM and its Luna Energy Center combined cycle plant (two combustion turbines and one steam unit, 576 MW winter rating) to support the EPE system. During the three‐day cold snap, portions of both of those plants tripped due to cold weather operation problems, but the that capacity that tripped was quickly restored.
Arizona Impacts
Salt River Project (SRP) On February 2, 2011 at 06:22 MST10, the Salt River Project (SRP) Balancing Authority Area (BAA) experienced a loss of generation when Navajo Unit 2 tripped, resulting in the loss of SRP’s 350 MW share of the unit.
Navajo Unit 2 tripped due to a false high water wall pressure indication. Due to cold weather and high winds, a common sensing line connecting three water wall pressure transmitters monitoring the boiler pressure for Unit 2 froze, causing the transmitters to indicate an unacceptable pressure in the boiler water wall.
In the eleven hours prior to this event, SRP had experienced the loss of four other generating units totaling 1,050 MW of generating capacity for the SRP BAA:
Navajo Unit 1 (330 MW share) due to frozen instrumentation
Coronado Unit 2 (389 MW share) due to drum level problems not weather‐related
Four Corners Unit 4 (75 MW share) due to control valve hydraulic problems
10 All times in this section for the Salt River Project are in Mountain Standard Time (MST).

WECC System Analysis
16 NERC Analysis of February 1‐4, 2011 Texas and Southwestern U.S. Cold Snap
Santan Unit 6 (236 MW).
The loss of Santan Unit 6 occurred 60 minutes prior to the loss of Navajo Unit 2. With the unusually cold weather, SRP was experiencing higher‐than‐projected demand and the preceding three hour load increases were above the day‐ahead demand forecast, but within 5 percent of the forecast.
The combination of loss of generation and higher‐than‐projected loads prompted the SRP system operator to interrupt 300 MW of SRP firm customer load for 32 minutes. The SRP operator then replaced the generating resources with gas‐fired generation, hydro generation, interruptible loads, demand‐side management programs, and reserve sharing group emergency assistance, and energy purchases from the spot energy market. SRP deployed 641 MW of additional generation and 273 MW of interruptible load (totaling 914 MW) during the event.
System frequency in the Western Interconnection dropped from 59.993 HZ to 59.914 Hz upon the loss of Navajo Unit 2 (750 MW total output). System frequency recovered to 59.994 Hz in 4 minutes 41 seconds. SRP’s Area Control Error (ACE) recovered in less than 8 minutes after the loss of Navajo Unit 2.
The SRP BAA System Operator consulted with the WECC Loveland Reliability Coordination Center (LRCC) at 06:24. SRP and the LRCC agreed that an Energy Emergency Alert 3 (EEA 3) be declared. LRCC granted this request and declared an EEA 3 for SRP at 06:31.
Sequence of Events
All times in this sequence of events are in MST for February 1 and 2, 2011.
Tuesday, February 1, 2011 18:54 – Navajo Unit 2 Tripped
At 18:54, Navajo Unit 1 tripped due 330 MW share due to frozen instrumentation. SRP’s share of the unit is 330 MW.
Wednesday, February 2, 2011 02:56 – Coronado Unit 2 Tripped
At 02:56, Coronado Unit 2 tripped due to drum level problem not related to weather while loaded at 130 MW. The drum level excursion was related to a mechanical problem with the coal pulverizers.
03:20 – Four Corners Unit 4 Tripped
At 03:20, Four Corners Unit 4 tripped due to control valve hydraulic problem loaded at 750 MW (of which SRP has a 75 MW share).
05:22 – Santan Unit 6 Tripped
At 05:22, Santan Unit 6 steam turbine tripped due to high vibration when the unit was placed in duct firing mode, loaded at 80 MW. After the steam turbine trip, the loading

WECC System Analysis
NERC Analysis of February 1‐4, 2011 Texas and Southwestern U.S. Cold Snap 17
of the associated combustion turbine was runback from 165 MW to minimum load to facilitate a restart of the steam turbine.
05:22 – SRP Deploys Additional Generation
Following the loss of Santan Unit 6 steam turbine but before Navajo Unit 2 tripped, SRP deployed the following units to make up for the lost generating capacity from the earlier outages. These units began to respond prior to the load shedding event:
Mormon Flat Unit 2 –50 MW hydro generator
Mormon Flat Unit 1: This is a 10 MW hydro generator
Horse Mesa units 1, 2, and 3 –10 MW each, hydro generators
Agua Fria units 4, 5, and 6 – 70 MW each, gas turbines
Kyrene Unit 4 – 61 MW gas turbine
Kyrene Units 5 and 6 – 60MW each, gas turbines
05:28 – Interruptible Load Shedding Implemented
At 05:28, SRP interrupted instantaneous interruptible load of 38 MW to help in the recovery from the loss of Santan Unit 6.
06:22 – Navajo Unit 2 Tripped
At 06:22, Navajo Unit 2 tripped due to a false high water wall pressure indication. Due to cold weather and high winds, a common sensing line connecting three water wall pressure transmitters monitoring the boiler pressure for Unit 2 froze, causing the transmitters to indicate an unacceptable pressure in the boiler water wall.
06:22 – SRP Called for Emergency Assistance from SRSG
System Operator called for emergency assistance from the Southwest Reserve Sharing Group (SRSG).
06:22 – SRP Notified WECC LRCC of Impending
At 06:22, the SRP operators contacted the WECC Reliability Coordinator in Loveland, Colorado (LRCC) to notify them of impending firm customer load shedding in SRP.
06:24 – SRP BAA Orders 300 MW Firm Load Shed
At 06:22, the SRP BAA System Operator determined that SRP would need to shed 300 MW of firm customer load to recover from the loss of the unit, ensure system balance for resources and load, and avoid burdening other systems. This conclusion was based on generation loss and available resources.
At 06:24 the SRP BAA System Operator directed the SRP Transmission Operator to shed 300 MW firm customer load. The Transmission Operator then directed SRP’s Distribution Provider to shed 300 MW firm customer load, which was initiated by the Distribution Provider at 06:29 a.m.

WECC System Analysis
18 NERC Analysis of February 1‐4, 2011 Texas and Southwestern U.S. Cold Snap
06:26 – Agua Fria GT 4 Synchronized
At 06:26 Agua Fria Unit 4 gas turbine synchronized and ramped to full load (72 MW) at 06:52.
06:28 – Agua Fria 5 Synchronized
At 06:28 Agua Fria Unit 5 gas turbine synchronized and ramped to full load (79 MW) at 06:54.
06:29 – SRP Area Control Error (ACE) Recovers
06:29 – 136 MW of Interruptible Load Tripped
At 06:29, the SRP BAA ordered tripping of 136 MW of 10‐minute interruptible load.
06:29 – Emergency Purchases Made
The 300 MW of firm customer load was shed at 06:29 by SRP’s Distribution Provider. The SRP BAA System Operators notified SRP Marketing (SRPM) of the load shedding event and asked for emergency purchases. SRPM then made a 300 MW emergency purchase. SRP’s ACE recovered at this time and the system was balanced for resources and load.
06:31 – WECC LRCC Declares Energy Emergency Alert 3 (EEA 3)
The SRP BAA System Operator consulted with the WECC LRCC at 06:24. SRP and the LRCC agreed that an Energy Emergency Alert 3 (EEA 3) be declared. LRCC granted this request and declared an EEA 3 for SRP at 06:31.
06:33 – Agua Fria GT 6 Synchronized
At 06:33 Agua Fria Unit 6 gas turbine synchronized and ramped to full load (72 MW) at 06:58.
06:34 – Springerville 3 Tripped
At 06:34 Springerville Unit 3 tripped due to high furnace pressure. This is a jointly‐owned unit operated by Tucson Electric Power Company (TEPC).
06:36 – SRP Begins Firm Load Restoration
At 06:36, the SRP BAA System Operator directed the restoration of 100 MW of firm customer load (approximately 22,000 customers). Instead of restoring only the 100 MW as directed, the Distribution Provider mistakenly restored all 300 MW of the load that was shed. Upon realizing this error, the Distribution Provider shed 200 MW of the load that had been restored.
06:52 – Kyrene GT 4 Synchronized
At 06:52 Kyrene Unit 4 gas turbine synchronized and ramped to full load (61 MW) at 07:04. The Kyrene and Agua Fria units were all dispatched after the loss of Santan Unit 6 and before the loss of Navajo Unit 2 that triggered the load shed event. The timely arrival of this generation allowed SRP to quickly restore firm customer load.

WECC System Analysis
NERC Analysis of February 1‐4, 2011 Texas and Southwestern U.S. Cold Snap 19
06:54 – SRP Restores 100 MW Firm Load
At 06:54, SRP BAA System Operator directs the restoration of another 100 MW firm customer load, approximately 22,000 additional customers restored.
06:56 – SRP Restores 100 MW Firm Load
At 06:56, SRP BAA System Operator directs the restoration of the final 100 MW firm customer load. Approximately 17,000 additional customers immediately restored and approximately 4,000 customers remain interrupted due to breaker closing problems at various distribution substations. These customers are progressively restored over the next several hours.
06:59 – WECC LRCC Lowers SRP Energy Emergency Alert to Level 0 (EEA 0)
At 06:59, the EEA 3 was cancelled and EEA 0 was declared by WECC LRCC for SRP.
07:08 – SRP Restores Interruptible Loads
At 07:08, SRP BAA System Operator directs the restoration of all of SRP interruptible loads. The specific restoration times were determined by each individual customer.
09:43 – All SRP customers are Restored
At 09:43, all SRP customers are restored.
Other WECC Entity Impacts Gas curtailments also impacted some gas‐fired generation as far away as San Diego, CA. However, the capacity from those resources was replaced within the California Independent System Operator’s normal course of business, with no impact on bulk electric system reliability.

Eastern Interconnection Frequency Response Performance
20 NERC Analysis of February 1‐4, 2011 Texas and Southwestern U.S. Cold Snap
Eastern Interconnection Frequency Response Performance
The frequency response performance of the Eastern Interconnection during the period of February 1 through February 5, 2011 was reviewed. Analysis showed that for large unit trips that occurred during that cold snap timeframe, frequency response in the interconnection was within the range of normal performance.11 Further, frequency was well within normal frequency bounds throughout the period. Therefore no further detailed analysis of frequency response for the Eastern Interconnection was warranted.
Findings The following figures show the frequency12 for the Eastern Interconnection from February 1‐5 with the largest generator trip annotated. For perspective, the 5‐minute High and low Frequency Trigger Limits (FTLs) for the Eastern Interconnection are shown.
Figure 5: Eastern Interconnection Frequency – 2/1/11
11 The decline in frequency response in the Eastern Interconnection is the subject of ongoing technical study and development of NERC Reliability Standards. NERC is studying this general behavior and the results from this event will be fed into that broader analysis.
12 From the Resource Adequacy tool, 1‐minute values
59.94
59.95
59.96
59.97
59.98
59.99
60.00
60.01
60.02
60.03
60.04
60.05
60.06
Freq
uency (Hz)
Time (CST)
Frequency 60 Hz High FTL ‐ 60.05 Hz Low FTL ‐ 59.95 Hz
LaSalle 1 Trips at 1,204 MW

Eastern Interconnection Frequency Response Performance
NERC Analysis of February 1‐4, 2011 Texas and Southwestern U.S. Cold Snap 21
During that period, the largest generating unit trip recorded in the Eastern Interconnection was the loss of LaSalle Unit 1 at 19:18 CST13 while loaded to 1,204 MW. The frequency response of the interconnection for that event was calculated to be ‐2,406 MW/0.1 Hz14.
Figure 6: Eastern Interconnection Frequency Response during LaSalle Unit 1 Trip on 2‐1‐11
13 All times in this section for the Eastern Interconnection in are Central Standard Time (CST). 14 Calculated by the Frequency CERTS Frequency Monitoring and Analysis program, using the 1‐second data guide method approved by the NERC Resources Subcommittee

Eastern Interconnection Frequency Response Performance
22 NERC Analysis of February 1‐4, 2011 Texas and Southwestern U.S. Cold Snap
Figure 7: Eastern Interconnection Frequency – 2/2/11
Similar interconnection frequency performance was exhibited in the Eastern Interconnection for the following two days of the cold weather event, as shown in Figures 8 and 9.
Figure 8: Eastern Interconnection Frequency – 2/3/11
59.94
59.95
59.96
59.97
59.98
59.99
60.00
60.01
60.02
60.03
60.04
60.05
60.06Freq
uency (Hz)
Time (CST)
Frequency 60 Hz High FTL ‐ 60.05 Hz Low FTL ‐ 59.95 Hz
59.94
59.95
59.96
59.97
59.98
59.99
60.00
60.01
60.02
60.03
60.04
60.05
60.06
Freq
uency (Hz)
Time (CST)
Frequency 60 Hz High FTL ‐ 60.05 Hz Low FTL ‐ 59.95 Hz

Eastern Interconnection Frequency Response Performance
NERC Analysis of February 1‐4, 2011 Texas and Southwestern U.S. Cold Snap 23
Figure 9: Eastern Interconnection Frequency – 2/4/11
59.94
59.95
59.96
59.97
59.98
59.99
60.00
60.01
60.02
60.03
60.04
60.05
60.06
Freq
uency (Hz)
Time (CST)
Frequency 60 Hz High FTL ‐ 60.05 Hz Low FTL ‐ 59.95 Hz

Western Interconnection Frequency Response Performance
24 NERC Analysis of February 1‐4, 2011 Texas and Southwestern U.S. Cold Snap
Western Interconnection Frequency Response Performance
The frequency response performance of the Western Interconnection during the period of February 1‐5, 2011 was reviewed to determine the interconnection frequency performance for the period. The analysis showed for the large unit trips that occurred during that period, frequency response in the interconnection was in the range of normal performance. Further, the frequency was well within normal frequency bounds throughout the period and no further detailed analysis of frequency response for the Western Interconnection was warranted.
Findings The following figures show the frequency15 for the Western Interconnection from February 1 ‐ 5, with some of the larger generator trips annotated. For perspective, the 5‐minute high and low Frequency Trigger Limits (FTLs) for the Western Interconnection are shown.
Figure 10: Western Interconnection Frequency – 2/1/11
15 From the Resource Adequacy tool, 1‐minute values
59.92
59.93
59.94
59.95
59.96
59.97
59.98
59.99
60.00
60.01
60.02
60.03
60.04
60.05
60.06
60.07
60.08
Frequency (Hz)
Time (MST)
Frequency 60 Hz High FTL ‐ 60.07 Hz Low FTL ‐ 59.93 Hz
Navajo 1 Trips at 756 MW

Western Interconnection Frequency Response Performance
NERC Analysis of February 1‐4, 2011 Texas and Southwestern U.S. Cold Snap 25
Figure 11: Western Interconnection Frequency – 2/2/11
Table 1 enumerates a number of generator trips that had influence on operating capacity for El Paso Electric and Salt River Project during the winter cold weather event.
Table 1: Western Interconnection Generation Trips
Date Time (MST)
Unit Winter Rating (MW)
Loading (MW)
Interconnection Frequency Response16
2/1/11 18:54 Navajo 1 750 756 ‐838 MW/0.1 Hz
2/2/11 02:56 Coronado 2 390 389 N/A
2/2/11 03:20 Four Corners 4 750 750 ‐691 MW/0.1 Hz
2/2/11 05:22 Santan 6 277 80 N/A
2/2/11 06:22 Navajo 2 750 756 ‐712 MW/0.1 Hz
2/2/11 06:34 Springerville 3 400 230 N/A
16 Calculated by the Frequency CERTS Frequency Monitoring and Analysis program, using the 1‐second data guide method approved by the NERC Resources Subcommittee
59.920
59.930
59.940
59.950
59.960
59.970
59.980
59.990
60.000
60.010
60.020
60.030
60.040
60.050
60.060
60.070
60.080
Freq
uency (Hz)
Time (MTS)
Frequency 60 Hz High FTL ‐ 60.07 Hz Low FTL ‐ 59.93 Hz
Four Corners 4 Trips at
750 MW
Navajo 2 Trips at 756 MW

Western Interconnection Frequency Response Performance
26 NERC Analysis of February 1‐4, 2011 Texas and Southwestern U.S. Cold Snap
Figure 12 shows the Western Interconnection frequency response performance during the tripping of Four Corners Unit 4 at 03:20 MST17 on February 2, 2011, using 1‐second resolution data from the CERTS Frequency Monitoring and Analysis program. The dip in frequency starting at about 03:19:35 is the beginning of the unit outage, first faltering and then tripping at about 03:20:39 due to control valve hydraulic problems.
Figure 12: Western Interconnection Frequency Response during Four Corners Unit 4 Trip on 2/2/11
Similar interconnection frequency performance was exhibited in the Western Interconnection for the following two days of the cold weather event, as shown in Figures 13 and 14.
17 All times in this section for the Western Interconnection are in Mountain Standard Time (MST).

Western Interconnection Frequency Response Performance
NERC Analysis of February 1‐4, 2011 Texas and Southwestern U.S. Cold Snap 27
Figure 13: Western Interconnection Frequency – 2/3/11
Figure 14: Western Interconnection Frequency – 2/4/11
59.920
59.930
59.940
59.950
59.960
59.970
59.980
59.990
60.000
60.010
60.020
60.030
60.040
60.050
60.060
60.070
60.080
Frequency (Hz)
Time (MTS)
Frequency 60 Hz High FTL ‐ 60.07 Hz Low FTL ‐ 59.93 Hz
59.920
59.930
59.940
59.950
59.960
59.970
59.980
59.990
60.000
60.010
60.020
60.030
60.040
60.050
60.060
60.070
60.080
Freq
uency (Hz)
Time (MTS)
Frequency 60 Hz High FTL ‐ 60.07 Hz Low FTL ‐ 59.93 Hz

Texas Interconnection Frequency Response Performance
28 NERC Analysis of February 1‐4, 2011 Texas and Southwestern U.S. Cold Snap
Texas Interconnection Frequency Response Performance
The frequency response performance of the Texas Interconnection, operated by ERCOT, during the period of February 1‐5, 2011 was reviewed to determine the interconnection’s performance for the period.
Findings Significant loss of generation throughout the cold snap resulted in serious imbalance at times between the generation and loads in the ERCOT area, causing severe frequency excursions. The imbalance necessitated a request to shed up to 4,000 MW of load to return balance to the system, restore frequency, and maintain adequate reserves to preserve system integrity should additional resources trip.
The critical day during the event was February 2nd, with generation outages of about 7,000 MW starting shortly after 06:00 CST18 through most of the day. The unavailability of 7,000 MW during this time period was in addition to scheduled and forced outages that had occurred prior to 06:00. Frequently throughout the day, when additional generators tripped, frequency dipped to about 59.8 Hz. Of particular concern that day was the period between 05:50 and 06:05. During that time, controllable generation decreased by 595 MW, wind generation decreased 106 MW, and load increased 585 MW, driving the interconnection frequency to about 59.57 Hz and primary frequency response estimated19 to be ‐321 MW/0.1 Hz.
ERCOT’s decisions to shed firm load were pivotal to maintaining the integrity of the interconnection after 05:30 on February 2nd. Controlled load shedding of 1,000 MW at 05:43 enabled ERCOT to survive the resource losses and load pickup experienced near the top of the 06:00 hour. Similarly, controlled interruption of an additional 1,000 MW of firm load at 06:04 assisted in recovery from the 59.57 Hz low frequency at 06:05. When the frequency showed signs of further decline at 06:23, ERCOT ordered an additional 2,000 MW of controlled firm load shedding, bringing the total request for controlled interruption to 4,000 MW. This decision was crucial to the recovery of frequency and replenishment of spinning reserves.
18 All times in this section for the Texas Interconnection are in Central Standard Time (CST). 19 Estimation provided by Sydney Niemeyer of NRG Texas LP, Chair of NERC’s Frequency Response Working Group

Texas Interconnection Frequency Response Performance
NERC Analysis of February 1‐4, 2011 Texas and Southwestern U.S. Cold Snap 29
Figure 15: Physical Spinning Reserve and Frequency Performance 05:35 to 06:35 CST on 2/2/11
Evaluation of Overall Frequency Response Performance The following figures show the frequency20 for the Texas Interconnection from February 1‐5, with key larger generator trips annotated. For perspective, the 5‐minute High and low Frequency Trigger Limits (FTLs) for the Texas Interconnection are shown. Note that data from the Resource Adequacy tool was corrupt for February 1 prior to 11:50.
20 From the Resource Adequacy tool, 1‐minute values
59.50
59.52
59.54
59.56
59.58
59.60
59.62
59.64
59.66
59.68
59.70
59.72
59.74
59.76
59.78
59.80
59.82
59.84
59.86
59.88
59.90
59.92
59.94
59.96
59.98
60.00
60.02
60.04
60.06
60.08
60.10
5:35 5:40 5:45 5:50 5:55 6:00 6:05 6:10 6:15 6:20 6:25 6:30 6:35
Hz
0
50
100
150
200
250
300
350
400
450
500
550
600
650
700
750
800
850
900
950
1000
1050
1100
1150
1200
1250
1300
1350
1400
1450
1500
MW
Frequency ERCOT Total Physical Reserve
Wednesday, February 02, 2011
Lowest Frequency of Event
Primary Frequency Reserve Response
too Slow
Spinning Physical Reserves
2,000 MW more Firm Load Shed4,000 MW Total
1,000 MW more Firm Load Shed2000 MW Total
1,000 MW Firm Load Shed

Texas Interconnection Frequency Response Performance
30 NERC Analysis of February 1‐4, 2011 Texas and Southwestern U.S. Cold Snap
Figure 16: Texas Interconnection Frequency – 2/1/11
Figure 17 focuses on the critical day of the cold weather event.21 Since several generators tripped on that day, only a select number of larger generators or trips at critical times are noted. With the exception of a smaller (145 MW) generator trip at 05:15, the primary frequency response to the B value was better than ‐410 MW/0.1 Hz.
21 The frequency scale on Figure 17 was expanded to accommodate the depth of the frequency excursion experienced on February 2.
59.90
59.91
59.92
59.93
59.94
59.95
59.96
59.97
59.98
59.99
60.00
60.01
60.02
60.03
60.04
60.05
60.06
60.07
60.08
60.09
60.10Freq
uency (Hz)
Time (CST)
Frequency 60 Hz High FTL ‐ 60.09 Hz Low FTL ‐ 59.91 Hz
459 MW Gen. Trip

Texas Interconnection Frequency Response Performance
NERC Analysis of February 1‐4, 2011 Texas and Southwestern U.S. Cold Snap 31
Figure 17: Texas Interconnection Frequency – 2/2/11
Figure 18: Texas Interconnection Frequency – 2/3/11
59.90
59.91
59.92
59.93
59.94
59.95
59.96
59.97
59.98
59.99
60.00
60.01
60.02
60.03
60.04
60.05
60.06
60.07
60.08
60.09
60.10
Freq
uency (Hz)
Time (CST)
Frequency 60 Hz High FTL ‐ 60.09 Hz Low FTL ‐ 59.91 Hz
611 MW Gen. Trip
59.70
59.72
59.74
59.76
59.78
59.80
59.82
59.84
59.86
59.88
59.90
59.92
59.94
59.96
59.98
60.00
60.02
60.04
60.06
60.08
60.10
Freq
uency (Hz)
Time (CST)
Frequency 60 Hz High FTL ‐ 60.09 Hz Low FTL ‐ 59.91 Hz
841 MW Gen. Trip
717 MW Gen. Trip
776 MW Gen. Trip
145 MW Gen. Trip
449 MW Unit Trips 3 Times
520 MW Gen. Trip
Combination of 5 Gen. Trip737 MW

Texas Interconnection Frequency Response Performance
32 NERC Analysis of February 1‐4, 2011 Texas and Southwestern U.S. Cold Snap
Figure 19: Texas Interconnection Frequency – 2/4/11
Detailed Analysis of Select Generation Trips Overnight on February 1st and the morning of February 2nd was the critical time for ERCOT from both a capacity adequacy and frequency response standpoint. As such, it is important to perform a more detailed analysis of individual generating unit trips and the critical period from about 05:30 to 06:15. The following are the analyses22 of a number of larger generator trips during that period.
The generator trip shown in Figure 20 shows a substantial ‐589.5 MW/0.1 Hz primary frequency response to the B value, but exhibits a relatively weak rebound in the first two minutes following the trip. ERCOT also looks at frequency response at B+30 seconds. Several of the instances listed below had poor response at the B+30 point. This is indicative of the weakening secondary response capability of the interconnection going into the morning of February 2.
22 Graphics courtesy of Sydney Niemeyer of NRG Texas LP, Chair of NERC’s Frequency Response Working Group
59.90
59.91
59.92
59.93
59.94
59.95
59.96
59.97
59.98
59.99
60.00
60.01
60.02
60.03
60.04
60.05
60.06
60.07
60.08
60.09
60.10Frequency (Hz)
Time (CST)
Frequency 60 Hz High FTL ‐ 60.09 Hz Low FTL ‐ 59.91 Hz

Texas Interconnection Frequency Response Performance
NERC Analysis of February 1‐4, 2011 Texas and Southwestern U.S. Cold Snap 33
Figure 20: 459 MW Generator Trip – 22:47 CST on 2/1/11
The 717 MW generator trip in Figure 21 also shows a weak rebound in the three minutes following the trip. The secondary response capability of the interconnection continued to weaken.
Figure 21: 717 MW Generator Trip – 02:18 CST on 2/2/11
59.80
59.82
59.84
59.86
59.88
59.90
59.92
59.94
59.96
59.98
60.00
60.02
60.04
60.06
60.08
60.10
22:2
6:48
22:2
6:58
22:2
7:08
22:2
7:18
22:2
7:28
22:2
7:38
22:2
7:48
22:2
7:58
22:2
8:08
22:2
8:18
22:2
8:28
22:2
8:38
22:2
8:48
22:2
8:58
22:2
9:08
22:2
9:18
22:2
9:28
22:2
9:38
22:2
9:48
22:2
9:58
22:3
0:08
Fre
qu
en
cy -
Hz
-900
-840
-780
-720
-660
-600
-540
-480
-420
-360
-300
-240
-180
-120
-60
0
MW
/0.1
Hz
Pri
mar
y F
req
uen
cy R
esp
on
se
Frequency Average Frequency Interconnection Frequency Response MW/0.1 Hz Avg IPFR
Tuesday, February 01, 2011459.3
0
459.3
Total MW Lost
MW Net Loss to Grid
LaaR Tripped or non-conforming load change
-589.51 Average Interconnection Primary Frequency Response MW/0.1 Hz
59.875
59.8916
59.9695
-589.51
-486.03 MW/0.1 Hz
MW/0.1 Hz 90.28% of Bias Setting
Primary Frequency Response at Point C
Primary Frequency Response at Point B average
59.80
59.82
59.84
59.86
59.88
59.90
59.92
59.94
59.96
59.98
60.00
60.02
60.04
60.06
60.08
60.10
2:17
:44
2:17
:54
2:18
:04
2:18
:14
2:18
:24
2:18
:34
2:18
:44
2:18
:54
2:19
:04
2:19
:14
2:19
:24
2:19
:34
2:19
:44
2:19
:54
2:20
:04
2:20
:14
2:20
:24
2:20
:34
2:20
:44
2:20
:54
2:21
:04
Fre
qu
ency
- H
z
-900
-840
-780
-720
-660
-600
-540
-480
-420
-360
-300
-240
-180
-120
-60
0M
W/0
.1 H
z P
rim
ary
Fre
qu
enc
y R
esp
on
se
Frequency Average Frequency Interconnection Frequency Response MW/0.1 Hz Avg IPFR
Wednesday, February 02, 2011717
0
717
Total MW Lost
MW Net Loss to Grid
LaaR Tripped or non-conforming load change
-452.54 Average Interconnection Primary Frequency Response MW/0.1 Hz
59.841 59.8551
60.0135
-452.54
-415.65 MW/0.1 Hz
MW/0.1 Hz 69.30% of Bias Setting
Primary Frequency Response at Point C
Primary Frequency Response at Point B average

Texas Interconnection Frequency Response Performance
34 NERC Analysis of February 1‐4, 2011 Texas and Southwestern U.S. Cold Snap
By the time the 145 MW generator tripped at 05:15 (in Figure 22), primary frequency response to the B value had fallen to a marginal ‐347.5 MW/0.1 Hz, and the combination of the early morning load pickup and other resource drop‐offs left the frequency continuing to fall after the first two minutes.
Figure 22: 145 MW Generator Trip – 05:15 CST on 2/2/11
When a 520 MW generator tripped at 05:39 (in Figure 23), primary frequency response to the B
value had improved to ‐417 MW/0.1 Hz, but very little secondary frequency response was
available and the frequency still languished near 59.78 Hz three minutes after the unit trip.
59.80
59.82
59.84
59.86
59.88
59.90
59.92
59.94
59.96
59.98
60.00
60.02
60.04
60.06
60.08
60.10
5:13
:18
5:13
:28
5:13
:38
5:13
:48
5:13
:58
5:14
:08
5:14
:18
5:14
:28
5:14
:38
5:14
:48
5:14
:58
5:15
:08
5:15
:18
5:15
:28
5:15
:38
5:15
:48
5:15
:58
5:16
:08
5:16
:18
5:16
:28
5:16
:38
Fre
qu
ency
- H
z
-800
-760
-720
-680
-640
-600
-560
-520
-480
-440
-400
-360
-320
-280
-240
-200
-160
-120
-80
-40
0
MW
/0.1
Hz
Pri
mar
y F
req
ue
ncy
Res
po
nse
Frequency Average Frequency Interconnection Frequency Response MW/0.1 Hz Avg IPFR
Wednesday, February 02, 2011145.5
0
145.5
Total MW Lost
MW Net Loss to Grid
LaaR Tripped
-347.47 Average Interconnection Primary Frequency Response MW/0.1 Hz
59.881
59.8790
59.9209
-347.47
-364.90 MW/0.1 Hz
MW/0.1 Hz 53.21% of Bias Setting
Primary Frequency Response at Point C
Primary Frequency Response at Point B average

Texas Interconnection Frequency Response Performance
NERC Analysis of February 1‐4, 2011 Texas and Southwestern U.S. Cold Snap 35
Figure 23: 520 MW Generator Trip – 05:39 CST on 2/2/11
At 05:43 following the loss of that unit, ERCOT declared an Energy Emergency Alert level 3 (EEA3), and ordered shedding of 1,000 MW of firm load. This controlled load shedding was pivotal in ERCOT’s ability to survive the resource losses they were to experience near the top of the hour.
Figure 24 shows the frequency for the Texas Interconnection from 05:35 to 06:35. Between 05:50 and 06:05, controllable generation decreased by 595 MW, wind generation decreased by 106 MW, and load increased by 585 MW. This net increased demand on reserves totaled about 1,280 MW, depleting the already‐low physical spinning reserves on the system. Consequently, the system frequency deteriorated to about 59.57 Hz, the lowest frequency experienced in the Texas Interconnection during the four‐day cold snap event. The primary frequency response to those events was estimated23 to be ‐321 MW/0.1 HZ.
At 06:04, ERCOT ordered another 1,000 MW of controlled firm load shedding, bringing the total
to 2,000MW.
Frequency continued to linger about 59.9 Hz for about 10 minutes, and then began to decline again as the morning load pickup continued to use up capacity reserves. When the frequency showed signs of further decline at 06:23, ERCOT ordered an additional 2,000 MW of firm load shedding, bring the total shed to 4,000 MW. This decision was crucial to the recovery of frequency and replenishment of spinning reserves.
23 Estimation provided by Sydney Niemeyer of NRG Texas LP, Chair of NERC’s Frequency Response Working Group
59.70
59.72
59.74
59.76
59.78
59.80
59.82
59.84
59.86
59.88
59.90
59.92
59.94
59.96
59.98
60.00
60.02
60.04
60.06
60.08
60.10
5:38
:16
5:38
:26
5:38
:36
5:38
:46
5:38
:56
5:39
:06
5:39
:16
5:39
:26
5:39
:36
5:39
:46
5:39
:56
5:40
:06
5:40
:16
5:40
:26
5:40
:36
5:40
:46
5:40
:56
5:41
:06
5:41
:16
5:41
:26
5:41
:36
Fre
qu
ency
- H
z
-800
-760
-720
-680
-640
-600
-560
-520
-480
-440
-400
-360
-320
-280
-240
-200
-160
-120
-80
-40
0
MW
/0.1
Hz
Pri
ma
ry F
req
uen
cy R
esp
on
se
Frequency Average Frequency Interconnection Frequency Response MW/0.1 Hz Avg IPFR
Wednesday, February 02, 2011520
0
520
Total MW Lost
MW Net Loss to Grid
LaaR Tripped
-417.28 Average Interconnection Primary Frequency Response MW/0.1 Hz
59.806
59.7979
59.9225
-417.28
-446.35 MW/0.1 Hz
MW/0.1 Hz 63.90% of Bias Setting
Primary Frequency Response at Point C
Primary Frequency Response at Point B average

Texas Interconnection Frequency Response Performance
36 NERC Analysis of February 1‐4, 2011 Texas and Southwestern U.S. Cold Snap
Figure 24: Texas Interconnection Frequency Performance 05:35 to 06:35 CST on 2/2/11
Figure 25 shows a 776 MW generator trip at 08:24. Primary frequency response, although still low at ‐421 MW/0.1 Hz, was sufficient to arrest the frequency decline near 59.84 Hz, and begin a recovery within two minutes. Following this unit trip, it took system frequency 19 minutes and 30 seconds to recover to 60 Hz.
Figure 25: 776 MW Generator Trip – 08:24 CST on 2/2/11
59.50
59.52
59.54
59.56
59.58
59.60
59.62
59.64
59.66
59.68
59.70
59.72
59.74
59.76
59.78
59.80
59.82
59.84
59.86
59.88
59.90
59.92
59.94
59.96
59.98
60.00
60.02
60.04
60.06
60.08
60.10
5:35 5:40 5:45 5:50 5:55 6:00 6:05 6:10 6:15 6:20 6:25 6:30 6:35
Hz
0
50
100
150
200
250
300
350
400
450
500
550
600
650
700
750
800
850
900
950
1000
1050
1100
1150
1200
1250
1300
1350
1400
1450
1500
MW
Frequency
Wednesday, February 02, 2011
2,000 MW more Firm Load Shed4,000 MW Total
1,000 MW more Firm Load Shed2000 MW Total
1,000 MW Firm Load Shed
59.80
59.82
59.84
59.86
59.88
59.90
59.92
59.94
59.96
59.98
60.00
60.02
60.04
60.06
60.08
60.10
8:23
:30
8:23
:40
8:23
:50
8:24
:00
8:24
:10
8:24
:20
8:24
:30
8:24
:40
8:24
:50
8:25
:00
8:25
:10
8:25
:20
8:25
:30
8:25
:40
8:25
:50
8:26
:00
8:26
:10
8:26
:20
8:26
:30
8:26
:40
8:26
:50
Fre
qu
ency
- H
z
-800
-760
-720
-680
-640
-600
-560
-520
-480
-440
-400
-360
-320
-280
-240
-200
-160
-120
-80
-40
0
MW
/0.1
Hz
Pri
mar
y F
req
ue
ncy
Res
po
nse
Frequency Average Frequency Interconnection Frequency Response MW/0.1 Hz Avg IPFR
Wednesday, February 02, 2011776
0
776
Total MW Lost
MW Net Loss to Grid
LaaR Tripped
-414.01 Average Interconnection Primary Frequency Response MW/0.1 Hz
59.853
59.8479
60.0354
-414.01
-425.50 MW/0.1 Hz
MW/0.1 Hz 63.40% of Bias Setting
Primary Frequency Response at Point C
Primary Frequency Response at Point B average

Texas Interconnection Frequency Response Performance
NERC Analysis of February 1‐4, 2011 Texas and Southwestern U.S. Cold Snap 37
Figure 26 shows an 841 MW generator trip at 10:55. Primary frequency response to the B value of ‐443.7 MW/0.1 Hz was sufficient to arrest the frequency decline near 59.82 Hz for this large generation loss, and begin a recovery within two minutes. By this time, total resource outages had dropped from a high of about 7,500 MW down to about 6,500 MW (as shown in Figure 27), improving the capacity situation in the interconnection.
Figure 26: 841 MW Generator Trip – 10:55 CST on 2/2/11
Figure 27: Total MWs Unavailable from 00:00 through 14:00 CST on 2/2/11
59.80
59.82
59.84
59.86
59.88
59.90
59.92
59.94
59.96
59.98
60.00
60.02
60.04
60.06
60.08
60.10
10:5
4:40
10:5
4:50
10:5
5:00
10:5
5:10
10:5
5:20
10:5
5:30
10:5
5:40
10:5
5:50
10:5
6:00
10:5
6:10
10:5
6:20
10:5
6:30
10:5
6:40
10:5
6:50
10:5
7:00
10:5
7:10
10:5
7:20
10:5
7:30
10:5
7:40
10:5
7:50
10:5
8:00
Fre
qu
en
cy -
Hz
-800
-760
-720
-680
-640
-600
-560
-520
-480
-440
-400
-360
-320
-280
-240
-200
-160
-120
-80
-40
0
MW
/0.1
Hz
Pri
ma
ry F
req
uen
cy R
esp
on
se
Frequency Average Frequency Interconnection Frequency Response MW/0.1 Hz Avg IPFR
Wednesday, February 02, 2011840.91
0
840.9
Total MW Lost
MW Net Loss to Grid
LaaR Tripped
-443.72 Average Interconnection Primary Frequency Response MW/0.1 Hz
59.802
59.8182
60.0077
-443.72
-408.70 MW/0.1 Hz
MW/0.1 Hz 67.95% of Bias Setting
Primary Frequency Response at Point C
Primary Frequency Response at Point B average
0
1000
2000
3000
4000
5000
6000
7000
8000
9000
0:00
0:15
0:30
0:45
1:00
1:15
1:30
1:45
2:00
2:15
2:30
2:45
3:00
3:15
3:30
3:45
4:00
4:15
4:30
4:45
5:00
5:15
5:30
5:45
6:00
6:15
6:30
6:45
7:00
7:15
7:30
7:45
8:00
8:15
8:30
8:45
9:00
9:15
9:30
9:45
10:00
10:15
10:30
10:45
11:00
11:15
11:30
11:45
12:00
12:15
12:30
12:45
13:00
13:15
13:30
13:45
14:00
Outaged MWs 02/02/2011(0000 ‐ 1400 Hours)
Outaged MWs

NERC Staff
38 NERC Analysis of February 1‐4, 2011 Texas and Southwestern U.S. Cold Snap
NERC Staff
Contributing NERC Staff
Name Title E‐mail Address
Mark G. Lauby Vice President and Director of Reliability Assessment and Performance Analysis
Robert W. Cummings Director of Reliability Initiatives and System Analysis [email protected]
Eric H. Allen Senior Engineer, Performance and Analysis [email protected]
Philip J. Tatro Senior Engineer, Performance and Analysis [email protected]
Trinh Ly Student Intern [email protected]