ANALYSIS OF POTENTIAL CAUSES OF CONSUMER FOOD PRICE INFLATION
55
Prepared for: THE RENEWABLE FUELS FOUNDATION Prepared by: November 2007 ANALYSIS OF POTENTIAL CAUSES OF CONSUMER FOOD PRICE INFLATION
Transcript of ANALYSIS OF POTENTIAL CAUSES OF CONSUMER FOOD PRICE INFLATION

Prepared for:
THE RENEWABLE FUELS FOUNDATION
Prepared by:
November 2007
ANALYSIS OF POTENTIAL CAUSES
OF CONSUMER FOOD PRICE INFLATION

Analysis of Potential Causes of Consumer Food Price Inflation
©
i
TABLE OF CONTENTS
I. Executive Summary............................................................................................4
A. Introduction...................................................................................................4
B. Key Findings.................................................................................................4
II. Introduction .........................................................................................................7
III. Consumer Food Prices.......................................................................................8
IV. Perspective on Consumer Food Expenditures ..............................................12
V. Relationship Between Corn Prices and Other Agricultural Commodities Prices .................................................................................................................15
A. Historical Relationships Among Corn and Other Commodity Prices ..........15 1. Grain and Oilseed Prices .....................................................................15 2. Livestock, Poultry, Egg, and Milk Prices ..............................................17
VI. Relationship Between Corn Prices and Consumer Food Prices ..................25
A. Historical Relationship between Corn Prices & Consumer Food Prices.....25
B. Price Spreads Among Different Levels of the Value Chain ........................28
C. Role of Margins as Shock Absorbers .........................................................29 1. Beef Cattle ...........................................................................................30 2. Hogs.....................................................................................................33 3. Poultry: Broilers and Eggs....................................................................34 4. Milk ......................................................................................................37
VII. Drivers of Food Price Inflation.........................................................................38
A. Summary of USDA Models of the Food CPI...............................................38
B. Food Marketing Costs ................................................................................39 1. Composition of the Retail Food Dollar .................................................39
VIII. Perspective on Commodity Price Inflation .....................................................42
A. Corn Prices.................................................................................................42
B. General Commodity and Macroeconomic Inflation.....................................45
IX. Conclusions ......................................................................................................49
Appendix A: Background on the “Food vs. Fuel” Debate .......................................51
A. Media Coverage .........................................................................................51
B. Research Publications................................................................................52 1. Center for Agricultural and Rural Development....................................52 2. National Corn Growers Association/Advanced Economics Solutions ..53 3. U.S. Department of Agriculture ............................................................53 4. American Farm Bureau Federation......................................................53

Analysis of Potential Causes of Consumer Food Price Inflation
©
ii
LIST OF TABLES Table 1: U.S. Exports of Shell Eggs and Egg Products, Jan.-Sep. 2003-2007..............20 Table 2: Corn/Cattle Price Correlation Coefficients .......................................................22 Table 3: Corn/Hog Price Correlation Coefficients ..........................................................22 Table 4: Corn/Broiler Price Correlation Coefficients ......................................................23 Table 5: Corn/Egg Price Correlation Coefficients ..........................................................23 Table 6: Corn/Milk Price Correlation Coefficients ..........................................................24 Table 7: Food CPI as a Function of Lagged Corn Prices...............................................26 Table 8: Correlation Between Food CPI Sub-Indices and Current/Lagged Corn
Prices ....................................................................................................................27 Table 9: R-Squared Values for Food CPI Sub-Indices Regressed Against Current
and Lagged Corn Prices .......................................................................................27 Table 10: Relationship Between Annual Crop-Year Changes in Food CPI Sub-
Indices and Corn Price Changes...........................................................................28 Table 11: Informa Feedlot Production Cost Model.........................................................31 Table 12: Hog Production Cost Model ...........................................................................34 Table 13: Broiler Production Costs and Impact of Higher Corn Price ............................36 Table 14: Egg Cost of Production Model .......................................................................36 Table 15: Farm Value Share of Retail Food Price by Food Category ............................40 Table 16: Examples: Cost of Farm Inputs as a Share of Prices of Select Retail
Food Products.......................................................................................................41 Table 17: U.S. Corn Balance Sheet...............................................................................44

Analysis of Potential Causes of Consumer Food Price Inflation
©
iii
LIST OF FIGURES
Figure 1: Historical Evolution of the Consumer Price Index for Food..............................8 Figure 2: Historical Growth in the Food CPI Compared to the Core CPI .........................9 Figure 3: Consumer Food Price Inflation: At-Home Versus Away-From-Home .............10 Figure 4: Consumer Price Indices..................................................................................11 Figure 5: Consumer Food Expenditures: Percent of Disposable Income Spent on
Food at Home vs. Away from Home .....................................................................12 Figure 6: Percent of Total Food Expenditures Spent at Home vs. Away from
Home ....................................................................................................................13 Figure 7: Historical Grain and Oilseed Prices (January 1995 - August 2007)................15 Figure 8: Corn, Livestock, Poultry, and Egg Prices, 1998/99 - 2006/07.........................18 Figure 9: Corn Price Comparison to the Milk Price ........................................................20 Figure 10: Growth in World Milk Product Demand.........................................................21 Figure 11: Food CPI as a Function of the Corn Price ....................................................25 Figure 12: Yearly Changes in Food CPI as a Function of Corn Price Changes.............26 Figure 13: Farm-to-Retail Price Spreads .......................................................................28 Figure 14: Beef Price Spreads.......................................................................................29 Figure 15: Pork Price Spreads.......................................................................................29 Figure 16: Cattle-Feeding Margins ................................................................................30 Figure 17 : Net Packer Margins, Based on Weighted Cutout ........................................32 Figure 18: Farrow-to-Finish Margins..............................................................................33 Figure 19: Broiler Margins .............................................................................................35 Figure 20: Milk Production Margins ...............................................................................37 Figure 21: Evolution of the Food Dollar by Cost Component.........................................40 Figure 22: Corn Supply/Demand Dynamics, Crop Years 2004/05 – 2006/07................42 Figure 23: Monthly Average Reuters/Jeffries CRB Futures Index, January 1970 -
September 2007....................................................................................................45 Figure 24: Reuters/Jeffries CRB Futures Index vs. NYMEX Crude Oil Futures,
August 1999 to September 2007...........................................................................46 Figure 25: U.S. Dollar Exchange Rate vs. the Euro.......................................................47 Figure 26: Year-Over-Year Percent Changes in the Reuters/Jeffries CRB and
CPI Indexes, 1970 - September 2007 ...................................................................48

Analysis of Potential Causes of Consumer Food Price Inflation
©
4
I. EXECUTIVE SUMMARY A. INTRODUCTION
Since fall 2006, public debate has intensified over the extent to which the expansion of the ethanol industry has resulted in higher agricultural commodity prices and, more importantly, whether and to what extent there has been an impact on consumer food prices. To date, this debate has been fueled mainly by anecdotal information. Given that this issue has bearing on major policy decisions with respect to agriculture and renewable energy, it is imperative that an objective, fact-based assessment be available to public policymakers. The Renewable Fuels Foundation (“RFF”) commissioned Informa Economics, Inc. (“Informa”) to conduct such an assessment, and the results are contained in this report. B. KEY FINDINGS
• The “farm value” of commodity raw materials used in foods accounts for 19% of total U.S. food costs, a proportion that has declined significantly from 37% in 1973. For food products where corn is only one of several farm-produced inputs, the proportion of the total product cost attributable to the cost of corn is even less than 19%. The remaining portion of total retail food costs is known as the marketing bill. The marketing bill includes the costs of labor, packaging, transportation, energy, profits, advertising, depreciation, rent, interest, repairs, business taxes and other costs not attributable to basic agricultural commodities. The marketing bill has a higher correlation with the consumer price index (CPI) for food than does corn, although there is a notable long-term upward trend to both the marketing bill and the food CPI. Within the overall marketing bill, the costs of energy and transportation have increased considerably over the last several years, with crude oil prices surging from just under $60 per barrel in fall 2006 to nearly $100 per barrel in November 2007, the same period during which corn prices have increased.
• An analysis was performed to quantify the historical price relationships between corn
prices and livestock, poultry, egg, and milk prices, and the results showed weak correlations. With these low correlations, it is statistically unsupported to suggest that high and/or rising corn prices are the causative reason behind high and rising retail meat, egg and milk product prices. Moreover, the upward trend in cattle, hog and poultry prices began in the late 1990s, well before the corn price began to increase significantly. Notably, dairy and egg prices have been driven higher mainly by strong export demand.
• More generally, there has historically been very little relationship between corn
prices and consumer food prices. Statistical relationships are weak even when corn price data are lagged to allow time for them to work their way through the food supply chain. The corn price would be considered a statistically insignificant variable in determining what drives the food CPI.

Analysis of Potential Causes of Consumer Food Price Inflation
©
5
• To provide context to an analysis of consumer food prices, it is useful to consider the role of food expenditures in the average American’s budget. The proportion of the average American’s disposable income that is spent on food has declined steadily over the last half-century, from 21% of disposable income in 1950 to below 10% in 2006. Additionally, the share of total food expenditures accounted for by at-home food consumption has been declining relative to away-from-home consumption. In 1950, 83% of total food expenditures were for at-home consumption, but by 2006 this share had declined to 58%.
• Consumer food prices have been increasing at a relatively steady pace over the last
two decades. The annual increase in the food CPI has averaged 2.96% since 1985, with food price inflation peaking at 5.84% in 1989 and falling to 1.2% in 1992. Since 1992, the rate of increase in the food CPI has averaged a slightly lower 2.57%. By comparison, the annualized growth rate during the first three-quarters of 2007 has been 3.40%. While growth rates in the CPI sub-index for food consumed away from home have been slowly trending upward since about 1994, the CPI for food consumed at home is significantly more volatile and is currently growing more rapidly than away-from-home food prices.
• The U.S. harvested a record corn crop of 11.8 billion bushels in 2004, but production
fell to 11.1 billion bushels in 2005 and dropped further to 10.5 billion bushels in 2006. Over the same time period, encompassing crop-marketing years 2004/05 through 2006/07, the usage of corn in ethanol production expanded to 2.1 billion bushels from 1.3 billion bushels. Yet, the ethanol industry was not the only source of additional demand for corn. U.S. corn exports, which were 1.8 billion bushels in 2004/05, rose to 2.1 billion bushels in both 2005/06 and 2006/07 – a level that was at the top of the range experienced over the previous decade. Thus, the combination of a reduction in supply and an increase in demand from both the ethanol industry and the export market led to corn prices moving higher starting in fall 2006.
• Sub-indices of the food CPI are reported for the major food product categories. It
was investigated whether the price of corn has a greater influence on these sub-indices than the overall food CPI. However, similar to the case with the overall food CPI, the relationship with the product sub-indices is generally weak.
• Given the weak correlation between corn prices and consumer food prices, it can be
hypothesized that a considerable proportion of the impact of corn price changes is absorbed by participants in the value chains for meats, poultry and other corn-based food products. This does not necessarily mean that margins within the value chain are low or negative, but rather that they are lower than they would be in the absence of higher corn prices.
• In summary, the statistical evidence does not support a conclusion that the growth in
the ethanol industry is driving consumer food prices higher. This is demonstrated by the fact that the R-squared statistic between nearby corn futures prices on the

Analysis of Potential Causes of Consumer Food Price Inflation
©
6
Chicago Board of Trade (CBOT) and the food CPI is only 0.04, which means that only 4% of the change in the food CPI is “explained” by fluctuations in nearby corn futures prices. Even when the corn price is lagged to allow for the effects to work their way through the food supply chain, the statistical results do not improve. It can be concluded that no single factor is the driver of consumer food prices over time – or the moderately higher-than-average inflation during the first three quarters of 2007 – but rather there is a complex and interrelated set of factors that contribute to food prices.

Analysis of Potential Causes of Consumer Food Price Inflation
©
7
II. INTRODUCTION Since fall 2006, public debate has intensified over the extent to which the expansion of the ethanol industry has resulted in higher agricultural commodity prices and, more importantly, whether and to what extent there has been an impact on consumer food prices. To date, this debate has been fueled mainly by anecdotal information. Given that this issue has bearing on major policy decisions with respect to agriculture and renewable energy, it is imperative that an objective, fact-based assessment be available to public policymakers. The Renewable Fuels Foundation (“RFF”) commissioned Informa Economics, Inc. (“Informa”) to conduct such an assessment, and the results are contained in this report. As a result of the confluence of several factors that are explained in Section VIII of this report, corn prices received by farmers increased to an average of $3.03 per bushel during the crop-marketing year that began in September 2006 and ended in August 2007, which was a substantial increase from the $2.09 per bushel that farmers received in August 2006, just before the start of the 2006/07 crop year. Similarly, it was considerably higher than the $2.00 per bushel average experienced during the 2005/06 crop year. However, other costs incurred in the production and distribution of food products were moving higher as well. The price of crude oil (West Texas Intermediate) hovered just below $60 per barrel in fall 2006, then increased to the $60-$70 per barrel range in the spring and early summer of 2007 and further to the $70-$80 per barrel range in the late summer and early fall of 2007; in November 2007, the price surged to near $100 per barrel. Additionally, transportation costs have been surging in recent years, propelled higher partly by increasing fuel prices and partly by capacity tightness relative to strengthening demand for transportation services. As will be shown in this report, no single factor is the driver of consumer food prices over time – or the moderately higher-than-average inflation during the first three quarters of 2007 – but rather there is a complex and interrelated set of factors that contribute to food price inflation. In addition to the analysis contained in this report, Appendix A provides background on media coverage of the “food versus fuel” debate and on other studies that have looked into whether ethanol industry growth and changes in corn prices are contributing to food price inflation.
Analysis of Potential Causes of Consumer Food Price Inflation
©
8
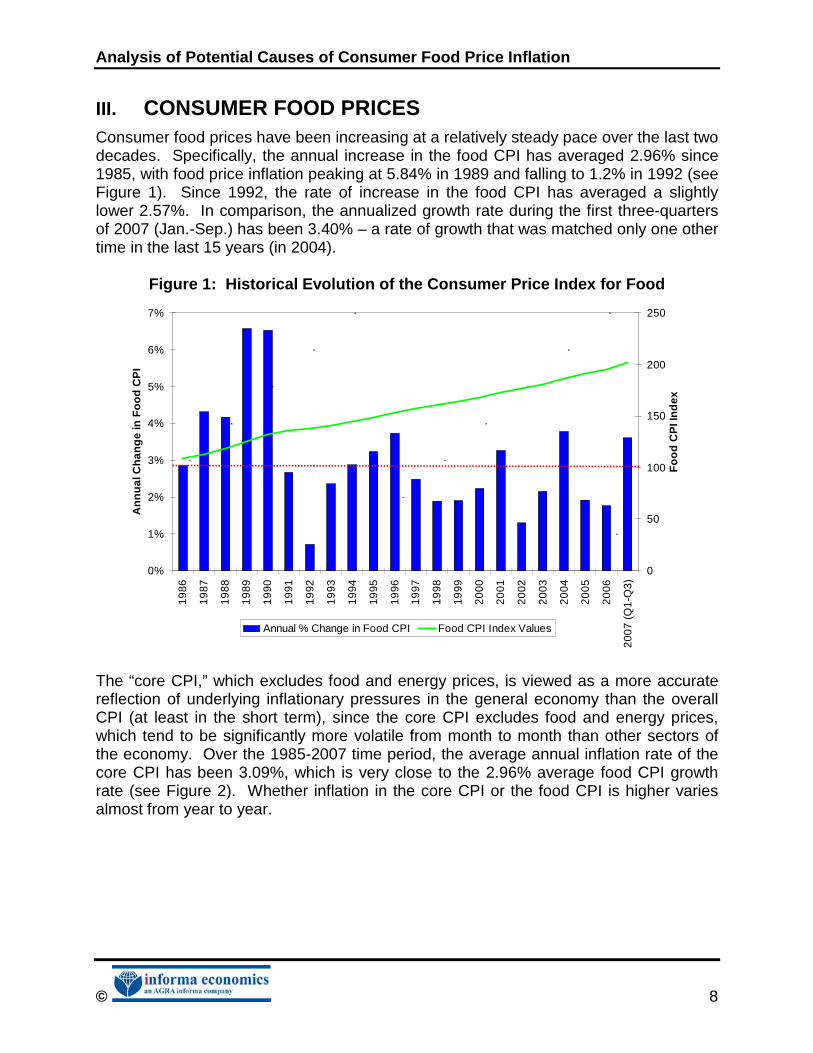
III. CONSUMER FOOD PRICES Consumer food prices have been increasing at a relatively steady pace over the last two decades. Specifically, the annual increase in the food CPI has averaged 2.96% since 1985, with food price inflation peaking at 5.84% in 1989 and falling to 1.2% in 1992 (see Figure 1). Since 1992, the rate of increase in the food CPI has averaged a slightly lower 2.57%. In comparison, the annualized growth rate during the first three-quarters of 2007 (Jan.-Sep.) has been 3.40% – a rate of growth that was matched only one other time in the last 15 years (in 2004).
Figure 1: Historical Evolution of the Consumer Price Index for Food
0%
1%
2%
3%
4%
5%
6%
7%
19
86
19
87
19
88
19
89
19
90
19
91
19
92
19
93
19
94
19
95
19
96
19
97
19
98
19
99
20
00
20
01
20
02
20
03
20
04
20
05
20
06
200
7 (Q
1-Q
3)
An
nu
al C
han
ge
in F
oo
d C
PI
0
50
100
150
200
250
Fo
od
CP
I In
dex
Annual % Change in Food CPI Food CPI Index Values
The “core CPI,” which excludes food and energy prices, is viewed as a more accurate reflection of underlying inflationary pressures in the general economy than the overall CPI (at least in the short term), since the core CPI excludes food and energy prices, which tend to be significantly more volatile from month to month than other sectors of the economy. Over the 1985-2007 time period, the average annual inflation rate of the core CPI has been 3.09%, which is very close to the 2.96% average food CPI growth rate (see Figure 2). Whether inflation in the core CPI or the food CPI is higher varies almost from year to year.

Analysis of Potential Causes of Consumer Food Price Inflation
©
9
Figure 2: Historical Growth in the Food CPI Compared to the Core CPI
0%
1%
2%
3%
4%
5%
6%
7%
1986
1987
1988
1989
1990
1991
1992
1993
1994
1995
1996
1997
1998
1999
2000
2001
2002
2003
2004
2005
2006
2007
(Q
1-Q
3)
An
nu
al C
han
ge
in C
PI I
nd
ices
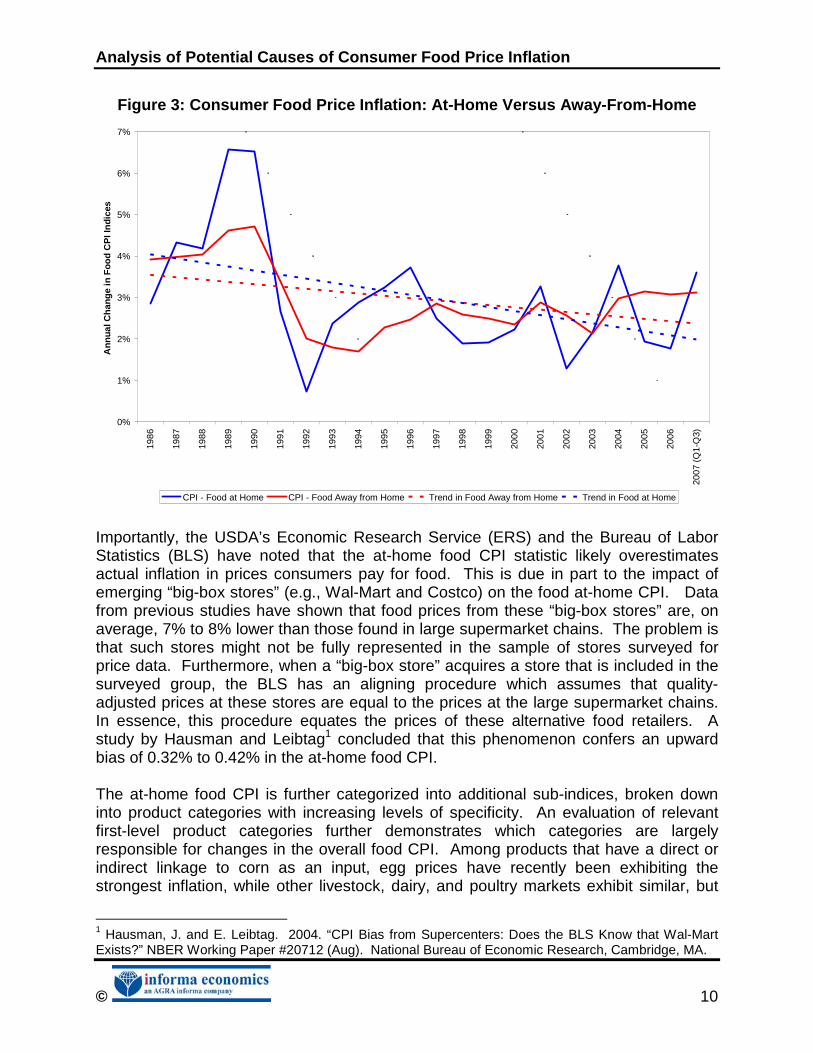
Core CPI (All items, less food and energy) Food CPI Trend in Core CPI Trend in Food CPI If only the period since 1992 is considered, core CPI inflation has on average been 0.17% below food CPI inflation. Essentially, this again indicates food CPI inflation has been similar to the core inflation rate over the long run. During this time period, the greatest differential between the two CPI inflation rates was in 2004, when food CPI inflation was higher than core CPI inflation by 1.69%. Similarly, from January to September 2007, the food CPI inflation rate has been running 1.32% above the core CPI inflation rate. Not only is the overall CPI composed of major expenditure categories such as food and energy, but the food CPI is composed of two main sub-indices: food consumed at home and food consumed away from home. While growth rates in the away-from-home food CPI have been slowly trending upward since about 1994, the at-home food CPI is significantly more volatile and is currently growing more rapidly than away-from-home food prices (see Figure 3). However, both are currently growing at rates exceeding the core CPI.
Analysis of Potential Causes of Consumer Food Price Inflation
©
10
Figure 3: Consumer Food Price Inflation: At-Home Versus Away-From-Home
0%
1%
2%
3%
4%
5%
6%
7%
1986
1987
1988
1989
1990
1991
1992
1993
1994
1995
1996
1997
1998
1999
2000
2001
2002
2003
2004
2005
2006
2007
(Q
1-Q
3)
An
nu
al C
han
ge
in F
oo
d C
PI I
nd
ices
CPI - Food at Home CPI - Food Away from Home Trend in Food Away from Home Trend in Food at Home Importantly, the USDA’s Economic Research Service (ERS) and the Bureau of Labor Statistics (BLS) have noted that the at-home food CPI statistic likely overestimates actual inflation in prices consumers pay for food. This is due in part to the impact of emerging “big-box stores” (e.g., Wal-Mart and Costco) on the food at-home CPI. Data from previous studies have shown that food prices from these “big-box stores” are, on average, 7% to 8% lower than those found in large supermarket chains. The problem is that such stores might not be fully represented in the sample of stores surveyed for price data. Furthermore, when a “big-box store” acquires a store that is included in the surveyed group, the BLS has an aligning procedure which assumes that quality-adjusted prices at these stores are equal to the prices at the large supermarket chains. In essence, this procedure equates the prices of these alternative food retailers. A study by Hausman and Leibtag1 concluded that this phenomenon confers an upward bias of 0.32% to 0.42% in the at-home food CPI. The at-home food CPI is further categorized into additional sub-indices, broken down into product categories with increasing levels of specificity. An evaluation of relevant first-level product categories further demonstrates which categories are largely responsible for changes in the overall food CPI. Among products that have a direct or indirect linkage to corn as an input, egg prices have recently been exhibiting the strongest inflation, while other livestock, dairy, and poultry markets exhibit similar, but
1 Hausman, J. and E. Leibtag. 2004. “CPI Bias from Supercenters: Does the BLS Know that Wal-Mart Exists?” NBER Working Paper #20712 (Aug). National Bureau of Economic Research, Cambridge, MA.

Analysis of Potential Causes of Consumer Food Price Inflation
©
11
much milder, trends (see Figure 4). In contrast, the CPI for cereals and bakery products has avoided the large, volatile swings that have occurred in the egg market. In general, the more value added in the manufacture of the product, the more consolidated the market, and the more price elastic the demand (i.e., costs cannot be passed along to consumers without lowering demand), the less volatile end-product prices will be.
Figure 4: Consumer Price Indices
80
100
120
140
160
180
200
220
1985
1986
1987
1988
1989
1990
1991
1992
1993
1994
1995
1996
1997
1998
1999
2000
2001
2002
2003
2004
2005
2006
2007
(Q
1-Q
3)
Co
nsu
mer
Pri
ce In
dic
es
Beef and Veal CPI Pork CPIPoultry CPI Eggs CPIDairy and Related Products CPI Cereals and Bakery Products CPI

Analysis of Potential Causes of Consumer Food Price Inflation
©
12
IV. PERSPECTIVE ON CONSUMER FOOD EXPENDITURES In providing context to the food-versus-fuel debate, in addition to examining how the CPI has changed over time it is also useful to consider the role of food expenditures in the average American’s budget. To start with, the proportion of the average American’s disposable income that is spent on food has declined steadily over the last half-century. In 1950, approximately 21% of disposable income was spent on food; by 2006, the share had broken below 10% (see Figure 5). Figure 5: Consumer Food Expenditures: Percent of Disposable Income Spent on
Food at Home vs. Away from Home
0
5
10
15
20
25
1950
1952
1954
1956
1958
1960
1962
1964
1966
1968
1970
1972
1974
1976
1978
1980
1982
1984
1986
1988
1990
1992
1994
1996
1998
2000
2002
2004
2006
Per
cen
t o
f D
isp
osa
ble
Inco
me
Food at Home Away from Home Source: USDA, Economic Research Service
Interestingly, the proportion of disposable income spent on food away from home has remained relatively stable over time. Away-from-home food consumption has remained in the range of 4.0% to 4.3% of total disposable income since 1976. Given the increase in consumers’ disposable income over time, this means that in nominal terms the total amount spent on food away-away-from home has increased substantially. In fact, per capita away-from-home food expenditures have increased 44% between 2000 and 2006, increasing from an average $971 to $1,402. Another trend within food expenditures is that the share accounted for by at-home food consumption has been declining relative to away-from-home consumption. Again, this is the share of food expenditures, whereas the previous paragraph addressed the share of disposable income. In 1950, 83% of total food expenditures were for at-home food consumption (see Figure 6). By 2006, this share had declined to 58%, and according to the USDA, it is predicted to fall to 51% by 2016.

Analysis of Potential Causes of Consumer Food Price Inflation
©
13
Figure 6: Percent of Total Food Expenditures Spent at Home vs. Away from Home
0%
10%
20%
30%
40%
50%
60%
70%
80%
90%
100%
1950
1953
1956
1959
1962
1965
1968
1971
1974
1977
1980
1983
1986
1989
1992
1995
1998
2001
2004
Fo
od
Exp
end
itu
res
Sp
ent
At
Ho
me
vs. A
way
fro
m H
om
e
At Home Away from Home
Source: USDA, Economic Research Service
Increases in food prices in 2007 have been showing up more in the at-home food CPI than the away-from-home food CPI, which is to be expected since at-home food prices historically have been more volatile than away-from-home food prices (refer back to Figure 3). However, given that the at-home food category has been a declining component of total food expenditures, and that food expenditures have accounted for a declining proportion of consumer incomes, the effect of any increase in at-home food prices on the average American’s financial condition will be considerably muted relative to what it would have been in the past. In the CARD study referenced in the appendix to this study, long-run general food prices were predicted to increase by as much as 1.8% above the “no ethanol” scenario. This was the most extreme scenario of the reviewed research publications, as the USDA forecasts long-run food price inflation equal to or less than the general inflation rate, the AFBF found no short- or long-term relationship, and the consulting firm AES only reported inflationary increases for individual products. However, even though the inflation rates estimated by AES were only examined for individual products, for most product categories the rates were less than those estimated by the CARD study. Therefore, it can be said that this average retail food price inflation estimation of 1.8% above the “no ethanol” control is the highest inflation rate estimation of those referenced. What would the scenario of 1.8% higher food price inflation mean for consumers? In 2006, the average disposable income was $32,114, with 9.9% of this being spent on food. This would mean that a 1.8% increase in the price food would increase the total

Analysis of Potential Causes of Consumer Food Price Inflation
©
14
annual food expenditures of an average household by about $57 dollars a year. With 58% of this being spent on at-home food expenditures, this means that the average American household can be expected to spend an extra $34 a year on their groceries. However, to understand the net impact on consumers’ financial condition, changes in expenditures on not only food but also fuel would have to be considered. Specifically, if more abundant supplies of ethanol were to result in a measurable reduction in retail fuel prices, this would have to be compared to any food price increase in determining the net impact to consumers. The effect of ethanol on retail fuel prices is not addressed in this study.

Analysis of Potential Causes of Consumer Food Price Inflation
©
15
V. RELATIONSHIP BETWEEN CORN PRICES AND OTHER AGRICULTURAL COMMODITIES PRICES
This section analyzes the relationships among the prices of corn, other commodities and consumer food prices. It examines whether there is a sufficient relationship between corn prices and other commodity and food prices to substantiate whether an increase in corn prices – regardless of the reason for the increase in corn prices – would cause an increase in the prices consumers pay for food. A. HISTORICAL RELATIONSHIPS AMONG CORN AND OTHER COMMODITY PRICES
1. Grain and Oilseed Prices
Grain and oilseed prices have always been highly volatile. In Figure 7, historical monthly nearby futures averages are shown for corn, soybeans, and wheat, the three major row crops grown in the U.S.2 Until recently, domestic demand for these commodities generally grew at a relatively steady rate, while changes in supply (usually due to weather) have been the main determinants of price volatility.
Figure 7: Historical Grain and Oilseed Prices (January 1995 - August 2007)
0.00
1.00
2.00
3.00
4.00
5.00
6.00
7.00
8.00
Jan-
85
Jan-
86
Jan-
87
Jan-
88
Jan-
89
Jan-
90
Jan-
91
Jan-
92
Jan-
93
Jan-
94
Jan-
95
Jan-
96
Jan-
97
Jan-
98
Jan-
99
Jan-
00
Jan-
01
Jan-
02
Jan-
03
Jan-
04
Jan-
05
Jan-
06
Jan-
07
Gra
ins
($/b
u)
0.00
2.00
4.00
6.00
8.00
10.00
12.00
Oils
eed
s- S
oyb
ean
($/
bu
)
Avg. Nearby Corn Futures Chicago Nearby Wheat Futures Avg. Nearby Soybean Futures
Source: Chicago Board of Trade
2 “Nearby” futures refer to the futures contract closest to expiration. For example, March futures would serve as the nearby corn contract during January and February of any given year, since contracts are not traded with delivery during those months.

Analysis of Potential Causes of Consumer Food Price Inflation
©
16
While these three commodities have only limited substitutability for each other, conditions in one market can influence the prices in another – often caused by the common denominator of weather. Recent increases in corn prices are no exception. While a record corn crop is being harvested in the fall of 2007, there is concern that increased demand will bring soybean supplies down to low levels by the end of the crop year, and weather problems in Australia and other wheat-growing nations have caused wheat prices to reach record levels. As a result, corn prices have not been able to fall as would have been expected given the size of the crop. This section provides a brief overview of the complex historical relationships among these three markets. The Corn Price Over the historical time period extending from January 1985 to August 2007, the average nearby corn futures price has averaged $2.46/bu. Weather had a substantial impact on corn futures prices in the 1988/89 crop year, when poor crops resulted in high prices. (The crop year for corn begins in September, when harvest gears up on a large scale, and ends in August of the following calendar year.) In 1995/96 record high corn prices were reached when a drop in production coincided with very strong export demand, resulting in record corn futures prices as high as $5.00/bu. Following record corn production in the 2004/05 crop year of 11.8 billion bushels and another crop over 11 billion bushels in 2005/06, corn futures prices declined to $2.23/bu in the 2005/06 crop year. However, driven by a significant decrease in corn acreage harvested in 2006, corn production fell to 10.5 billion bushels, while corn usage in ethanol production increased and exports rebounded strongly to the top end of the range experienced during the prior decade; as a result, nearby corn futures in 2006/07 increased to an average $3.56/bu., with spring prices approaching the $4.50/bu range. A fundamental driver of the price of corn is the level of inventories at the end of the crop-marketing year. Ending stocks are viewed by the industry as the “cushion” or “buffer” stocks available to incorporate increases in demand or reductions in supply in the following crop year. The larger the level of ending stocks, the more comfortable the market will be with a given level of demand. In particular, the ratio of yearend stocks to total consumption during the year is a key price determinant. Corn prices tend to weaken when supplies are plentiful relative to usage, whereas they strengthen when stocks are drawn down compared to demand. The level of stocks is market driven, as the U.S. government no longer carries large stocks as part of its corn support programs. Price Relationships among Corn, Wheat and Soybeans As was shown above in Figure 7, a general price relationship exists among these three crops. In 1995 the early frost that affected corn production also led to spikes in soybean and wheat prices. Just as the corn price increases were compounded by strong export demand, the wheat price increase was also compounded by other factors. These included low stocks that year and world supply issues, as production and export subsidies in the U.S. and EU were curtailed under the Uruguay Round of the General Agreement on Tariffs and Trade (now called the World Trade Organization, WTO).

Analysis of Potential Causes of Consumer Food Price Inflation
©
17
However, a weather problem for one crop does not necessarily always mean a supply problem for the other. A prime example of this is the drought of 2003, which affected the soybean crop but left the other two crops relatively unscathed. While weather plays a key role in explaining the relationship between these three commodities, it is not the only factor. Each market has its own set of supply and demand factors that can either exacerbate the problems in another market or help to mitigate potential price increases. Higher corn prices can influence wheat prices, but typically the reverse has not been true. This is because as corn prices move higher, wheat prices will be pulled higher to keep wheat from being used as a feed. However, the record wheat prices of 2007 are very much a result of supply-side issues. U.S. wheat supplies were reduced by adverse weather, including a spring freeze and unseasonably heavy rainfall around harvest. To add to the global supply problems, Australia’s wheat production has fallen significantly due to drought. Eastern Europe, Ukraine, and to some extent Canada – all of which are large-scale wheat producers – have also been having supply issues. In general, the demand bases for wheat and corn are quite different since the crops’ end-product uses are generally different, with corn mainly used as a feed grain and wheat mainly used as a food grain. Usually, the global wheat supply has a modest impact on corn exports, although for countries where wheat and barley are the primary feed grains, a weather problem can necessitate increased usage of other feed grains, including imported corn. Although there can be some linkage between the wheat and corn markets in such a case, corn futures prices are remaining at high levels in fall 2007 in order for corn to “compete” against high-priced soybeans for acres to be planted in spring 2008; this competition is mainly with soybeans as opposed to wheat, since wheat is typically grown in areas that are not necessarily best suited for corn. This competition between corn and soybean acres has affected the price relationship between these two commodities over the last couple of years. In the spring of 2006, futures prices provided a net revenue premium to grow soybeans compared to corn, and soybean acres expanded at the expense of corn. In 2007, the reverse was true, and corn acreage increased substantially. After the 2007 crop was made, the market realized that the pace of usage would bring soybean inventories to low levels at the end of the 2007/08 crop year, and if a larger soybean crop were not realized next year, the inventory situation would become particularly acute by the end of the 2008/09 crop year. This has led to inflation in the corn price over what it would have been had it not had to compete with soybean acreage. While part of the increase in soybean prices can be attributed to the shift of some soybean acres to corn in 2007, it can be argued that the price of soybeans would not have gone quite so high had it not been for the price of crude oil (petroleum), which has driven soybean oil prices higher due to the growth of the biodiesel industry. 2. Livestock, Poultry, Egg, and Milk Prices
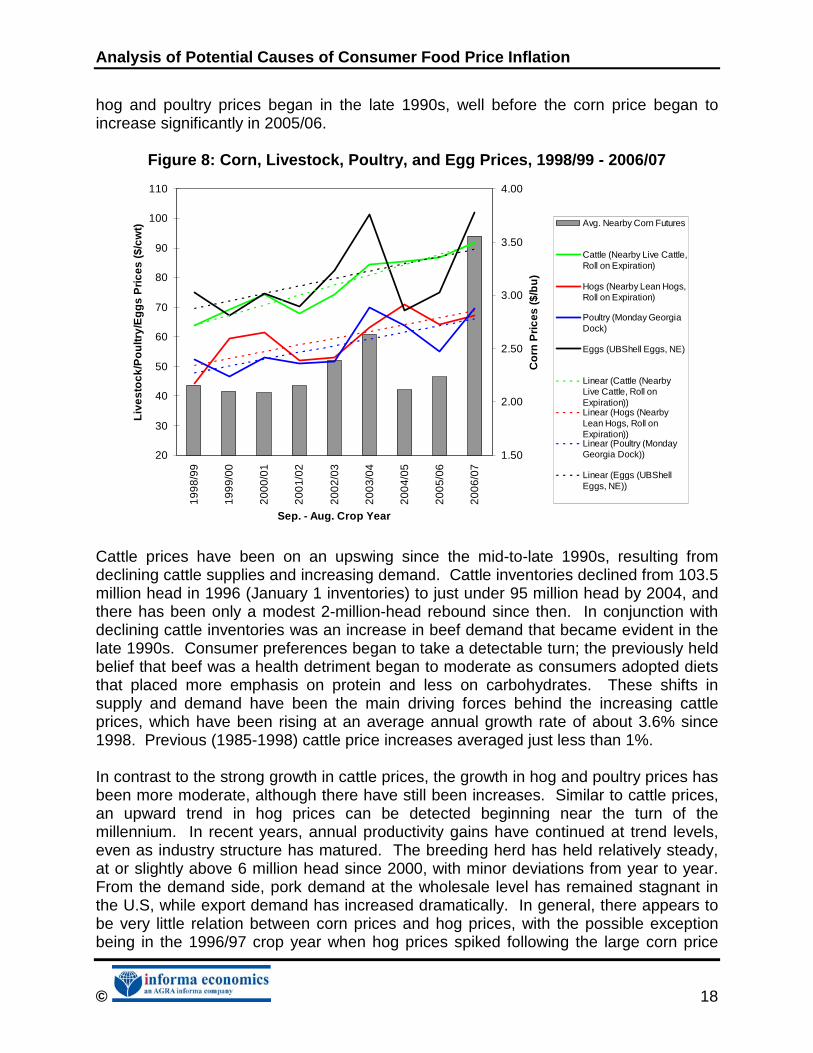
Figure 8 provides a visual indication that there is not a strong correlation between corn prices and livestock or poultry prices. It is also evident that the upward trend in cattle,
Analysis of Potential Causes of Consumer Food Price Inflation
©
18
hog and poultry prices began in the late 1990s, well before the corn price began to increase significantly in 2005/06.
Figure 8: Corn, Livestock, Poultry, and Egg Prices, 1998/99 - 2006/07
20
30
40
50
60
70
80
90
100
1101
998/
99
199
9/00
200
0/01
200
1/02
200
2/03
200
3/04
200
4/05
200
5/06
200
6/07
Sep. - Aug. Crop Year
Liv
esto
ck/P
ou
ltry/
Eg
gs
Pri
ces
($/c
wt)
1.50
2.00
2.50
3.00
3.50
4.00
Co
rn P
rice
s ($
/bu
)
Avg. Nearby Corn Futures
Cattle (Nearby Live Cattle,Roll on Expiration)
Hogs (Nearby Lean Hogs,Roll on Expiration)
Poultry (Monday GeorgiaDock)
Eggs (UBShell Eggs, NE)
Linear (Cattle (NearbyLive Cattle, Roll onExpiration))Linear (Hogs (NearbyLean Hogs, Roll onExpiration))Linear (Poultry (MondayGeorgia Dock))
Linear (Eggs (UBShellEggs, NE))
Cattle prices have been on an upswing since the mid-to-late 1990s, resulting from declining cattle supplies and increasing demand. Cattle inventories declined from 103.5 million head in 1996 (January 1 inventories) to just under 95 million head by 2004, and there has been only a modest 2-million-head rebound since then. In conjunction with declining cattle inventories was an increase in beef demand that became evident in the late 1990s. Consumer preferences began to take a detectable turn; the previously held belief that beef was a health detriment began to moderate as consumers adopted diets that placed more emphasis on protein and less on carbohydrates. These shifts in supply and demand have been the main driving forces behind the increasing cattle prices, which have been rising at an average annual growth rate of about 3.6% since 1998. Previous (1985-1998) cattle price increases averaged just less than 1%. In contrast to the strong growth in cattle prices, the growth in hog and poultry prices has been more moderate, although there have still been increases. Similar to cattle prices, an upward trend in hog prices can be detected beginning near the turn of the millennium. In recent years, annual productivity gains have continued at trend levels, even as industry structure has matured. The breeding herd has held relatively steady, at or slightly above 6 million head since 2000, with minor deviations from year to year. From the demand side, pork demand at the wholesale level has remained stagnant in the U.S, while export demand has increased dramatically. In general, there appears to be very little relation between corn prices and hog prices, with the possible exception being in the 1996/97 crop year when hog prices spiked following the large corn price

Analysis of Potential Causes of Consumer Food Price Inflation
©
19
spike in 1995/96. While most of this increase is attributed to constrained supplies of pork that year, the large increase in corn prices the previous year (exceeding the recent corn price spike in 2006/07) may have partially motivated these supply reductions. Poultry prices remained relatively flat across the 1985/86 to 1999/00 time period, averaging $54.50/cwt. Since then, poultry prices have been trending upward at an average annual growth rate of 4% (averaging $67.86/cwt). Such price increases can be largely explained by increasing per capita poultry consumption. Further demand increases have been seen following the Avian Influenza found within Asia and Europe in 2003. Such demand increases, along with tight supplies, resulted in the record-high prices recorded during the 2003/04 crop year. Then in 2005/06, prices dropped back down as exports backed off as a result of the record prices. Egg prices, on the other hand, have been relatively more responsive to corn prices. There are several reasons for this tighter relationship. First, while the egg industry supply chain is not as concentrated as the broiler industry, it is still relatively integrated and consolidated. These larger, integrated operations are able to make supply decisions and respond more quickly to changing input prices than small, independent laying operations. Second, demand for eggs is relatively inelastic, as they are a cheaper source of protein than meats or other livestock products and are used in a range of processed food products. This enables price changes to be passed on to consumers without affecting overall consumption severely. Egg values have been extremely high in 2007. With production margins extremely poor during 2005 and into 2006, producers cut their laying flocks considerably. Consequently, egg production has fallen. The total number of eggs produced up to this point in 2007 is about 1.5% fewer than the number of eggs produced during the same time period in 2006. Along with a diminished U.S. egg supply, export trade of both eggs and egg products has risen strongly during 2007 (see Table 1). There has been a significant increase in exports of both shell eggs and egg products during the first nine months of 2007 compared to recent years. Even though exports of shell eggs still account for less than 2% of all U.S. egg production, the increase in exports combined with diminished egg production was enough to skim necessary supplies from an already tight domestic market for eggs and has been a contributing factor to higher egg prices in 2007. Similarly, inelastic demand for milk leads to a moderately tighter relationship between corn and milk prices than with other livestock and poultry prices (see Figure 9). That being said, recent milk price increases have been driven primarily by substantial increases in world dairy product demand and tight world supplies that resulted from major droughts in leading milk-producing countries, such as Australia (see Figure 10).

Analysis of Potential Causes of Consumer Food Price Inflation
©
20
Table 1: U.S. Exports of Shell Eggs and Egg Products, Jan.-Sep. 2003-2007
Year Table Eggs (1,000 dozen)
Shell Eggs (1,000 dozen)
All Egg Products, Liquid Equivalent
(1,000 lbs)
2003 (Jan-Sep) 33,523 68,816 70,603
2004 (Jan-Sep) 36,123 73,157 61,195
2005 (Jan-Sep) 47,216 82,250 110,308
2006 (Jan-Sep) 37,838 75,478 114,536
2007 (Jan-Sep) 62,170 107,057 125,603
Note: Since only Jan.-Sep. data are available for 2007, data for the same time periods in previous years are shown for purposes of comparison.
Figure 9: Corn Price Comparison to the Milk Price
9.0
10.0
11.0
12.0
13.0
14.0
15.0
16.0
17.0
19
85/8
6
19
86/8
7
19
87/8
8
19
88/8
9
19
89/9
0
19
90/9
1
19
91/9
2
19
92/9
3
19
93/9
4
19
94/9
5
19
95/9
6
19
96/9
7
19
97/9
8
19
98/9
9
19
99/0
0
20
00/0
1
20
01/0
2
20
02/0
3
20
03/0
4
20
04/0
5
20
05/0
6
20
06/0
7
Sep. - Aug. Crop Year
Milk
Pri
ce ($
/cw
t)
1.5
2.0
2.5
3.0
3.5
4.0
Co
rn P
rice
($/b
u)
Milk Avg. Nearby Corn Futures Linear (Milk)

Analysis of Potential Causes of Consumer Food Price Inflation
©
21
Figure 10: Growth in World Milk Product Demand
Source: USDA
Correlation Analysis
An analysis was performed to quantify the historical price relationships between corn prices and livestock, poultry, egg, and milk prices, and the results showed rather weak correlations. With these low correlations, it is statistically unsupported to suggest that high and/or rising corn prices are the causative reason behind high and rising retail meat, egg and milk product prices. Quarterly average nearby corn futures prices were analyzed relative to quarterly average nearby cattle and nearby hog prices and quarterly cash price averages for broilers, milk and eggs (January 1985 – September 2007). Direct quarter to quarter correlations were calculated as were lagged correlations for one, two, three and four quarters to identify if there was a lagged impact from corn prices on meat, egg, and milk prices. The results are presented below. Cattle and Beef
In the cattle-and-beef sector, the correlation coefficients were weak over short periods of time and even negative over longer periods of time, which indicates that there is no discernible strong relationship between corn prices and cattle prices (see Table 2). Based on this analysis, it can be concluded that high corn costs do not automatically result in higher cattle prices, either in the short term or over a 12-16 month period. The higher costs of producing beef result in a negative impact on cattle feeders’ margins, and this ultimately would have a negative impact on feeder cattle prices (i.e., the prices paid animals entering feedlots). Irrespective of the price of corn, the price of fed cattle and beef might be higher or lower, with such prices determined by the supply/demand conditions in the beef market.
200,000
250,000
300,000
350,000
400,000
450,000
500,000
550,000
1980
1982
1984
1986
1988
1990
1992
1994
1996
1998
2000
2002
2004
Wh
ole
Milk
Bas
is (1
,000
ton
nes
)
Milkfat SNF Total Solids

Analysis of Potential Causes of Consumer Food Price Inflation
©
22
Table 2: Corn/Cattle Price Correlation Coefficients
Current +0.18 1 Qtr lag +0.15 2 Qtr lag +0.06 3 Qtr lag -0.06 4 Qtr lag -0.21
The cattle and beef industry has a rather complex supply chain, as numerous independent entities participate in the production of cattle as they progress from the core cow-calf production operation through backgrounding activities and then on through commercial cattle-feeding activities. In the production process for grain-fed beef, it can take anywhere from 16 to 24 months for an animal to move from birth to slaughter. Multiple buy/sell transactions occur in this process, as young calves are typically sold to operations that put these animals on forage programs and then eventually sell the animals to feedlot operations that feed out the animals to slaughter weights. The complexity of this process has a tendency of disrupting the supply response to changing cattle prices and changes in feed costs, which is likely reflected in the weak correlations between cattle and corn prices. Hogs and Pork
Within a single quarter there is virtually no correlation between corn prices and hog prices, as measured by nearby futures prices. Given the length of the breeding and production process (10-12 months), a lag of at least 4 quarters between high feed costs and any possible impact on hog prices would be anticipated. Historically, producers endured losses for at least two quarters prior to adjusting breeding inventories; if that behavior pattern still holds, there would theoretically be a relationship between corn prices lagged 5 or 6 quarters and hog prices. However, the correlations between corn prices and hog prices for all lagged time periods are very weak (see Table 3).
Table 3: Corn/Hog Price Correlation Coefficients
Current +0.15 1 Qtr lag +0.19 2 Qtr lag +0.18 3 Qtr lag +0.17 4 Qtr lag +0.22 5 Qtr lag +0.19 6 Qtr lag +0.06 7Qtr lag - 0.01
Even with a 4-quarter lag on corn prices, the correlation of +0.22 is so weak that it cannot be concluded that higher corn prices result in higher hog prices. Once again, if higher corn prices were going to have an impact on pork supply and prices, such impacts would be expected at least a year from when corn prices rise. However, when further lags are considered (5, 6, and 7 quarters), the correlation actually begins to decline.

Analysis of Potential Causes of Consumer Food Price Inflation
©
23
Broilers
In the broiler (chicken) sector, there does appear to be a slightly higher degree of linkage between broiler prices and corn prices. Still, correlation coefficients below 0.75 (actually, between -0.75 and 0.75) are considered tenuous at best, and the highest correlation coefficient between corn and the Georgia dock broiler price is only 0.3 (see Table 4).
Table 4: Corn/Broiler Price Correlation Coefficients
Current +0.25 1 Qtr lag +0.31 2 Qtr lag +0.23 3 Qtr lag +0.12 4 Qtr lag +0.03
The coefficient of 0.25 within a single quarter indicates a weak relationship between corn and broiler prices. The fact that the coefficient with a one-quarter lag is a little higher does suggest that there is a very weak price relationship; however, over time the correlation coefficients get smaller (weaker), which indicates that there is little relationship between the cost of corn and the price of broilers. Eggs
While correlations between corn and egg prices were the strongest observed for any of the livestock/poultry markets, the correlation coefficients would still be considered statistically weak. Again, a correlation between -0.75 and 0.75 is generally considered statistically insufficient to be used in modeling or predictions (for an equation with a single explanatory variable). Within a single quarter, or with up to a two-quarter lag in corn prices, the correlation coefficient between corn and eggs is gravitates around 0.5 (see Table 5). When a further lag in corn prices is considered, the correlations worsen.
Table 5: Corn/Egg Price Correlation Coefficients
Current +0.51 1 Qtr lag +0.49 2 Qtr lag +0.51 3 Qtr lag +0.39 4 Qtr lag +0.13
Egg producers have the capability of adjusting short-term production volumes, which in turn can have fairly immediate impacts on egg prices. If corn prices were the driver of either “high” or “low” egg prices, the correlation coefficients would be substantially higher than those found and presented above. It would appear that other factors besides corn prices contribute to egg price changes. For example, egg-product exports have increased to 126 million pounds during the first nine months of 2007, compared to 115 million pounds during the same period in 2006, which has resulted in high egg

Analysis of Potential Causes of Consumer Food Price Inflation
©
24
prices; the role of high corn prices appears to have been, at most, a secondary contributor. Dairy and Milk
Again, there is only a moderate degree of correlation between corn prices and milk prices (stronger than the broiler market but weaker than the egg market). The correlation coefficients for nearby corn futures prices and milk prices are shown in Table 6.
Table 6: Corn/Milk Price Correlation Coefficients
Current +0.27 1 Qtr lag +0.41 2 Qtr lag +0.44 3 Qtr lag +0.31 4 Qtr lag +0.13
Analysis of Potential Causes of Consumer Food Price Inflation
©
25
VI. RELATIONSHIP BETWEEN CORN PRICES AND CONSUMER FOOD PRICES
A. HISTORICAL RELATIONSHIP BETWEEN CORN PRICES & CONSUMER FOOD PRICES
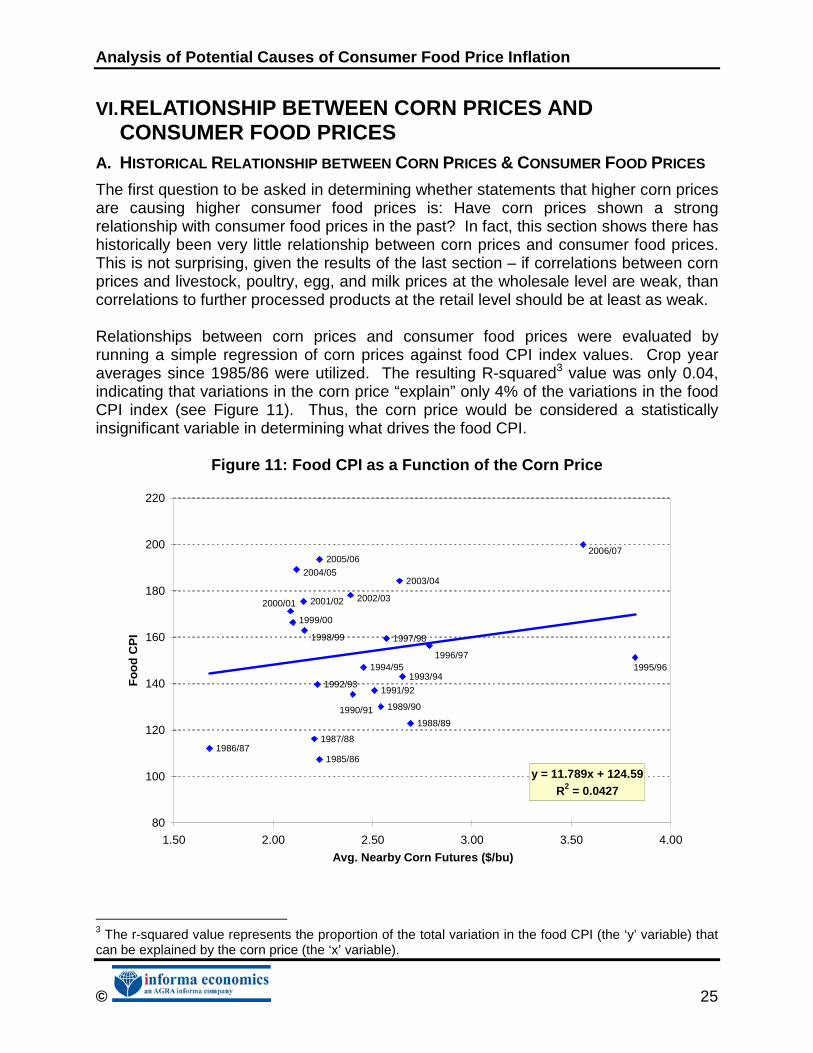
The first question to be asked in determining whether statements that higher corn prices are causing higher consumer food prices is: Have corn prices shown a strong relationship with consumer food prices in the past? In fact, this section shows there has historically been very little relationship between corn prices and consumer food prices. This is not surprising, given the results of the last section – if correlations between corn prices and livestock, poultry, egg, and milk prices at the wholesale level are weak, than correlations to further processed products at the retail level should be at least as weak. Relationships between corn prices and consumer food prices were evaluated by running a simple regression of corn prices against food CPI index values. Crop year averages since 1985/86 were utilized. The resulting R-squared3 value was only 0.04, indicating that variations in the corn price “explain” only 4% of the variations in the food CPI index (see Figure 11). Thus, the corn price would be considered a statistically insignificant variable in determining what drives the food CPI.
Figure 11: Food CPI as a Function of the Corn Price
2006/072005/06
2004/052003/04
2002/032001/022000/01
1999/00
1998/99 1997/98
1996/971995/961994/95
1993/941992/93
1991/92
1990/91 1989/90
1988/89
1987/881986/87
1985/86
y = 11.789x + 124.59R2 = 0.0427
80
100
120
140
160
180
200
220
1.50 2.00 2.50 3.00 3.50 4.00
Avg. Nearby Corn Futures ($/bu)
Fo
od
CP
I
3 The r-squared value represents the proportion of the total variation in the food CPI (the ‘y’ variable) that can be explained by the corn price (the ‘x’ variable).

Analysis of Potential Causes of Consumer Food Price Inflation
©
26
In reality, it would be expected that a change in the corn price would take time to work its way through the value chain before the food CPI is affected, so that the impact might not be instantaneous. However, the R-squared values do not improve when quarterly prices are used and the corn price is lagged by as many as four quarters (see Table 7).
Table 7: Food CPI as a Function of Lagged Corn Prices
Corn Price CorrelationR-Squared
ValueCurrent 0.2010 0.04041 Quarter Lag 0.1749 0.03062 Quarter Lag 0.1351 0.01833 Quarter Lag 0.0558 0.00314 Quarter Lag -0.0078 0.0001
Given that a general upward trend in the food CPI is prevalent, another regression was run using crop-year changes in corn prices against the crop-year changes in the food CPI. Again, very little of the food CPI inflation rate can be directly explained by year-to-year movements in the corn price, as reflected in an R-squared of 0.002 (see Figure 12). The corn price variable is statistically insignificant in the regression equation.
Figure 12: Yearly Changes in Food CPI as a Function of Corn Price Changes
2006/07
2005/06
2004/05
2003/04
2002/03
2001/02
2000/01
1999/001998/99
1997/98
1996/97
1995/961994/95
1993/94
1992/93
1991/92
1990/91
1989/901988/89
1987/88
1986/87
1985/86
y = 0.0025x + 0.0297R2 = 0.0023
0%
1%
2%
3%
4%
5%
6%
7%
-40% -30% -20% -10% 0% 10% 20% 30% 40% 50% 60% 70%
Annual Crop Year Change in Nearby Corn Futures
An
nu
al C
rop
Yea
r C
han
ge
in F
oo
d C
PI
While movements in the overall food CPI are not explained well by the price of corn, it was investigated whether the price of corn has a greater influence on sub-categories within the food CPI. Similar to the case with the overall food CPI, the relationship with

Analysis of Potential Causes of Consumer Food Price Inflation
©
27
the product sub-indices is generally weak, with only eggs having an R-squared over 0.1 (see Table 8 and Table 9). This is true even if lagged corn prices are used.
Table 8: Correlation Between Food CPI Sub-Indices and Current/Lagged Corn Prices
Corn PriceBeef and Veal CPI Pork CPI Poultry CPI Eggs CPI
Dairy and Related
Products CPI
Cereals and Bakery
Products CPI
Current 0.1968 0.1701 0.2164 0.4163 0.1413 0.21861 Quarter Lag 0.1534 0.1830 0.2286 0.0064 0.1435 0.20062 Quarter Lag 0.0947 0.1689 0.2078 0.3782 0.1243 0.16603 Quarter Lag -0.0068 0.0939 0.1243 0.2936 0.0491 0.09194 Quarter Lag -0.0798 0.0370 0.0427 0.1427 -0.0186 0.0321
Table 9: R-Squared Values for Food CPI Sub-Indices Regressed Against Current
and Lagged Corn Prices
Corn PriceBeef and Veal CPI Pork CPI Poultry CPI Eggs CPI
Dairy and Related
Products CPI
Cereals and Bakery
Products CPI
Current 0.0387 0.0289 0.0468 0.1733 0.0200 0.04781 Quarter Lag 0.0235 0.0335 0.0523 0.0000 0.0206 0.04022 Quarter Lag 0.0090 0.0285 0.0432 0.1431 0.0154 0.02763 Quarter Lag 0.0000 0.0088 0.0155 0.0862 0.0024 0.00844 Quarter Lag 0.0064 0.0014 0.0018 0.0204 0.0003 0.0010
The value chain for eggs is relatively more consolidated than other product value chains, as there are fewer handlers; eggs also generally have less value added than other food categories, and their price elasticity of demand is highly inelastic. These are all potential reasons to explain the slight but notable correlation between the eggs CPI and the corn price. Still, this relationship is too weak to be statistically significant. Despite the fact that milk is also considered to be a highly price-inelastic product, a very weak correlation with corn prices (lagged or current) is exhibited. Considering that there are trends in some food CPI sub-indices, an attempt was again made to determine whether there would be a more notable relationship between the annual crop-year percent change in the corn price and the annual crop-year percent change in the food CPI sub-indices. Again, the eggs CPI had the strongest correlation with corn prices, but the R-squared value was only 0.30; the corn price variable was statistically significant at the 5% level (the first regression where this was the case), but it still suggests that only 30% of the yearly movements in the eggs CPI can be attributed to yearly corn price changes (see Table 10). Other correlation and regression results indicate very weak price relationships – in some cases negative.

Analysis of Potential Causes of Consumer Food Price Inflation
©
28
Table 10: Relationship Between Annual Crop-Year Changes in Food CPI Sub-Indices and Corn Price Changes
Correlation R-SquaredAnnual Crop Year % Change in Meats (beef and pork) CPI -0.1078 0.0116Annual Crop Year % Change in Beef and Veal CPI -0.0228 0.0005Annual Crop Year % Change in Pork CPI -0.1901 0.0361Annual Crop Year % Change in Poultry CPI 0.0835 0.0070Annual Crop Year % Change in Eggs CPI 0.5505 0.3031Annual Crop Year % Change in Cereals and Bakery Products CPI 0.2756 0.0760 B. PRICE SPREADS AMONG DIFFERENT LEVELS OF THE VALUE CHAIN
There are several segments in the value chain between the farm and the consumer. For grains and oilseeds, there are grain elevators, bulk processors (e.g., flour millers and soybean crushers), further processors (e.g., packaged food manufacturers), wholesale distributors, and retail grocery and foodservice establishments that take basic commodities, transform them and deliver them to the consumer. For livestock and poultry, there are slaughterhouses and sometimes separate first-stage and further processors that produce in-tray meat cuts/poultry and packaged food products containing meats/poultry; distributors and retailers bring these products to consumers, while foodservice establishments prepare the meats/poultry before they are served. There are various economic factors (supply/demand and costs) and industry structure issues that determine the margins at each of these value-chain segments and the degree to which they can pass along cost increases. The historical price spreads from farm to wholesale and from wholesale to retail are shown in Figure 13 to Figure 15.
Figure 13: Farm-to-Retail Price Spreads
140
190
240
290
340
390
Ma
y-02
Aug
-02
Nov
-02
Fe
b-0
3
Ma
y-03
Aug
-03
Nov
-03
Fe
b-0
4
Ma
y-04
Aug
-04
Nov
-04
Fe
b-0
5
Ma
y-05
Aug
-05
Nov
-05
Fe
b-0
6
Ma
y-06
Aug
-06
Nov
-06
Fe
b-0
7
Ma
y-07
Far
m-t
o-R
etai
l Pri
ce S
pre
ad(In
dex
Val
ues
: 198
2-84
=100
)
Poultry - Farm-retail spread Eggs - Farm-retail spread Dairy products - Farm-retail spread Cereal and bakery products - Farm-retail spread
Source: USDA, Economic Research Service

Analysis of Potential Causes of Consumer Food Price Inflation
©
29
Figure 14: Beef Price Spreads
0
50
100
150
200
250
Jan-
85
Jan-
86
Jan-
87
Jan-
88
Jan-
89
Jan-
90
Jan-
91
Jan-
92
Jan-
93
Jan-
94
Jan-
95
Jan-
96
Jan-
97
Jan-
98
Jan-
99
Jan-
00
Jan-
01
Jan-
02
Jan-
03
Jan-
04
Jan-
05
Jan-
06
Jan-
07
Pri
ce S
pre
ads
(cen
ts/lb
)
Beef - farm-wholesale Beef - wholesale-retail
Figure 15: Pork Price Spreads
0
50
100
150
200
250
Jan-
85
Jan-
86
Jan-
87
Jan-
88
Jan-
89
Jan-
90
Jan-
91
Jan-
92
Jan-
93
Jan-
94
Jan-
95
Jan-
96
Jan-
97
Jan-
98
Jan-
99
Jan-
00
Jan-
01
Jan-
02
Jan-
03
Jan-
04
Jan-
05
Jan-
06
Jan-
07
Pri
ce S
pre
ads
(cen
ts/lb
)
Pork - farm-wholesale Pork - wholesale-retail C. ROLE OF MARGINS AS SHOCK ABSORBERS
Given the weak correlation between corn prices and livestock, poultry, egg, and milk prices (at the farm level), it can be hypothesized that a considerable proportion of the

Analysis of Potential Causes of Consumer Food Price Inflation
©
30
impact of corn price changes is being absorbed in the value chain in the form of reduced margins to livestock producers. Importantly, this does not necessarily mean margins for livestock producers are low or negative, but rather that they are lower than they would be in the absence of higher corn prices. This section will look at the historical relationships between corn prices and production margins, as well as evaluate the impact of recent corn price changes. 1. Beef Cattle
Cow-Calf and Cattle-Feeding Margins
Calf-crop levels have been declining steadily since about 1996, dropping from a level of 40.3 million head to 37.6 million head in 2007. During this same time period, a string of profitable years has been achieved in the cow-calf sector. Such strong profitability has not been experienced in the cattle feeding sector, where imputed margins have been negative since early 2004 (see Figure 16). This followed uncharacteristically high margins in 2003, which resulted mainly from the large increase in cattle prices during the last half of that year4. In fact, over the long term from January 1985 to August 2007, average cattle feeding margins were negative, by an amount of -$15.42/head. However, this does not necessarily mean that cattle feeders have experienced sustained losses over the time period, since there are many cost markups associated with feedlot operations that are already included in their margin calculations.
Figure 16: Cattle-Feeding Margins
-200
-150
-100
-50
0
50
100
150
200
250
300
350
Jan-
00
Jul-0
0
Jan-
01
Jul-0
1
Jan-
02
Jul-0
2
Jan-
03
Jul-0
3
Jan-
04
Jul-0
4
Jan-
05
Jul-0
5
Jan-
06
Jul-0
6
Jan-
07
Jul-0
7
Est
imat
ed M
on
thly
Cat
tle
Fee
din
g M
arg
ins
($/h
ead
)
0.0
0.5
1.0
1.5
2.0
2.5
3.0
3.5
4.0
4.5
Ave
rag
e N
earb
y C
orn
Fu
ture
s ($
/bu
)
Estimated Monthly Cattle feeding Margins, $ Per Head Avg. Nearby Corn Futures 4 Trade disruptions in the aftermath of the first domestic case of BSE in Canadian cattle helped boost U.S. fed cattle prices to record levels in the fall of 2003.

Analysis of Potential Causes of Consumer Food Price Inflation
©
31
While total feed costs are undeniably affected by changes in the corn price, overall margins are not mirror-reflections of corn price changes. For one, there is often a lagged affect. The corn purchased in one period does not directly affect the profitability of the feeder steers being sold that period, but rather those that are being fed to be sold at a later date. Furthermore, cattle feeders anticipating higher corn prices will make operational adjustments. They will purchase fewer feeder cattle or only buy them at reduced prices; they can make ration adjustments to a degree; and/or they can decrease the number of days each animal is on feed (reducing total yardage costs and perhaps total feed consumption). The latter option is achieved by placing heavier-weight feeder cattle into the feedlot, or selling fattened cattle at a lower finished weight. There are also many other factors, such as beef demand, that affect the sales price of finished cattle but have nothing to do with the corn price. Another mitigating factor has been the ability of feedlots to incorporate distillers grains into their feed rations. For each bushel of corn ground to make ethanol, almost one-third of the material ends up as distillers grains, and according to industry sources, approximately 42% of the distillers grains consumed in the U.S. in 2006 were used in beef cattle rations. Distillers grains are a high-energy, high-protein feed source that can be used as a feed substitute for corn. In fact, many recent feeding trials suggest that feeding wet distillers grains with solubles actually increases feed efficiency relative to corn. Table 11 provides cost and revenue data for the U.S. cattle-feeding industry based on a proprietary feedlot production cost model developed by Informa. Annual data for calendar years 2004, 2005 and 2006 are presented. The key assumptions made are that feeder cattle are purchased and enter the feedlot at 750 pounds and are fed to a marketing weight of 1,200 pounds live, equivalent to 756 pounds carcass weight. The cost per head for feeder cattle entering the feedlot over this three-year timeframe ranged from $774 in 2004 to $841 in 2006, with the 2005 cost very similar to 2006.
Table 11: Informa Feedlot Production Cost Model Feedlot Production Cost Model
($/head)
Marketing Year
Market Cost on 750 lb Feeder Steer Feed Cost
Total Costs in Feedlot
Total Cost of 1200 lb Fed
Steer
Market Value of 1200 lb
Fed Steer Difference
Steer Carcass Weight
2004 774.40 167.92 270.00 1044.40 1012.97 -31.43 807
2005 838.98 135.77 247.16 1086.14 1054.46 -31.68 816
2006 840.99 150.92 268.72 1109.71 1035.62 -74.09 833
1200 lb liveweight fed steer yields an average carcass weight of 756 lbs Source: Informa Economics, Inc.

Analysis of Potential Causes of Consumer Food Price Inflation
©
32
Feed costs per head for 450 pounds of gain vary primarily with the cost of corn. Feed costs per head were about $168 in 2004, dropped to $136 in 2005 as corn prices declined, and then rebounded to about $151/head in 2006 as corn prices turned higher. Total costs per animal during the feeding period are also provided; most changes are directly related to the cost of corn. For the three years analyzed, the feed cost as a percent of total costs ranged from a low of 54.9% in 2005 to a high of 62.2% in 2004. For information purposes, a calculation of the total cost of a 1,200 pound fed steer is provided along with the average market value for that same animal. As can be seen, margins for feeding these animals were negative in each year under study, with 2004 and 2005 losses amounting to just over $31/head while 2006 losses were more than double that at an estimated $74/head. Of note is the fact that even with a $32/head lower feed cost per head in 2005 relative to 2004, per-head production losses were the same in both years which, once again reflects the disconnect that exists between the cost of corn and the price of cattle. Packer Margins
Packers have been experiencing the largest sustained losses of any of the beef supply chain participants. This has been a result of excess capacity chasing relatively tight supplies. Declining margins in the early 1990s forced plant shutdowns, and while margins improved in the mid-1990s, they have declined to historically low levels within the last two years. Figure 17 shows net packer margins since 2002.
Figure 17 : Net Packer Margins, Based on Weighted Cutout
-100
-80
-60
-40
-20
0
20
40
60
80
Jan Feb Mar Apr May Jun Jul Aug Sep Oct Nov Dec
Est
imat
ed N
et B
eef
Pac
ker
Mar
gin
s($
/hea
d, c
om
pre
hen
sive
cu
tou
t)
2002 2003 2004 2005 2006 2007

Analysis of Potential Causes of Consumer Food Price Inflation
©
33
2. Hogs
The hog industry has a much more integrated production system than the cattle industry, and as a result, pork production growth tends to be relatively stable, increasing at an average pace of 2% annually since 2000. Unlike cattle, hogs can not utilize forages, thus feed costs tend to account for a relatively large percentage of variable input costs. Hog production margins remained high but volatile throughout most of the 1990’s. However, in the late 1990s, producers expanded rapidly at the same time as the packing industry was reducing capacity, resulting in a huge price collapse in late 1998 and poor production margins for the next year. Production margins recovered in 2000 and 2001 only to turn negative during much of 2002 and 2003, as per capita pork supplies increased to burdensome levels once again (see Figure 18).
Figure 18: Farrow-to-Finish Margins
-40
-30
-20
-10
0
10
20
30
40
50
Jan-
00
Jul-0
0
Jan-
01
Jul-0
1
Jan-
02
Jul-0
2
Jan-
03
Jul-0
3
Jan-
04
Jul-0
4
Jan-
05
Jul-0
5
Jan-
06
Jul-0
6
Jan-
07
Jul-0
7
Est
imat
ed M
on
thly
Far
row
-Fin
ish
Mar
gin
s ($
/hea
d)
0.0
0.5
1.0
1.5
2.0
2.5
3.0
3.5
4.0
4.5
Ave
rag
e N
earb
y C
orn
Fu
ture
s ($
/bu
)
Estimated US Commercial Farrow-Finish Margins ($/head) Avg. Nearby Corn Futures
Beginning in late 2003, the U.S. pork industry began to experience an unprecedented boom in exports, which helped drive demand for pork and propel prices and margins to much higher levels. Since then, hog margins have remained mostly in the $20 to $30/head range, peaking periodically into the $40/head range and dropping down into the teens in early 2006. The run of profitability since 2004 has been the best on record. Then, starting in early 2007, as corn prices had begun to increase significantly, hog margins took a slight decrease down into the $5-$25/head range, as the higher cost of

Analysis of Potential Causes of Consumer Food Price Inflation
©
34
gain offset hog prices, which remained favorable up through the summer of 2007. In the fall of 2007, on large production increases, hog production margins finally began to turn negative, ending the longest uninterrupted run of profits on record for the industry. In Table 12, the total production cost per hog is calculated and converted to a total cost per cwt. lean; it then is compared to the annual average market value per cwt. lean to give an indication of production margins. The 2004-2006 time period was the best ever in terms of profitability for the hog production sector. Given that the long-term average margin for producers would fall somewhere in the $7-8/cwt. lean range, the U.S. industry headed into 2007 with a strong equity and financial condition fully able to withstand potential margin pressures arising from higher corn costs.
Table 12: Hog Production Cost Model
Farrow to Finish Cost of Production Model
Feed Cost $/head
Total Cost $/head
Total Cost per $/cwt.
Lean
Market Value per cwt. Lean
Margin per cwt. Lean
Live Weight
Carcass Weight
2004 49.00 114.00 57.41 71.74 14.33 262.00 199.30
2005 37.00 103.00 51.09 68.28 17.19 264.00 200.70
2006 40.00 105.00 52.03 64.41 12.38 265.00 201.10
Butcher hog fed to 265 pounds Source: Informa Economics, Inc.
3. Poultry: Broilers and Eggs
Broilers
The broiler industry is a highly integrated and concentrated industry with the top 25 production operations accounting for a large percentage of industry output. Since the decision making at the production level is consolidated into few hands, the broiler industry has the capability of making rather quick and meaningful production adjustment decisions. There appears to be very little correlation between historical poultry margins and the price of corn (see Figure 19). In fact, when corn prices were at their lowest in early 2006, poultry margins were negative, and as corn prices began to take off, poultry margins climbed (although they took a brief dip when corn prices peaked in early 2007). In early 2003, poultry margins took a swing from negative to positive, despite relatively stagnant corn prices. This was a direct result from a cutback in production taken after the margin losses in 2002 and 2003. This cutback in production along with record high prices in late 2003 and early 2004 led to record high margins by mid-2004. Then, as exports dropped off due to the high poultry prices, margins began to decline. Corn

Analysis of Potential Causes of Consumer Food Price Inflation
©
35
prices throughout all of this have had relatively little effect. In fact, the record-high margins in mid-2004 directly followed a corn price spike in the preceding months.
Figure 19: Broiler Margins
-15
-10
-5
0
5
10
15
20
25
30Ja
n-00
Jul-0
0
Jan-
01
Jul-0
1
Jan-
02
Jul-0
2
Jan-
03
Jul-0
3
Jan-
04
Jul-0
4
Jan-
05
Jul-0
5
Jan-
06
Jul-0
6
Jan-
07
Jul-0
7
Est
imat
ed W
eig
hte
d M
arg
in
(80%
cu
tou
t an
d 2
0% w
ho
le b
ird
s), c
ents
/lb
0.0
0.5
1.0
1.5
2.0
2.5
3.0
3.5
4.0
4.5
Ave
rag
e N
earb
y C
orn
Fu
ture
s ($
/bu
)
Estimated Wgt Margin (80% Cutout; 20% Whole Birds) Cents per Pound
Avg. Nearby Corn Futures
As of November 2007, nearby CBOT corn futures were about $4/bushel, while soybean meal has been averaging near $220/ton. Based on these feed input prices, the feed cost per pound of broiler meat produced has risen to 25 cents compared to an average of 20.6 cents in 2006. This appreciation in feed costs has raised total production costs to nearly 56 cents per pound. Even with this advance in feed costs, sales values for both whole birds and broiler parts are providing a weighted industry return of nearly 14 cents per pound (see Table 13). With financial returns of this magnitude, odds favor the industry increasing production rather than maintaining the slight reductions that started last fall and lasted through the first quarter of 2007. The industry did initiate a production rollback in the fall of 2006 due to poor margins; the weak margin situation was due to weak product prices in combination with rising feed costs. The production declines were large enough to raise product prices, and now that sales values have recovered so too have margins.

Analysis of Potential Causes of Consumer Food Price Inflation
©
36
Table 13: Broiler Production Costs and Impact of Higher Corn Price US Broilers:
Average Liveweight
Average Eviscerated
Weight
Feed Cost per RTC pound
Other Cost per
RTC pound
Total Cost per RTC pound
Whole Broiler Net Returns
per RTC pound
Cutout Net Returns per RTC
pound
Weighted Net Returns (80 %
cutout, 20 % whole broilers) per RTC
pound2004 5.27 3.82 22.58 30.84 53.43 21.24 16.45 17.412005 5.38 3.90 19.52 30.84 50.36 22.46 10.21 12.662006 5.47 3.96 20.60 30.84 51.45 16.80 0.00 3.36
2007 ($4.00/bu Corn) 5.45 3.95 25.00 30.84 55.85 18.30 12.92 13.992007 ($4.50/bu Corn) 5.41 3.92 27.49 30.84 58.33 7.06 -4.05 -1.83 Eggs Table 14 provides estimates of shell egg production costs. The feed cost per dozen eggs produced has varied from a low of 23.95 cents per dozen in 2005 to a high of 27.54 cents in 2004. Costs in 2006 for the feed component of production costs averaged 25.49 cents per dozen. Based on shell egg selling prices in the past 3 years, margins have been rather variable. In 2004, margins averaged over 18 cents per dozen even though feed costs were high, helped by very firm egg prices. Lower feed costs in 2005 were accompanied by weak egg prices and margins slipped to 5.41 cents before recovering to 10 cents per dozen in 2006. As with other livestock sectors, changes in feed costs have not been correlated with producer margins.
Table 14: Egg Cost of Production Model
Table Egg Cost of Production Model
Feed Cost per Dozen
Total Cost per dozen
Margin per Dozen
Urner Barry MW Shell Egg Price
2004 27.54 49.80 18.04 86.54
2005 23.95 45.72 5.41 68.80
2006 25.49 47.37 10.00 75.44
$4.00 Corn 32.61 55.25 20.90 92.71
$4.50 Corn 34.75 57.75 18.40 92.71 Despite the highest feed costs in over 10 years, margins for the industry are the best in many years due to very strong egg prices. With average shell egg prices projected to be near 93 cents per dozen, production margins are very strong and this suggests the potential for expanding production rather than production declines.

Analysis of Potential Causes of Consumer Food Price Inflation
©
37
4. Milk
Estimated milk production margins have averaged $9.35/cwt over the time period from January 2000 to September 2007. Milk margins declined in 2002/03 when corn prices increased, but margins climbed as corn prices spiked in 2003/04 (see Figure 20). Both corn prices and milk margins declined during the latter part of 2004 and most of 2005. Despite current corn prices taking off, beginning in early 2007, milk margins have climbed to record high levels. This suggests that corn prices are a very minor determinant of milk production margins and are not a primary driver of milk prices.
Figure 20: Milk Production Margins
0
2
4
6
8
10
12
14
16
Jan-
00
Jul-0
0
Jan-
01
Jul-0
1
Jan-
02
Jul-0
2
Jan-
03
Jul-0
3
Jan-
04
Jul-0
4
Jan-
05
Jul-0
5
Jan-
06
Jul-0
6
Jan-
07
Jul-0
7
Milk
Mar
gin
s ($
/cw
t)
0.0
0.5
1.0
1.5
2.0
2.5
3.0
3.5
4.0
4.5
Ave
rag
e N
earb
y C
orn
Fu
ture
s ($
/bu
)Milk Margins Avg. Nearby Corn Futures
Milk margins have been strong the past year largely as a result of rising milk prices, which have been driven by demand increases. U.S. milk consumption is increasing, and world dairy demand is also increasing. This world demand increase follows strong economic growth in many developing countries, and it is compounded by the fact that many major milk-producing countries, such as Australia, have been experiencing drought, thus tightening world milk and dairy supplies. Due to this strong global demand, U.S. exports of dairy products have increased significantly, and this has supported domestic price increases of milk and milk products.

Analysis of Potential Causes of Consumer Food Price Inflation
©
38
VII. DRIVERS OF FOOD PRICE INFLATION Given that historical data shows little relationship between corn prices and consumer food prices, the question arises: What does drive consumer food prices? This section will explore various factors affecting consumer food price inflation. In summary, food price inflation is caused by a complex set of factors. A. SUMMARY OF USDA MODELS OF THE FOOD CPI
USDA-ERS periodically forecasts the food CPI, and it is frequently asked to evaluate the impact of input price changes. The agency has three different models it uses to analyze the food CPI, with the choice of model depending on whether or not the objective calls for an analysis of short-run or long-run impacts. The ERS price-spread model and input-output model are used to analyze short-run impacts, while the variable proportions model is used in long-run analyses. The price-spread model uses a weighted sum of percent changes in input prices from 16 food industries to estimate input price change effects on at-home food prices, where each input change is weighted by its respective cost share. It is assumed that each firm in each of the 16 food industries produces a single end-product; accordingly, the model combines a farm commodity with a set of non-farm inputs in fixed proportions. Alternatively, the input-output model, while similar to the price-spread model, considers the indirect effects of changing input costs. For example, an increase in energy will not only affect the cost of producing the food item, but it will also impact the costs of producing other food production inputs. This model uses a system of equations from 50 food industries and 430 nonfood industries. Both of the short-run models assume that consumers do not respond to retail price changes and that food producers do not alter their input proportions. 5 However, the long-run model, the variable proportions model, relaxes these short-run restrictions. This eight-market food model uses a system-of-equations approach: (i) the first equation relates the industry’s retail price to the price of one marketing or non-farm input, the exogenous farm supply, and the shift in consumer demand, and (ii) the second equation relates the industry’s farm price with the same three variables. Analyses using the variable proportions model have shown that changes in input prices do not always lead to food price increases. This effect is mitigated by firms altering their input proportions and by changing consumer demand.6
5 This may be a rather strong assumption, especially for certain food products in which demand is elastic, there are multiple substitute products available to consumers, or for which there are substitute products available within the production process. 6 Reed, A.J., K. Hanson, H. Elitzak, and G. Schluter. 1997. “Changing Consumer Food Prices: A User’s Guide to ERS Analyses.” Technical Bulletin #1862. Economic Research Service, Washington, DC.

Analysis of Potential Causes of Consumer Food Price Inflation
©
39
The ERS lists four key factors as influencing how input cost increases affect food prices7. The first is the share of total costs accounted for by the input (this is discussed in detail below). The second is whether or not the input has adequate substitutes in the production process. Third is whether or not consumers have good substitutes for the food product. Last is the time period considered. In the short run, producers and consumers might not be able to adjust to price changes. If the price change is permanent, such adjustments can be made, but on the other hand, this might cause some firms to go out of business, causing the price increase to be greater in the long run.
B. FOOD MARKETING COSTS
1. Composition of the Retail Food Dollar
The share of the final food product price accounted for by the cost of commodities purchased from producers has declined over the years. According to consumer expenditure data collected by the BLS and reported by the USDA, the “farm value” accounts for 19% of total food costs. This proportion has declined significantly from 37.2% in 1973 (see Figure 21). The remaining portion of total retail food costs (i.e., in addition to the farm value) is known as the marketing bill. The marketing bill includes labor, packaging, transportation, energy, profits, advertising, depreciation, rent, interest, repairs, business taxes, and other costs. With the decrease in the share of the food dollar accounted for by the farm value of raw materials, corn price changes have a declining impact on the overall food retail price. Furthermore, within many food items, corn constitutes only a portion of the farm value. Thus, in items where corn is only one of several farm inputs, total food costs attributable to the cost of corn will be on average even less than 19%. While 19% represents the average share of farm value in the retail food dollar, this percentage varies considerably among food items. Table 15 provides the most current annual average data available for food categories for which the USDA estimates the farm value share of the retail food price.8
7 Economic Research Service. 2007. “Food CPI, Prices, and Expenditures: How Changes in Input Costs Affect Food Prices.” Retrieved from www.ers.usda.gov/Briefing/CPIFoodAndExpenditures/howchangesininputcostsaffectf 8 The most recent annual average data available for cereals and bakery products, fats and oils, and dairy were for 2005. Annual averages were available for 2006 for meat product data.

Analysis of Potential Causes of Consumer Food Price Inflation
©
40
Figure 21: Evolution of the Food Dollar by Cost Component
0%
10%
20%
30%
40%
50%
60%
70%
80%
90%
100%
1970
1972
1974
1976
1978
1980
1982
1984
1986
1988
1990
1992
1994
1996
1998
2000
2002
2004
Co
mp
osi
tio
n o
f C
on
sum
er F
oo
d R
etai
l Do
llar
Marketing Bill Farm Value
Source: USDA, Economic Research Service
Table 15: Farm Value Share of Retail Food Price by Food Category
Food Product Category Farm Value as % of Retail Food Price
Cereals and bakery items 6% Beef 47% Pork 30% Chicken 36% Dairy products 36% Fats and oils 17%
The farm value share of the food dollar is provided for specific food products rather than categories in Table 16. The product examples that were selected for the table either are derived from corn or are commodities affected by the corn market (e.g., livestock, poultry, wheat and soybeans). Again, total farm-based input costs are shown, not only the cost of corn.

Analysis of Potential Causes of Consumer Food Price Inflation
©
41
Table 16: Examples: Cost of Farm Inputs as a Share of Prices of Select Retail Food Products
Food Product
Farm Value Share of Retail
Price (%)1Example Retail
Prices ($/lb)
Cost of Input(s) Purchased from
Farm ($/lb)Milk, 1/2 gal. 34 3.84 $1.31Flour, wheat, 5lbs 19 0.36 $0.07Bread, 1 lb 5 1.21 $0.06
Margarine, 1 lb 15 1.26 $0.19
Corn Flakes, 18 oz box 4 1.65 $0.07Corn Syrup, 16 oz. bottle 3 1.57 $0.05Ground Beef, 1 lb 47 2.37 $1.11Bacon, sliced 28 3.78 $1.06Chicken, fresh whole 47 1.14 $0.541 Source: USDA, ERS (utilizing most current data available for each food product category, as of Oct., 2007)

Analysis of Potential Causes of Consumer Food Price Inflation
©
42
VIII. PERSPECTIVE ON COMMODITY PRICE INFLATION Although it has been shown in the preceding sections of this report that corn price changes have, at most, a weak correlation with changes in the food CPI, additional context can be provided to this report by examining not only the higher corn prices that have occurred since fall 2006 but also the environment of general commodity price inflation in which this has been occurring. A. CORN PRICES
The “conventional wisdom” expressed in the media is that a dramatic increase in the use of corn in ethanol production caused corn prices to increase substantially, particularly since the fall of 2006. However, even the reason for the increase in corn prices is more complex than indicated by the media. Fueled by a record yield, the U.S. harvested a record corn crop of 11.8 billion bushels in 2004. In 2005, acreage remained steady, but a more historically consistent yield led production to fall to 11.1 billion bushels. Then, in the spring of 2006, price signals in the futures markets gave farmers the incentive to plant more soybeans, and the acreage planted to corn fell by 3.5 million acres. Combined with relatively flat yields, corn production fell for the second year in a row, to 10.5 billion bushels. Thus, corn production fell by 1.3 billion bushels over two years, even though the usage of corn in ethanol production expanded from 1.3 billion bushels in 2004/05 to 2.1 billion bushels in 2006/07 (see Figure 22). Yet, the ethanol industry was not the only source of additional demand. U.S. corn exports, which were 1.8 billion bushels in 2004/05, rose to 2.1 billion bushels in both 2005/06 and 2006/07 – a level that was at the top of the range experienced over the previous decade. So, it was basic supply and demand – a reduction in supply and an increase in demand from both ethanol and exports – that led to prices moving higher in the fall of 2006.
Figure 22: Corn Supply/Demand Dynamics, Crop Years 2004/05 – 2006/07
81 8278
0
10
20
30
40
50
60
70
80
90
2004/05 2005/06 2006/07
Mill
ion
Acr
es
Corn Acres Planted
0
2,000
4,000
6,000
8,000
10,000
12,000
14,000
2004/05 2005/06 2006/07
Mill
ion
Bu
shel
s
Corn Production
2004/05 2005/06 2006/07
Ethanol Exports
Corn Usage
Source: USDA

Analysis of Potential Causes of Consumer Food Price Inflation
©
43
Then, in 2007, U.S. farmers proved that they could respond to the market’s need for more corn. In the 1996 and 2002 Farm Bills, producers had been relieved of the base-acre and set-aside systems that had previously restricted what they could plant, and they now had “freedom to farm” – the ability to allocate their crop acreage as they saw fit, with few remaining constraints. With this freedom and corn prices that provided a significant net revenue premium per acre over soybeans, farmers planted 93.6 million acres of corn in 2007 – the highest level since the 1940s. As of November 2007, the USDA estimates the crop at a record 13.2 billion bushels (see Table 17). As was mentioned earlier in this report, the level of corn stocks at the end of the crop year relative to the volume of corn consumed during the year is a key factor in the pricing of corn. At the end of 2004/05, when the previous record crop was harvested, the stocks-to-use ratio was nearly 20%, which is plentiful by recent historical standards. However, with lower production and rising ethanol usage and exports, the stocks-to-use ratio was cut almost in half, to just under 12%, in 2006/07. This was reflected in substantially higher prices. Despite Informa’s projections of an almost 800-million-bushel increase in the corn grind for ethanol and an additional 250 million bushels of exports, the record crop of 2007 is forecast to allow stocks to build to over 2.1 billion bushels by the end of the crop year, allowing the stocks-to-use ratio to rebound to 17.1%. Normally, this would be expected to allow prices to ease significantly. However, soybean oil prices have been lifted by rising crude oil (petroleum) prices, and as a result the pace of soybean consumption is expected to bring stocks to meager levels by the end of the 2007/08 crop year, and if there is not a rebound in soybean acres planted in 2008 stocks could reach unsustainably low levels. This has led to upward pressure on soybean prices, and in order for corn acreage not to fall too far in the face of continued ethanol industry expansion – and likely continued strength in exports given weakness in the U.S. dollar – the market has maintained relatively high corn futures prices. Based on futures prices as of November 2007, farmers would be expected to plant nearly 89 million acres of corn in 2008. If this were to occur, Informa’s forecast of the stocks-to-use ratio for 2008/09 would be 16.5%, which is ample but not burdensome. The national average farm price for corn, which Informa forecasts to be $3.25/bushel in 2007/08 would be forecast to fall to $2.85/bushel in 2008/09 under this scenario. However, absent a very favorable soybean yield in 2008, such a high level of corn plantings would likely not allow soybean production to be sufficient to prevent stocks from falling to an unsustainable level, and prices would have to rise even further to ration demand. Accordingly, it is expected that by the spring of 2008 the market will anticipate this imbalance, and corn acres will be reduced further, with balance perhaps occurring at roughly 86 million acres of corn. In this case, even with no change in the demand forecast, the stocks-to-use ratio for corn would be forecast to recede to 12.7% in 2008/09, which would be sufficient and would allow corn prices to come down.

Analysis of Potential Causes of Consumer Food Price Inflation
©
44
Table 17: U.S. Corn Balance Sheet
97/98 98/99 99/00 00/01 01/02 02/03 03/04 04/05 05/06 06/07 07/08 08/09 Planted Acres 79.5 80.2 77.4 79.6 75.7 78.9 78.6 80.9 81.8 78.3 93.6 88.9Harvested Acres 72.7 72.6 70.5 72.4 68.8 69.3 70.9 73.6 75.1 70.6 86.1 81.8Yield 126.7 134.4 133.8 136.9 138.2 129.3 142.2 160.4 148.0 149.1 153.0 160.0Beginning Inventories (Sep. 1) 883 1,308 1,787 1,718 1,899 1,596 1,087 958 2,114 1,967 1,304 2,117Production 9,207 9,759 9,431 9,915 9,503 8,967 10,089 11,807 11,114 10,535 13,168 13,083Imports 9 19 15 7 10 14 14 11 9 12 10 10 Total Supply 10,099 11,085 11,232 11,639 11,412 10,578 11,190 12,776 13,237 12,514 14,482 15,209Feed & Residual 5,479 5,469 5,665 5,842 5,864 5,563 5,795 6,158 6,155 5,598 5,700 5,400Food/Seed/Industrial 1,805 1,846 1,913 1,957 2,047 2,340 2,537 2,686 2,981 3,488 4,290 5,500 Of Which: Ethanol for Fuel 481 526 566 628 706 996 1,168 1,323 1,603 2,117 2,900 4,100 Domestic Use 7,284 7,316 7,578 7,799 7,911 7,903 8,332 8,844 9,136 9,086 9,990 10,900Exports 1,507 1,983 1,937 1,941 1,905 1,588 1,900 1,818 2,134 2,124 2,375 2,150 Total Use 8,791 9,298 9,515 9,740 9,815 9,491 10,232 10,662 11,270 11,210 12,365 13,050Ending Inventories (Aug. 31) 1,308 1,787 1,718 1,899 1,596 1,087 958 2,114 1,967 1,304 2,117 2,159Stocks/Use 14.9% 19.2% 18.1% 19.5% 16.3% 11.4% 9.4% 19.8% 17.5% 11.6% 17.1% 16.5%Futures Price ($/Bu) 2.57 2.16 2.10 2.09 2.15 2.37 2.64 2.12 2.23 3.54 3.55 3.25 Farm Price ($/Bu) 2.43 1.94 1.82 1.85 1.97 2.32 2.42 2.06 2.00 3.03 3.25 2.85 Sources: USDA, CBOT (History); Informa Economics (Forecasts, in Bold)

Analysis of Potential Causes of Consumer Food Price Inflation
©
45
Thus, producers have demonstrated their ability to respond swiftly to market conditions in making their acreage decisions. Assuming normal weather, this ability and willingness to shift acres is expected to mitigate any further inflationary pressures on corn prices through at least the 2008/09 crop year, despite expectations for continued rapid growth in the ethanol industry. As a final note, there is evidence that the biotech corn traits that were first introduced in the U.S. in 1996 and have been gaining broader adoption in recent years have led to the potential for above-trend yields to be achieved; to the extent that this occurs or technology developments accelerate, this would further mitigate any upward pressure on corn prices. B. GENERAL COMMODITY AND MACROECONOMIC INFLATION
The increase in corn prices since the fall of 2006 is not occurring in a vacuum, and in fact the Reuters/Jeffries CRB index, an index of commodity prices, has more than doubled since 2001 (see Figure 23). The index is a weighted average of the prices of 19 commodities in three categories: energy, agriculture and metals.
Figure 23: Monthly Average Reuters/Jeffries CRB Futures Index, January 1970 - September 2007
0
25
50
75
100
125
150
175
200
225
250
275
300
325
350
375
400
425
450
475
1970
1971
1972
1973
1974
1975
1976
1977
1978
1979
1980
1981
1982
1983
1984
1985
1986
1987
1988
1989
1990
1991
1992
1993
1994
1995
1996
1997
1998
1999
2000
2001
2002
2003
2004
2005
2006
2007
Ind
ex (
1967
=100
)
Crude oil, heating oil and unleaded gasoline carry one-third of the overall weighting of the index. Therefore, it is not surprising that the index has been on a prolonged run as crude oil prices have surged from around $20/barrel in November 2001 to almost $100/barrel in November 2007 (see Figure 24).

Analysis of Potential Causes of Consumer Food Price Inflation
©
46
Figure 24: Reuters/Jeffries CRB Futures Index vs. NYMEX Crude Oil Futures, August 1999 to September 2007
0
50
100
150
200
250
300
350
400
450
500A
ug-9
9
Nov
-99
Feb
-00
May
-00
Aug
-00
Nov
-00
Feb
-01
May
-01
Aug
-01
Nov
-01
Feb
-02
May
-02
Aug
-02
Nov
-02
Feb
-03
May
-03
Aug
-03
Nov
-03
Feb
-04
May
-04
Aug
-04
Nov
-04
Feb
-05
May
-05
Aug
-05
Nov
-05
Feb
-06
May
-06
Aug
-06
Nov
-06
Feb
-07
May
-07
Aug
-07
CR
B In
dex
(19
67 =
100
)
0.00
10.00
20.00
30.00
40.00
50.00
60.00
70.00
80.00
90.00
Cru
de
Oil
($/B
arre
l)
Reuters- CRB Futures Index NYMEX Oil Futures However, the weighting of energy commodities in the index masks the fact that the prices of metals and, more recently, agricultural commodities have been increasing. There is some interrelation of the price increases, as the demand for basic materials that has been generated by the strong economic growth in developing countries, especially China and India, encompasses not only energy but also metals. Higher energy prices have been a contributor to higher agricultural commodity prices as well, since they have fostered higher prices for ethanol and biodiesel and the expansion of those industries. Moreover, the depreciation of the U.S. dollar, which has been particularly acute in the fall of 2007, has affected the prices of multiple commodities, making U.S. corn more affordable and thereby increasing export demand, and contributing to the rise in oil prices (see Figure 25).

Analysis of Potential Causes of Consumer Food Price Inflation
©
47
Figure 25: U.S. Dollar Exchange Rate vs. the Euro
0.00
0.20
0.40
0.60
0.80
1.00
1.20
1.40
1.60Ja
n-00
Apr
-00
Jul-0
0
Oct
-00
Jan-
01
Apr
-01
Jul-0
1
Oct
-01
Jan-
02
Apr
-02
Jul-0
2
Oct
-02
Jan-
03
Apr
-03
Jul-0
3
Oct
-03
Jan-
04
Apr
-04
Jul-0
4
Oct
-04
Jan-
05
Apr
-05
Jul-0
5
Oct
-05
Jan-
06
Apr
-06
Jul-0
6
Oct
-06
Jan-
07
Apr
-07
Jul-0
7
Oct
-07
US
$/E
uro
In summary, corn has been one of several commodities that have experienced upward price pressure in recent years. Historically, rising prices for commodities in general – not corn in isolation – have contributed to overall macroeconomic inflation (see Figure 26). This was particularly the case during and after the oil price shocks of the 1970s. However, as the U.S. economy has become more service oriented and the manufacturing sector has accounted for a declining share of gross domestic product, there has been less of a direct impact of higher commodity prices on general inflation. Productivity gains have also helped dampen inflation.

Analysis of Potential Causes of Consumer Food Price Inflation
©
48
Figure 26: Year-Over-Year Percent Changes in the Reuters/Jeffries CRB and CPI Indexes, 1970 - September 2007
0%
5%
10%
15%
20%
25%19
70
1971
1972
1973
1974
1975
1976
1977
1978
1979
1980
1981
1982
1983
1984
1985
1986
1987
1988
1989
1990
1991
1992
1993
1994
1995
1996
1997
1998
1999
2000
2001
2002
2003
2004
2005
2006
2007
CP
I % C
hg
Yea
r A
go
-40.0%
-20.0%
0.0%
20.0%
40.0%
60.0%
80.0%
100.0%
CR
B %
Ch
g Y
ear
Ag
o
CPI % Chg CRB % Chg

Analysis of Potential Causes of Consumer Food Price Inflation
©
49
IX. CONCLUSIONS While there have been a number of stories in the media over the last year indicating that consumer food prices are being driven higher by an ethanol-induced increase in corn prices, there is little evidence of such a simplistic cause-and-effect linkage. In reality, a complex set of factors drives the food CPI. In fact, the marketing bill, defined as the portion of the food dollar that is not related to the farm value of raw materials, has a stronger relationship with the food CPI than does the cost of corn. While an increase in corn prices will affect certain industries – for example, causing livestock and poultry feeding margins to be lower than they otherwise would have been – the statistical evidence does not support a conclusion that there is a strict “food-versus-fuel” tradeoff that is automatically driving consumer food prices higher.

Analysis of Potential Causes of Consumer Food Price Inflation
©
50
APPENDIX

Analysis of Potential Causes of Consumer Food Price Inflation
©
51
APPENDIX A: BACKGROUND ON THE “FOOD VS. FUEL” DEBATE A. MEDIA COVERAGE
There has been no shortage of media attention given to the food-versus-fuel debate since late 2006. Major news sources such as The Washington Post, Los Angeles Times, CBS News, U.S. News & World Report and The Wall Street Journal have run stories indicating that rising corn demand is causing an increase in consumer food prices. The following quotes are representative of stories and editorials that have been carried by the media:
• “Corn prices in America have spiked. And since corn is also a prime ingredient for animal feeds and sweeteners, prices likewise are rising for poultry, beef and everything from soft drinks to candy.” (Washington Post; June 30, 2007)
• “While we worry about gas prices, the cost of milk, meat and fresh produce silently skyrockets. So like the end of cheap energy, is the era of cheap food also finally over?” (Washington Times; June 30, 2007)
• “… rising food prices are threatening the ability of aid organizations to help the world’s hungriest people…” (Christian Science Monitor, quoted by CBS News; July 29, 2007)
• “Food prices were up 3.9 percent in April over a year ago. The overall inflation rate in the same period: 2.6 percent. Over the past five years, food prices have risen 12.2 percent nationwide. … Fuel costs and rising demand for corn are helping to drive the higher prices, experts said. Corn, for instance is in growing demand to make ethanol. Because it’s used so much in cattle feed, that’s pushing up prices for meat, milk, and eggs.” (Chicago Sun Times; June 6, 2007)
• “Ethanol already consumes so much corn that signs of strain on the food supply and prices are rippling across the marketplace.” (U.S. News & World Report; February 4, 2007)
• “Further, there’s only so much farmland to go around. To meet the Senate’s 2022 renewable-fuels mandate of 35 billion gallons using corn would take 96 million acres. Last year, the entire corn crop, most of which went to food, was grown on 80 million acres. The only source of unused farmland is 37 million acres in the federal Conservation Reserve Program, under which the government rents cropland from farmers for wetlands and wildlife.” (L.A. Times; August 20, 2007)
However, not all mainstream media reports have drawn a simplistic link between ethanol production and food prices. Bad weather, increasing export demand for certain food products, and high transportation costs resulting from rising fuel prices also have been cited as being additional drivers of recent food price increases. Additionally, the declining cost of corn as a proportion of total food prices has been used as a counter-argument, particularly regarding the prices of higher value-added products. Recently, U.S. Department of Agriculture (USDA) acting Secretary Chuck Conner was noted as

Analysis of Potential Causes of Consumer Food Price Inflation
©
52
saying, “Ethanol fuel is getting too much of the blame for what’s happening in grocery store aisles” (Food and Fuel America; October 5, 2007). While the statements made in the mainstream media are what reach the general public, there is not necessarily much analytic rigor behind them. Given all the claims and counter-arguments in the media, and given the importance of the policy debate occurring regarding renewable fuels, it is useful to look at more in-depth, analytically oriented research on whether there is a connection between ethanol production and consumer food prices. B. RESEARCH PUBLICATIONS
Despite the considerable amount of attention given to this topic by the media, relatively few studies have been conducted to provide evidence supporting one side or the other on this issue. 1. Center for Agricultural and Rural Development
A study entitled “Emerging Biofuels: Outlook of Effects on U.S. Grain, Oilseed, and Livestock Markets” (May 2007) was conducted by the Center for Agricultural and Rural Development (CARD) at Iowa State University. This study utilized a multi-product, multi-country, deterministic partial-equilibrium model to evaluate the impacts of ethanol production on planted acreage, crop prices, livestock production and prices, trade, and retail food costs. The analysis assumes current tax credits and trade policies are maintained. Essentially, the study authors customized the modeling system of the Food and Agricultural Policy Research Institute (FAPRI), which models supply and demand for all important temperate-climate agricultural products. This model was then utilized to analyze long-run equilibrium prices under several ethanol outlook scenarios. The CARD study concluded that ethanol expansion will cause long-run crop, livestock, and retail food price increases. The study predicted that in the long run, general food prices (food at home and food away from home) will increase 0.7% to 1.8% more than they otherwise would have. There were two basic ethanol scenarios considered. Under the baseline oil-price assumption, model results indicate a 0.7% increase in food prices due to ethanol production. If oil prices were $10/barrel higher than the baseline assumption, the ethanol impact on food prices increases to 1.8%. The highest increases are predicted for at-home food prices (0.9%-2.2%), whereas away-from-home food-price increases are slightly more modest (0.6%-1.5%). The study then deconstructs the predicted increase in prices of food consumed at home into more specific food item categories, predicting that the greatest inflationary pressure will be evident in the eggs market. The range in consumer egg price inflation as a result of ethanol production is estimated between 5.4% and 13.5%. Additional consumer price inflation is estimated to range between 2.5% and 6.3% for meats, between 1.4% and 3.5% for dairy, and 0.5% to 1.2% for cereal and bakery products.

Analysis of Potential Causes of Consumer Food Price Inflation
©
53
2. National Corn Growers Association/Advanced Economics Solutions
The National Corn Growers Association (NCGA) released a report in March 2007 addressing the impact of higher corn prices on consumer food prices. They compiled the analyses/reports of the USDA, the Bureau of Labor Statistics (BLS), and Advanced Economics Solutions (AES, a consulting firm commissioned by the NCGA to analyze the impact of increased corn prices on retail food prices). Given USDA estimates of food input costs as a percentage of retail food prices and hypothetical corn prices of $3.50 to $4.00 per bushel (bu), AES estimated that retail prices for meat, poultry, fish, and eggs would be 4% to 11% higher than they otherwise would have been during the 2007-2009 period. As for consumer dairy prices, increases in the range of 4.3 to 8.3 percent were predicted. The study predicts a much lower increase in price inflation levels for cereal/bakery items of 0.67% to 1% annually. However, an important assumption behind the study is that while food-processing margins might be compressed in the short run due to higher corn prices, in the long run all of the increase in corn prices will be passed on to consumers. 3. U.S. Department of Agriculture
The publication “USDA Agricultural Projections” (February 2007), which was also incorporated into the NCGA report, projected market impacts related to ethanol supply; corn production, prices, and usage; other crop production and prices; livestock production and prices (including the impact of distiller’s grains); and farmland values. The study concluded: • Consumer price inflation rates for red meats, poultry and eggs will exceed the
general inflation rate between 2008 and 2010, raising the inflation rate of food prices (all food) above the general inflation rate by as much as about 0.5%;
• Despite this initial period of higher food price inflation, on average, retail food prices will increase less than the general inflation rate over the next 10 years (the food-price inflation rate is predicted to fall below the general inflation rate after 2010); and
• Highly processed foods, such as cereals and bakery products, will rise at a rate near the general inflation rate. 9
4. American Farm Bureau Federation
The American Farm Bureau Federation (AFBF) published an article (July 2007) in which it indicated that while meat and dairy consumer price indices (CPI) have increased more than the “core CPI” (i.e., the average rate of inflation in the general economy, excluding food and energy prices), these increases are not related to corn prices. The analysis illustrates that recent corn price increases are not related to meat and dairy prices (on-farm). The point is made in the article that meat prices were increasing long before corn prices started to increase. It concludes that with little relationship between corn prices
9 Since the USDA projections were released in February 2007, some of the assumptions are now out of date. For instance, study authors did not foresee 93 million acres planted to corn in 2007, or wheat supply issues that have caused a spike in wheat prices.
Analysis of Potential Causes of Consumer Food Price Inflation
©
54
and meat and dairy prices, very little of the increase in food costs – particularly for meat and dairy products – can statistically be attributed to increased corn prices.