Analysis of Physico-Chemical Variations in Water...
12
49 Gurung Susma, Subba Asha, Jha Sangeeta, Pandey Manoranjan International Journal of Engineering Technology Science and Research IJETSR www.ijetsr.com ISSN 2394 – 3386 Volume 2 Issue 2 February 2015 Analysis of Physico-Chemical Variations in Water Samples of River Teesta of Sikkim Gurung Susma 1 , Subba Asha 1a Jha Sangeeta 1b *, Pandey Manoranjan 1c P.G. Student, Department of Chemistry, Sikkim Manipal Institute of Technology, Majitar, Rangpo, East Sikkim 1 Research Scholar, Department of Chemistry, Sikkim Manipal Institute of Technology, Majitar, Rangpo, East Sikkim 1a Professor, Department of Chemistry, Sikkim Manipal Institute of Technology, Majitar, Rangpo, East Sikkim 1b Associate professor, Department of Chemistry, Sikkim Manipal Institute of Technology, Majitar, Rangpo, East Sikkim 1c Abstract: Man for the fulfillment of his needs and aspiration has been constantly exploiting the natural resources. This large scale consumption of resources, uncontrolled growth in population, corresponding rapid urbanization & industrialization on large scale is leading to unprecedented degradation of environment and is also the root-cause of several environmental crises confronting us. Several authors consider the development & environmental problems as vicious circle. Neither the degradation of the environment can be ignored in the name of development nor, this pace of progress can be given-up for the sake of environmental protection. Hence maintaining a symbiotic relationship between the two seems to be the need of the hour. The present study was conducted in Sikkim, India. It is an effort to identify physico-chemical variations of river Teesta at four different sites, in-between Rangpo and Singtam ( The sites are at Baghey Khola, Majitar, Minning & Rangpo) during Monsoon( Julu & August 13), winter (November & December 13) and summer ( April & May 14). As the area between Singtam to Rango falls under the industrial zone, aim was to collect the samples of water from river Teesta at these four places. Analysis on various physic-chemical parameters was undertaken to detect the level of contaminating impurities by comparing these with WHO standards. Physico-chemical properties namely pH, conductivity, turbidity, TDS, dissolved oxygen, total hardness, Ca, Mg, Chloride ion, acidity, alkalinity, free carbon dioxide etc. were measured. A comparison with WHO standards showed that the water samples were within the permissible range. The physico-chemical parameters, however, have exhibited significant seasonal variations. Keywords: Physico-chemical parameters, River Teesta, industrial belt, Rangpo, Singtam. Introduction: The various types of impurities present in water impart certain properties to it. Colour, decaying, aquatic organisms and certain chemicals may impart odor, suspended matter may impart turbidity to the water. Presence of dissolved salts makes the water hard; whereas excess quantities of metals and dissolved gases makes it corrosive. Bacteriological impurities due to pathogenic bacteria make water unfit for drinking or for domestic purposes. Hence the water from any source has to be treated before it is used. The treatment to which it is subjected depends upon its impurities and also its intended use. For example if it has to be used for drinking proposes, the treatment would include removal of objectionable colour ,taste and pathogenic microorganisms , where the water for industrial use require, removal of dissolved salts if it is used for steam generation , removal of Ca, Mg, Fe and Mn salts for its use in laundries. Similarly, the
Transcript of Analysis of Physico-Chemical Variations in Water...

49 Gurung Susma, Subba Asha, Jha Sangeeta, Pandey Manoranjan
International Journal of Engineering Technology Science and Research
IJETSR
www.ijetsr.com
ISSN 2394 – 3386
Volume 2 Issue 2
February 2015
Analysis of Physico-Chemical Variations in Water Samples of
River Teesta of Sikkim
Gurung Susma1, Subba Asha
1a Jha Sangeeta
1b *, Pandey Manoranjan
1c
P.G. Student, Department of Chemistry, Sikkim Manipal Institute of Technology, Majitar, Rangpo, East Sikkim1
Research Scholar, Department of Chemistry, Sikkim Manipal Institute of Technology, Majitar, Rangpo, East Sikkim1a
Professor, Department of Chemistry, Sikkim Manipal Institute of Technology, Majitar, Rangpo, East Sikkim1b
Associate professor, Department of Chemistry, Sikkim Manipal Institute of Technology, Majitar, Rangpo, East Sikkim1c
Abstract:
Man for the fulfillment of his needs and aspiration has been constantly exploiting the natural
resources. This large scale consumption of resources, uncontrolled growth in population,
corresponding rapid urbanization & industrialization on large scale is leading to unprecedented
degradation of environment and is also the root-cause of several environmental crises confronting us.
Several authors consider the development & environmental problems as vicious circle. Neither the
degradation of the environment can be ignored in the name of development nor, this pace of progress
can be given-up for the sake of environmental protection. Hence maintaining a symbiotic
relationship between the two seems to be the need of the hour.
The present study was conducted in Sikkim, India. It is an effort to identify physico-chemical
variations of river Teesta at four different sites, in-between Rangpo and Singtam ( The sites are at
Baghey Khola, Majitar, Minning & Rangpo) during Monsoon( Julu & August 13), winter (November
& December 13) and summer ( April & May 14). As the area between Singtam to Rango falls under
the industrial zone, aim was to collect the samples of water from river Teesta at these four places.
Analysis on various physic-chemical parameters was undertaken to detect the level of contaminating
impurities by comparing these with WHO standards.
Physico-chemical properties namely pH, conductivity, turbidity, TDS, dissolved oxygen, total
hardness, Ca, Mg, Chloride ion, acidity, alkalinity, free carbon dioxide etc. were measured. A
comparison with WHO standards showed that the water samples were within the permissible range.
The physico-chemical parameters, however, have exhibited significant seasonal variations.
Keywords: Physico-chemical parameters, River Teesta, industrial belt, Rangpo, Singtam.
Introduction:
The various types of impurities present in water impart certain properties to it. Colour, decaying,
aquatic organisms and certain chemicals may impart odor, suspended matter may impart turbidity to
the water. Presence of dissolved salts makes the water hard; whereas excess quantities of metals and
dissolved gases makes it corrosive. Bacteriological impurities due to pathogenic bacteria make water
unfit for drinking or for domestic purposes.
Hence the water from any source has to be treated before it is used. The treatment to which it is
subjected depends upon its impurities and also its intended use. For example if it has to be used for
drinking proposes, the treatment would include removal of objectionable colour ,taste and pathogenic
microorganisms , where the water for industrial use require, removal of dissolved salts if it is used
for steam generation , removal of Ca, Mg, Fe and Mn salts for its use in laundries. Similarly, the

50 Gurung Susma, Subba Asha, Jha Sangeeta, Pandey Manoranjan
International Journal of Engineering Technology Science and Research
IJETSR
www.ijetsr.com
ISSN 2394 – 3386
Volume 2 Issue 2
February 2015
water used in alcoholic breweries requires the high purity and presence of as few micro organisms as
possible.
The discharge of domestic waste and industrial effluents into the Teesta River from Singtam to
Rangpo has affected the quality of river water and aquatic ecosystem. In the present study, four
sampling sites were identified and water samples from each of these sites, was analyzed for eleven
physico-chemical parameters during the month of July & August 13, November & December13,
April & May 14. Standard methods for examination of water were used to estimate the metal content
in the water samples1-4
. An attempt has been made to explain the seasonal variation in various
parameters. The Chemical quality of the water was compared with the WHO standards5.
Thus this water has to be treated accordingly before it can be used for various purposes. The
treatment will depend on the nature and extent of contamination determined during the study.
Materials and Methods:
Collection of water samples: Water samples were collected from a depth of one meter of water in
clean polythene bottles up to the brim of the bottles without leaving any space so as to prevent the
premature release of any dissolved gases. The sampling bottles were labeled and brought to the
laboratory for analysis.
Experimental determination of physico-chemical parameters:
1. The pH of the water samples was determined using a digital pH meter (Eutech) which was
previously standardised using buffer of pH 4.0, 7.0 and 9.2.
2. The conductivity measurements were done using a digital conductivity meter (Eutech). The
conductivity meter was calibrated with the O.1 (N) KCl solution of known conductance -1.856µs and
conductivity of sample was determined.
3. Total dissolved solid is the measure of combined content of all organic and inorganic
substances contained in a liquid in molecular, ionized or micro granular suspended form. The Total
dissolved solid was measured using digital conductivity meter (Eutech).
4. The alkalinity of water is a measure of the capacity of water to neutralize acids. The
predominant chemicals present in water are carbonates, bicarbonates and hydroxide compounds of
calcium, magnesium and other metal ions. The alkalinity was determined by acid-base titration.
5. The acidity of water is the measure of its capacity to neutralize bases .It is a sum of all titrate
able acids. Acidity may also include mineral acidity, or small amount of organic acids such as
humic or inorganic salts such as sulphuric and nitric acid. The acidity was determined by acid-base
titration.
6. The dissolved oxygen in water is due to diffusion from the atmosphere and photosynthetic
evolution by marine life. Dissolved oxygen (DO) is an indicator of the degree of pollution of water
and hence is an important factor in measuring water quality. Good water should have a DO value of
7.6 mg/L at 30 ºC and 7.0 mg/L at 35ºC5. Lower values of DO indicate a higher degree of pollution.
In the present study, DO was determined using Wrinkle’s method3.
7. The total hardness (Ca and Mg) were determined complexometrically using suitable
indicators.
8. Calcium and Magnesium were determined complexometrically using murexide indicator.
9. The chloride content was estimated iodometrically using starch indicator.

51 Gurung Susma, Subba Asha, Jha Sangeeta, Pandey Manoranjan
International Journal of Engineering Technology Science and Research
IJETSR
www.ijetsr.com
ISSN 2394 – 3386
Volume 2 Issue 2
February 2015
10. Free carbon dioxide is present in water in the form of dissolved gas; surface water normally
contains less than 10ppm, while some water may easily exceed that concentration. Carbon dioxide is
readily soluble in water. Over the ordinary temperature range (0 -30º C) the solubility is about 200
times that of oxygen. Free carbon dioxide was estimated by acid base titration using phenolphthalein
indicator.
Statistical analysis:
The data are obtained statistically analysed mean ± standard deviation. All the data were analysed
applying for all the studied parameters.
Results and Discussion:
The seasonal variation of the physico-chemical parameters is depicted in tables in 1to 11 and in
figures-1 (pH), 2 (conductivity), 3 (Total dissolved solid), 4 (alkalinity), 5 (acidity), 6 (DO), 7 (Total
hardness), 8 (Ca), 9 (Mg), 10 (Chloride ion), 11 (free Carbon dioxide).
1. pH: The maximum values for pH of water samples were recorded during the monsoon
season. The water was alkaline during monsoon, slightly alkaline during winter and acidic during the
summer. The maximum fluctuation was recorded for sample-II (±1.82) in winter. The variation in the
above samples may be due to dissolved alkali salts.
2. CONDUCTIVITY: The maximum value of conductivity of water samples were recorded
during summer and minimum during the winter. The maximum fluctuation was recorder for sample-
IV (±8.78) during monsoon. The variation in above water samples may be due to the presence of
minerals in water
3. TOTAL DISSOLVED SOLIDS: The maximum value of TDS of water samples were recorded
during summer and minimum during the winter. The maximum fluctuation was recorder for sample-I
(±0.69) in monsoon. The variation in above water samples may be due to the presence of organic and
inorganic substances in water.
4. ALKALINITY: The maximum value of alkalinity of water samples were recorded during
monsoon and minimum during winter. The maximum fluctuation was recorder for sample-III
(±113.49) during monsoon. The variation in above water samples may be due to the presence of
predominant chemicals such as carbonates, bicarbonates and hydroxides in the water.
5. ACIDITY: The maximum value of acidity of water samples were recorded during winter and
minimum during the monsoon. The maximum fluctuation was recorder for sample-II (±18.39)
during monsoon. The variation in above water samples may be due to the presence hydrogen ions
and acidic compounds in water.
6. DISSOLVED OXYGEN: The maximum value of dissolved oxygen of water samples were
recorded during winter and minimum during the summer. The maximum fluctuation was recorder for
sample-II (±1.97) during winter. The variation in above water samples may be due to the less
microbial activity in water or alternately due to absorption of atmospheric oxygen. The high DO
value in winter may be due to increased photosynthesis by seaweeds and plankton and low DO value
in summer is due to consumption of oxygen by organisms and the adverse effect of metal ion
pollutants on the seaweeds
7. HARDNESS: The maximum value of hardness of water samples were recorded during winter and
minimum during monsoon. The maximum fluctuation was recorder for sample-II&III (±25.46)

52 Gurung Susma, Subba Asha, Jha Sangeeta, Pandey Manoranjan
International Journal of Engineering Technology Science and Research
IJETSR
www.ijetsr.com
ISSN 2394 – 3386
Volume 2 Issue 2
February 2015
during winter. The variation in above water samples may be due to the presence of calcium,
magnesium and other heavy metals.
8. CALCIUM: The maximum value of calcium of water samples were recorded during winter and
minimum during monsoon. The maximum fluctuation was recorder for sample-III (±21.13) during
winter. The variation in above water samples may be due to the immersion of clay idols in water
9. MAGNESIUM: The maximum value of magnesium in water samples were recorded during
summer except for sample-IV and minimum during monsoon. The maximum fluctuation was
recorder for sample-III (±2.11) during winter. The variation in above water samples may be due to
the presence of carbonates in water
10. CHLORIDE IONS: The maximum value of chlorine of water samples were recorded during
summer and minimum during monsoon. The maximum fluctuation was recorder for sample-III
(±29.13) in winter. The variation in above water samples may be due to the presence of inorganic
salts in water. Looking at seasonal variation of Chloride ions (table 10, Fig 10) and pH (table 1, Fig.
1), it is observed that the pH is alkaline during monsoon as indicated lower chloride content. The pH
is acidic in summer as indicated by the high chloride content.
11. FREE CARBONDIOXIDE: The maximum value of free carbon dioxide of water samples were
recorded in summer and minimum in monsoon. The maximum fluctuation was recorder for sample-
I(±0.45) in summer. The variation in above water samples may be due to the decaying of aquatic
species in water.
The presence of metal pollutants in this aquatic-ecosystem may render it unfits to sustain river life.
Conclusion:
After the complete detailed study of chemical and physical properties of the water sample collected
from four different sites of river teesta form Singtam to Rangpo, all the data was recorded,
calculation was done and the values for different physical and chemical parameters was compared
with WHO standard. River water was found to be alkaline during monsoon( maximum value of pH)
and acidic during winter. Maximum value of conductivity & TDS was observed during summer. The
total hardness of water is also high during winter, due to the presence of calcium, magnesium and
other heavy metals. The observed increase in DO during winter months could be due to the enhanced
photosynthetic activity in the river water. The maximum value of free carbon dioxide of water
samples were recorded in summer due to the decaying of aquatic species in river water.
The values obtained for different physical and chemical parameter were within the permissible range
as prescribed by WHO. More light can be thrown on the recorded values after detailed research on
the present metal-ions.
Acknowledgement: Valuable help rendered by Pro. (Dr.) Ajeya Jha, SMIT in collection of
experimental data and in the preparation of the manuscript is acknowledged and appreciated. Thanks
to SMIT for experimental facility provided during the study period.
References:
1) APHA standard Method for the experimentation of water and waste water, 19th
edition.
American Public Health Association, Washington D.C., USA (1996).
2) De. A.K., Environmental Chemistry, 2nd
Edition, Wiley Eastern LTD., New Delhi (1989).
3) Khhopkar, S.M., Environmental Pollution Analysis, Wiley Eastern Ltd and New New Age
International Ltd.,New Delhi, p 33-34,97-99 (1994).
53 Gurung Susma, Subba Asha, Jha Sangeeta, Pandey Manoranjan
International Journal of Engineering Technology Science and Research
IJETSR
www.ijetsr.com
ISSN 2394 – 3386
Volume 2 Issue 2
February 2015
4) Kudesia,V. P., Water Pollution, Pragati Prakashan, Meerut (1985).
5) WHO, International Standards for drinking water, World Health Organization Technical
Report, (1984).
Table -1: Seasonal variations of pH of water samples of river teesta
SEASONS MONSOON
MEAN±SD
WINTER
MEAN±SD
SUMMER
MEAN±SD
SAMPLE- I (Singtam) 8.01 ±0.12 7.74 ±0.15 6.2±0.07
SAMPLE-II (Bardang) 7.64 ± 0.45 6.61 ± 1.82 6.2±0.08
SAMPLE-III(Baghey khola ) 8.38 ± 0.23 7.32 ± 0.38 6.32±0.01
SAMPLE-IV (Rangpo) 7.69 ±0.51 7.96 ±0.07 6.04±0.06
Table -2: Seasonal variations of conductivity of water samples of river teesta
SEASONS MONSOON
MEAN±SD
WINTER
MEAN±SD
SUMMER
MEAN±SD
SAMPLE- I (Singtam) 61.29± 0.73 61.67 ± 0.67 92.47 ± 0.32
SAMPLE-II (Bardang) 66.85 ± 2.67 58.45 ± 1.24 91.5 ± 0.33
SAMPLE-III(Baghey khola ) 55.18± 1.22 54.43 ± 1.68 91.99 ± 0.45
SAMPLE-IV (Rangpo) 57.01± 8.78 53.47 ± 1.62 94.7 ± 0.10
Table -3: Seasonal variation of total dissolved solid of water samples of river teesta
SEASONS MONSOON
MEAN±SD
WINTER
MEAN±SD
SUMMER
MEAN±SD
SAMPLE- I (Singtam) 30.47±0.04 31.1 ± 0.69 42.55±0.10
SAMPLE-II (Bardang) 32.63±0.73 29.21±0.30 43.25±0.55
SAMPLE-III(Baghey khola ) 27.35±0.50 26.82±1.05 42.39±0.13
SAMPLE-IV (Rangpo) 25.23±0.90 26.38±0.23 40.41±0.14
54 Gurung Susma, Subba Asha, Jha Sangeeta, Pandey Manoranjan
International Journal of Engineering Technology Science and Research
IJETSR
www.ijetsr.com
ISSN 2394 – 3386
Volume 2 Issue 2
February 2015
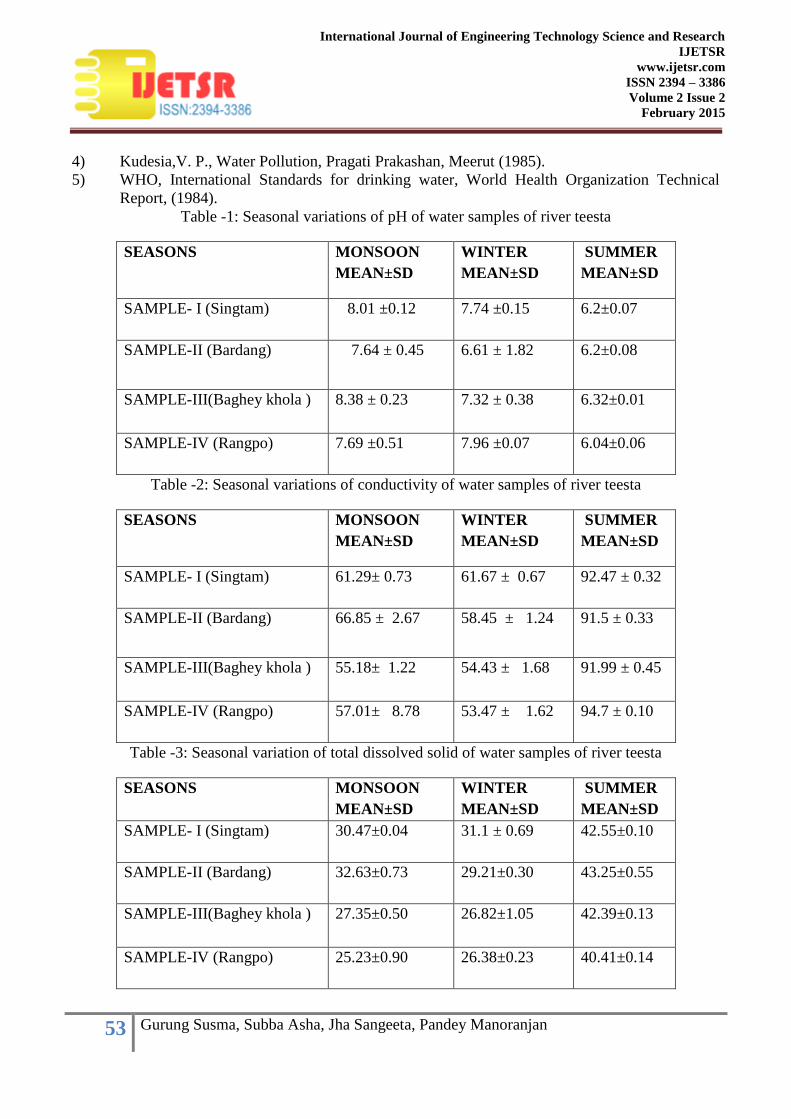
Table -4: Seasonal variation of alkalinity of water samples of river teesta
SEASONS MONSOON
MEAN±SD
WINTER
MEAN±SD
SUMMER
MEAN±SD
SAMPLE- I (Singtam) 67 ±9.9 70.2±45.33 77.2 ±0.14
SAMPLE-II (Bardang) 74.5 ±13.44 73 ±1.14 72.72 ±0.11
SAMPLE-III(Baghey khola ) 212.2 ±113.49 123±4.24 72.±0.1
SAMPLE-IV (Rangpo) 107±32.53 99±4.24 74 ±0
Table -5: Seasonal variation of acidity of water samples of river teesta
SEASONS MONSOON
MEAN±SD
WINTER
MEAN±SD
SUMMER
MEAN±SD
SAMPLE- I (Singtam) 25±7.07 27.5 ±3.54 31.5±3.54
SAMPLE-II (Bardang) 20 ±0 49.4 ±18.39 37±5.66
SAMPLE-III(Baghey khola ) 30 ± 0 37.15 ±4.74 33.6 ±4.81
SAMPLE-IV (Rangpo) 30 ± 0 35.1±1.84 27.85±3.18
Table -6: Seasonal variations of dissolved oxygen of water samples of river teesta
SEASONS MONSOON
MEAN±SD
WINTER
MEAN±SD
SUMMER
MEAN±SD
SAMPLE- I (Singtam) 11.55 ±1.63 12.18 ±3.44 10.24±0.26
SAMPLE-II (Bardang) 11.95 ±1.06 12.52 ±1.97 10.66 ±0.14
SAMPLE-III(Baghey khola ) 10.28 ±0.17 14.42 ±072 10.48 ±0.10
SAMPLE-IV (Rangpo) 11.93 ±0.11 11.48 ±1.48 10.59±0.04

55 Gurung Susma, Subba Asha, Jha Sangeeta, Pandey Manoranjan
International Journal of Engineering Technology Science and Research
IJETSR
www.ijetsr.com
ISSN 2394 – 3386
Volume 2 Issue 2
February 2015
Table -7: Seasonal variations of total hardness of water samples of river teesta
SEASONS MONSOON
MEAN±SD
WINTER
MEAN±SD
SUMMER
MEAN±SD
SAMPLE- I (Singtam) 28.22 ±5.96 70 ±19.8 63.52±1.99
SAMPLE-II (Bardang) 34.16 ±8.71 82 ± 25.46 66.26 ±0.05
SAMPLE-III(Baghey khola ) 25.44 ±2.04 146± 25.46 64 ±0
SAMPLE-IV (Rangpo) 25.44 ±2.04 76±0 62.85±1.31
Table -8: Seasonal variation of calcium of water samples of river teesta
SEASONS MONSOON
MEAN±SD
WINTER
MEAN±SD
SUMMER
MEAN±SD
SAMPLE- I (Singtam) 16.87±3.61 36.44±18.88 36.45±1.23
SAMPLE-II (Bardang) 14.66 ±3.28 14.39 ±0.41 17.76±0.06
SAMPLE-III(Baghey khola ) 18.21± 2.73 32.26±21.31 28.04±8.61
SAMPLE-IV (Rangpo) 12.79 ±0.91 17.32±0.03 16.±0
Table -9: Seasonal variations of magnesium of water samples of river teesta
SEASONS MONSOON
MEAN±SD
WINTER
MEAN±SD
SUMMER
MEAN±SD
SAMPLE- I (Singtam) 4.78±1.17 5.92±1.83 7.43 ± 1.91
SAMPLE-II (Bardang) 7.56±0.49 4.77±0.62 6.71± 0.28
SAMPLE-III(Baghey khola ) 5.83 ±0.57 6.14±2.11 7.69±0.60
SAMPLE-IV (Rangpo) 7.37±0.67 8.48±0.25 7.23±0.39

56 Gurung Susma, Subba Asha, Jha Sangeeta, Pandey Manoranjan
International Journal of Engineering Technology Science and Research
IJETSR
www.ijetsr.com
ISSN 2394 – 3386
Volume 2 Issue 2
February 2015
Table -10: Seasonal variations of chloride ions of water samples of river teesta
SEASONS MONSOON
MEAN±SD
WINTER
MEAN±SD
SUMMER
MEAN±SD
SAMPLE- I (Singtam) 23.23±8.44 37.06 ±16.26 63.38 ±5.34
SAMPLE-II (Bardang) 31.66±3.49 35.78±7.23 65.03±2.87
SAMPLE-III(Baghey khola ) 29.87±4.69 34.74±29.13 62.02±0.84
SAMPLE-IV (Rangpo) 23.89±15.03 30.67±10.84 67.21±0.2
Table -11: Seasonal variations of free carbon dioxide of water samples of river teesta
SEASONS MONSOON
MEAN±SD
WINTER
MEAN±SD
SUMMER
MEAN±SD
SAMPLE- I (Singtam) 1.19±0.08 1.76±0 2.23±0.45
SAMPLE-II (Bardang) 1.67±0.33 2.65 ±1.24 2.28 ±0.24
SAMPLE-III(Baghey khola ) 1.68± 0.21 1.97±0.31 1.93±0.37
SAMPLE-IV (Rangpo) 1.6 ±0.08 1.75±0.01 2.55±0.31
Fig 1: Seasonal variations of pH of water samples of river teesta
6
6.5
7
7.5
8
8.5
9
P
H
SINGTAM
BARDANG
BAGHEY KHOLA
RANGPO

57 Gurung Susma, Subba Asha, Jha Sangeeta, Pandey Manoranjan
International Journal of Engineering Technology Science and Research
IJETSR
www.ijetsr.com
ISSN 2394 – 3386
Volume 2 Issue 2
February 2015
Fig 2: Seasonal variation of conductivity of water samples of river teesta
Fig 3: Seasonal variation of total dissolved solid of water samples of river teesta
Fig 4: Seasonal variation of alkalinity of water samples of river teesta
50
60
70
80
90
MONSOON WINTER SUMMER
CO
ND
UC
TIV
ITY
µS
SINGTAM
BARDANG
BAGHEY KHOLA
RANGPO
20
25
30
35
40
45
50
MONSOON WINTER SUMMER
TOTA
L D
ISSO
LVED
SO
LID
S (m
g/l)
SINGTAM
BARDANG
BAGHEY KHOLA
RANGPO
60
110
160
210
MONSOON WINTER SUMMER
ALK
ALI
NIT
Y (
mg/
l)
SINGTAM
BARDANG
BAGHEY KHOLA
RANGPO

58 Gurung Susma, Subba Asha, Jha Sangeeta, Pandey Manoranjan
International Journal of Engineering Technology Science and Research
IJETSR
www.ijetsr.com
ISSN 2394 – 3386
Volume 2 Issue 2
February 2015
Fig 5: Seasonal variations of acidity of water samples of river teesta
Fig 6: Seasonal variations of dissolved oxygen of water samples of river teesta
Fig 7: Seasonal variations of total hardness of water samples of river teesta
20
25
30
35
40
45
50
55
MONSOON WINTER SUMMER
AC
IDIT
Y (
mg/
l)
SINGTAM
BARDANG
BAGHEY KHOLA
RANGPO
10
11
12
13
14
15
MONSOON WINTER SUMMER
DIS
SOLV
ED O
XY
GEN
(m
g/l)
SINGTAM
BARDANG
BAGHEY KHOLA
RANGPO
20
40
60
80
100
120
140
160
MONSOON WINTER SUMMER
HA
RD
NES
S O
F W
ATE
R (
mg/
l)
SINGTAM
BARDANG
BAGHEY KHOLA
RANGPO

59 Gurung Susma, Subba Asha, Jha Sangeeta, Pandey Manoranjan
International Journal of Engineering Technology Science and Research
IJETSR
www.ijetsr.com
ISSN 2394 – 3386
Volume 2 Issue 2
February 2015
Fig 8: Seasonal variation of calcium of water samples of river teesta
Fig 9: Seasonal variation of magnesium of water samples of river teesta
Fig 10: Seasonal variations of chloride ions of water samples of river teesta
10
15
20
25
30
35
40
MONSOON WINTER SUMMER
CA
LCIU
M (
mg/
l)
SINGTAM
BARDANG
BAGHEY KHOLA
RANGPO
4
5
6
7
8
9
MONSOON WINTER SUMMER
MA
GN
ESIU
M (
mg/
l)
SINGTAM
BARDANG
BAGHEY KHOLA
RANGPO
20
30
40
50
60
70
MONSOON WINTER SUMMER
CH
LOR
IDE
(mg/
l)
SINGTAM
BARDANG
BAGHEY KHOLA
RANGPO

60 Gurung Susma, Subba Asha, Jha Sangeeta, Pandey Manoranjan
International Journal of Engineering Technology Science and Research
IJETSR
www.ijetsr.com
ISSN 2394 – 3386
Volume 2 Issue 2
February 2015
Fig 11: Seasonal variations of free carbon dioxide of water samples of river teesta
*Corresponding Author
Sangeeta Jha
Department of Chemistry, Sikkim Manipal Institute of Technology, Majitar, East Sikkim, India,737136
03592-246210, Fax: +91-3592-246112
Email: [email protected]
1
1.5
2
2.5
3
Fre
e c
o2
(m
g/l)
SINGTAM
BARDANG
BAGHEY KHOLA
RANGPO