
Analysis of Nursing Home Services and Resources...
107
NORTH CAROLINA HISTORY OF HEALTH DIGITAL COLLECTION Analysis of Nursing Home Services and Resources in North Carolina [1971] DOCUMENT NO. NCHH-103 || http://hsl.lib.unc.edu/specialcollections/nchealthhistory ||
Transcript of Analysis of Nursing Home Services and Resources...

NORTH CAROLINA HISTORY OF HEALTH
DIGITAL COLLECTION
Analysis of Nursing Home Services and Resources in North Carolina
[1971]
DOCUMENT NO. NCHH-103
|| http://hsl.lib.unc.edu/specialcollections/nchealthhistory ||

This item is part of the North Carolina History of Health Digital Collection. Some materials in the Collection are protected by U.S. copyright law. This item is presented by the Health Sciences Library of the University of North Carolina at Chapel Hill for research and educational purposes. It may not be republished or distributed without permission of the Health Sciences Library.
The North Carolina History of Health Digital Collection is an open access publishing initiative of the Health Sciences Library of the University of North Carolina at Chapel Hill. Financial support for the initiative was provided in part by a multi-year NC ECHO (Exploring Cultural Heritage Online) digitization grant, awarded by the State Library of North Carolina, and funded through the Library Services and Technology Act (LSTA).
For more information about the collection, or to search other volumes, please visit:
|| http://hsl.lib.unc.edu/specialcollections/nchealthhistory ||

NORTH CAROLINA HISTORY OF HEALTH
DIGITAL COLLECTION
Analysis of Nursing Home Services and Resources in North Carolina
[1971]
DOCUMENT NO. N C H H - 1 0 3
ft UNC H E A L T H S C I E N C E S L I B R A R Y
| | h t t p : / / h s l . H b . m i c . e d u / s p e c i a l c o U e c t i o n s / n c h e a l t h l i i s t o r v | |

A N A N A L Y S I S O F N U R S I N G HOME S E R V I C E S
A N D R E S O U R C E S I N N O R T H C A R O L I N A
PREPARED BY THE SOCIAL RESEARCH SECTION, DIVISION OF HEALTH AFFAIRS THE UNIVERSITY OF NORTH CAROLINA AT CHAPEL HILL


AN ANALYSIS OF NURSING HOME SERVICES AND RESOURCES IN NORTH CAROLINA
DIVISION OF HEALTH SCIENCES LIBRARY
Social Research Section Harvey L. Smith, Ph. D., Director
Research Sta
Sarah Kaufma
Division of Health Affairs University of North Carolina at Chapel Hill
August 1971


ACKNOWLEDGEMENT
This report was prepared for the Association for the North
Carolina Regional Medical Program with funds for staff support provided
by that agency. The report represents a portion of our effort to
delineate the health care needs and resources in North Carolina re
levant to the mission of the North Carolina Regional Medical Program.
I wish to especially thank Miss Lydia Holley, Associate Professor
of the Department of Public Health Administration, School of Public
Health, and a physical therapist and a consultant to the North Carolina
Regional Medical Program, for her invaluable encouragement and criticism.
My thanks also to Mr. Gordon Poole, Chief and Mr. Hugh G. Young, Assistant
Chief, of the Nursing Home Section of the State Board of Health and to
their secretary Mrs. Maye. Also, I am very grateful for the consultation,
criticism and support of Mr. C. J. Blanchard, Jr., President of the
North Carolina Association of Nursing Homes, Inc. and Mr. Elbert E. Levy,
President of the North Carolina Association of Non-Profit Homes for the
Aged. Without the help of these people this survey would not have been
possible. I wish also to thank the numerous people who helped in forming
certain sections of the questionnaire: Miss Mary Shaughnessy, Miss
Audrey Booth, Dr. Edgar Beddingfield, Mrs. Barbara Hughes, Mrs. Doris
Cox, Miss Agnus Campbell, Mr. Fred Eckel, Mr. Kerr, and all the nursing •
home administrators who let us pretest the questionnaire in their homes
and criticized it for us.

Digitized by the Internet Archive in 2011 with funding from
North Carolina History of Health Digital Collection, an LSTA-funded NC ECHO digitization grant project
http://www.archive.org/details/analysisofnursinOOuniv

TABLE OF CONTENTS
Title Page
INTRODUCTION AND STATE OVERVIEW 1
I SERVICE INDICES 26 II STAFFING 40
III STAFF EDUCATION 50
SUMMARY 65 APPENDIX A--QUESTIONNAIRE 71 APPENDIX B--SERVICE AREAS 83
LISTING OF TABLES
Table 1: Service Area of Nursing Home by County Type,
1970 4
Table 2: Service Area of Nursing Home by Size, 1970 . . 4
Table 3: Service Area of Nursing Home by Medicare
Certified 5
Table 4: Service Area of Nursing Home by Combination Home 5
Table 5: Distribution of Nursing Homes by County Types and by Whether Defined as Combination Home, 1970 6
Table 6: Distribution of Nursing Homes by County Type and by Bed Size 7
Table 7: Distribution of Nursing Homes by County Type and by Whether Medicare Certified, 1970 . . . . 8
Table 8: Distribution of Nursing Homes by County Type and by Service Area, 1970 9
Table 9: Size of Nursing Home by Medicare Certifiec, 1970 11
Table 10: Size of Nursing Home by Combination Home, 1970 11
Table 11: Size of Nursing Home by Service Area, 1970 .. 12

>
TABLE OF CONTENTS (CONTINUED)
Title Page
Table 25: Number and Percent of Homes in Upper Third of
Service Index Range and Total Responding by
Medicare Certified 3 7
LISTING OF TABLES (CONTINUED)
Table 12: Size of Nursing Home by County Type, 1970 . . 12
Table 13: Medicare Certified Nursing Homes by Service
Area, 1970 13
Table 14: Medicare Certified Nursing Homes by County
Type, 1970 13
Table 15: Medicare Certified Nursing Homes by Size of Home, 1970 13
Table 16: Medicare Certified Nursing Homes by Com
bination Home, 1970 14
Table 17: Combination Nursing Homes by Service Area,
1970 16
Table 18: Combination Nursing Homes by County Type,
1970 16
Table 19: Combination Nursing Homes by Size, 1970 . . . 17
Table 20: Combination Nursing Homes by Medicare
Certified, 1970 17
Table 2 1 : Number and Percent of Homes Giving Certain Nursing Services to an Indicated Percentage of Their Patients 22
Table 22: Number and Percent of Homes in Upper Third of Service Index Range and Total Responding by Service Area 31
Table 23: Number and Percent of Homes in Upper Third of
Service Index Range and Total Responding by
County Type 33
Table 24: Number and Percent of Homes in Upper Third of
Service Area Index Range and Total Responding
by Size of Home 36


TABLE OF CONTENTS (CONTINUED)
Title Page
LISTING OF TABLES (CONTINUED)
Table 26: Number and Percent of Homes in Upper Third of
Service Index Range and Total Responding by
Combination Home 39
Table 27: Number and Percent of Homes with Indicated Patient/Staff Ratios by Type of Staff . . . . 43
Table 28: Number and Percent of Homes with Indicated Patient/Staff Ratios by Type of Staff and Service Area 44
Table 29: Number and Percent of Homes with Indicated Patient/Staff Ratios by Type of Staff and by County Type 46
Table 30: Number and Percent of Homes with Indicated Patient/Staff Ratios by Type of Staff and by
Size 48
Table 31: Number and Percent of Homes with Indicated Patient/Staff Ratios by Type of Staff and by Medicare Certified 49
Table 32: Number and Percent of Homes with Indicated
Patient/Staff Ratios by Type of Staff and by
Combination Home 51
Table 33: Number and Percent of Homes with Staff Educa
tion Programs by Service Area 54
Table 34: Number and Percent of Homes with Staff Educa
tion Programs by County Type 56
Table 35: Number and Percent of Homes with Staff Educa
tion Programs by Size 57
Table 36: Number and Percent of Homes with Staff Educa
tion Programs by Medicare Certified 59
Table 37: Number and Percent of Homes with Staff Educa
tion Programs by Combination Home 60
Table 38: Percent of Nursing Homes Stating Degree of Need for Certain Education Topics Among Types
of Staff, 1970 62

TABLE OF CONTENTS (CONTINUED)
Title Page
LISTING OF TABLES (CONTINUED)
Table 39: Percent of 1960 Population 65 Years of Age or Older, Percent of PAS Hospital Discharge Population 66 Years of Age and Older and Percent of Nursing Home Beds 68
Table 40: Number of Beds in Institutions for the
Aged Per 1,000 Total Civilian Population 65+ Years of Age for the U. S. and the South, April - June, 1963 70
Table 41: Number of Beds in Institutions for the Aged Per 1,000 Total Civilian Population 65+ Years of Age for North Carolina, 1970 . . . . 70
LISTING OF MAPS
Map A: Number of Licensed Nursing Homes and Beds (Skilled
Nursing, ICF-A and ICF-B) in North Carolina,
1970 71
Map B: Number of Licensed Nursing Homes and Beds (Skilled
Nursing, ICF-A and ICF-B) Returning Regional
Medical Program Questionnaire, 1970 72


AN ANALYSIS OF NURSING HOME SERVICES AND RESOURCES IN NORTH CAROLINA
Introduction and State Overview
Little is presently recorded about the nursing homes in the State.
The Nursing Home Section of the State Board of Health has some information
from the homes 1 license applications. There have also been some studies
done on different phases of the nursing home operation.
Nursing homes vary considerably in the types of patients they have
and in the services they offer. At times there may be little or no
difference in the care requirements of patients in a Home for the Aged
and of patients in a nursing home. Some nursing homes provide mainly
custodial, long-term care. Other homes, with a much higher turnover of
patients, offer care to patients who no longer need hospitalization but
need skilled nursing and some sophisticated equipment.
All nursing homes and combination homes (nursing home and home for
the aged in one facility) are licensed by the State Board of Health.
(Homes for the Aged, not in combination with a nursing home, are licensed
by the Welfare Department.) As of January 1, 1970, the nursing homes were
divided into three categories: Nursing Home, Intermediate Care Facility -
Type A, and Intermidiate Care Facility Type B. The State Board of
Health defines a nursing home as: fla skilled nursing home institution
or facility which is maintained for the purpose of providing nursing and
medical supervision less than the degree of care provided in a hospital
and more than the degree of care provided in an ICF. This type of facility
shall have a registered nurse as director of nursing and twenty-four hour
registered or licensed nursing coverage11. An Intermediate Care Facility -
2
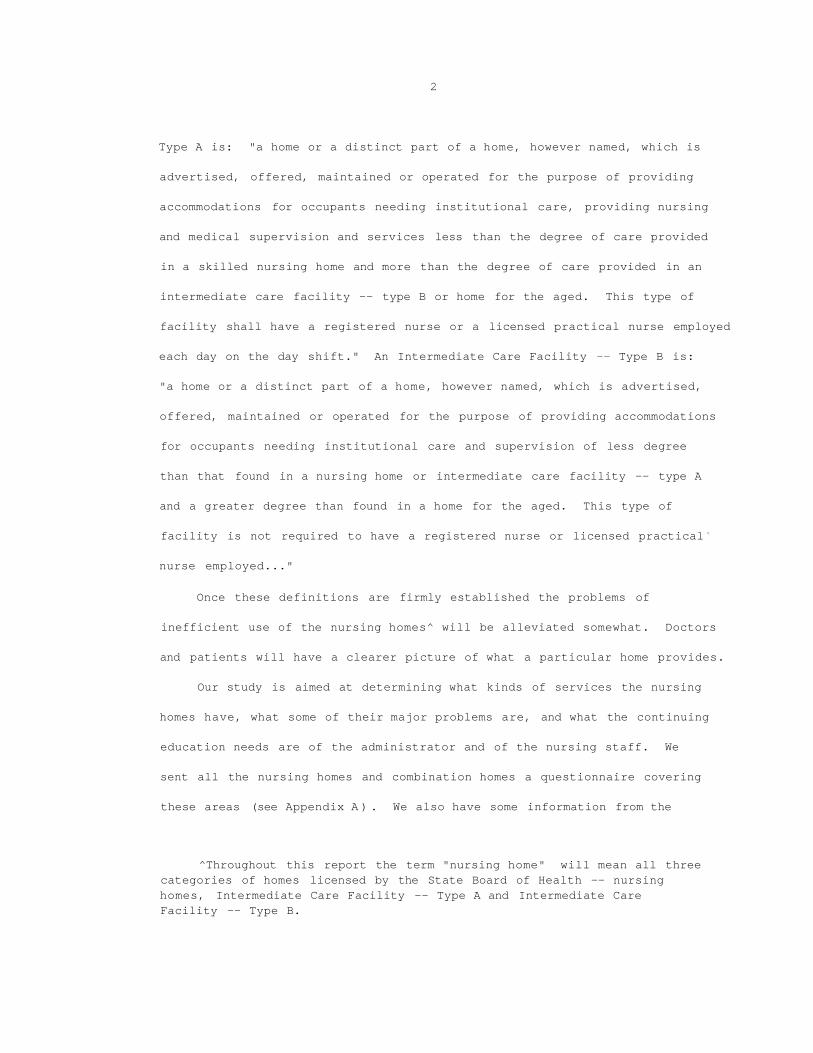
Type A is: "a home or a distinct part of a home, however named, which is
advertised, offered, maintained or operated for the purpose of providing
accommodations for occupants needing institutional care, providing nursing
and medical supervision and services less than the degree of care provided
in a skilled nursing home and more than the degree of care provided in an
intermediate care facility -- type B or home for the aged. This type of
facility shall have a registered nurse or a licensed practical nurse employed
each day on the day shift." An Intermediate Care Facility -- Type B is:
"a home or a distinct part of a home, however named, which is advertised,
offered, maintained or operated for the purpose of providing accommodations
for occupants needing institutional care and supervision of less degree
than that found in a nursing home or intermediate care facility -- type A
and a greater degree than found in a home for the aged. This type of
facility is not required to have a registered nurse or licensed practical v
nurse employed..."
Once these definitions are firmly established the problems of
inefficient use of the nursing homes^ will be alleviated somewhat. Doctors
and patients will have a clearer picture of what a particular home provides.
Our study is aimed at determining what kinds of services the nursing
homes have, what some of their major problems are, and what the continuing
education needs are of the administrator and of the nursing staff. We
sent all the nursing homes and combination homes a questionnaire covering
these areas (see Appendix A ) . We also have some information from the
^Throughout this report the term "nursing home" will mean all three categories of homes licensed by the State Board of Health -- nursing homes, Intermediate Care Facility -- Type A and Intermediate Care Facility -- Type B.

& G) license applications and from the patient census done by the Nursing Home
Section, State Board of Health. We have combined these three data sources
in order to describe what services the nursing homes are presently providing
Let us look first at how certain characteristics of the nursing homes, 2
the Service Area in which the home is located, the type of county in which
the home is located, the size of the home, whether or not the home is
certified for participation in the Medicare program and whether or not
the home is a combination home relate to each other.
Service Area
(See Tables 1 - 4 , pages
Most Service Areas have a higher percentage of homes in their urban
counties (Metropolitan, Urban and Adjacent), Service Areas II and IV having
over 9 0 7 o in the more urban counties. Service Area VI is a notable exception
having only 3 0 7 o in the urban counties.
The homes are fairly evenly distributed in the Service Areas by size.
Most Service Areas tend to have the largest proportion of their homes in
the 5 1 - 1 0 0 bed size range with Service Areas II and III having smaller
homes.
Service Area III has considerably fewer homes than the other Service
Areas that are Medicare Certified only 2 0 . 8 7 o . Service Area VI has
considerably fewer homes that are combination homes -- having only one.
County Type
(See Tables 5 - 8 , pages
For a brief discussion and map of the Service Areas see Appendix B. The nursing home data was not considered by the Governor's planning regions because the number of homes per region would have been too small to work with.

4
Table 1 : Service Area Of Nursing Home By County Type , 1970
County Type Service Area Metro Urban Ad].
(Metro. & Urban & Ad i.)
Semi-Rural Rural
(Semi & Rural) Total
I # %
6 66.7
0 0
2 22.2
( 8 ) (88.9)
0 0
1 11.1
( 1 ) (ll.D
9 100.0
II #
% 17 63.0
5 18.5
4 14.8
(26 ) (96.3)
0 0.0
1 3.7
( 1 ) ( 3.7)
27 100.0
III # 7 29.2
10 41.7
1 4.2
(18 ) (75.0)
6 25.0
0 0.0
( 6 ) (25.0)
24 100.0
IV # 9 69.2
0 0.0
3 23.1
(12 ) (92.3)
1 7.7
0 0.0
( 1 ) ( 7.7)
13 100.0
V # %
0 0.0
14 63.6
0 0
(14 ) (63.6)
6 27.3
2 9.1
( 8 ) (36.4)
22 100.0
VI #
% 0 0
4 30.8
0 0
( 4 ) (30.8)
8 61.5
1 7.7
( 9 ) (69.2)
13 100.0
Total #
7„
39 36.1
33 30.6
10 9.3
(82 ) (75.9)
21 19.4
5 4.6
(26 ) (24.0)
108 100.0
Table 2 : Service Area Of Nurs ing Home By Size, 1970
Size Service Area 1-25 26-50 51-100 101-150 151-300 Tota!
I #
7=
2 22.2
2 22.2
5 55.6
0 0.0
0 0.0
9 100. (
II #
7,
3 11.1
14 51.9
5 18.5
3 11.1
2 7.4
27 100.1
III #
% 8
33.3 8
33.3 4 16.7
3 12.5
1 4.2
24 100.1
IV #
7o
1 7.7
2 15.4
6 46.2
3 23.1
1 7.7
13 100.1
V # 2 9.1
5 22.7
12 54.5
3 13.6
0 0.0
22 100.1
VI #
7,
1 7.7
3 23.1
8 61.5
1 7.7
0 0.0
13 100.1
Total # 17 34 40 13 4 108
7o 15.7 31.5 37.0 12.0 3.7 100.' i

5
Table 3: Service Area Of Nursing Home By Medicare Certified
Medicare Certified Service Area Yes No Total
I # 3 6 9 33.3 66.7 100.0
II # 12 15 27 44.4 55.6 100.0
III # 5 19 24 20.8 79.2 100.0
IV # 7 6 13 53.8 46.2 100.0
V # 8 14 22 36.4 63.6 100.0
VI # 7 6 13 53.8 46.2 100.0
Total # 42 66 108 7. 38.9 61.1 100.0
Table 4 : Service Area Of Nursing Home By Combination Home
Combinations Service Area Yes No Total
I # 3 6 9 33.3 66.7 100.0
II # 13 14 27 7» 48.1 51.9 100.0
III # 13 11 24 54.2 45.8 100.0
IV # 3 10 13 7c 23.1 76.9 100.0
V # 5 17 22 7o 22.7 77.3 100.0
VI # 1 12 13 7 , 7.7 92.3 100.0
Total # 38 70 108
7, 35.2 64.8 100.0

6
Table 5: Distribution Of Nursing Homes By County Type And By Whether Defined As Combination Home, 1970
Combination Home Yes No Total
County Type
Metropolitan # 18 21 39 % 46.2 53.8 100.0
Urban # 11 22 33 33.3 66.7 100.0
Adjacent # 2 8 10 % 20.0 80.0 100.0
(Metro., Urban # (31 ) (51 ) ( 82 ) and Adjacent) (37.8) (62.2) (100.0)
Semi-Rural # 6 15 21 7, 28.6 71.4 100.0
Rural # 1 4 5 7 , 20.0 80.0 100.0
(Semi & Rural) # ( 7 ) (19 ) ( 26 ) 7o (26.9) (73.1) (100.0)
Total # 38 70 108 7, 35.2 64.8 100.0

7
Table 6: Distribution of Nursing Homes By County Type and By Bed Size
Size 1-25 26-50 51-100 101 -150 151- 300 Total
County Type
Metropolitan # 6 12 11 6 4 39 7. 15.4 30.8 28.2 15 .4 10. 3 100.0
Urban # 1 16 11 5 0 33 3.0 48.5 33.3 15 .2 0 100.0
Adjacent # 2 3 4 1 0 10 7„ 20.0 30.0 40.0 10 .0 0 100.0
(Metro., Urban # ( 9 ) (31 ) (26 ) (12 ) ( 4 ) ( 82 ) and Adjacent) 7= (ii.o) (37.8) (31.7) (14 .6) ( 4. 9) (100.0)
Semi-Rural # 8 2 10 1 0 21 7, 38.1 9.5 47.6 k .8 0 100.0
Rural # 0 1 4 0 0 5 7» 0 20.0 80.0 0 0 100.0
(Semi & Rural) # ( 8 ) ( 3 ) (14 ) ( 1 ) ( o ) ( 26 ) (30.8) (11.5) (53.8) ( 3 • 8) ( o. 0) (100.0)
Total # 17 34 40 13 4 108 7, 15.7 13.5 37.0 12 .0 3. 7 100.0

8
Table 7: Distribution Of Nursing Homes By County Type And By Whether Medicare Certified, 1970
Medicare Certified Yes No Total
County Type
Metropolitan # 18 21 39 7, 46.2 53.8 100.0
Urban # 10 23 33 7, 30.3 69.7 100.0
Adjacent # 4 6 10 7, 40.0 60.0 100.0
(Metro., Urban # (32 ) (50 ) ( 82 ) and Adjacent) % (39.0) (61.0) (100.0)
Semi-Rural # 6 15 21 7» 28.6 71.4 100.0
Rural # 4 1 5 7o 80.0 20.0 100.0
(Semi & Rural) # (10 ) (16 ) ( 26 ) (38.5) (61.5) (100.0)
Total # 42 66 108 7o 38.9 61.1 100.0

9
Table 8: Distribution Of Nursing Homes By County Type And By Service Area, 197C
Service Area I II III IV V VI Total
County Type
Metropolitan # 6 17 7 9 0 0 39 15 4 43. 6 17.9 23.1 0 0 100.0
Urban # 0 5 10 0 14 4 33 0 15. 2 30.3 0 42 4 12.1 100.0
Adjacent # 2 4 1 3 0 0 10 20 0 40. 0 10.0 30.0 0 0 100.0
(Metro., Urban # ( 8 ) (26 ) (18 ) (12 ) (14 ) ( 4 ) ( 82 ) and Adjacent) ( 9 8) (31. 7) (30.0) (14.6) (17 I) ( 4.9) (100.0)
Semi-Rural # 0 0 6 1 6 8 21 0 0 28.6 4.8 28 6 38.1 100.0
Rural # 1 1 0 0 2 1 5 7o 11 1 20. 0 0 0 40 0 7.7 100.0
(Semi & Rural) # ( 1 ) ( 1 ) ( 6 ) ( 1 ) ( 8 ) ( 9 ) ( 26 ) 7» ( 3 8) ( 3. 8) (23.1) ( 3.8) (30 8) (34.6) (110.0)
Total # 9 27 24 13 22 13 108 7. 8 3 25. 0 22.2 12.0 20 4 12.0 100.0

1 0
Over 6 0 7 o of the urban homes are in Service Areas II and III. Over
6 0 7 o of the rural homes are in Areas V and VI.
More of the larger homes are in urban counties which have almost 2 0 %
of their homes with over 1 0 0 beds. Rural counties have a higher percentage
of homes than urban counties in the smallest 1 - 2 5 size, but the highest
percent of the rural homes are in the middle 5 1 - 1 0 0 bed range.
Urban and rural counties have almost the same percentage of homes
that are Medicare Certified. The urban counties have a slightly higher
percentage of combination homes.
Size
(See Tables 9 - 1 2 , pages
The smaller homes, 1 - 5 0 beds, are more concentrated in Service Areas
II and III. A larger percentage of homes in each size category are in the
urban counties, except for the smallest size, 1 - 2 5 beds, which is almost
equally dividied between urban and rural. In general, the larger the
home, the more apt it is to have Medicare Certification. In no size
category is there a higher percentage of homes which are combination homes
than homes which are not combination homes. In the 5 1 - 1 5 0 range there are
considerably fewer homes which are combination homes than those that are
not combination homes.
Med icare
(See Tables 1 3 - 1 6 , pages
The Medicare homes are fairly evenly distributed by Service Area.
Most Medicare homes, 7 6 . 1 % , are in urban counties. A higher percentage
of Medicare certified homes are the larger homes. Almost three-forths of
the homes which are Medicare Certified are not combination homes.

11
Table 9: Size Of Nursing Home By Medicare Certified, 1970
Medicare Certified Size Yes No Total
1-25 # 2 15 17 11.8 88.2 100.0
25-50 # 6 28 34 17.6 82.4 100.0
51-100 # 20 20 40 % 50.0 50.0 100.0
101-150 # 11 2 13 84.6 15.4 100.0
151-300 # 3 1 4 7= 75.0 25.0 100.0
Total # 42 66 108 7. 38.9 61.1 100.0
Table 10: Size of Nursing Home By Combination Home, 1970
Combination Home Size Yes No Total
1-25 # 7 10 17 X 41.2 58.8 100.0
25-50 # 17 17 34 50.0 50.0 100.0
51-100 # 10 30 40 7. 25.0 75.0 100.0
101-150 # 2 11 13 7. 15.4 84.6 100.0
151-300 # 2 2 4 % 50.0 50.0 100.0
Total # 38 70 108 7o 35.2 64.8 100.0

12
Table 11: Size Of Nursing Home By Service Area, 1970
Service Area Size
I II Ill IV V VI Tota
1-25 # 2 11.8
3 17.6
8 47.1
1 5.9
2 11.8
1 5.9
17 100.
25-50 # 2 5.9
14 41.2
8 23.5
2 5.9
5 14.7
3 8.8
34 100.
51-100 # 7o
5 12.5
5 12.5
4 10.0
6 15.0
12 30.0
8 20.0
40 100.
101-150 § 0 0
3 23.1
3 23.1
3 23.1
3 23.1
1 7.7
13 100.
151-300 # 0 0
2 50.0
1 25.0
1 25.0
0 0
0 0
4 100.
Total # 9 8.3
27 25.0
24 22.2
13 12.0
22 20.4
13 12.0
108 100.
Table 12: Size Of Nurs ing Home By County Typ e, 1970
County Type Metro Urban Adj.
(Metro. & Urban & Adj.)
Semi-Rural Rural
(Semi & Rural) Tota
Size
1-25 # 6 1 2 ( 9 ) 8 0
CO ) 17
7» 35 3 5 9 11 8 ( 52.9) 47.1 0 (47 1) 100.1
25-50 # 12 16 3 ( 31 ) 2 1 ( 3 ) 34 % 35 3 47 1 8 8 ( 91.2) 5.9 2 9 ( 8 8) 100.1
51-100 # 11 11 4 ( 26 ) 10 4 (14 ) 40 7, 27 5 27 5 10 0 ( 65.0) 25.0 10 0 (35 0) 100.1
101-150 # 6 5 1 ( 12 ) 1 0 ( 1 ) 13 7o 46 2 38 5 7 7 ( 92.3) 7.7 0 ( 7 7) 100.(
151-300 # 4 0 0 ( 4 ) 0 0 ( o ) 4 7» 100 0 0 0 (100.0) 0 0 ( o ) 100.(
Total # 39 33 10 ( 82 ) 21 5 (26 ) 108 % 36 1 30 6 9 3 ( 75.9) 19.4 4 6 (24 1) 100.(

13
Table 13: Medicare Certifier] 1 Nursing Homes By Service Area, 1970
Service Area I II III IV V VI Total
Medicare
Yes # %
3 7.1
12 28.6
5 11.9
7 16.7
8 19.0
7 42 16.7 100. ,0
No # %
6 9.1
15 22.7
19 28.8
6 9.1
14 21.2
6 66 9.1 100, ,0
Total # 9 8.3
27 25.0
24 22.2
13 12.0
22 20.4
13 108 12.0 100. .0
Table 14: Medicare Certified Nursing Homes By County Type, 1970
County Type Metro Urban Adi.
(Metro. & Urban & Ad].)
Semi- (Semi & Rural Rural Rural) Total
Med icare
Yes # %
18 42.9
10 23.8
4 9.5
(32 ) (76.1)
6 4 14.3 9.5
(10 ) (23.8)
42 100.0
No # %
21 31.8
23 34.8
6 9.1
(50 ) (75.7)
15 1 22.7 1.5
(16 ) (24.2)
66 100.0
Total # 39 36.1
33 30.6
10 9.3
(82 ) (75.9)
21 5 (26 ) 19.4 4.6 (24.0)
108 100.0
Table 15: Medicare Certified Nurs ing Home s By Size of Home, 1970
S ize 1-25 26-50 51-100 101-150 151-300 Total
Medicare
Yes # 2 4.8
6 14.3
20 47.6
11 26.2
3 7.1
42 100.0
No # 15 22.7
28 42.4
20 30.3
2 3.0
1 1.5
66 100.0
Total # %
17 15.7
34 31.5
40 37.1
13 12.0
4 3.7
108 100.0

14
Table 16: Medicare Certified Nursing Homes By Combination Home, 1970
Combination Yes No Total
Med icare
Yes # 11 31 42 26.2 73.8 100.0
No # 27 39 66 40.9 59.1 100.0
Total # 38 70 108 7= 35.2 64.8 100.0

15
Combination
Only ninety-five homes responded to all categories in this section.
(See Tables 1 7 - 2 0 , pages
The highest percent of combination homes are in Service Area II and
III. A Higher percentage are in urban counties, 81.6%. The percent of
homes in the different size categories follow no obvious pattern; the
largest percentage of combination homes are in the 25-50 bed category and
the 151-300 bed category. A low percentage of combination homes are \/
Medicare Certified.
Patient Information
We have no information on individual patients, but the State Board of
Health census gives us a general description of the patient population.
Seventy-nine out of one hundred and eight homes responded to the State
Board of Health patient census.
Those homes replying indicated that seventy-four percent of their
patients were female, twenty-six percent male. Ninety-one percent of the
patient population is white with the non-white population fairly evenly
distributed between the sexes.
Forty-nine percent of the patients have their bills paid by private
means. Eight percent are Medicare patients and forty-two percent are
Med icaid.
Twenty-eight percent of the patients are able to walk, twenty-nine
percent are able to walk with help. Forty-four percent are non-ambulatory,
either confined to bed or to a wheel chair.
From the license applications of the State Board of Health for the
3
year ending October 31, 1969, ninety-five nursing homes had a total of

16
/
Table 17: Combination Nursing Homes By Service Area, 1970
Service Area I II III IV V VI Total
Combination
Yes # 3 13 13 3 5 1 38 % 7.9 34.2 34.2 7.9 13.2 2.6 100.0
No # 6 14 11 10 17 12 70 8.6 20.0 15.7 4.3 24.3 17.1 100.0
Total # 9 27 24 13 22 13 108 7„ 8.3 25.0 22.2 12.0 20.4 12.0 100.0
Table 18: Combination Nursing Homes By County Type, 1970
(Metro.
County Type Metro. Urban Adj. & Urban & Adj.)
Semi-Rural Rural
(Semi & Rural) Total
Combination
Yes # 18 11 2 (31 ) 6 1 ( 7 ) 38 47.4 28.9 5.3 (81.6) 15.8 2.6 (18.4) 100.0
No # 21 22 8 (51 ) 15 4 (19 ) 70 7o 30.0 31.4 11.4 (72.8) 21.4 5.7 (27.1) 100.0
Total # 39 33 10 (82 ) 21 5 (26 ) 108 7» 36.1 30.6 9.3 (75.9) 19.4 4.6 (24.1) 100.0

17
Table 19: Combination Nursing Homes By Size, 1970
No. of Beds 1-25 25-50 51-100 101-150 151-300 Total
Combination
Yes #
% 7
18.4 17 50.0
10 25.0
2 15.4
2 50.0
38 100.0
No #
% 10 58.8
17 50.0
30 75.0
11 84.6
2 50.0
70 100.0
Total # 7,
17 15.7
34 31.5
40 37.0
13 12.0
4 3.7
108 100.0
Table 20: Combination Nursing Homes By Medicare Certified, 1970
Medicare Certified Yes No Total
Combination
Yes # 7o
11 28.9
27 71.1
38 100.0
No # 31 44.3
39 55.7
70 100.0
Total # 7o
42 38.9
66 61.1
108 100.0

18
6,683 admissions, 6,108 discharges, (1,694 deaths), and 1,566,101 days of
patient care. The occupancy rate was 78.4.
From the Research and Evaluation Division questionnaire we have
information on the kinds of patients the nursing homes will not accept.
Approximately seventy-four percent of the homes do not accept patients
who are mentally ill, citing "not equipped to handle1' and "disturbing to
others" as the main reasons for this restriction. Over fifty percent
of the homes do not accept patients under age eighteen. Eighty-four
percent of the homes do accept public assistance patients, those homes
which do not cite inadequate reimbursement as the most common reason
for exclusion. Only ten percent of the homes do not accept terminally
ill cancer patients, mainly because the homes were not equipped to handle
them or because the cancer patients were disturbing to the other patients.
Ninety-seven percent of the homes do accept bed-fast patients. Seventy-
four percent do accept patients who are difficult to manage; those homes
which do not accept them cited "not equipped to handle" as the main
reason and "disturbing to others" next.
We asked for a rough estimate of the percentage of patients the
homes had with one of the categorical diseases as a primary or secondary
diagnosis. Approximately fifty-six percent of the homes said thirty
percent or more of their patients had heart disease. Only one percent
of the homes had thirty percent or more with cancer. Forty-eight percent
have thirty percent or more patients with stroke; and six percent have
thirty percent or more patients with diabetes. Ten percent have thirty
percent or more with kidney disease.

19
Patient Care Manuals, Utilization Review Committees, and Transfer Agreements
Eighty-seven percent of the homes have a patient care manual, eighty-
eight percent have patient care plans and ninety-four percent of those
with plans have the plans available to the staff at all times.
Utilization review committees are present in sixty-five percent of
the homes. Ninety-one percent of the homes with utilization review
committees have at least one physician and at least one Registered Nurse
on the committee. Nine percent have Licensed Practical Nurses, twenty-
one percent have physical therapists, fifty-seven percent have nursing
home administrators, and twenty-three percent have pharmacists on the
committee. Seventy-five percent of the committees meet at least once per
month.
The efficient transfer of patients from a nursing home to a hospital
and vice-versa is an important aspect of nursing home care. Transfer is
expedited by a transfer agreement between the hospital and the nursing
home. Forty-one percent of the nursing homes have at least one verbal
transfer agreement, some having as many as three. Sixty-eight percent
of these verbal agreements are with the general hospital closest to the
nursing home and in the same county. Seventy-nine percent of the homes
have written transfer agreements, with several homes having three, and
one home having four. Eighty-nine percent of these agreements are in the
general hospital closest to the nursing home and in the same county.
Laboratory Procedures and Nursing Services
In an effort to determine the sophistication of treatment offered by
the different nursing homes we asked questions about various laboratory
and nursing procedures. We do not mean to imply that all these procedures

20
should be done, but we wish to find out whether they are done. Some of
our consultants for example, felt that patients who need some of the
more sophisticated services would be more appropriately placed in a
hospital.
Laboratory Procedures
We asked whether certain laboratory procedures were performed routinely
4
and where the tests were done. Eighty-one percent of the homes said they
gave a routine diabetic urine test. Thirty-three percent gave a routine
urinalysis, twenty-six percent a routine hemoglobin test, sixteen percent
a white blood cell count and eighteen percent a complete blood cell count.
Thirty-one percent gave a routine chest film.
Eighty-four percent of the homes did the diabetic urine test in the
home. The largest percentage of homes had urinalysis for non-diabetic
patients done in a physician's office; twenty-five percent did the test
in their own facility and twenty-five percent had the test done in a
hospital. Forty-five percent did the hemoglobin test in the home; eighteen
percent of the homes had the hemoglobin test done in the hospital and
twenty-seven percent in a physician's office. Twenty-one percent of the
homes did white blood cell counts in the facility; forty-three percent of
the homes had white blood cell counts done in a hospital and thirty-six
percent in a physician's office. Thirteen percent of the homes did a
complete cell count in the facility, forty percent had a complete cell
count done in a hospital, and thirty-three percent in a physician's office.
Twenty-seven percent of the homes had white blood cell counts done in
another (unspecified) place. Fifty percent of the homes had chest films
Homes can have a test done in more than one place.

2 1
done in the hospitals. Seventy-seven percent had them done in the local
health department, twelve percent in a physician's office and eight per
cent did chest films in their own facility.
Nursing Services
We asked whether or not a home offered certain nursing services and
how many patients were receiving the service at present.
The percentage of patients in a home which were receiving a service
were grouped into four categories: l % - 2 5 % , 2 6 % - 5 0 % , 5 1 % - 7 5 % and 7 6 % - 1 0 0 %
(see Table 2 1 ) . The procedures are listed in the order of frequency --
the most common procedures first. For example, 6 6 7 > of the homes give
Temperature-Pulse-Respiration checks to 7 6 7 o - 1 0 0 7 o of their patients and
4 5 7 > give a tub bath to 7 6 7 o - 1 0 0 7 o of their patients. No home gives nasal
tube feedings, oxygen therapy, colostomy irrigation, IV fluids or
intermittant positive pressure respirator treatment to over 2 5 % of their
pat ients.
We asked what nursing services, if any, the homes wished they could
provide either to present patients or in order to admit new types of
patients. Fifty-three percent of the homes wanted no additional nursing
services. Thirty-one percent wanted physical therapy, eleven percent
wanted occupational therapy, four-tenths of a percent wanted recreation
activity, eight percent wanted IPPB, IPPR oxygen therapy and four percent
wanted speech therapy. One or two homes cited a need for various other
services such as bowel and bladder retraining, whirlpool treamtnets,
dental work and various lab tests.
The homes were asked what the major problems were keeping them from
providing the services they wished they could provide. Personnel was

/
Table 2 1 : Number And Percent Of Homes Giving Certain Nursing Services To An Indicated Percentage Of Their Patients
Percent Patients 17c - 2 5 7 o 2 6 7 - 5 0 7 . 5 1 7 - 7 5 7 . 7 6 7 - 1 0 0 7 c Total
Services
Temperature, Pulse, Respiration # 1 7 6 2 4 9 74 7= 2 3 . 0 8 . 1 2 . 7 6 6 . 2 1 0 0 . 0
Tub Bath * 1 2 8 2 0 3 3 7 3
1 6 . 4 1 1 . 0 2 7 . 4 4 5 . 2 ioo.q
Bed Positioning # 2 0 1 9 1 2 1 7 6 8
7 2 9 . 4 2 7 . 9 1 7 . 6 2 5 . 0 1 0 0 . 0
Exercises # 4 1 1 4 6 4 6 5
6 3 . 1 2 1 . 5 9 . 2 6 . 2 100.0
Urethral Catheter Irrigation # 4 9 1 2 0 0 6 1
8 0 . 3 1 9 . 7 0 . 0 0 . 0 1 0 0 . 0
Sterile Dressings # 5 9 0 0 1 6 0
9 8 . 3 0 . 0 0 . 0 1 . 7 1 0 0 . 0
Enema # 2 7 1 4 b 1 3 6 0
7. 4 5 . 0 2 3 . 3 1 0 . 0 2 1 . 7 1 0 0 . 0
Bowel and Bladder Retraining # 3 0 1 1 1 4 4 6
6 5 . 2 2 3 . 9 2 . 2 8 . 7 1 0 0 . 0
Nasal Tube Feedings # 3 7 0 0 0 3 7
% 1 0 0 . 0 0 . 0 0 . 0 G . 0 1 0 0 . 0
Oxygen Therapy # 1 6 0 0 0 1 6
1 0 0 . 0 0 . 0 0 . 0 0 . 0 1 0 0 . 0
Colostomy Irrigation # 1 5 0 0 0 1 5
7c 1 0 0 . 0 0 . 0 0 . 0 0 . 0 1 0 0 . 0
IV Fluids # 1 4 0 0 0 1 4
7c 1 0 0 . 0 0 . 0 0 . 0 0 . 0 1 0 0 . 0
IPPR # 1 3 0 0 0 1 3
% ; o o . 0 0 . 0 0 . 0 0 , 0 1 0 0 . 0

23
cited most frequently as a problem, then money, space, time and equipment
in that order.
Drugs
Most homes, eighty-one percent, obtain their drugs from the local
pharmacy. A few, thirteen percent, employ a full or part time pharmacist.
Four percent use more than one supplier and two percent get their drugs
from another (unspecified) place.
Food Service
Many homes (sixty-seven percent) have the services of a graduate of
an accredited program in nutrition or diet therapy. Twenty-one percent
of the homes have the services of a home economics graduate with a major
in foods and nutrition, and four percent use a food service company which
employs its own dietition. In 807o of the homes these trained dietitians
are consultants rather than regular employees. Eighty-seven percent of
the homes have a food service or kitchen supervisor in addition to or instead
of a consultant or employed dietitian or nutritionist.
Physical Therapy Program
Fifty-one percent of the homes have a physical therapy program.
Fourteen percent of these have a Registered Physical Therapist employed
full time, thirty-eight percent have a Registered Physical Therapist
employed part time. Seven percent have a position for a Registered
Physical Therapist which is presently vacant. Twenty-four percent contract
for direct service, seventeen percent use a public health consultant and
ten percent contract for teaching and/or consultation. Eighty-one percent
of the homes with a Physical Therapy Program have an employee designated
to assist patients with physical therapy, either in addition to or instead

24
of a Registered Physical Therapist. These employees were usually nursing
assistants or registered nurses. Some were licensed practical nurses.
Sixty-four percent of the homes with physical therapy programs have
a separate room for physical therapy. Selected physical therapy equipment
was divided into four categories: exercise, heat/cold, ambulation and
hydrotherapy. The percent of homes with physical therapy programs having
this equipment is listed below.
Physical Therapy Equipment
Percent of Homes Equipment
Exerc ise 62 Pulleys
55 We ights 43 Shoulder Wheel
Heat/Cold
74 Hot or cold packs 26 Diothermy
52 Infra-red lamp
Ambulat ion
95 Walkers
88 Canes/crutches 74 Parallel bars
Hydrotherapy
45 Whirlpool 33 Paraffin bath
12 Hubbard tank
Occupational Therapy, Recreational Activities, Religious Services, Social
Services, Volunteer Activities
Only sixteen percent of the homes have the services of an occupational
therapist. Approximately half of these homes have an occupational therapist
employed, the other half have an occupational therapist available on
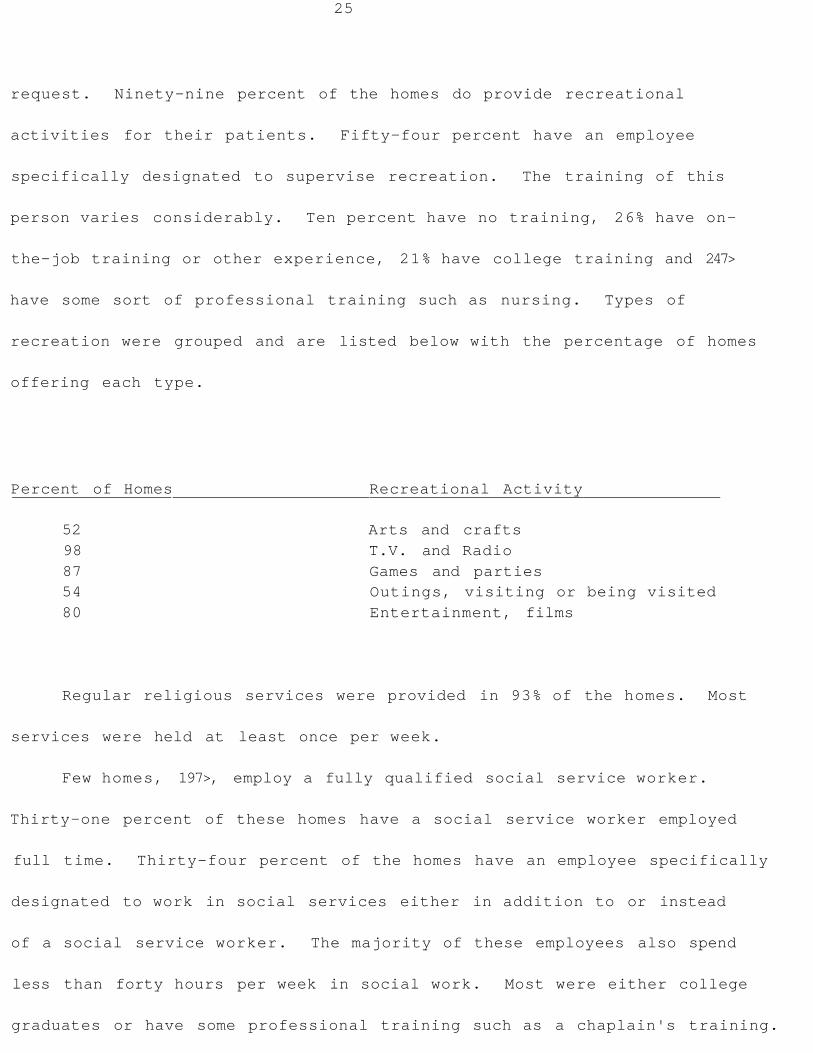
25
request. Ninety-nine percent of the homes do provide recreational
activities for their patients. Fifty-four percent have an employee
specifically designated to supervise recreation. The training of this
person varies considerably. Ten percent have no training, 26% have on-
the-job training or other experience, 21% have college training and 247>
have some sort of professional training such as nursing. Types of
recreation were grouped and are listed below with the percentage of homes
offering each type.
Percent of Homes Recreational Activity
52 Arts and crafts 98 T.V. and Radio 87 Games and parties 54 Outings, visiting or being visited 80 Entertainment, films
Regular religious services were provided in 93% of the homes. Most
services were held at least once per week.
Few homes, 197>, employ a fully qualified social service worker.
Thirty-one percent of these homes have a social service worker employed
full time. Thirty-four percent of the homes have an employee specifically
designated to work in social services either in addition to or instead
of a social service worker. The majority of these employees also spend
less than forty hours per week in social work. Most were either college
graduates or have some professional training such as a chaplain's training.
The majority of the social services employees work with the patients family.
Sixty-six percent of the homes use volunteers. Seventy-six percent
26
of the homes use the volunteers in recreation and social activities such
as arts and crafts, letter-writing, and shopping. Another 3 9 7 o of the
homes use the volunteers in personal attentions which the staff might
otherwise do such as providing fresh water, giving shampoos and feeding.
Thirty-three percent of the homes using volunteers have training programs
for the volunteers. Fifty-nine percent of the homes using volunteers
have an employee specifically designated to be in charge of volunteers.
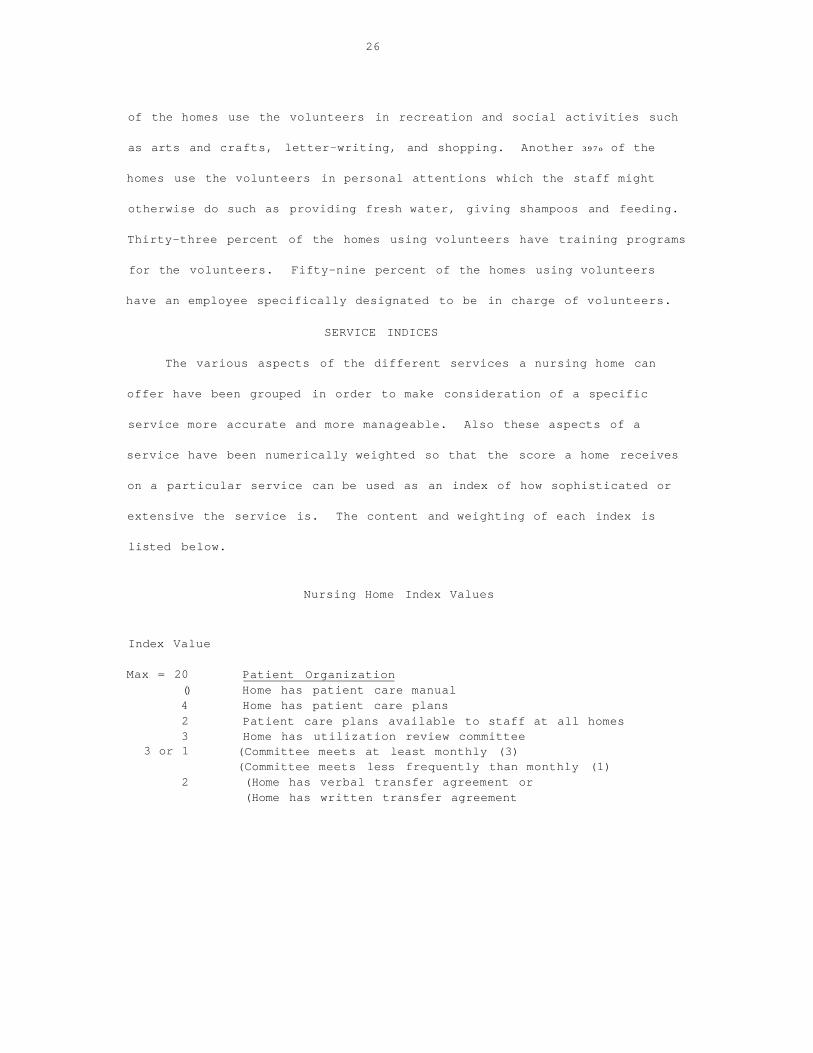
The various aspects of the different services a nursing home can
offer have been grouped in order to make consideration of a specific
service more accurate and more manageable. Also these aspects of a
service have been numerically weighted so that the score a home receives
on a particular service can be used as an index of how sophisticated or
extensive the service is. The content and weighting of each index is
listed below.
SERVICE INDICES
Nursing Home Index Values
Index Value
Max = 20 Patient Organization Home has patient care manual Home has patient care plans Patient care plans available to staff at all homes Home has utilization review committee (Committee meets at least monthly (3) (Committee meets less frequently than monthly (1) (Home has verbal transfer agreement or (Home has written transfer agreement
() 4 2 3
3 or 1
2

27
Nursing Home Index Values (continued)
Max = 26 Nursing Service 2 Home provides Temperature-Pulse-Respiration 2 Home provides range of motion exercises 2 Home provides tub bath or shower 2 Home provides application of sterile dressings or bandages 2 Home provides urethral catheter irrigation 2 Home provides Intravenous Fluids 2 Home provides nasal tube feeding 2 Home provides colostomy irrigation 2 Home provides oxygen therapy (non-emergency) 2 Home provides intermittant positive pressure respirator (IPPR) 2 Home provides enema 2 Home provides bed positioning 2 Home provides bowel and bladder retraining
Max = 6 Laboratory Score
Home routinely does (or has done): 1 Diabetic urine test 1 Urinalysis for non-diabetic patients 1 Hemoglobin test 1 White blood cell count 1 Complete blood cell count 1 Chest film
Max = 34 Food Service 2 or 3 Home has the services of a graduate of an Accredited
Program in Nutrition or Diet Therapy. (3) Home has the services of a Home Economics graduate with a major in foods and nutrition or the services of a food service company which employs its own dietitian. (2)
2 or 4 This person is a consultant (2). This person is a regular employee (4).
2 or 4 Number of hours per week this person works: 4-16 hours (2); 17-44 hours (4).
Duties of this person: 2 Menu planning 1 Orientation of new food service personnel 1 Training of food service personnel 1 Supervision of food service personnel 1 Participation in In-Service Education Programs for staff
members other than food service personnel 1 Talking with patients about food acceptance
1 Other duties
2 Home has a food service or kitchen supervisor in addition to or instead of a consultant or employed dietitian or nutrition!

28
Nursing Home Index Values (continued)
Max = 34 Food Service (continued)
1 or 4 Number of hours per week this person works:
1-38 hours (1); 40-66 hours (4).
Duties of this person:
1 Menu planning
1 Orientation of new food service personnel
1 Training of food service personnel
1 Supervision of food service personnel
1 Participation in In-Service Education Programs for staff
members other than food service personnel
1 Talking with patients about food acceptance
1 Purchasing
1 Other
Max = 34 Physical Therapy
Home has a Registered Physical Therapist:
5 Employed full time
3 Employed part time
1 Position which is presently vacant
1 Contract for direct service
1 Public health consultant
1 Contract for teaching and/or consultation
1 Hospital based
1 Other
2 In addition to or instead of a Physical Therapist, home
has an employee designated to assist patients with
physical therapy.
3 This employee(s) is a Registered Nurse
2 This employee(s) is a Licensed Practical Nurse
1 This employee(s) is a nursing assistant
3 Home has a separate room for Physical Therapy
Home has:
1 Hot or cold packs
1 Diothermy
1 Infra-red lamp
1 Walkers
1 Canes/Crutches
1 Parallel bars
1 Whirlpool
1 Paraffin bath
1 Hubbard tank

29
Nursing Home Index Values (continued)
Max = 46 Recreation
5 Home has services of an Occupational Therapist 2 Home provides recreational activities for its patients 5 Home has employee specifically designated to supervise
recreation
This person's training is: 1,2 or 3 High school or experience or on-job-training (1)
College (2)
Professional training (Registered Nurse, Licensed Practical Nurse, etc.) (3)
Home provides: 2 Arts and crafts 2 T.V. and radio 2 Games and parties 2 Outings, visiting or being visited 2 Entertainment, films
2 Home provides religious services 2 or 4 Religious services are held at least weekly (4)
Religious services are held less frequently than once a week (2)
2 Home uses volunteers
Volunteers do: 3 Recreation and social activities; arts and crafts, visiting,
letter writing, shopping, provide books and magazines 2 Personal attentions (things the staff might otherwise do)
2 Volunteers are students 3 Home has training program for volunteers 3 Home has employee specifically designated to be in charge
of volunteers.
Max - 23 Social Service
8 Home employs a fully qualified social service worker 1 or 2 Hours this person works: 1-25 hours (1); 26+ hours (2)
3 Home has employee specifically designated to work in social services either in addition to or instead of a social service worker.
1 or 3 Number of hours this person works: 1-20 hours (1);
20+ hours (3) 1,2 or 3 This person 1s training is on-the-job or high school (1);
college or post-college (2); professional training, social worker, chaplain (3)
2 Social service employee works with the patient's family.

30
The homes which had index scores in the top third of the index range
were considered according to their geographic location, the type of county
the home was in, the size of the home, and whether or not the home was
certified for participation in the Medicare program, and whether or not
it was a combination home.
Service Area
(See Table 22, page
There was not much consistency in variation among the percent of
homes in the upper third of the index ranges by Service Area. Service
Area IV, however, always had a higher percentage of homes in the top
third than the percentage of homes for the State as a whole.
One hundred percent of the homes in Service Area I, IV and V had
Patient Organization scores in the top third. Service Area II had the
lowest number of homes with high scores -- 6 8 . 4 7 . . .
One hundred percent of the homes in Service Area IV had high Nursing
Service Index scores. Ninety-five point eight percent of the homes in
Area II, 9 4 . 7 7 = in III and 9 0 . 9 7 , in VI also had high scores.
More homes, 4 0 . 0 7 , , in Service Area IV had scores in the top third
of the Laboratory Index than in any other Service Area. Service Areas
I and II were also high. Service Area V had the lowest number of homes --
1 3 . 3 7 o .
More homes, 8 7 . 5 7 , , in Service Area IV, had scores in the top third
of the Food Service Index than in any other Service Area. Service Area
I was also high with 8 3 . 3 7 , of its homes in the top third. These percents
were considerably above the other Service Areas; the percentage for the
State was only 5 3 . 8 7 , .

3 1
TABLE 22: NUMBER AND PERCENT OF HOMES IN UPPER THIRD OF SERVICE INDEX RANGE AND TOTAL
RESPONDING BY SERVICE AREA
Service Area I II III IV V VI Total
Patient Organization top 1/3 # 6 17 13 8 16 10 70
100. 0 73.9 68.4 100.0 100.0 90.9 84.3 Total # 6 23 19 8 16 11 83
7, 100. 0 100.0 100.0 100.0 100.0 100.0 100.0
Nursing Service top 1/3 # 6 23 18 8 12 10 77
7. 85. 7 95.8 94.7 100.0 75.0 90.9 90.6 Total # 7 24 19 8 16 11 85
7, 100. 0 100.0 100.0 100.0 100.0 100.0 100.0
Laboratory Services top 1/3 # 2 6 3 2 2 2 17
7, 33. 3 31.6 16.7 40.0 13.3 18.2 23.0 Total # 6 19 18 5 15 11 74
100. 0 100.0 100.0 100.0 100.0 100.0 100.0
Food Service top 1/3 # 5 11 8 7 7 5 43
7o 83. 3 47.8 50.0 87.5 43.8 45.4 53.8 Total # 6 23 16 8 16 11 80
7> 100. 0 100.0 100.0 100.0 100.0 100.0 100.0
Physical Therapy top 1/3 # 2 4 2 4 1 1 14
7o 50. 0 40.0 22.2 57.1 20.0 12.5 32.6
Total # 4 10 9 7 5 8 43
% 100. 0 100.0 100.0 100.0 100.0 100.0 100.0
Recreation top 1/3 # 1 10 5 3 7 5 31
7 . 14 .3 43.5 26.3 37.5 43.8 45.4 36.9
Total # 7 23 19 8 16 11 84
7o 100. 0 100.0 100.0 100.0 100.0 100.0 100.0
Social Service top 1/3 # 0 4 2 2 0 0 8
7, 0 36,4 28.6 28.6 0 0 21.6
Total # 3 11 7 7 6 3 37
100. 0 100.0 100.0 100.0 100.0 100.0 100.0

32
With the Physical Therapy Index, Service Area IV once again had more
homes than any other Service Area in the top third, 57.1%, Service Area
I and II were also high, with 50.07, and 40.07, respectively. Service Area
VI had the lowest percent 12.57,.
Service Area VI had the greatest percent of homes in the top third,
45.47,, in the Recreation Index. Service Area V and II were also high. The
Service Area with the lowest percent of homes in the top third was Service
Area I.
Only eight homes had scores in the top third of the Social Service
Indices and these were in Areas II, III and IV. The other Areas had no
homes in the top third.
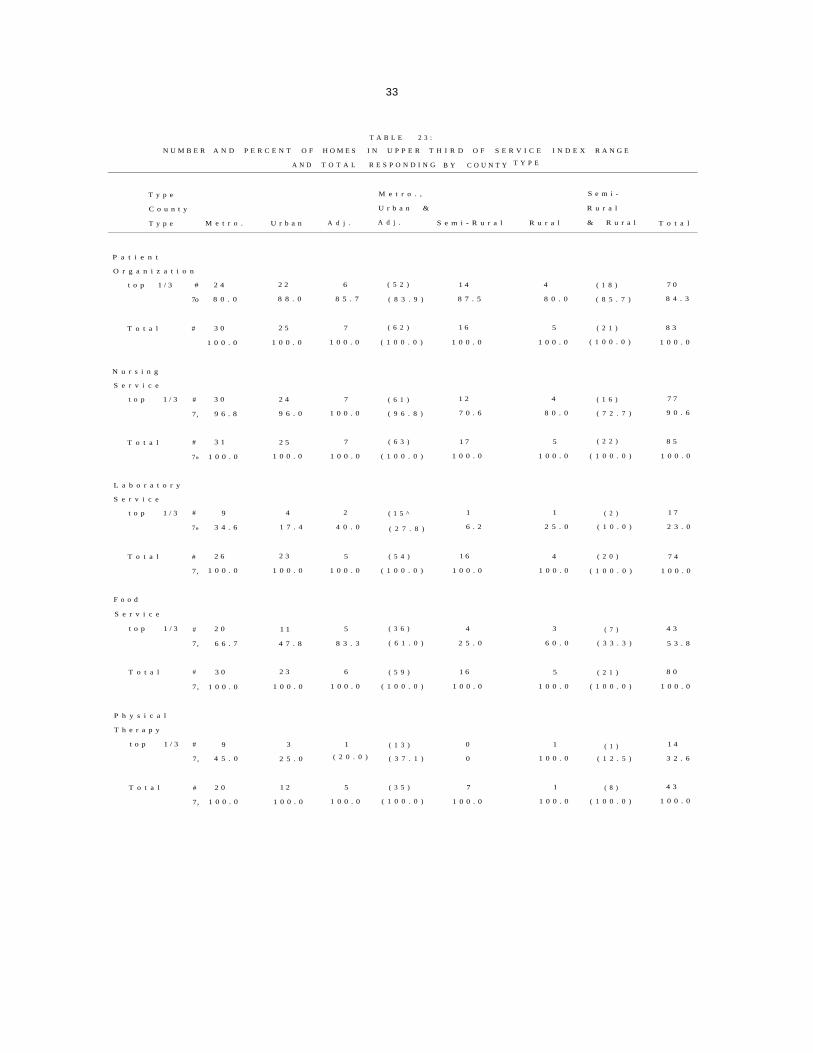
County Type
(See Table 23, page
In all cases but one, more homes in the Metropolitan, Urban and
Adjacent counties are in the top third of the index range than are in the
Semi-rural and Rural counties.
The Patient Organization Index is this exception -- 83.97. of the homes
in the Metropolitan, Urban and Adjacent counties are in the top third and
85.77> are in the Semi-rural and Rural.
Ninety-six point eight percent of the homes in the urban counties
have scores in the top third in the Nursing Service Index whereas the rural
counties have only 72.77, of homes in the upper third. For the Laboratory
Service Index the urban counties had 27.87, of their homes in the top third
as compared to 10.07, of the rural counties. For Food Service the urban
counties 1 percent of homes was 61.07,; the rural, 33.37,. For Physical
Therapy, the urban counties 1 percent of homes was 37.17,; rural, 12.5%.
33
T A B L E 2 3 :
N U M B E R A N D P E R C E N T O F H O M E S I N U P P E R T H I R D O F S E R V I C E I N D E X R A N G E
A N D T O T A L R E S P O N D I N G B Y C O U N T Y T Y P E
T y p e
C o u n t y
T y p e M e t r o . U r b a n A d j .
M e t r o . ,
U r b a n &
A d j . S e m i - R u r a l R u r a l
S e m i -
R u r a l
& R u r a l T o t a l
P a t i e n t
O r g a n i z a t i o n
t o p 1 / 3 #
7o
2 4
8 0 . 0
2 2
8 8 . 0
6
8 5 . 7
( 5 2 )
( 8 3 . 9 )
1 4
8 7 . 5
4
8 0 . 0
( 1 8 )
( 8 5 . 7 )
7 0
8 4 . 3
T o t a l # 3 0
1 0 0 . 0
2 5
1 0 0 . 0
7
1 0 0 . 0
( 6 2 )
( 1 0 0 . 0 )
1 6
1 0 0 . 0
5
1 0 0 . 0
( 2 1 )
( 1 0 0 . 0 )
8 3
1 0 0 . 0
N u r s i n g
S e r v i c e
t o p 1 / 3 #
7,
3 0
9 6 . 8
2 4
9 6 . 0
7
1 0 0 . 0
( 6 1 )
( 9 6 . 8 )
1 2
7 0 . 6
4
8 0 . 0
( 1 6 )
( 7 2 . 7 )
7 7
9 0 . 6
T o t a l #
7»
3 1
1 0 0 . 0
2 5
1 0 0 . 0
7
1 0 0 . 0
( 6 3 )
( 1 0 0 . 0 )
1 7
1 0 0 . 0
5
1 0 0 . 0
( 2 2 )
( 1 0 0 . 0 )
8 5
1 0 0 . 0
L a b o r a t o r y
S e r v i c e
t o p 1 / 3 #
7»
9
3 4 . 6
4
1 7 . 4
2
4 0 . 0
( 1 5 ^
( 2 7 . 8 )
1
6 . 2
1
2 5 . 0
( 2 )
( 1 0 . 0 )
1 7
2 3 . 0
T o t a l #
7,
2 6
1 0 0 . 0
2 3
1 0 0 . 0
5
1 0 0 . 0
( 5 4 )
( 1 0 0 . 0 )
1 6
1 0 0 . 0
4
1 0 0 . 0
( 2 0 )
( 1 0 0 . 0 )
7 4
1 0 0 . 0
F o o d
S e r v i c e
t o p 1 / 3 #
7,
2 0
6 6 . 7
1 1
4 7 . 8
5
8 3 . 3
( 3 6 )
( 6 1 . 0 )
4
2 5 . 0
3
6 0 . 0
( 7 )
( 3 3 . 3 )
4 3
5 3 . 8
T o t a l #
7,
3 0
1 0 0 . 0
2 3
1 0 0 . 0
6
1 0 0 . 0
( 5 9 )
( 1 0 0 . 0 )
1 6
1 0 0 . 0
5
1 0 0 . 0
( 2 1 )
( 1 0 0 . 0 )
8 0
1 0 0 . 0
P h y s i c a l
T h e r a p y
t o p 1 / 3 #
7,
9
4 5 . 0
3
2 5 . 0
1
( 2 0 . 0 )
( 1 3 )
( 3 7 . 1 )
0
0
1
1 0 0 . 0
( 1 )
( 1 2 . 5 )
1 4
3 2 . 6
T o t a l #
7,
2 0
1 0 0 . 0
1 2
1 0 0 . 0
5
1 0 0 . 0
( 3 5 )
( 1 0 0 . 0 )
7
1 0 0 . 0
1
1 0 0 . 0
( 8 )
( 1 0 0 . 0 )
4 3
1 0 0 . 0

34
TABLE 23: NUMBER AND PERCENT OF HOMES IN UPPER THIRD OF SERVICE INDEX RANGE
AND TOTAL RESPONDING BY COUNTY (CONTINUED)
Type County Type Metro.
Metro., Urban &
Urban Adj. Adj. Semi-Rural Rural
Semi-Rural & Rural Total
Recreation top 1/3 # 16
% 51.6 33.3 (24) (38.7)
7 41.2
(7) (31.8)
31
36.9
Total # 31 24 7 (62) 17 % 100.0 100.0 100.0 (100.0) 100.0
5 (22) 84 100.0 (100.0) 100.0
Social Services
top 1/3 5 25.0
1 11.1
1 33.3
(7) (21.9)
0 0
(0) (0.0)
8 21.6
Total # 2 0 9 3 (32) 4 7o 100.0 100.0 100.0 (100.0) 100.0
1 100.0
(5) (100.0)
37 100.0

3 5
For the Recreation Index the urban percent was 3 8 . 7 % , rural, 3 1 . 8 7 o . For
Social Services the urban percent was 2 1 . 9 % ; the rural counties had no
homes in the top third.
Size
(See Table 2 4 , page
The percentage of homes in the upper third of the indices increases
as the number of beds in the home increases, with the exception of one
index.
The percent of homes in the upper third of the Patient Organization
Index increases from 5 5 . 6 7 , in the lowest size category to 1 0 0 . 0 % in the
largest size. The percent of homes in the Nursing Service Index top
third increases from 6 3 . 6 7 , to 1 0 0 . 0 7 , . The percent of homes in the top
third of the Laboratory Service Index increases from 1 2 . 5 7 , to 3 3 . 3 7 , . The
increase in the Food Service Index is from 2 5 . 0 7 , to 1 0 0 . 0 7 , ; the Physical
Therapy from 0 . 0 to 1 0 0 . 0 % ; and in Recreation from 3 0 . 0 % to 7 5 . 0 % .
The percentage of homes in the top third of the Social Service Index
does not vary directly with increase in size. However, there were only
eight homes in the top third in this index.
Med icare
(See Table 2 5 , page
More homes certified for participation in the Medicare program scored
higher on all the indices than homes which were not certified for
Med icare.
With the Patient Organization Index this was to be expected since to
qualify for Medicare certification a home has to have patient care plans
for at least those patients who are receiving title XVIII benefits, a

36
TABLE 24: NUMBER AND PERCENT OF HOMES IN UPPER THIRD OF SERVICE AREA INDEX RANGE AND TOTAL
RESPONDING BY SIZE OF HOME
Size 1-25 26-50 51-100 101-150 151-300 Total
Patient Organiza-tion
top 1/3 # 5 21 30 10 4 70 % 55.6 77. 8 93. 8 90.0 100.0 84. 3
Total # 9 27 32 11 4 83 100.0 100. 0 100. 0 100.0 100.0 100. 0
Nursing Service top 1/3 # 7 24 32 10 4 77
7, 63.6 85. 7 100. 0 100.0 100.0 90. <?
Total # 11 28 32 10 4 85 7, 100.0 100. 0 100. 0 100.0 100.0 100. 0
Laboratory Service
top 1/3 # 1 5 7 3 1 17 7o 12.5 20. 8 23. 3 33.3 33.3 23. 0
Total # 8 24 30 9 3 74 7, 100.0 100. 0 100. 0 100.0 100.0 100. 0
Food Services top 1/3 # 2 8 21 8 4 43
% 25.0 30.8 67.7 72.7 100.0 53.8 Total # 8 26 31 11 4 80
% 100.0 100.0 100.0 100.0 100.0 100.0
Physical Therapy top 1/3
Total
#
7,
#
7o
0 0 3
100.0
1 11.1 9
100.0
5 29.4 17
100.0
4 40.0 10
100.0
4 100.0 4
100.0
14 32.6 43 100.0
Recreation top 1/3
Total
#
7»
#
7=
3 30.0 10 100.0
29.6 27 100.0
10 31.2 32 100.0
7 63.6 11
100.0
3 75.0 4
100.0
31 36.9 84 100.0
top 1/3 Social Services
# 7,
Total # 7o
0 0 2
100.0
4 44.4 9
100.0
0 0 13
100.0
3 33.3 9
100.0
1 25.0 4
100.0
21.6 37 100.0

37
Table 25: Number and Percent of Homes in Upper Third Of Service Index Range and Total Responding By Medicare Certified
Medicare Yes No Total
Patient Organization top 1/3 # 33 37 70
% 97.0 75.5 84.3 Total # 34 49 83
7, 100.0 100.0 100.0
Nursing Service top 1/3 # 32 45 77
% 97.0 86.5 90.6 Total # 33 52 85
7. 100.0 100.0 100.0
Laboratory Service top 1/3 # 8 9 17
7, 29.6 19.1 23.0 Total # 27 47 74
7= 100.0 100.0 100.0
Food Service top 1/3 # 24 19 43
% 70.6 41.3 53.8 Total # 34 46 80
7, 100.0 100.0 100.0
Physical Therapy top 1/3 # 11 3 14
7. 44.0 16.7 32.6 Total # 25 18 43
7o 100.0 100.0 100.0
Recreat ion top 1/3 # 16 15 31
% 47.0 30.0 36.9 Total # 34 50 84
7o 100.0 100.0 100.0
Social Services top 1/3 # 6 2 8
7o 26.1 14.3 21.6 Total # 23 14 37
7. 100.0 100.0 100.0

3 8
utilization review plan, and a written transfer agreement with a hospital
close enough to the home to make the transfer of patients feasible.
Ninety-seven percent of the homes which were Medicare certified had scores
in the top third of the Patient Organization Index as opposed to 7 5 . 5 %
of those which were not certified.
Ninety-seven percent of the Medicare homes scored high on the Nursing
Service Index as opposed to 8 6 . 5 7 o for non-Medicare homes.1' For Laboratory
Service the percent of Medicare homes was 2 9 . 6 7 , ; non-Medicare, 1 9 . 1 7 , ;
Food Service, 7 0 . 6 7 , to 4 1 . 3 7 , ; Physical Therapy, 4 4 . 0 7 , to 1 6 . 7 7 . ; '
Recreation, 4 7 . 0 7 . to 3 0 . 0 7 ; and Social Services, 1 6 . 2 7 . to 5 . 4 7 . .
Combination Homes
(See Table 2 6 , page
The nursing home section of the combination homes in general did not
score as high as the nursing homes which were not in combination with a
home for the aged.
On the Patient Organization Index, 7 6 . 7 7 . of the combination homes
scored in the top third in contrast to 8 8 . 7 7 . of the non-combination homes.
With Nursing Service 8 7 . 9 7 . of the combination homes scored in the top
third whereas 9 2 . 3 7 , of the non-combination homes scored in the top third.
For Food Service the percentage of combination homes was 5 0 . 0 7 . as compared
to 5 6 . 0 7 . ; Physical Therapy, 2 8 . 6 7 . as compared to 3 4 . 5 7 , ; and Social
Service 1 7 . 6 7 , as compared to 2 5 . 0 7 . .
For Laboratory Service and Recreation a higher percent of combination
homes than non-combination homes scored in the top third. For the
Laboratory Service Index 3 1 . 0 7 , of the combination homes were in the top
third as opposed to 1 7 . 8 7 . of the non-combination homes. For Recreation

39
Table 26: Number and Percent Of Homes In Upper Third Of Service Index Range ! and Total Responding By Combination Home
Combination Yes No Total
Patient Organization top 1/3 # 23 47 70
% 76.7 88.7 84.3 Total # 30 53 83
7. 100.0 100.0 100.0
Nursing Service top 1/3 # 29 48 77
7 . 87.9 92.3 90.6 Total # 33 52 85
% 100.0 100.0 100.0
Laboratory Service top 1/3 # 9 8 17
7o 31.0 17.8 23.0 Total # 29 45 74
7o 100.0 100.0 100.0
Food Service top 1/3 # 15 28 43
7o 50.0 56.0 53.8 Total # 30 50 80
7o 100.0 100.0 100.0
Physical Therapy top 1/3 # 4 10 14
7= 28.6 34.5 32.6 Total # 14 29 43
100.0 100.0 100.0
Recreation top 1/3 # 15 16 31
48.4 30.2 36.9 Total # 31 53 84
7o 100.0 100.0 100.0
Social Service top 1/3 # 3 5 8
7 , 17.6 25.0 21.6 Total # 17 20 37
7o 100.0 100.0 100.0

40
48.47 of the combination homes had high scores as opposed to 30.27, of
the non-combination homes.
STAFFING
Physicians and Dentists
Phys ic ians
Sixty-six percent of the homes have one physician who sees most of
their patients. In these homes this physician cares for an average of
thirty-two patients. In all homes an average of ten different physicians
care for patients in the home. Several homes have over thirty different
physicians attending their patients.
Thirty-four percent of the physicians come routinely without a
reminder from the nursing home. Fifty-nine percent come when called.
Nine-tenths of a percent will make some other arrangment for care, such
as having the patient come to the doctor's office. Six percent will not
always come when called and make no other arrangements.
Eighteen homes had one or more physicians who would not always come
when called. For most of these homes physicians who would not always
come represented under 2 6 7 , of the total number of physicians serving
their patients. For two homes, however, physicians who would not always
come represented 5 1 7 , or more of their physicians.
Interesting enough, fourteen of the eighteen homes which had one or
more physicians who would not always come when called had a high Nursing
Service Index score. Also fourteen of these were in Metropolitan and
Urban counties.
Eighty-seven percent of the homes had at least one patient visit an
eye specialist and forty-nine percent had at least one patient visit a

41
hearing specialist in the past year.
Dent ists
Seven percent of the homes have a dentist come on a regular basis,
fifty-four percent for emergency care only and twenty percent have a
dentist come for restorative care.
Nursing Service
The table below shows the ratio of patients to nursing staff, the
percentage of budgeted vacancies of the total in the positions, and the
percentage needed in addition to budgeted vacancies for the State as a
whole. Full time equivalents are used in the personnel categories. The
more highly trained personnel, the Registered Nurses, are in the shortest
supply in the nursing homes. There are more patients per Registered
Nurse and a higher percentage of budgeted vacancies for the Registered
Nurse than for the Licensed Practical Nurse or nursing assistants. The
number of patients per Licensed Practical Nurse is not much lower than
the number of patients to Registered Nurses, however. Also, if the
number of budgeted vacancies is added to the number needed in addition
to vacancies, the resulting percentage is a little higher for Licensed
Practical Nurses than for Registered Nurses.
The number of patients per nursing assistant is considerably lower
than that for the nurses. Ther percentage of nursing assistant budgeted
vacancies combined with additional need is 6.77.,.
In order to consider the relationships between nursing staffing and
other variables the homes were grouped according to their patient/nurse
ratio into four categories. Ther percent of homes in each of these
categories for the State as a whole is on Table 27.

42
Nursing Service: Personnel and Needs
Patients/Personnel Ratio 7. Budgeted Vacancies
Percent Needed In Addition to Budgeted Vacancies
Registered Nurses 14.6/1
Licensed Practical Nurses
Nurs ing Ass istants
14.5/1
3.1/1
10.2%
9.67.
4.27.
1.37.
3.17.
2 . 5 7 .
The largest percent of homes have between 10 and 20 patients per
Registered Nurse and per Licensed Practical Nurse. Eight percent more
homes have one Licensed Practical Nurse for every 1-10 patients than have
one Registered Nurse per 1-10 patients. When the number of full time
equivalent Registered Nurses and Licensed Practical Nurses are combined,
757. of the homes have one nurse for every 1 to 10 patients.
When the budgeted vacancies are added to the number of nurses employed
the percent of homes with one Registered Nurse for every 1-10 patients
increases by 67. as does the percent of homes with one Licensed Practical
Nurse for every 1-10 patients.-
The ratios of patients to Registered Nurses and to Licensed Practical
Nurses were considered by Service Area, County Type, Size, Medicare
Certification and Combination Home.
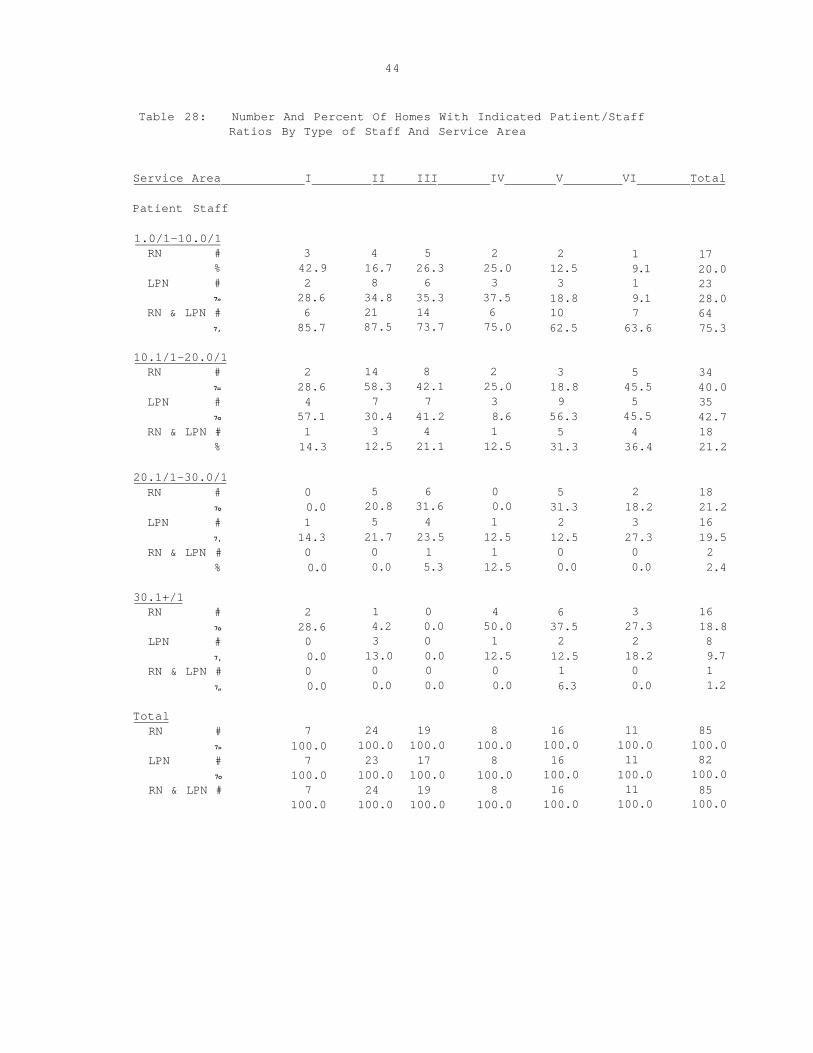
Service Area
(See Table 28, page
Service Area I has the highest percent, 42 . 97., of homes with only
1-10 patients per Registered Nurse. Service Area II, III and IV have the

43
Table 27: Number and Percent Of Homes With Indicated Patient/Staff Ratios By Type of Staff
Number of Patients/ Staff 1.0/1-10.0/1 10.1/1-20.0/1 20.1/1-30.0/1 30.1/1+ Total
RN's # of Homes 7o of Homes
17 20.0
34 40.0
18 16 85 21.2 18.8 100.0
LPN's # of Homes 7o of Homes
23 28.0
35 42.7
16 19.5
8 82 9.8 100.0
RN's & LPN's # of Homes 7. of Homes
64 75.3
18 21.2
2 2.4
1 85 1.2 100.0
RN's Employed + Vacancies # of Homes % of Homes
22 25.9
35 41.2
15 17.6
13 85 15.3 100.0
LPN's Employed + Vacancies # of Homes 7. of Homes
28 33.7
31 37.3
17 20.5
7 83 8.4 100.0
44
Table 28: Number And Percent Of Homes With Indicated Patient/Staff Ratios By Type of Staff And Service Area
Service Area I II III IV V VI Total
Patient Staff
1.0/1-10.0/1 RN # 3
% 42.9 LPN # 2
7» 28.6 RN & LPN # 6
7, 85.7
10.1/1-20.0/1 RN # 2
7= 28.6 LPN # 4
7o 57.1 RN & LPN # 1
% 14.3
20.1/1-30.0/1 RN # 0
7o 0.0 LPN # 1
7, 14.3 RN & LPN # 0
% 0.0
30.1+/1 RN # 2
7o 28.6 LPN # 0
7, 0.0 RN & LPN # 0
7„ 0.0
Total RN # 7
7» 100.0 LPN # 7
7o 100.0 RN & LPN # 7
100.0
4 5 2 16.7 26.3 25.0 8 6 3
34.8 35.3 37.5 21 14 6 87.5 73.7 75.0
14 8 2 58.3 42.1 25.0 7 7 3
30.4 41.2 8.6 3 4 1 12.5 21.1 12.5
5 6 0 20.8 31.6 0.0 5 4 1 21.7 23.5 12.5 0 1 1 0.0 5.3 12.5
1 0 4 4.2 0.0 50.0 3 0 1
13.0 0.0 12.5 0 0 0 0.0 0.0 0.0
24 19 8 100.0 100.0 100.0 23 17 8
100.0 100.0 100.0 24 19 8
100.0 100.0 100.0
2 1 17 12.5 9.1 20.0 3 1 23
18.8 9.1 28.0 10 7 64 62.5 63.6 75.3
3 5 34 18.8 45.5 40.0 9 5 35
56.3 45.5 42.7 5 4 18
31.3 36.4 21.2
5 2 18 31.3 18.2 21.2 2 3 16
12.5 27.3 19.5 0 0 2 0.0 0.0 2.4
6 3 16 37.5 27.3 18.8 2 2 8 12.5 18.2 9.7 1 0 1 6.3 0.0 1.2
16 11 85 100.0 100.0 100.0 16 11 82
100.0 100.0 100.0 16 11 85
100.0 100.0 100.0

45
highest percentage of homes with 1-10 patients per Licensed Practical
Nurse, 34.87=., 35.37, and 37.57. respectively. When the number of Registered
Nurses and Licensed Practical Nurses is combined, Service Area I and II
have the highest percent of homes with 1-10 patients per nurse with 85.77.
and 87.57, respectively.
Service Areas IV, V and VI have the highest percent of homes with more
than twenty patients per Registered Nurse with 507, for Service Area IV,
687, for Service Area V, and 457, for Service Area VI. Service Area VI
has the highest percent of homes, approximately 457.,with over twenty
patients per Licensed Practical Nurse.
County Type
(See Table 29, page
A higher percentage of homes in the Metropolitan and Urban counties
have 1-10 patients per Registered Nurse than in the Adjacent or Semi-
Rural and Rural counties. Approximately 647, from the urban counties,
577, from the semi-rural, and 407, from the rural have from 1-20 patients
per Registered Nurse.
A higher percent of homes in the metropolitan and urban counties
also have 1-10 patients per Licensed Practical Nurse than in the adjacent
or semi-rural and rural counties. However, when the 1-10, 10-20 patients
per Licensed Practical Nurse ratios are combined, the decrease in percent
of homes from metropolitan to rural is not consistent as it was for the
Registered Nurses. The metropolitan counties have approximately 717. of
their homes in the 1-20 patients per Licensed Practical Nurse category;
urban, 607,; adjacent, 1007,; semi-rural, 637,; and rural, 1007..

46
Table 29: Number and Percent Of Homes With Indicated Patient/Staff Ratios By Type Of Staff and By County Type
County Type Metro- Ad- Semi-politan Urban jacent Rural Rural Total
Patient/Staff
1.0/1-10.0/1 RN #
7.
LPN # 7.
RN & LPN #
7.
10.1/1-20.0/1 RN #
7o
LPN # 7„
RN & LPN # 7.
20.1/1-30.0/1 RN #
7»
LPN # 7.
RN & LPN # 7o
30.1+/1 RN #
7o
LPN # 7»
RN & LPN # 7»
8 6 0 3 0 17 25.8 24.0 0.0 17.6 0.0 20.0 11 7 1 3 1 23 35.5 30.4 14.3 18.8 20.0 28.0 26 19 6 9 4 64 83.9 76.0 85.7 52.9 80.0 75.3
13 10 4 5 2 34 41.9 40.0 57.1 29.4 40.0 40.0 11 7 6 7 4 35 35.5 30.4 85.7 43.8 80.0 42.7 5 5 1 6 1 18 16.1 20.0 14.3 35.3 20.0 21.2
7 5 0 5 1 18 22.6 20.0 0.0 29.4 20.0 21.2
8 4 0 4 0 16 25.8 17.4 0.0 25.0 0.0 19.5 0 0 0 2 0 2 0.0 0.0 0.0 11.8 0.0 2.4
3 4 3 4 2 16 9.7 • 16.0 42.8 23.5 40.0 18.8 1 5 0 2 0 8 3.2 21.7 0.0 12.5 0.0 9.8 0 1 0 0 0 1 0.0 4.0 0.0 0.0 0.0 1.2
Total RN
LPN
#
7»
#
RN & LPN # 7,
31 100.0 31 100.0 31
100.0
25 100.0 23
100.0 25
100.0
7 100.0
7 100.0
7 100.0
17 100.0 16
100.0 17
100.0
5 100.0 5
100.0 5
100.0
85 100.0 82 100.0 85
100.0

47
S ize
To some extent, of course, this is a function of their simply being smaller.
(See Table 30, page
Interestingly enough, the homes with the smallest number of beds
(1-25) and homes with the largest number of beds (151-300) have the
smallest number of patients per Registered Nurse and per Licensed Practical
Nurse. In the 1-25 bed category, 45.57, of the homes have 1-10 patients
per Registered Nurse and 55.67. have 1-10 patients per Licensed Practical
Nurse.However, when Registered Nurses and Licensed Practical Nurses
are combined the percentage of the smaller homes (1-25 beds) in the 1-10
patients per Registered Nurse and Licensed Practical Nurse ratio is a
little lower than the percentage for the State. In the 151-300 bed
category, 50.07. of the homes have 1-10 patients per Registered Nurse and
75.07, have 1-10 patients per Licensed Practical Nurse.
Medicare
(See Table 31, page
A higher percentage of Medicare Certified homes are in the 1-10
patients per Registered Nurse category than non-Medicare homes, 24.27,
as compared to 17.37,. However, a higher percentage of non-Medicare
homes (32.77,) are in the 1-10 patients per Licensed Practical Nurse
category than Medicare homes (21.27,).
A higher percentage of Medicare Certified homes are in the 10-20
patients per Registered Nurse category and in the 10-20 patients per
Licensed Practical Nurse category than non-Medicare homes.

48
Table 30: Number And Percent Of Homes With Indicated Patient/Staff Ratios By Type of Staff and By Size
Size 1-25 26-50 51-100 101- 150 151-300 Total
Patient/Staff
1.0/1-10.0/1 RN # 5 3 5 2 2 17
% 45.5 10.7 15.6 20. 0 50.0 20.0 LPN # 5 12 2 1 3 23
7. 55.6 44.4 6.3 10. 0 75.0 28.0 RN 6* LPN # 8 24 20 8 4 64
7o 72.7 85.7 62.5 80. 0 100.0 75.3
10.1/1-20.0/1 RN #
7.
LPN # 7o
RN & LPN # 7
4 36.4 1
11.1 2
18.2
lb 57. 9
33. 4
14.
25.0 20 62.5 10 31.3
50.0 4
40.0 2
20.0
1 25.0 1
25.0 0 0.0
34 40.0 35 42.7 18 21.2
20.1/1-30.0/1 RN
LPN
# 7o
#
7o
RN & LPN # 7=
2 18.2 3
33.3 1 9.1
5 17.9 4 14.8 0 0.0
8 25.0 6 18.8 1 3.1
2 20.0 3
30.0 0 0.0
1 25.0 0 0.0 0 0.0
18 21.2 16 19.5 2 2.4
30.1+/1 RN # 0 4 11 1 0 16
7o 0.0 . 14.3 34 .4 10.0 0.0 18.8 LPN # 0 2 4 2 0 8
7» 0.0 7.4 12 .5 20.0 0.0 9.8 RN & LPN # 0 0 1 0 0 1
7. 0.0 0.0 3 .1 0.0 0.0 1.2
Total RN # 11 28 32 10 4 85
100.0 100.0 100 .0 100.0 100.0 100.0 LPN # 9 27 32 10 4 82
7« 100.0 100.0 100 .0 100.0 100.0 100.0 RN & LPN # 11 28 32 10 4 85
7, 100.0 100.0 100 .0 100.0 100.0 100.0

49
Table 31: Number And Percent Of Homes With Indicated Patient/Staff Ratios By Type of Staff And By Medicare Certified
Medicare Certified Yes No Total
8 9 17 24.2 17.3 20.0 7 16 23
21.2 32.7 28.0 28 36 64 84.8 69.2 75.3
14 20 34 42.4 38.5 40.0 18 17 35 54.5 34.7 42.7 5 13 18 15.2 25.0 21.2
6 12 18 18.2 23.1 21.2 4 12 16 12.1 24.5 19.5 0 2 2 0.0 3.8 2.4
5 11 16 15.2 21.2 18.8 4 4 8 12.1 8.2 9.8 0 1 1 0.0 1.9 1.2
33 52 85 100.0 100.0 100.0 33 49 82
100.0 100.0 100.0 33 52 85 100.0 100.0 100.0
Patient/Staff
1.0/1-10.0/1 RN #
% LPN #
7=
RN & LPN # %
10.1/1-20.0/1 RN #
% LPN #
7=
RN & LPN # 7,
20.1/1-30.0/1 RN #
7o
LPN # 7o
RN & LPN # 7=
30.1+/1 RN #
7o
LPN # %
RN & LPN # 7o
Total RN #
% LPN #
7, RN & LPN #
7=

5 0
Considering the ratio of patients to Registered Nurses and Licensed
Practical Nurses combined, 8 4 . 8 % of the Medicare homes are in the 1 - 1 0
patients per Registered Nurse and Licensed Practical Nurse category as
compared to 6 9 . 2 7 o of the non-Medicare homes. In the 1 0 - 2 0 patients per
Registered Nurse and Licensed Practical Nurse category non-Medicare
homes have a higher percentage, 2 5 . 0 7 , , as compared to 1 5 . 2 7 , for Medicare
homes.
Combination Homes
(See Table 3 2 , page
The combination homes have a lower percentage of homes with 1 - 1 0
patients per Registered Nurse than the non-combination homes. However,
the combination homes have a higher percentage of homes with 1 0 - 2 0
patients per Licensed Practical Nurse.
STAFF EDUCATION
On-The-Job, Orientation and In-Service
Seventy percent of the homes had planned and regularly scheduled
orientation programs. Forty-five percent of the homes with orientation
programs said the programs were for all personnel or for all new
personnel. About thirty-eight percent specified that the programs were
for the nursing staff.
Approximately eighty-three percent of the homes have on-the-job
training. Of the homes offering on-the-job training, 5 . 3 % offer training
to the nursing staff, 2 4 7 , to the dietary staff and 1 8 7 , to the housekeeping
staff; 4 1 7 , said that on-the-job training was offered to all the staff.
Sixty-seven percent of the homes have planned and regularly scheduled
in-service education programs. Fifty-four percent of those with in-service

51
Table 32: Number And Percent Of Homes With Indicated Patient/Staff Ratios By Type Of Staff And By Combination Home
Combination Home Yes No Total
Patient/Staff
1.0/1-10.0/1 RN # 6 11 17
% 18.2 21.2 20.0 LPN # 10 13 23
7. 31.3 26.0 28.0 RN & LPN # 25 39 64
% 75.8 75.0 75.3 10.1/1-20.0/1 RN # 15 19 34
7, 45.5 36.5 40.0 LPN # 13 22 35
7o 40.6 44.0 42.7 RN & LPN # 7 11 18
7o 21.2 21.2 21.2
20.1/1-30.0/1 RN # 9 9 18
7= 27.3 17.3 21.2 LPN # 7 9 16
7o 21.9 18.0 19.5 RN & LPN # 0 2 2
7o 0.0 2.4 2.4
30.1+/1 RN # 3 13 16
7. 9.1 25.0 18.8 LPN # 2 6 8
7, 6.2 12.0 9.8 RN & LPN # 1 0 1
7o 3.0 0.0 1.2
Total RN # 33 52 85
7o 100.0 100.0 100.0 LPN # 32 50 82
7o 100.0 100.0 100.0 RN & LPN # 33 52 85
7> 100.0 100.0 100.0

5 2
education specified that they had programs for the nursing staff, 1 8 7 ,
had programs for the dietary staff and 3 9 7 o said they had programs for
all personnel. Seventy-eight percent of the homes with in-service
education have programs at least once per month. The programs are
available to all three shifts in 9 5 7 . of the homes. Some homes have
separate directors of in-service education for different programs. The
director or the assistant director of nursing was named most often as
the director cf the in-service education program. Some homes had a director
from outside the home such as someone from the local health department;
others had a professional person within the home other than a nurse, and
some homes had the administrator as the director of in-service education.
Many problems were reported as preventing the nursing homes from
having as extensive education programs in the home as they would like
to have.^ The problem mentioned by the most homes ( 4 0 7 . ) was that of time
and scheduling of programs. Twenty-five percent of the homes said that a
lack of competent teachers was a major problem. Seventeen percent said
that lack of money was a problem; 1 7 7 , said that staff complications such
as no interest, absenteeism and a high turnover were problems. Ten
percent cited a lack of materials, literature and equipment and 1 0 7 , cited
no facilities for the programs as problems.
Continuing Education
A majority of homes ( 8 3 7 > ) sent at least one person to a continuing
education program such as a workshop, class or seminar which was held
outside the home. Our questionnaire asked how many people in different
Only forty-eight homes replied to this question. The percentages are, therefore, based on this group of forty-eight.

5 3
personnel categories attended continuing education programs and how many
hours (total) they spent in programs in the past year. The table below
gives the actual number of people attending the continuing education
programs rather than the percent. (Seventy-nine homes responded to
this section of the questionnaire.) Not all homes filled in the number
of hours spent in programs for all personnel, therefore the average
number of hours given in this table will be lower than the number of
hours actually spent.
Continuing Education
Average Number of
# of Persons Hours Spent In Attending From Programs
Personnel Category 79 Homes Past Year
Administrator 66 46.5 Nursing Director 62 17.7 Registered Nurses 55 10.1 Licensed Practical Nurses 57 11.0 Nursing Assistants 247 6.1 Physical Therapy Personnel 55 3.0 Recreational Activities Personnel 32 9.7 Dietary Personnel 57 13.4 Social Service and Clergy 32 11.4 Medical Records Clerks 30 6.5 Bookkeepers 7 9.7 Housekeeping and Maintenance 18 25.4
The different sources of staff education were considered by Service
Area, County Type, Size, Medicare Certification, and Combination Home.
Service Area
(See Table 33, page
All the homes in Service Area IV offer orientation programs, on-the-
job training, and in-service education programs to their employees and
send their employees to continuing education programs outside the home.

54
/
Table 33: Number And Percent Of Homes With Staff Education Programs By Service Area
Service Area II III IV VI Total
Educat ion Programs
Orientat ion Program
Total
# 5 % 71.4
# 7 7, 100.0
13 61.9
21 100.0
11 57.9
19 100.0
100.0
100.0
8 66.7
12 100.0
10 90.9
11 100.0
55 70.5
78 100.0
On The Job Training
Total
# 7,
5 83.3
# 6 7o 100.0
19 82.6
23 100.0
18 94.7
19 100.0
100.0
8
100.0
9 60.0
15 100.0
9 81.8
11 100.0
68 82.9
82 100.0
Planned In-Service Education
# 6 % 100.0
11 47.8
11 55.0
8 100.0
10 62.5
10 90.9
56 66.7
Total # 6 7, 100.0
23 100.0
20 100.0
8 100.0
16 100.0
11 100.0
84 100.0
Educat ional Programs Available To All Three Shifts
# 6 7o 100.0
11 47.8
11 55.0
7 57.5
9 60.0
53 63.9
Total # 6 7 100.0
23 100.0
20 100.0
8 100.0
15 100.0
11 100.0
83 100.0
Personnel Sent To Continuing # 4 21 15 8 12 8 68 Education 7, 66.7 87.5 83.3 100.0 75.0 80.0 82.9
Total # 6 7o 100.0
24 100.0
18 100.0
8 100.0
16 100.0
10 100.0
82 100.0

55
However, only 87.5% of the homes in Area IV have education programs
available to all three shifts. Service Area V consistently has a lower
percentage of homes offering education programs than the State as a
whole; only 66.7% of its homes have orientation programs; 60.07o offer
on-the-job training; 62.5% have planned in-service education; 60.0%
have programs available to all three shifts; and 75.0% sent personnel
to continuing education programs.
County Type
(See Table 34, page
The metropolitan-urban-adjacent counties have a lower percentage of
homes offering orientation programs and a higher percentage offering on-
the-job training than the semi-rural and rural counties. Approximately
the same percentage of homes offer planned in-service education for both
county groupings: 68.8% for the urban counties and 66.7% for the rural
counties. The urban counties have a much higher percentage (88.77.) of
homes sending personal to continuing education programs than do the rural
counties (65.0). Presumably travel expenses and time would be a primary
factor in this difference.
Size
(See Table 35, page
The larger homes are more likely to have the different types of
education programs with the exception of on-the-job training which does
not vary directly with size. Approximately 917. of the smallest homes
have on-the-job training; approximately 797, of the 26-50, 51-100 bed homes
have on-the-job training; and 90% and 1007. of the largest homes have on-
the-job training.

56
Table 34: Number And Percent Of Homes With Staff Education Programs By County Type
(Metro. & Urban Semi- (Semi-&
Metro. Urban Adj. & Adj.) Rural Rural Rural) Total
Educat ion Programs
Orientation Programs
# 23 74. 2
13 16. 9
4 66. 7
( 40 ( 68 .9)
11 73. 3
4 80 .0
( 15 ( 75
) • 0)
55 70.5
Total # 31 100. 0
21 100. 0
6 100. 0
( 58 (100 .0)
15 100. 0
5 100 .0
( 20 (100
) .0)
78 100.0
On Job Training
# 27 90. 0
19 79.2
6 85. 7
( 52 ( 85 .2)
13 81. 3
3 60 .0
( 16 ( 76
) .1)
68 82.9
Total # 30 100. 0
24 100. 0
7 100. 0
( 61 (100 .0)
16 100. 0
5 100 .0
( 21 (100
) .0)
82 100.0
Planned In-Service Education
# 23 76. 7
15 60. 0
4 57. 1
( 42 ( 68 .8)
11 64. 7
3 60 .0
( 14 ( 66
) • 7)
56 66.7
Total # 30 100. 0
24 100. 0
7 100. 0
( 61 (100 .0)
16 100. 0
5 100 .0
( 21 (100
) • 0)
82 100.0
Educational Programs Available For 3 Shifts
# 7o
22 73. 3
14 58. 3
4 57. 1
( 40 ( 65 .6)
10 58. 8
3 60.0
( 13 ( 59
) •1)
53 63.9
Total # 7o
30 100 0
24 100. 0
7 100. 0
( 61 (100 .0)
17 100. 0
5 100 .0
( 22 (100
) • 0)
83 100.0
Personne1 Sent To Continuing Education Program
# 7o
2 9 93. 5
20 83. 3
6 85. 7
( 55 ( 88 .7)
11 73. 3
2 40 .0
( 13 ( 65
) • 0)
68 82.9
Total # %
31 100. 0
24 100. 0
7 100. 0
( 62 (100 .0)
15 100. 0
5 100 .0
( 20 ) (100.0)
82 100.0

57
Table 35: Number By Size
And Percent Of Homes With Staff Education Program
Size 1-25 26-50 51-100 101-150 151-300 Total
Educational Programs
Orientation Programs
#
7.
6 60.0
15 65.2
22 73.3
8 72.7
4 100.0
55 70.5
Total #
7,
10 100.0
23 100.0
30 100.0
11 100.0
4 100.0
78 100.0
On Job Training
# 10 90.9
19 79.2
25 78.1
10 90.9
4 100.0
68 82.9
Total # 11 100.0
24 100.0
32 100.0
11 100.0
4 100.0
82 100.0
Planned In-Service Education
#
7,
4 36.4
14 51.9
25 80.6
9 81.8
4 100.0
56 66.7
Total #
7.
11 100.0
27 100.0
31 100.0
11 100.0
4 100.0
84 100.0
Educational Programs Available To 3 Shifts
# 4 36.4
14 51.9
23 76.7
8 72.7
4 100.0
53 63.9
Total # 11 100.0
27 100.0
30 100.0
11 100.0
4 100.0
83 100.0
Personnel Sent To Continuing Educat ion Programs
#
7.
7 70.0
23 82.1
23 79.3
11 100.0
4 100.0
68 82.9
Total #
7o
10 100.0
28 100.0
29 100.0
11 100.0
4 100.0
82 100.0

5 8
Med icare
(See Table 3 6 , page
A higher percentage of Medicare homes have orientation programs,
planned in-service education programs and continuing education programs
than non-Medicare certified homes. The non-Medicare homes have a
slightly higher percentage of homes with on-the-job training than the
Medicare homes.
Combination Homes
(See Table 3 7 , page
The combination and non-combination homes have approximately the
same percentage of homes with orientation programs -- 7 0 7 , . The combination
homes have a lower percentage of homes with on-the-job training and planned
in-service education; however, they have a much higher percentage ( 1 9 . 3 7 , )
of homes sending personnel to continuing education programs than non-
combination homes ( 7 8 . 4 7 , ) .
Education: Administrator
Almost all the nursing home administrators have finished high school
and approximately 6 0 7 , have had some college training.^ About 2 7 7 , have
four or more years of college. Several have had post-college training.
One is a physician. Sixteen are Registered Nurses, eight are Licensed
Practical Nurses and three are clergymen. A very few have had professional
training in nursing home administration or in hospital administration.
Most of the Registered Nurse administrators manage the smaller homes
of 1 - 5 0 beds. Approximately 7 7 7 , of the homes with Registered Nurse
administrators had high Nursing Service Index scores. Approximately 8 6 7 ,
Information from the Nursing Home Section, State Board of Health.

59
Table 36: Number And Percent Of Homes With Staff Education Programs By Medicare Certified
Medicare Certified Yes No Total
Education Programs
Orientation # 27 28 55 Programs % 84.4 60.9 70.5
Total # 32 46 78 100.0 100.0 100.0
On The Job t 27 41 68 Training 81.8 83.7 82.9
Total # 33 49 82 100.0 100.0 100.0
Planned In-Service # 28 28 56 Education 7, 84.8 54.9 66.7
Total # 33 51 84 7, 100.0 100.0 100.0
Educational Program Available # 26 27 53 For All 3 Shifts 7o 78.8 54.0 63.9
Total # 33 50 83 7, 100.0 100.0 100.0
Personnel Sent To Continuing # 30 38 68 Education Programs 7, 88.2 79.2 82.9
Total # 34 48 82 7o 100.0 100.0 100.0

60 /
Table 37: Number And Percent Of Homes With Staff Education Programs By Combination Home
Combination Home Yes No Total
Education Programs
Orientation Programs
Total
On The Job Training
Total
#
#
# 7>
# 7o
Planned In-Service # Education 7>
Total # 7o
21 70.0
30 100.0
24 77.4
31 100.0
20 64.5
31 100.0
34 70.8
48 100.0
44 86.3
51 100.0
36
67.9
53 100.0
55 70.5
78 100.0
68 82.9
82 100.0
56 66.7
84 100.0
Education Program Available For All 3 Shifts
Total
#
7o
# %
19 63.3
30 100.0
34 64.2
53 100.0
53 63.9
83 100.0
Personnel Sent To Continuing # Education Programs 7,
Total # 7 ,
28 90.3
31 100.0
40 78.4
51 100.0
68 82.9
82 100.0

61
of the homes with Licensed Practical Nurses administrators had high
Nursing Service Index scores. Eighty-six percent of the homes with
administrators who had some training in hospital administration were
Medicare certified. These homes also had high scores on the nursing
service, patient organization, food service and recreation indices.
An index was also made of the administrator's training. (See list
below.) This index was then cross tabulated by Service Area, County
Type, Size, Medicare Certification, Combination Home and the Service
Indices, but no consistent variation appeared.
Administrators Index
Max. = 11
1 High school training
2 College training
2 Four or more years of college
3 Post-college training
3 Professional training in nursing home administration
Our questionnaire asked in what areas the administrators felt the
greatest need for continuing education. Their responses were put into
the categories listed below.
Administrator -- Education Needs
7, of Homes With Adminis trators Continuing Education Category Stating This As A Need
General Administration - Record Keeping,
Budget and Maintenance 3 8 7 ,
Patient Care Concepts, Geriatric Care 3 6 7 ,
Personnel Management 3 2 7 ,
Federal Health Insurance Programs 2 2 7 ,
Other: Medical Terminology, Law,
Emergency Procedures, License Courses 2 0 7 o

T a b l e 3 8 : P e r c e n t O f N u r s i n g Homes S t a t i n g Degree O f Need F o r C e r t a i n E d u c a t i o n T o p i c s Among Types o f S t a f f , 1970
R . N . - % o f Need L . P . N . -% o f Need N u r s i n g A s s t ' s . - % o f Need
T o p i c S t r o n g M o d e r a t e L i t t l e N o S t r o n g M o d e r a t e L i t t l e N o S t r o n g M o d e r a t e L i t t l e N o
Speech T h e r a p y 18 28 16 37 18 28 16 37 17 26 15 42
P o s i t i o n i n g f o r P r e v e n t i o n o f D e f o r m i t i e s 24 21 15 40 28 22 15 35 48 25 11 16
Range o f M o t i o n E x e r c i s e s 20 29 9 42 26 28 9 37 43 36 2 18
P rob lems i n H e m i p l e g i c F u n c t i o n a l A c t i v i t i e s 30 28 6 36 31 27 7 35 42 30 5 24
S e l f - C a r e A c t i v i t i e s 17 24 18 40 22 21 17 38 35 28 17 18
A m b u l a t i o n 16 17 18 48 18 17 20 44 27 33 21 18
E n v i r o n m e n t a l C o n s i d e r a t i o n s 15 28 18 38 20 28 15 37 25 36 14 26
Bowe l and B l a d d e r T r a i n i n g 21 26 11 42 27 27 12 33 41 31 9 20
Emergency Care 33 26 10 31 36 28 7 28 42 25 7 26
D i e t P l a n n i n g and N u t r i t i o n 20 32 18 30 15 38 12 35 16 28 15 4 1
M e d i c a t i o n s 22 16 20 42 25 21 18 36 9 14 14 63
P s y c h o l o g i c a l A s p e c t s o f N u r s i n g Care 35 26 14 26 37 28 10 25 44 25 7 24
R e c r e a t i o n a l A c t i v i t i e s 20 30 15 36 24 27 16 33 32 35 15 18
)

63
Education : Nursing Service
Our questionnaire asked the director of nursing what she considered
to be the most important sources of continuing education for the
Registered Nurses, Licensed Practical Nurses and nursing assistants in
her home. The responses of the directors of nursing were placed in the
categories listed below.
Most Important Sources of Education: Nursing Staff
% of Homes With This As Source of Education Important Source
On-The-Job Trainings 6 8 % In-Service Education 5 8 7 , Staff Meetings 3 5 7 o
Spontaneous Discussion 2 7 7 . Courses/Continuing Education 9 7 , Previous/Additional Experience In
Hospital or Similar Institution
With Geriatric Patients 4 7 , Guest Speakers 3 7 ,
Our questionnaire also asked the director of nursing to indicate
whether she felt the Registered Nurses, Licensed Practical Nurses and
nursing assistants needed (and to what degree) instruction in certain
topics. These topics and the directors of nursing responses are indicated
in Table 38.
The directors of nursing were also asked about their own education
needs. Eighty percent felt a strong or moderate need for training in
planning in-service education programs. Seventy-six percent of them felt
a strong or moderate need for training in personnel management. Forty-six
percent indicated a need for further training in various patient care

6 4
procedures. Eleven percent indicated a need for training in psychological
and/or sociological training. Eight percent indicated a need for
familiarization with federal programs.
Information on whether the supervisory nurse had attended any work
shops, classes or course on geriatric care came from the State Board of
Health license application. Supervisory nurses in fifteen homes had had
this additional training. The largest percentage attending geriatric
training were from Service Areas I, II and IV and were from metropolitan
counties. A higher percentage came from combination homes than from non-
combination homes; a higher percent came from homes not certified for
Medicare than from homes certified for Medicare. The size of the homes
made no apparent difference. Of the homes which had the supervisory nurse
attending a geriatric workshop, course or class, 937, had a high Nursing
Service Index score. However, of all homes with a high Nursing Service
Index score, only 197, had had the supervisory nurse attending geriatric
training.

65
SUMMARY
Most nursing home patients are white females. Heart and stroke
problems are common primary or secondary diagnoses. Approximately forty-
four percent of the patients are non-ambulatory. Approximately half the
patients 1 costs are paid for privately; half are paid for by federal
programs. Many homes will not accept patients who will disturb their
other patients.
The average occupancy rate of the homes 78.4%.
Homes which are in Service Area IV, homes which are in metropolitan-
urban-adjacent counties, homes which are large, homes which are Medicare
certified, and homes which are not in combination with a home for the aged
tend to score higher on the Service Indices. A majority of homes said
they wanted no additional nursing services. For homes which did want more
nursing service, physical therapy was the most commonly stated need and
personnel the most common reason for preventing the service from being
given.
Approximately 347> of the physicians serving patients in a home come
routinely to the home. A majority, 59%, come when called, and 6% will
not always come when called.
The Registered Nurses are in the shortest supply in the nursing
homes with the lowest number employed and highest percent of vacancies.
Service Area I had the highest percent with 1-10 patients per Registered
Nurse. Service Area IV had the highest percent with 1-10 patients per
Licensed Practical Nurse. Service Area I and II had the highest percent
with 1-10 patients per Registered Nurse and Licensed Practical Nurse
combined. It is interesting that Service Area IV, which was generally

/ 66 i
higher on the Service Indices was not consistently higher in the patient-
staff ratios. Metropolitan and urban counties had a high percent of
homes with 1-10 patients per Registered Nurse. Metropolitan and adjacent
counties had a high percent of homes with 1-10 patients per Registered
Nurse and Licensed Practical Nurse combined. Patient-staff ratios varied
inconsistently with size. Medicare homes had a higher percent of homes
with 1-10 patients per Registered Nurse and per Registered Nurse and
Licensed Practice Nurse combined. Combination homes had a lower percent
of homes with 1-10 patients per Registered Nurse and about the same percent
as non-combination homes of homes with 1-10 patients per Registered Nurse
and Licensed Practical Nurse combined.
All the homes in Service Area IV offer the different sources of
staff education: orientation programs, on-the-job training, in-service
education, and continuing education. A low percent of homes in Service
Area V offered staff education. The urban counties had a higher percent
of homes sending personnel to continuing education programs. Larger
homes are more apt to offer education programs than smaller, with the
exception of on-the-job training which did not vary directly with size.
The Medicare certified homes offered more education programs. A lower
percentage of combination homes offered on-the-job and in-service education
and a higher percent sent personnel to continuing education programs.
The administrators' education did not seem to affect the overall
services offered by the home. The administrator felt the most need for
education in general administration, patients care concepts, and
personnel management.

67
The director of nursing service felt the greatest need for training
in planning in-service education programs and for training in personnel
management. The director of nursing service felt that on-the-job
training and in-service education were the most important sources of
education for her staff.
The course for which over 2 5 7 o of the directors of nursing indicated
a strong need for their staff were; for Registered Nurses: problems in
hemiplegic functional activities, emergency care and psychological aspects
of nursing care; for Licensed Practical Nurses: positioning for prevention
of deformities, range of motion exercises, problems in hemiplegic function
activities, bowel and bladder retraining, emergency care, diet planning
and nutrition and psychological aspects of nursing care; for nursing
assistants: positioning for prevention of deformities, range of motion
exercises, problems in hemiplegic functional activities, self-care
activities, ambulation, bowel and bladder retraining, emergency care,
psychological aspects of nursing care and recreational activities.
The most common problems which prevented homes from offereing as
much staff education as they would like were time a n d scheduling
difficulties and a lack of competent teachers.
In order to consider the relative need in North Carolina for beds
for the elderly, a comparison was made between the percent of the
population over 6 5 , the percent of hospital discharges over age 66 from
the Professional Activities Study, and the percent of nursing home beds
by Service Area and County Type. (See Table 3 9 . )
Service Area I has the lowest percent of nursing home beds and the

68
Table 39: Percent Of 1960 Population 65 Years Of Age Or Older, Percent Of PAS Hospital Discharge Population 66 Years Of Age And Older And Percent Of Nursing Home Beds
By Service Area
7, Population % PAS % Nursing 65+ 66+ Home Beds
Service Area
1 9.6 20.6 6.8
2 6.8 15.5 24.7
3 6.8 14.8 20.3
4 6.9 15.9 15.9
5 5.7 17.0 20.8
6 6.8 17.9 11.5
STATE 6.9 17.6 100.0
By County Type
7» Population % PAS 7, Nursing 65+ 66+ Home Beds
County Type
Metropolitan 6.6 15.5 43.3
Urban 6.2 15.6 29.5
Adjacent 7.9 19.5 7.7
Semi-Rural 6.7 17.6 15.2
Rural 8.5 22.3 4.2
STATE 6.9 17.6 100.0

69
highest percent of population over age 65 and the highest percent of
PAS hospital discharges over age 66. Service Area II, in contrast,
has a low percent of population over 65, and a low percent of PAS
discharges over 66, and a high percent of nursing home beds.
The rural counties seem to be lacking in nursing home beds; they
have the highest percent of the population over 65, the highest percent
of discharges over 66, and the lowest percent of nursing home beds.
The metropolitan counties have a low percent of population over 65, a
low percent of hospital discharges over 66 and 437> of the nursing home
beds.
In 1963 a Federal survey of institutions for the aged showed that
the South had fewer beds per 1000 population aged 65 and over than the
nation as a whole in all categories of beds: nursing care, personal
care with nursing, personal care and hospital care. (See Table 40.)
Looking at roughly similar figures for North Carolina, it would
seem that North Carolina had fewer nursing home beds (similar to nursing
care and personal care with nursing combined) and fewer long term care
hospital beds for its aged population and more homes for the aged beds
(similar to personal care) than the South and the nation as a whole did
in 1963. (See Table 41.)
Considering that the number of nursing home beds alone in North
Carolina increased approximately 697> for 1963 to 1970, these figures,
rough as they are, do not speak well from North Carolina fs provision
of care for its elderly population in comparison to the South and the
nat ion.

70
Table 4 0 : Number Of Beds In Institutions For The Aged Per 1,000 Total
Civilian Population 65+ Years Of Age For the U. S. And The
South, April - J u n e , 1 9 6 3 *
Beds U. S. South
All Types 38.2 27.4
Nursing Care 18.3 13.3
Personal Care With Nursing 11.2 7.3
(Nursing Care And Personal Care
With Nursing) (29.4) (20.5)
Personal Care 3.4 2.6
Hospital Care 5.3 4.2
*Taken from "Utilization of Institutions for the Aged and Chronically
1 1 1 " , National Center for Health Statistics, Series 12, Number 4, page 1 8 .
Table 4 1 : Number Of Beds In Institutions For The Aged Per 1,000 Total
Civilian Population 65+ Years Of Age For North Carolina, 1970
Beds North Carolina
All Types 39.8
Nursing Home 16.4
Homes For The Aged 21.7
Long-term Care Hospital And Hospital
Unit Beds 1.6

APPENDIX A


MAP A
NUMBER OF LICENSED NURSING HOMES AND BEDS (SKILLED NURSING, ICF-A AND ICF-B) IN NORTH CAROLINA, 1970
r T" •OCT INGHAM
• uilpomd
" 1 — • T 7 " „ „ . " ' b . \>j[
r>»»ioso«
•4 /
IV w
• m u m • 1
fWVtN «X ̂ 6 4 / "251 _.Jr
V , * v j * ^ 1 / e- f l f l f ijg / \
1 ( 1 ) ~ > ^e«-«*.«r
/ .333 / \ , * \
y is 2 S155/ / 2
109 ^
\
/
. J. I j. | x —
I 5 4 178 ) J ^ & y ^ l 5 2 _ \ 5
\ / v \ S ( \
J 1 ' \ CCM.IMUI /
\ 52/ m m m 3 \
Top numeral is the number of licensed nursing homes.
Bottom numeral is the number of skilled nursing, ICF-A and ICF-B beds.
Total number of homes: 108
Total number of beds: 6,809

MAP B
NUMBER OF LICENSED NURSING HOMES AND BEDS (SKILLED NURSING, ICF-A
AND ICF-B) RETURNING REGIONAL MEDICAL PROGRAM QUESTIONNAIRE, 1970
"7
1TO.M I M̂MHt. TP
CASVtlL I »t«OP< OSyJ V - - l 4 - - T O I . - - 5 0 + . r " L ; I — $ 2 ) . / 133
2 9 /
\
- i - i p ^ . ,• u
0 i L J — ' 8 2 A / 1 3 3 1 — v •' 6 Z _
J . . A
^ a.»»
RAW V
J C — « \ — / " f t > ( ...» — 1 6
\ /»«n i*M # W J7 L i >> f ^ ^ _ ^
\ \ S lj 1) "> Y " " 5 4 1 - 7 8 ) ^ > W \
• J K̂OTLA-O (. '
Top numeral is the number of licensed nursing homes.
Bottom numeral is the number of skilled nursing, ICF-A and ICF-B beds.
Number of homes returning questionnaire: 86
Number of beds returning questionnaire: 5,712
Percent of total homes: 79.6%
Percent of total beds: 83.8%

73
NORTH CAROLINA REGIONAL MEDICAL PROGRAM SURVEY OF NURSING HOMES
All of the State's nursing homes and intermediate care facilities are
being asked to participate in a survey conducted by the North Carolina Regional
Medical Program. The Regional Medical Program has, among its principal aims,
the provision of resources at the local level for the improvement of health
care for all the people of North Carolina especially in the areas of heart
disease, cancer and stroke. Its aims are achieved through the development of
cooperative programs with health care providers and agencies.
This survey seeks to delineate the resources and needs of the State's
nursing homes and intermediate care facilities. The information gained from
the survey is necessary for planning and implementing effective programs of
potential benefit to these facilities. In addition to the Regional Medical
Program, other groups involved in the programs potentially beneficial to
nursing homes have expressed a need for the summary information obtained. The
-summary information also will be available to the administrators. It will note
similarities and differences in patient populations and programs among facilities
THE CONFIDENTIALITY OF ALL INDIVIDUAL REPLIES WILL BE MAINTAINED and
only summary statements of the replies will be made. The code numbers assigned
to each nursing home will insure confidentiality of the data.
The cooperation of all the nursing homes and intermediate care facilities
in the State will be greatly appreciated and the information gained should be
of benefit to all.

74
ATTENTION: ADMINISTRATOR
PATIENTS AND PATIENT CARE
1. How many patients (not including residents if combination home) does your facility have today?
2. Please indicate approximately what percent of your patients have the following conditions as either a primary or secondary diagnosis.
Condition Percent of Patients with Condition (1) Heart Disease (2) Cancer (3) Stroke ( 4 ) Diabetes (5) Chronic Kidney Disease (6) None of the Above
3. Which of the following types of patients do you not accept and why?
Inadequate Types of Patients Reimbursement (1) Mentally 111 (2) Patients Under Age 18 (3) Public Assistance Patients ( 4 ) Terminally 111 Cancer Patients (5) Bedfast Patients (6) Difficult to Manage Patients (7) Other:
4. Do you have a written patient care mannual?
5. Do you have written patient care plans for each patient? Yes No
6. Are these plans available to all the staff at all times? Yes No
7. Do you have a utilization review committee? Yes No
8. If yes, how many of each of the following are on the committee? (If no, go to question 10.) (1) Physicians (2) R.N.'s (3) L.P.N.'s ( 4 ) Physical Therapist (5) Other: Specify
9. How often does this committee meet? (1) Monthly (2) Other: Please Specify
Reasons Will Not Accept Not Equipped Distrubing Othei
to Handle to others Speci
= = 3 = = =
Yes No
10. Please write in the name(s) of the hospital(s) with which you have a verbal transfer agreement:

75
11. Please write in the name(s) of the hospital(s) with which you have a written transfer agreement:
12. Does your home have a physician who sees most of your patients? Yes No
13. If yes, approximately how many patients does he care for?
14. How many different physicians see patients in your home?
15. How many of these physicians:
(1) Come Rout inely Without a Reminder From the Nursing Home?
(2) Come When Called? (3) Will Not Always Come When Called? (4) Other: Please Specify
16. Does a dentist come to your home? (Check One) (1) On a Regular Basis (2) Emergency Only (3) For Restorative Care (4) Other: Please Specify
17. Approximately how many of your patients have seen an eye specialist (M.D.) in the past year?
18. Approximately how many of your patients have seen a hearing specialist (M.D.) in the past year?
19. Do you do any of the following tests routinely? Where are these tests done?
Test Done Test Done Public
Routinely Own Health Physician's Other Test Yes No Facility Hospital Dept. Office Specify (1) Diabetic Urine Test (2) Urinalysis for Non-
Diabetic Patients
(3) Hemoglobin Test ZZZ__ (4) White Blood Cell Count (5) Complete Blood Cell (6) Chest Film
20. How do you obtain your drugs?
(1) Prescription Sent to Local Pharmacy (2) Affiliation with Hospital (3) Employ Full Time or Part Time Pharmacist (4) Other: Please Specify
FOOD SERVICE
21. Does your home have the services of:
(1) A Graduate of an Accredited Program in Nutrition or Diet Therapy (2) A Home Economics Graduate with a Major in Foods and Nutrition (3) A Food Service Company which Employs its Own Dietition

76
2 2 . I s t h i s p e r s o n : A C o n s u l t a n t
A R e g u l a r Emp loyee
( 1 ) Menu P l a n n i n g ( 2 ) O r i e n t a t i o n o f New Food S e r v i c e P e r s o n n e l ( 3 ) T r a i n i n g o f Food S e r v i c e P e r s o n n e l ( 4 ) S u p e r v i s i o n o f Food S e r v i c e P e r s o n n e l ( 5 ) P a r t i c i p a t i o n i n I n - S e r v i c e E d u c a t i o n P rog rams f o r S t a f f Members
O t h e r t h a n Food S e r v i c e P e r s o n n e l ( 6 ) T a l k i n g w i t h P a t i e n t s a b o u t Food A c c e p t a n c e ( 7 ) P u r c h a s i n g ( 8 ) O t h e r : P l e a s e S p e c i f y
2 5 . Does y o u r home have a f o o d s e r v i c e o r k i t c h e n s u p e r v i s o r i n a d d i t i o n t o o r i n s t e a d o f a c o n s u l t a n t o r e m p l o y e d d i e t i t i a n o r n u t r i t i o n i s t ? Yes
2 6 . I f y e s , how many h o u r s p e r week does t h i s p e r s o n w o r k ?
2 7 . P l e a s e c h e c k w h i c h o f t h e f o l l o w i n g d u t i e s t h i s p e r s o n h a s .
( 1 ) Menu P l a n n i n g ( 2 ) O r i e n t a t i o n o f New Food S e r v i c e P e r s o n n e l ( 3 ) T r a i n i n g o f Food S e r v i c e P e r s o n n e l ( 4 ) S u p e r v i s i o n o f Food S e r v i c e P e r s o n n e l ( 5 ) P a r t i c i p a t i o n i n I n - S e r v i c e E d u c a t i o n P rog rams f o r S t a f f Members
O t h e r t h a n Food S e r v i c e P e r s o n n e l ( 6 ) T a l k i n g w i t h P a t i e n t s a b o u t Food A c c e p t a n c e ( 7 ) P u r c h a s i n g ( 8 ) O t h e r : P l e a s e S p e c i f y
PHYSICAL THERAPY
2 8 . Does y o u r home have a p h y s i c a l t h e r a p y p rog ram? Yes No ( I f n o , g o t o q u e s t i o n 3 7 . ) .
2 9 . Do y o u have a R e g i s t e r e d P h y s i c a l T h e r a p i s t ?
( 1 ) Emp loyed F u l l T ime ( 2 ) Emp loyed P a r t T ime ( I f y e s , how many h o u r s p e r week? ) ( 3 ) P o s i t i o n W h i c h i s P r e s e n t l y V a c a n t ( 4 ) C o n t r a c t f o r D i r e c t S e r v i c e ( 5 ) P u b l i c H e a l t h C o n s u l t a n t ( 6 ) C o n t r a c t f o r T e a c h i n g a n d / o r C o n s u l t a t i o n
( 7 ) O t h e r : P l e a s e S p e c i f y
3 0 . I n a d d i t i o n t o o r i n s t e a d o f a p h y s i c a l t h e r a p i s t , d o y o u have a n emp loyee d e s i g n a t e d t o a s s i s t p a t i e n t s w i t h p h y s i c a l t h e r a p y ? Yes N o
3 1 . I f y e s , w h a t i s t h i s e m p l o y e e ( s ) t r a i n i n g - - R . N . , L . P . N . , N u r s i n g A s s i s t a n t ? P l e a s e S p e c i f y :
3 2 . Do y o u have a s e p a r a t e room f o r p h y s i c a l t h e r a p y t r e a t m e n t ? Yes No
2 3 . How many h o u r s does t h i s p e r s o n w o r k ? Pe r Mon th ( o r Per Week)
2 4 . P l e a s e c h e c k w h i c h o f t h e f o l l o w i n g d u t i e s t h i s p e r s o n h a s :

77
33. Equipment -- Do you have?
Exercise
(1) Pulleys (2) Weights (3) Shoulder Wheel
Heat/Cold (4) Hot or Cold Packs (5) Diothermy (6) Infra-Red Lamp
Ambulation (7) Walkers (8) Canes/Crutches (9) Parallel Bars
Hydro-Therapy (10) Whirlpool (11) Paraffin Bath (12) Hubbard Tank
34. How many different patients are presently on Physical Therapy programs?
35. How many hours this week will patients receive physical therapy treatment by the physical therapist?
36. How many hours this week will patients receive physical therapy treatment by other staff members?
OCCUPATIONAL THERAPY, RECREATIONAL ACTIVITIES, SOCIAL SERVICES, VOLUNTEER ACTIVITIES
37. Does your home have the services of an Occupational Therapist? Yes No
38. If yes, under what arrangement? Please Specify:
39. Does your home provide recreational activities for your patients? Yes No
40. If yes, do you have an employee specifically designated to supervise recreation? Yes No
41. If yes, what is this employee's training? Please Specify:
42. What types of recreation are available to your patients? (1) Arts and Crafts (5) Outings (2) Television (6) Parties (3) Radio (7) Entertainment Programs (4) Games (8) Other: Please Specify:
43. Do you have regular religious services in your home? Yes No

78 /
44 . I f yes , how o f t e n are they he ld?
45. Do you employ a f u l l y q u a l i f i e d s o c i a l s e r v i c e worker? Yes No
46. Do you have an employee s p e c i f i c a l l y des igna ted to work in S o c i a l Services e i t h e r in a d d i t i o n to or i n s t e a d of a S o c i a l Serv ice worker? Yes N
47. I f yes , app rox ima te l y how many hours per week does t h i s person work in Soc Serv ices? What i s t h i s p e r s o n ' s t r a i n i n g ?
48. Does your S o c i a l Serv ice employee(s) work w i t h the p a t i e n t ' s f am i l y? Yc
No
49. Are v o l u n t e e r s used in your home? Yes No ( I f no , go to q u e s t i o n 5:
50. I f yes , how are they used? Please Spec i f y
5 1 . Do you have a t r a i n i n g program f o r v o l u n t e e r s ? Yes No
52. Do you have an employee s p e c i f i c a l l y des igna ted to be in charge of v o l u n t e e r s ? Yes No
STAFF EDUCATION
53. Do you have p lanned and r e g u l a r l y schedules o r i e n t a t i o n programs? Yes I f y e s , f o r what personnel? Please Spec i f y
54. Do you have o n - t h e - j o b t r a i n i n g ? Yes No If yes , f o r what personnel Please Spec i f y
55. Do you have p lanned and r e g u l a r l y scheduled i n - s e r v i c e educa t i on programs? Yes No ( I f no , go to q u e s t i o n 6 0 . )
56. I f yes , wh ich personne l a t t e n d your i n - s e r v i c e e d u c a t i o n programs? Please Spec i f y
57. How o f t e n are your i n - s e r v i c e educa t i on programs h e l d and app rox ima te l y how many hours long is a program?
58. Are these i n - s e r v i c e educa t i on programs a v a i l a b l e t o a l l t h ree s h i f t s ? Yes No
59. Who d i r e c t s your i n - s e r v i c e educa t i on programs (charge nu rse , R .N . , L .P .N . , e t c . ) ?
60. I f you do not have as e x t e n s i v e an e d u c a t i o n program as you would l i k e to have, what are the major problems wh ich p reven t you from p r o v i d i n g these programs? Please l i s t be low. Problems i n P r o v i d i n g S t a f f Educa t i on :

79
CONTINUING EDUCATION
6 1 . Have any of your personne l a t t ended c o n t i n u i n g educa t i on programs (workshops, c l a s s e s , seminars , e t x . ) h e l d ou t s i de your home? Yes No ( I f no, go to q u e s t i o n 63 . )
62. I f yes , how many of each of the f o l l o w i n g personne l have been to c o n t i n u i n g educa t i on programs and app rox ima te l y how many hours t o t a l were spent in the programs in the past year?
Personne l Category (1) A d m i n i s t r a t o r (2) Nurs ing D i r e c t o r ( s ) (3) R . N . ! s (4) L . P . N . ' s (5) Nurs ing A s s i s t a n t s (6) P h y s i c a l Therapy Personnel (7) R e c r e a t i o n a l A c t i v i t i e s Personnel (8) D i e t a r y Personnel (9) S o c i a l Serv i ces Personnel
(10) Med ica l Records C le rks (11) Other : Please Spec i fy
63, What pe rsonne l (o f those who have not a t tended c o n t i n u i n g educa t i on programs) have the g r e a t e s t need f o r c o n t i n u i n g educa t i on and in what s u b j e c t areas is t h i s need? ( I f none, check here and go go q u e s t i o n 64 . ) Spec i f y :
EDUCATION NEEDS: ADMINISTRATOR
64. In what areas does the a d m i n i s t r a t o r f e e l the g r e a t e s t need f o r c o n t i n u i n g educat ion? Please S p e c i f y :
ATTENTION: DIRECTOR OF NURSING SERVICE
The f o l l o w i n g ques t i ons are concerned w i t h Nurs ing S e r v i c e s .
65. How many persons do you have employed in the f o l l o w i n g n u r s i n g s e r v i c e p o s i t i o n s ? A l s o , how many a c t u a l budgeted vacanc ies do you have f o r these p o s i t i o n s ? How many persons in each ca tegory do you f e e l you need, i f any, i n a d d i t i o n t o your a c t u a l vacancies?
# of Persons # of Hours Spent A t t e n d i n g In the Program

8 0
# Budgeted # Needed in Number Employed Vacancies Addition to
Full Time Part Time Full Time Part Time Vacanc ies (1) R.N. (2) L.P.N. ( 3 ) Nursing
Assistant
66. Turnover: How many of your present nursing service employees have been at
your facility for five years or more, one to four years, less than one year? I
Number Presently Employed Who Have Been Here: 5 Years or More One to 4 Years Less Than One Yeai
(1) R.N. (2) L.P.N. ( 3 ) Nursing Assistants
67. Please indicate which of the following nursing services your home provides and indicate approximately how many patients are receiving the services at present. (Do not include residents if combination home.)
Service Number of Patients Provided Presently Receiving
Service Yes No Services (1) Temperature-Pulse-Respiration (2) Range of Motion Exercises ( 3 ) Tub Bath or Shower (4) Application of Sterile Dressings or
Bandages (5) Urethral Catheter Irrigation (6) Bowel and Bladder Retraining (7) Intravenous Fluids (8) Nasal Tube Feeding (9) Colostomy Irrigation
(10) Oxygen Therapy (Non-Emergency) (11) Intermittant Positive Pressure
Respirator (IPPR) (12) Enema (13) Bed Positioning
68. What nursing services, if any, do you wish your home could provide — either to present patients or in order to admit new types of patients to your home. Please list these below. (If no additional services are needed, check here
and go to question 70.)
Nursing services which home would like to provide:
69. What are the major problems which prevent your home from being able to provide, those services which you wish you could provide? Please list these below.
Problems:

81
EDUCATION: NURSING SERVICE
70. Please desc r i be what you cons ide r to be the most impo r tan t source of educa t i on f o r your R . N . ! s , L . P . N . ' s , and n u r s i n g a s s i s t a n t s ( i n - s e r v i c e e d u c a t i o n , o n - t h e - j o b t r a i n i n g , s t a f f mee t i ngs , spontaneous d i s c u s s i o n s , e t c . ) .
7 1 . O f the f o l l o w i n g l i s t o f t o p i c s , p lease i n d i c a t e whether you f e e l a s t r o n g , moderate , l i t t l e , o r no need f o r i n s t u r c t i o n in these areas f o r each personne l ca tego ry . I f you f e e l a s t r o n g need f o r any o t h e r t o p i c s wh ich are no t on t h i s l i s t , p lease w r i t e these i n under the " O t h e r " c a t e g o r y .
St rong Moderate L i t t l e No Topic RN LPN NA RN LPN NA RN LPN NA RN LPN NA (1) Speech Therapy (2) P o s i t i o n i n g f o r
P r e v e n t i o n of Def o r m i t i e s
(3) Range of Mot ion Exce rc i ses _ _
(4) Problems in Hemip l e g i c F u n c t i o n a l A c t i v i t i e s
(5) S e l f - Care A c t i v i t i e s (6) Ambula t ion (7) Env i ronmenta l
Cons ide ra t i ons _ _ (8) Bowel and Bladder
T r a i n i n g (9) Emergency Care
(10) D ie t P lann ing and N u t r i t i o n
(11) Med ica t ions (12) P s y c h o l o g i c a l Aspects
of Nurs ing Care _ (13) R e c r e a t i o n a l
A c t i v i t i e s _ _ _ (14) Other : Please S p e c i f y :
NA is an a b b r e v i a t i o n used f o r Nurs ing A s s i s t a n t s .

82
72. What are the major education needs of the director of nursing?
Strong Moderate Little No
Topic Need Need Need Need
(1) Personnel Management
(2) Planning In-Service Education
Programs
(3) Patient Care Procedures:
Spec ify:
(4) Other: Please Specify:

APPENDIX B


8 3
SERVICE AREAS
Autonomous Areas of General Hospitalization
The Service Area estimates are derived from the analysis of hospital
deaths due to Heart Disease, Stroke, Cancer, and Diabetes. In so far as
we have been able to validate them, the estimates are fairly accurate.
However, there are two known biases: 1) since the original death data
represented patients hospitalized in their last year of life, the estimates
reflect patterns of non-routine or non-elective hospitalization and thus
slightly overemphasizes the channeling of patients into counties with larger,
more sophisticated hospitals; 2) with those smaller counties which feed
into several outlying hospitals, the estimates are less reliable. In those
cases in which estimates were considered little better than guesses (as for
Tyrrell and Washington Counties), they were discarded.

8 4


This book circulates for a 2-week period and is due on the last date stamped below. It must be brought to the library to be renewed.
APR 2 p 1978
OCT 05 m
OCT 2 9 '979
MAY o ? m


![Reports … Annual Convention [19??-?] Volume 60 (1962)archives.hsl.unc.edu/nchh/nchh-107/nchh-107-060.pdf · NORTH CAROLINA HISTORY OF HEALTH DIGITAL COLLECTION Reports … Annual](https://static.fdocuments.in/doc/165x107/5e2dbcd12c01b122c55a0312/reports-annual-convention-19-volume-60-1962-north-carolina-history-of-health.jpg)


