Analysis of near‐surface relative humidity in a wind ... · RESEARCH ARTICLE Analysis of...
14
RESEARCH ARTICLE Analysis of near‐surface relative humidity in a wind turbine array boundary layer using an instrumented unmanned aerial system and large‐eddy simulation Kevin A. Adkins 1 | Adrian Sescu 2 1 Embry‐Riddle Aeronautical University, Department of Aeronautical Science, Daytona Beach, Florida 32114, USA 2 Mississippi State University, Department of Aerospace Engineering, Mississippi State, Mississippi 39762, USA Correspondence Kevin A. Adkins, Department of Aeronautical Science, Embry‐Riddle Aeronautical University, Daytona Beach, FL 32114, USA. Email: [email protected] Abstract Simulation and modeling have shown that wind farms have an impact on the near‐surface atmospheric boundary layer as turbulent wakes generated by the turbines enhance ver- tical mixing. While a few observational data sets that focus on near‐surface temperature changes exist, these studies lack high spatial resolution and neglect the combined effect of these temperature changes with an altered humidity profile. With a large portion of wind farms hosted within an agricultural context, changes to relative humidity can poten- tially have secondary impacts, such as to the productivity of crops. The goal of this study is to gather high‐resolution in situ field measurements in the wake of a single wind turbine in order to differentially map downstream changes to relative humidity. These measure- ments, obtained by an instrumented unmanned aerial system, are complemented by numerical experiments conducted using large‐eddy simulation. Observations and numerical results are in good general agreement around a single wind turbine and show that downstream relative humidity is differentially altered in all directions, specifically decreased below the turbine hub height. Large‐eddy simulation is then used to deter- mine the effect of a large 7 × 4 turbine array on the relative humidity distribution in compounding wakes. It is found that the region of relative humidity decrease below the turbine hub height and the region of increase above the hub height both intensify, differentially extend in the lateral directions, and move slightly upward with downstream distance. KEYWORDS atmospheric boundary layer, large‐eddy simulation, relative humidity, UAV, unmanned aerial system, wind farms, wind turbine, wind turbine array boundary layer 1 | INTRODUCTION The International Energy Outlook 2016 (IEO2016) documents that nonhydropower renewable energy sources accounted for 5% of total world electricity generation 1 in 2012. The outlook, which forecasts for international energy markets through 2040, projects that total world energy consumption will increase 48% from 2012 to 2040. With industrial nations around the world pledging to increase their renewable energy capacity, the report prognosticates that renewables will grow to supply 14% of the increased electricity demand in 2040, with much of this growth coming from wind power. This growth ensures that the number and sizes of wind farms will continue to increase. As kinetic energy is extracted from the wind and converted into rotational energy by a turbine, turbulent wakes are generated. Experimental measurement and numerical simulations have shown that these wakes modify the atmosphere's surface layer and exchanges with the surface. Of particular motivation for this study are the identified changes that wind turbine arrays make to near‐surface temperature. 2-5 Temperature Received: 11 October 2017 Revised: 9 May 2018 Accepted: 26 May 2018 DOI: 10.1002/we.2220 Wind Energy. 2018;1–14. © 2018 John Wiley & Sons, Ltd. wileyonlinelibrary.com/journal/we 1
-
Upload
nguyentuyen -
Category
Documents
-
view
222 -
download
0
Transcript of Analysis of near‐surface relative humidity in a wind ... · RESEARCH ARTICLE Analysis of...

Received: 11 October 2017 Revised: 9 May 2018 Accepted: 26 May 2018
DOI: 10.1002/we.2220
R E S E A R CH AR T I C L E
Analysis of near‐surface relative humidity in a wind turbinearray boundary layer using an instrumented unmanned aerialsystem and large‐eddy simulation
Kevin A. Adkins1 | Adrian Sescu2
1Embry‐Riddle Aeronautical University,
Department of Aeronautical Science, Daytona
Beach, Florida 32114, USA
2Mississippi State University, Department of
Aerospace Engineering, Mississippi State,
Mississippi 39762, USA
Correspondence
Kevin A. Adkins, Department of Aeronautical
Science, Embry‐Riddle Aeronautical
University, Daytona Beach, FL 32114, USA.
Email: [email protected]
Wind Energy. 2018;1–14.
Abstract
Simulationandmodelinghaveshownthatwind farmshavean impacton thenear‐surface
atmospheric boundary layer as turbulent wakes generated by the turbines enhance ver-
tical mixing.While a fewobservational data sets that focus on near‐surface temperature
changes exist, these studies lack high spatial resolution and neglect the combined effect
of these temperature changes with an altered humidity profile. With a large portion of
wind farmshostedwithinanagricultural context, changes to relativehumiditycanpoten-
tially have secondary impacts, such as to the productivity of crops. The goal of this study
is togatherhigh‐resolution insitu fieldmeasurements in thewakeofa singlewindturbine
in order to differentially map downstream changes to relative humidity. Thesemeasure-
ments, obtained by an instrumented unmanned aerial system, are complemented by
numerical experiments conducted using large‐eddy simulation. Observations and
numerical results are in good general agreement around a single wind turbine and show
that downstream relative humidity is differentially altered in all directions, specifically
decreased below the turbine hub height. Large‐eddy simulation is then used to deter-
mine the effect of a large 7 × 4 turbine array on the relative humidity distribution in
compounding wakes. It is found that the region of relative humidity decrease below
the turbine hub height and the region of increase above the hub height both intensify,
differentially extend in the lateral directions, andmove slightly upwardwithdownstream
distance.
KEYWORDS
atmospheric boundary layer, large‐eddy simulation, relative humidity, UAV, unmanned aerial
system, wind farms, wind turbine, wind turbine array boundary layer
1 | INTRODUCTION
The International Energy Outlook 2016 (IEO2016) documents that nonhydropower renewable energy sources accounted for 5% of total world
electricity generation1 in 2012. The outlook, which forecasts for international energy markets through 2040, projects that total world energy
consumption will increase 48% from 2012 to 2040. With industrial nations around the world pledging to increase their renewable energy capacity,
the report prognosticates that renewables will grow to supply 14% of the increased electricity demand in 2040, with much of this growth coming
from wind power. This growth ensures that the number and sizes of wind farms will continue to increase.
As kinetic energy is extracted from the wind and converted into rotational energy by a turbine, turbulent wakes are generated. Experimental
measurement and numerical simulations have shown that these wakes modify the atmosphere's surface layer and exchanges with the surface. Of
particular motivation for this study are the identified changes that wind turbine arrays make to near‐surface temperature.2-5 Temperature
© 2018 John Wiley & Sons, Ltd.wileyonlinelibrary.com/journal/we 1

2 ADKINS AND SESCU
measurements during the Crop Wind Energy Experiments (CWEX) showed wind turbines significantly warming, on the order of 1.0 to 1.5 K, over-
night readings.6 Further, large‐eddy simulation (LES) has established that wind turbine arrays change the dynamic properties of the atmospheric
boundary layer (ABL),7,8 along with scalar9,10 and heat11 fluxes within it.
More limited attention has been given to the impact of wind turbines on near‐surface humidity. Roy2 and Roy et al,12 using mesoscale model-
ing, have investigated the impact of wind farms on near‐surface humidity. The enhanced vertical mixing brought about by the turbines delivered
relatively dry air downward and moister air upward in the presence of a positive total mixing ratio lapse rate and vice versa in the presence of a
negative lapse rate. Concurrent with the original CWEX, a field campaign within a Midwest wind farm was undertaken by researchers at Purdue
University to study meteorological instrumentation.13 This investigation placed 5 instrumentation clusters within a wind farm with no 2 instrument
clusters positioned closer than 4500‐m apart. Instrument biases prevented quantifying relative humidity results and the distant spacing of the
clusters inhibited characterizing any change with high spatial resolution. However, observations did imply downstream drying. Subsequent to this,
leaf wetness sensors were incorporated into the second summer of the CWEX (CWEX‐2011) in order to monitor plant dew duration. While faulty
sensors and limited observations prevented definitive conclusions, conditional support that wind farms lower downstream near‐surface relative
humidity was garnered.14
In situ atmospheric observations via remote controlled (R/C) aircraft15 have been attempted as far back as 1970. However, it was not until the
advent of the global positioning system and miniaturization of computer hardware, energy dense batteries, aircraft systems, and sensors that
semiautonomous small unmanned aerial system (UAS) operations could be realized. These advances, accompanying affordability, and the creation
of a regulatory structure have resulted in the ready availability of UASs, colloquially referred to as drones, for atmospheric observation.16,17
Atmospheric sampling of vertical profiles,18,19 turbulence,20 entrainment,21 marine boundary layers,22,23 sea breezes,24 and temperature
fluctuations25 have all been successfully accomplished with an UAS. Unmanned aerial system have also been exploited to evaluate numerical
weather prediction ABL parameterization schemes,26 detect underlying surface temperatures,27 investigate the Arctic28 and Antarctic29 ABL,
and aid in the calculation of sensible and latent heat fluctuations.30
With a large portion of wind farms hosted within agricultural contexts, changes to either near‐surface temperature or humidity can influence
crop yield. Relative humidity accounts for changes in either temperature or absolute humidity, and its influence on plant growth has been
established.31-36 Therefore, an investigation of changes to relative humidity downstream of wind turbines is appropriate. Furthermore, with the
impact of wind farms on near‐surface meteorology having been predominately investigated by numerical modeling and simulation to date,
empirical observations with high spatial resolution are required to verify and enhance model and simulation output. In this investigation, these
observations were made with an instrumented UAS downstream of a single upwind turbine. Measurements were made with high spatial resolution
in order to differentially map changes to relative humidity in the near‐wake region. These experimental measurements are subsequently compared
with LES results. Large‐eddy simulation is then used to extend the investigation to the accumulated change of relative humidity due to the impact
of compounding wakes within a 7 × 4 wind turbine array.
2 | METHODOLOGY
2.1 | Experimental setting
The measurement campaign took place within a recently developed, state‐of‐the‐art, wind farm located in the Midwest United States.37 During
the 4 days over which the field campaign took place, a warm and moist air mass remained in place. The wind turbine, around which measurements
were made, was located in a sparsely populated, open agricultural setting with flat topography and homogeneous cultivar and surface moisture
characteristics.
Measurements were taken both upstream and downstream of a single upstream General Electric (GE) 1.7‐MWwind turbine with an 80‐m hub
height and 100‐m rotor diameter. A GE 1.7‐MW turbine with an 80‐m hub height was specifically sought out in order to maximize the portion of
the rotor swept area available for investigation while complying with restrictions imposed by the Federal Aviation Administration (FAA). Federal
Aviation Administration regulations constrain UAS flights to no greater than 400‐ft above ground level and require that visual line of sight (VLOS)
be maintained with the unmanned aircraft (UA).
2.2 | Experimental measurement
A commercial off‐the‐shelf quadcopter style UAS was instrumented with a resistor temperature detector and capacitive humidity sensor. Sensors
were mounted on a specially designed instrumentation rack located above the influence of the quadcopter's rotor‐induced flow. The fully
instrumented UA in its flight configuration is shown in Figure 1. Temperature and relative humidity measurements have an uncertainty of
±0.1 K and 0.39% to 0.5% relative humidity (depending on ambient conditions), respectively, at the 95% confidence level. To obtain measure-
ments of these 2 parameters, the UAS is manually flown, with global positioning system guidance and stability augmentation, on a prescribed flight
plan that allows for the collection of data in a stabilized hover.
Flight profiles were flown in all 3 directions, ie, downstream, spanwise, and vertical. Each flight consisted of a pair of profiles flown upstream
and downstream of the wind turbine. All flights were accomplished within a 10‐minute timeframe, and select upstream measurements were

FIGURE 1 Fully instrumented unmanned aircraft in flight configuration [Colour figure can be viewed at wileyonlinelibrary.com]
ADKINS AND SESCU 3
reflown at the conclusion of every flight in order to ensure a quasi‐static ABL. Vertical measurements were made at 2 rotor diameters upstream
and downstream of the turbine and were spaced 5‐m apart from 2 m in altitude to the turbine hub height. Vertical measurements above the hub
were spaced 10‐m apart up to 120 m. Downstream measurements were made at the lower turbine tip height every 25 m out to 300‐m
downstream and were then spaced 50‐m apart out to 500‐m downstream. Spanwise measurements, spaced 10‐m apart, were similarly made at
the lower turbine tip height out to 90 m on either side of the turbine tower.
2.3 | Numerical simulation and modeling
2.3.1 | Governing equations and LES code
In the absence of an analytical theory, numerical simulation and modeling can be used to provide qualitative and quantitative insights into complex
unsteady flows, including turbulent flows through wind farms. The numerical experiments conducted for this work were accomplished using LES.
Large‐eddy simulation produces time‐dependent, 3‐dimensional solutions to the filtered Navier‐Stokes equations representing the transport of
mass, momentum, and energy. The purpose of the filtering is to remove the small scales of turbulence that are not resolved by the grid resolution
and keep only those flow scales that carry most of the energy. Since the contribution of the missing small scales is not insignificant, modeling is
then required to take into account the effect of the small scales on the resolved scales. The filtered LES version of the Navier‐Stokes equations for
incompressible, high Reynolds number (Re) ABL flow in this investigation are as follows:
∂eui
∂xi¼ 0; (2:1)
∂eui
∂tþ euj
∂eui
∂xj¼ −
1ρ∂ep∂xi
−∂eτ ij∂xj
þ δi3geθ− θh iθ0
þ fcεij3 euj−ugj� �þ fTδi1; (2:2)
∂eϕ∂t
þ euj∂eϕ∂xj
¼ −∂π
eϕj
∂xjþ Fθ; (2:3)
where the coordinate system is defined as xi(i = 1, 2, 3) = (x, y, z) with x and y representing horizontal coordinates (x being oriented in the
streamwise direction) and z denoting the vertical coordinate. The tilde and angle brackets represent spatial filtering and the horizontal averaging,
respectively. eui i ¼ 1;2;3ð Þ is the velocity vector field with components in the streamwise, lateral, and vertical direction; eθ and θ0 are the resolved
potential temperature and the reference temperature, respectively. fc is the Coriolis parameter, g is the gravitational acceleration, δij is the
Kronecker delta, εijk is the alternating unit tensor, F θ is the temperature forcing term, and f T is a forcing term in the momentum equations that
accounts for the effect of the wind turbines on the atmospheric boundary layer (details about the actuator disk model are provided at the end of
this section). The purpose of the temperature forcing term, which is applied in the upper portion of the flow domain (just outside of the boundary
layer), is to maintain a desired thermal stratification along the vertical direction in the ABL (more details can be found in Sescu and Meneveau10,38).
In this study, the assignment of z = 0 is associated with the ground surface. Equation 2.1 is the filtered conservation of mass equation,
Equation 2.2 is the filtered momentum equation, with the Boussinesq approximation, and Equation 2.3 is the transport equation for a scalar, ϕ,
which in this study can represent either potential temperature, θ, or specific humidity, q. In the aforementioned equations, τij ¼ guiuj−eui euj is the

4 ADKINS AND SESCU
subgrid‐scale (SGS) Reynolds stress resulting from the filtering of the nonlinear terms in the original Navier‐Stokes equations, and πeϕj ¼ gujθ −euj eθ
is the SGS flux of heat or humidity resulting from the filtering of the convection terms in the scalar transport equation (both SGS quantities need
to be modeled to close the set of equations).
Unresolved scales are more isotropic in nature and are, therefore, more amenable to parameterization. Smagorinsky eddy viscosity model is
one of the most popular models and is based on the assumption of instantaneous and complete dissipation of all energy cascading downward from
the larger to the smaller scales. The SGS Reynolds stress, τij, representing the residual stress leftover following filtering, is parameterized in order to
bring about closure of the governing equations. Within Smagorinsky eddy viscosity model, the SGS Reynolds stress, τij, and the SGS scalar flux,πeϕj ,
are expressed as follows39:
τij ¼ −2νTSij and πeϕj ¼ −
νTPrT
∂eϕ∂xj
; (2:4)
respectively, where Sij is the mean strain‐rate tensor, PrT is the SGS Prandtl number, and the eddy, or turbulent, dissipative viscosity, νT, is
represented by39
νT ¼ Cslð Þ2ffiffiffiffiffiffiffiffiffiffiffiffi2SijSij
q: (2:5)
Cs is the Smagorinsky coefficient and l is a length scale at which energy is passed from the resolved to the subgrid field (hence making it a
function of the filter width, Δ).40 In this study, the magnitude of the Smagorinsky coefficient is determined dynamically using a Lagrangian
scale‐dependent model as developed by Porte‐Agel et al41 and extended to scalar transport equations by Bou‐Zeid et al.42
The system of equations of motion and scalar transport require both boundary and initial conditions. Output from a concurrent precursor
simulation with periodic boundary conditions in both horizontal directions is used to efficiently provide realistic inflow conditions to the main
simulation that include wind turbines.43 Data from the end of the turbulent ABL domain, absent of wind turbines, are written to the end of the
main domain containing the wind turbines via a blending function. This subsequently creates a turbulent inflow, through a periodic boundary
condition, for the first row of wind turbines. Large‐eddy simulation results using this precursor strategy have been shown to be in good agreement
with field data.43
Due to the Coriolis effect, the direction of the wind changes with height in the ABL, subscribing to an Ekman spiral. This presents a challenge
in trying to align the geostrophic velocity components to the desired flow direction at hub height (as required by the actuator disk model that
accounts for the effect of the rotors on the flow). In this study, the geostrophic wind is aligned with the desired hub height flow direction through
the addition of a Coriolis force term in the momentum equations. This forcing term is designed to gradually rotate the entire flow field about the
vertical axis. Once the simulation reaches a fully developed state, this term is deactivated in order to avoid unrealistic dynamics (more details can
be found in Sescu and Meneveau38).
A periodic boundary condition also wraps the main domain boundary from one lateral boundary to the other. A top boundary is established
well above the top of the simulated ABL (the ABL height is approximately 70% of the entire flow domain height), with the conditions that no flow
passes through the boundary and that all vertical gradients vanish. An effective top of the ABL, isolating it from the top boundary of the domain, is
specified via a capping inversion created by an imposed temperature gradient. A source or sink of heat is introduced above the top of the ABL
within the precursor simulation to enable the desired atmospheric stability.38 The lower boundary condition is defined by the standard logarithmic
Monin‐Obukhov similarity theory.44-47
The LES code features a Fourier‐based pseudospectral method in the horizontal directions where operations are exchanged, based on ease,
between physical and spectral space.48 A second‐order accurate, centered difference scheme is used in the vertical direction. Velocity and scalar
fields are integrated in time using a second‐order accurate Adams‐Bashforth scheme.49 Several papers offer additional details about this code.7,9,10
A wind turbine extracts kinetic energy from the wind and converts it into mechanical energy. The LES code parameterizes this energy
extraction process in the absence of turbine design specifics and models the wind turbines by the actuator (drag) disc method (ADM). The
ADM is a common, straightforward, and proven approach in numerical modeling.50,51 The model assumes inviscid flow and consequently ignores
boundary layer flow adjacent to the turbine blades. In doing so, computational expense is greatly reduced.
An ADM with rotation (ADM‐R) is implemented in these numerical studies.50,52,53 According to this parameterization, the rotor disk is divided
into a number of annulus segments of spanwise length Δr, on which the lift and drag forces are evaluated from the actual position of a certain
airfoil. The resultant lift and drag forces per rotor annulus segment of spanwise length Δr can be determined from
FL ¼ 12ρ0V
2relcL
Bc2πr
and FD ¼ 12ρ0V
2relcD
Bc2πr
;
respectively, where ρ0 is the density of the air, Vrel the relative velocity of the blade segment, cL and cD are the lift and drag coefficients of the
blade element, respectively, and r is the radial coordinate with respect to the location of the blade element. These forces are projected onto
the axial and tangential directions in order to represent the effect on the flow
FA ¼ FL cos φð Þ þ FD sin φð Þ;FT ¼ FL sin φð Þ−FD cos φð Þ;
ADKINS AND SESCU 5
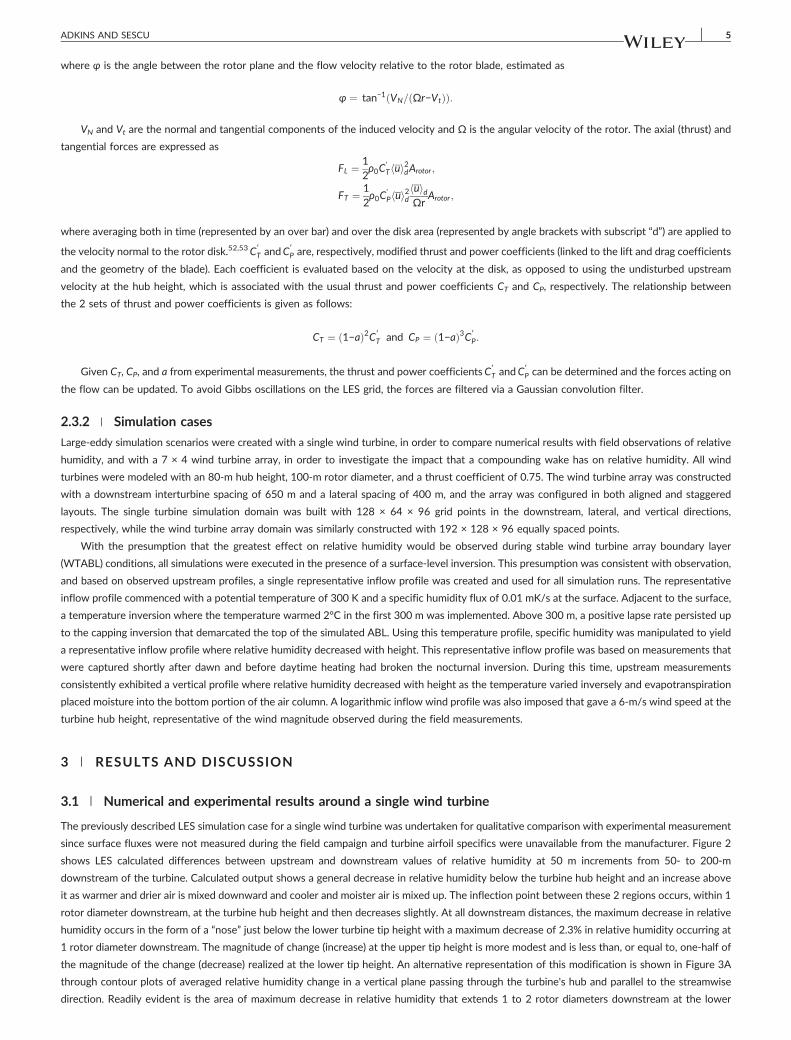
where φ is the angle between the rotor plane and the flow velocity relative to the rotor blade, estimated as
φ ¼ tan−1 VN= Ωr−Vtð Þð Þ:
VN and Vt are the normal and tangential components of the induced velocity and Ω is the angular velocity of the rotor. The axial (thrust) and
tangential forces are expressed as
FL ¼ 12ρ0C
'T uh i2dArotor ;
FT ¼ 12ρ0C
'P uh i2d
uh idΩr
Arotor ;
where averaging both in time (represented by an over bar) and over the disk area (represented by angle brackets with subscript “d”) are applied to
the velocity normal to the rotor disk.52,53C′T andC′
P are, respectively, modified thrust and power coefficients (linked to the lift and drag coefficients
and the geometry of the blade). Each coefficient is evaluated based on the velocity at the disk, as opposed to using the undisturbed upstream
velocity at the hub height, which is associated with the usual thrust and power coefficients CT and CP, respectively. The relationship between
the 2 sets of thrust and power coefficients is given as follows:
CT ¼ 1−að Þ2C′T and CP ¼ 1−að Þ3C′
P:
Given CT, CP, and a from experimental measurements, the thrust and power coefficientsC′T andC′
P can be determined and the forces acting on
the flow can be updated. To avoid Gibbs oscillations on the LES grid, the forces are filtered via a Gaussian convolution filter.
2.3.2 | Simulation cases
Large‐eddy simulation scenarios were created with a single wind turbine, in order to compare numerical results with field observations of relative
humidity, and with a 7 × 4 wind turbine array, in order to investigate the impact that a compounding wake has on relative humidity. All wind
turbines were modeled with an 80‐m hub height, 100‐m rotor diameter, and a thrust coefficient of 0.75. The wind turbine array was constructed
with a downstream interturbine spacing of 650 m and a lateral spacing of 400 m, and the array was configured in both aligned and staggered
layouts. The single turbine simulation domain was built with 128 × 64 × 96 grid points in the downstream, lateral, and vertical directions,
respectively, while the wind turbine array domain was similarly constructed with 192 × 128 × 96 equally spaced points.
With the presumption that the greatest effect on relative humidity would be observed during stable wind turbine array boundary layer
(WTABL) conditions, all simulations were executed in the presence of a surface‐level inversion. This presumption was consistent with observation,
and based on observed upstream profiles, a single representative inflow profile was created and used for all simulation runs. The representative
inflow profile commenced with a potential temperature of 300 K and a specific humidity flux of 0.01 mK/s at the surface. Adjacent to the surface,
a temperature inversion where the temperature warmed 2°C in the first 300 m was implemented. Above 300 m, a positive lapse rate persisted up
to the capping inversion that demarcated the top of the simulated ABL. Using this temperature profile, specific humidity was manipulated to yield
a representative inflow profile where relative humidity decreased with height. This representative inflow profile was based on measurements that
were captured shortly after dawn and before daytime heating had broken the nocturnal inversion. During this time, upstream measurements
consistently exhibited a vertical profile where relative humidity decreased with height as the temperature varied inversely and evapotranspiration
placed moisture into the bottom portion of the air column. A logarithmic inflow wind profile was also imposed that gave a 6‐m/s wind speed at the
turbine hub height, representative of the wind magnitude observed during the field measurements.
3 | RESULTS AND DISCUSSION
3.1 | Numerical and experimental results around a single wind turbine
The previously described LES simulation case for a single wind turbine was undertaken for qualitative comparison with experimental measurement
since surface fluxes were not measured during the field campaign and turbine airfoil specifics were unavailable from the manufacturer. Figure 2
shows LES calculated differences between upstream and downstream values of relative humidity at 50 m increments from 50‐ to 200‐m
downstream of the turbine. Calculated output shows a general decrease in relative humidity below the turbine hub height and an increase above
it as warmer and drier air is mixed downward and cooler and moister air is mixed up. The inflection point between these 2 regions occurs, within 1
rotor diameter downstream, at the turbine hub height and then decreases slightly. At all downstream distances, the maximum decrease in relative
humidity occurs in the form of a “nose” just below the lower turbine tip height with a maximum decrease of 2.3% in relative humidity occurring at
1 rotor diameter downstream. The magnitude of change (increase) at the upper tip height is more modest and is less than, or equal to, one‐half of
the magnitude of the change (decrease) realized at the lower tip height. An alternative representation of this modification is shown in Figure 3A
through contour plots of averaged relative humidity change in a vertical plane passing through the turbine's hub and parallel to the streamwise
direction. Readily evident is the area of maximum decrease in relative humidity that extends 1 to 2 rotor diameters downstream at the lower

FIGURE 3 A, Contour plots of averaged relative humidity change in a vertical plane section passing through the hub and parallel to thestreamwise direction (the legend shows changes in relative humidity compared with the upstream level). B, Contour plots of averaged relativehumidity difference in a horizontal plane section passing through the lower turbine tip height and parallel to the streamwise direction (the legendshows changes in the relative humidity from the upstream level) [Colour figure can be viewed at wileyonlinelibrary.com]
FIGURE 2 Change in large‐eddy simulation output relative humidity (upstream minus downstream) as a function of height. Calculated valuesshow a decrease in relative humidity below the turbine hub height (80 m) and an increase above
6 ADKINS AND SESCU
turbine tip height. The region of maximum increase in relative humidity is again observed at the upper turbine tip height. While the region of
maximum increase is more vertically constrained than the region of maximum decrease, it extends well downstream of the deficit region. Because
of its increased relevance due to its proximity to the surface, the region of greatest decrease in relative humidity is further analyzed in Figure 3B
by taking a continuous horizontal slice through the domain at the lower turbine tip height. Here, a split in the humidity deficit is observed to
originate approximately 1 rotor diameter downstream. A very sharp gradient borders the region of maximum decrease and makes the presence
of an expanding wake apparent.
To compare numerical simulation with experimental measurement, multiple flights around a single upstream wind turbine were accomplished
in a statically stable ABL over the course of several days. All flights took place with hub height wind speeds in the 4‐ to 7‐m/s range and
temperature inversions in the first 100 m ranged from a modest 0.5°C to a robust 4°C. Figure 4 juxtaposes LES results with a measured vertical
profile. An observed upstream hub height wind speed of 6 m/s and temperature gradient of 2°C in the first 100 m are associated with the mea-
surements that are compared with numerical output at 1 rotor diameter downstream. The same profile character is present in each curve; namely,
an inflection in the sign of the relative humidity change at, or slightly below, the hub height and a similar “nose‐like” feature in the region of
greatest relative humidity decrease. Despite varied inversion strengths and hub height wind speeds for other flights, all of the resulting vertical
profiles that calculate the change in relative humidity exhibited the same character and show very good qualitative agreement with LES results.
Downstream measurements and LES output were obtained in order to investigate how relative humidity recovers with downstream distance.
Measurements were made at the lower turbine tip height and along the turbine centerline out to 500 m. Flights were limited to 500‐m
downstream in order to comply with FAA regulations mandating that VLOS be maintained with the UA. Both LES output and calculation of

FIGURE 4 Large‐eddy simulation (LES) output and observed changes in relative humidity (upstream minus downstream), as a function of height,at 100‐m downstream
ADKINS AND SESCU 7
measured differences are shown in Figure 5. The observed upstream conditions for the associated UA flight had a slightly smaller hub height wind
speed, 5 m/s, but a stronger inversion, 4°C in the first 100 m, relative to the LES test scenario. However, similar to the vertical profiles, each curve
exhibits the same character that suggests a sharp drop in relative humidity immediately aft of the turbine and a more gradual downstream
recovery. The greater magnitude of change in measured relative humidity is consistent with the greater strength of the observed inversion.
Measurement also supports the previous LES observations that the maximum decrease in relative humidity is observed at approximately 1 rotor
diameter downstream.
Spanwise measurements, displayed in Figure 6 alongside analogous LES output, were similarly made at the lower turbine tip height and 2 rotor
diameters downstream. The flight occurred within a surface‐level temperature inversion comparable with the LES test scenario but with a slightly
slower hub height wind speed of 5 m/s. Of particular interest is the similar asymmetry present in both the LES results and experimental measure-
ments. This asymmetry is the hallmark of the split humidity “wake” evident in the contour plot of Figure 3B. Each investigation shows that the
maximum decrease in relative humidity is located just to the right of the wake's centerline. Both the LES and measurements suggest that this
deficit remains greater across all of the right‐hand side. This asymmetry is presumed to be the result of the turbine blades' descent on the
right‐hand side of its clockwise rotation and the resulting delivery of warmer and drier air downward.
While good qualitative agreement exists between the numerical and observed data, small quantitative differences can, at least in part, be
attributed to a number of factors, most of which deal with modeling assumptions. Numerical simulations were constructed with parameterized
wind turbines that use representative thrust and power coefficients from the literature52 (eg, CT = 0.75 and CT = 0.34). With these values, or
turbine blade specifics, unavailable from the turbine manufacturers, the only turbine characteristics directly matched were rotor diameter and
hub height. Simulated inflow lapse rates for both temperature and humidity were smoothed and made to be representative of snapshot
FIGURE 5 Large‐eddy simulation (LES) output and observed changes in relative humidity (upstream minus downstream) as a function ofdownstream distance at the lower turbine tip height

FIGURE 6 Large‐eddy simulation (LES) output and observed changes in relative humidity (upstream minus downstream) as a function ofspanwise distance at the lower turbine tip height and 2 rotor diameters downstream
8 ADKINS AND SESCU
measurements taken during a given suite of flight profiles. Finally, while field measurements were made at a locale selected for having
homogeneous cultivar type, surface moisture characteristics, and topography, surface‐level flux measurements were not made but were assumed
to be uniform within the simulation. However, even with these assumptions, all distinctive characteristics related to changes in relative humidity
observed in field measurements are also displayed by the LES.
3.2 | Numerical and experimental results within a wind turbine array
To investigate the impact that compounding wakes have on changes to relative humidity within a WTABL, the numerical investigation was
extended to a 7 × 4 wind turbine array. Current FAA regulations that mandate that UA must be kept within VLOS constrained the investigation
to this strategy. However, the excellent agreement between measured and numerical results around a single wind turbine afford a high degree of
confidence in the LES. While analysis takes place for both an aligned and staggered configuration, because a periodic boundary condition is
imposed in the lateral direction the wind turbine array is taken to be infinitely wide. Analogous to the LES test scenario for a single wind turbine,
a thermal stratification of 2°C in the first 300 m and a hub height wind speed of 6 m/s were again used for the inflow condition.
Since scalars satisfy transport equations, it is expected that the main contributor to the variation of relative humidity, or potential tempera-
ture, within the wind farm is the momentum flux, which is affected considerably by the rotating rotors. These modifications bring about nuanced
changes to relative humidity in all 3 spatial directions throughout the array. Figure 7 illustrates these changes with contour plots in vertical slices
taken across the flow domain at fixed downstream distances. As observations and simulated results around a single wind turbine previously indi-
cated, enhanced vertical mixing, in the presence of a positive humidity lapse rate, delivers moister and cooler near‐surface air upward and brings
drier and warmer air aloft downward. Upstream vertical cross sections in the domain display how this air aloft is first brought down by the
descending blades on the right‐hand side, and the near‐surface air is delivered upward on the left‐hand side with the clockwise rotation of the
wind turbine. Subsequent streamwise slices through the domain illustrate how these areas of relative humidity change increase in magnitude while
growing predominately in the lateral dimension. The region of increased relative humidity aloft grows unencumbered from left to right near the
upper turbine tip height. The region of decreased relative humidity near the lower turbine tip height develops with interference from the under-
lying surface. Consequently, as the area of decreased relative humidity grows, the region is broken apart by the vortices' interaction with the
FIGURE 7 Contour plots of time‐averaged relative humidity difference in vertical plane slices at fixed downstream distances: A, aligned turbinearray; B, staggered array (the legend shows changes in the relative humidity with respect to the upstream level) [Colour figure can be viewed atwileyonlinelibrary.com]

ADKINS AND SESCU 9
ground. The previously observed tendency for the humidity “wake” to split at the lower turbine tip height in both experimental measurements and
LES results around a single wind turbine is the result of this interaction. Greater humidity drops occur within these 2 “arms” that grow in all direc-
tions, showcasing the expansion and accumulation of wakes. However, when the array is fully transited, a broad and somewhat continuous volume
of air with lower relative humidity exists below the more continuous mass of air with higher humidity. While each configuration portrays similar
flow dynamics and changes to relative humidity, a reduction in the volume of air with modified relative humidity is realized in both the lateral and
vertical directions for the staggered configuration.
While Figure 7 provides ready insight into the flow dynamics in the spanwise and downstream directions, dynamics in the vertical direction
are more easily ascertained from Figure 8, which displays an uplifting that is associated with both the region of decreased and increased relative
humidity. The ability of a portion of the largest turbulent eddies to mix upward, uninhibited by the surface, results in more significant uplifting of
the region of increased relative humidity. This air rises well above the upper edge of the turbine disk by the fourth row. Turbulent eddies that are
more inhibited by the ground bring about more modest uplifting of the region of decreased relative humidity. Interestingly, both Figures 7 and 8
indicate that the region of decreased humidity reattaches itself to the ground by the fifth row.
Against the backdrop of the previous qualitative assessment, a quantitative comparison is now made in terms of the streamwise, lateral, and
vertical distributions of averaged relative humidity. Because it appears that the cumulative increase or decrease of humidity in the downstream
does not occur at a constant elevation, Figures 9 and 10 plot distributions of laterally averaged minimum and maximum humidity (taken in the
vertical direction) that are calculated as follows:
Δqmin xð Þ ¼ 1y2−y1ð Þ∫
y2y1
min0<z<zh
qup x; y; zð Þ−q x; y; zð Þ� �dy;
Δqmax xð Þ ¼ 1y2−y1ð Þ∫
y2y1max0<z<zh
qup x; y; zð Þ−q x; y; zð Þ� �dy;
FIGURE 8 Isosurfaces of decreased (blue)and increased (red) relative humidity for analigned single column of turbines (streamwiselength scaled by 1/5) [Colour figure can beviewed at wileyonlinelibrary.com]
FIGURE 9 Variation of the laterallyaveraged relative humidity in the streamwisedirection: A, decrease (below the hub); B,increase (above the hub)

FIGURE 10 Variation of the laterallyaveraged relative humidity in the streamwisedirection for the aligned configuration: A,below the hub; B, above the hub
10 ADKINS AND SESCU
where y1and y2 are the coordinates of lateral boundaries, zh is the height of the domain, and qup is the humidity 2 diameters upstream of the first
row of turbines. Figure 9 compares the change in the relative humidity between the aligned and staggered array configuration. Inspection of this
figure reveals that the aligned configuration is more effective in altering the decrease of relative humidity below the hub height (Figure 9A) and
less effective in altering the relative humidity near the turbine tip height (Figure 9B). Apparently, however, both the decrease and increase in rel-
ative humidity do not seem to attain a fully developed state. Presumably, this could be further investigated with an extension of the domain in the
FIGURE 11 Variation of relative humiditywith lateral direction for the alignedconfiguration, (profile extracted 2 rotordiameters downstream of the noted rotor): A,decrease (below the hub); B, increase (abovethe hub) [Colour figure can be viewed atwileyonlinelibrary.com]

ADKINS AND SESCU 11
downstream direction and an increase in the number of rows of turbines and grid points. With a greater interest in the modification of near‐sur-
face relative humidity and observing that an aligned turbine array is more effective at bringing about near‐surface changes to relative humidity,
Figure 10 considers the distribution of the integrated maximum and minimum humidity in an aligned array across disparate thermal stratifications.
In this figure, the baseline thermal stratification of 2°C in the first 300 m is juxtaposed with a weaker stratification of just 1°C. Thermal stratifi-
cation does seem to have a substantive impact on the humidity development in the downstream direction. By increasing the thermal stratification,
both the decrease and increase in humidity becomes greater in magnitude. This suggests that the wind turbines' enhancement of vertical mixing
plays a larger role when the ABL is more strongly thermally stratified and, consequently, less well mixed.
The variation of humidity in the lateral and vertical directions are considered in Figures 11 to 14. As a function of lateral position, the
variation of maximum and minimum relative humidity is plotted in Figures 11 and 12 for each array configuration. Regardless of the configura-
tion, the continued lateral expansion associated with an accumulating wake is apparent, along with an increase in the magnitude of change with
downstream distance. As might be anticipated, the accumulated wake from the staggered configuration does not grow as fast and is therefore
more constrained in its lateral dimension. Wake expansion is more evident for the aligned configuration. This supports the previous qualitative
inference, extracted from Figure 7, of a broader and more continuous area of decreased relative humidity near the ground within an
aligned array.
FIGURE 12 Variation of relative humiditywith lateral direction for the staggeredconfiguration, (profile extracted 2 rotordiameters downstream of the noted rotor): A,decrease (below the hub); B, increase (abovethe hub) [Colour figure can be viewed atwileyonlinelibrary.com]
FIGURE 13 Variation of the relativehumidity with vertical direction for the alignedconfiguration: A, left side of the wake; B, rightside of the wake [Colour figure can be viewedat wileyonlinelibrary.com]

FIGURE 14 Variation of the relativehumidity with vertical direction for thestaggered configuration: A, left side of thewake; B, right side of the wake [Colour figurecan be viewed at wileyonlinelibrary.com]
12 ADKINS AND SESCU
Analogously, the previously observed uplifting associated with the regions of increased and decreased relative humidity (Figure 8) is also sup-
ported in the profiles of averaged relative humidity as a function of vertical position. Figures 13 and 14 plot these vertical profiles of averaged
relative humidity at discrete downstream locations. These vertical profiles are plotted not in the center of the wake but in 2 lateral locations
to the left and right sides of the rotor. All vertical profiles are extracted at 2 rotor diameters downstream from the rotor noted in the legend.
Besides portraying uplift, these figures indicate that the magnitude of relative humidity increase above the rotors is approximately the same
between the left and right sides of the wake; however, there is considerable disparity between the magnitude of decrease between the left
and right sides below the hub height. With the greater magnitude of change found on the right‐hand side of the wake, this disparity is once again
attributed to the warmer and drier air being brought down by the descending blade on the right‐hand side of the turbine disk and the flow's
subsequent interaction with the ground. The altitude associated with the minimum decrease is also significantly lower on the left‐hand side of
the wake. Further, Figures 13 and 14 also suggest that the right‐side inflection point, demarcating the regions of decreased and increased relative
humidity, is slightly above the hub height (between z = 90 m and z = 110 m) while the location of the inflection point on the left side of the wake
is not as clear.
4 | CONCLUSIONS
The expense associated with field campaigns and limitations of previous measurement techniques have stymied the number of observational data
sets examining changes to near‐surface meteorology within WTABLs. This is especially true of data sets with high spatial resolution.
Consequently, the majority of previous investigations into the impact that wind turbines have on near‐surface meteorology come in the form
of unsubstantiated LES. This study makes use of an instrumented UAS to gather high resolution in situ field measurements of relative humidity
within a state‐of‐the‐art wind farm and compares this data with numerical experiments conducted using LES. Vertical, downstream, and spanwise
measurements made over the course of several days around a single wind turbine show very good qualitative agreement with LES results.
Large‐eddy simulation results show relative humidity decreases as great as 2.3% downstream of the turbine while experimental measurement
captured decreases as great as 3%.
To analyze the accumulated change to relative humidity by compounding wakes, the numerical investigation was extended to a 7 × 4 wind
turbine array. These results show a somewhat uniform and continuous increase in relative humidity at, and above, the upper turbine tip height
and a more complex decrease in relative humidity below the turbine hub height. Each of these areas of relative humidity change grows
predominately, with downstream distance, in the lateral direction while more slowly broadening in all directions as a result of wake expansion.
FUNDING
This research did not receive any specific grant from funding agencies in the public, commercial, or not‐for‐profit sectors. The unmanned aerial
system was provided by Embry‐Riddle Aeronautical University.
ORCID
Kevin A. Adkins http://orcid.org/0000-0003-4617-8114
REFERENCES
1. U.S. Dept. Of Energy. (2016). International Energy Outlook 2016. www.eia.gov/outlooks/ieo. USEI Administration, Washington D.C.
2. Roy SB. Simulating impacts of wind farms on local hydrometeorology. J Wind Eng Ind Aerodyn. 2011;99(4):491‐498.

ADKINS AND SESCU 13
3. Smith CM, Barthelmie RJ, Pryor SC. In situ observations of the influence of a large onshore wind farm on near‐surface temperature, turbulence intensityand wind speed profiles. Environ Res Lett. 2013;8(3):034006.
4. Harris RA, Liming Z, Geng X. Satellite observations of wind farm impacts on nocturnal land surface temperature in Iowa. Remote Sens (Basel).2014;6(12):12234‐12246.
5. Roy SB, Traiteur JJ, Schneider SH. Impacts of wind farms on surface air temperatures. PNAS. 2010;107:17899‐17904.
6. Rajewski DA, Takle ES, Lundquist JK, et al. Crop wind energy experiment (CWEX). Bull Am Meteorol Soc. 2013;94(5):655‐672.
7. Calaf M, Meneveau C, Meyers J. Large eddy simulation study of fully developed wind‐turbine array boundary layers. Phys Fluids. 2010;22(1):015110.
8. Abkar M, Porte‐Agel F. Mean and turbulent kinetic energy budgets inside and above very large wind farms under conventionally‐neutral condition.Renew Energy. 2014;70:142‐152.
9. Calaf M, Parlange MB, Meneveau C. Large eddy simulation study of scalar transport in fully developed wind‐turbine Array boundary layers. Phys Fluids.2011;23(12):126603.
10. Sescu A, Meneveau C. Large‐eddy simulation and single‐column modeling of thermally stratified wind turbine arrays for fully developed, stationaryatmospheric conditions. J Atmos Oceanic Tech. 2015;32(6):1144‐1162.
11. Stoll R, Porté‐Agel F. Surface heterogeneity effects on regional‐scale fluxes in stable boundary layers: surface temperature transitions. J Atmos Sci.2009;66(2):412‐431.
12. Roy SB, Pacala SW, Walko RL. Can large wind farms affect local meteorology? J Geophys Res. 2004;109(19):D19101.
13. Henschen M, Herrholtz B, Rhudy L, et al. Do wind turbines affect weather conditions?: a case study in Indiana. J Purdue Undergr Res. 2011;1:22‐29.
14. Lauridsen, MJ (2012). Impact of wind turbine wakes on the atmospheric surface layer: decrease in stability and dew duration. Department of Geologicaland Atmospheric Sciences, Iowa State University.
15. Konrad TG, Hill ML, Rowland JR, Meyer JH. A small, radio‐controlled aircraft as a platform for meteorological sensors. J Hopkins APL Tech Dig.1970;10:11‐19.
16. Reuder, J, Brisset, P, Jonassen, M, Müller, M and Mayer, S (2008). SUMO: a small unmanned meteorological observer for atmospheric boundary layerresearch. IOP Conference Series: Earth & Environmental Science 1, no. 1: 1.
17. Lawrence DA, Balsley BB. High‐resolution atmospheric sensing of multiple atmospheric variables using the DataHawk small airborne measurementsystem. J Atmos Oceanic Tech. 2013;30(10):2352‐2366.
18. Cassano JJ. Observations of atmospheric boundary layer temperature profiles with a small unmanned aerial vehicle. Antarct Sci. 2014;26(2):205‐213.
19. Martin S, Bange J, Beyrich F. Meteorological profiling of the lower troposphere using the research UAV “M2AV Carolo”. Atmos Meas Tech.2011;4(4):705‐716.
20. Kroonenberg A, Martin S, Beyrich F, Bange J. Spatially‐averaged temperature structure parameter over a heterogeneous surface measured by anunmanned aerial vehicle. Bound‐Lay Meteorol. 2012;142(1):55‐77.
21. Dias N, Gonçalves J, Freire L, Hasegawa T, Malheiros A. Obtaining potential virtual temperature profiles, entrainment fluxes, and spectra from miniunmanned aerial vehicle data. Bound‐Lay Meteorol. 2012;145(1):93‐111.
22. Reineman BD, Lenain L, Statom NM, Melville WK. Development and testing of instrumentation for UAV‐based flux measurements within terrestrial andmarine atmospheric boundary layers. J Atmos Oceanic Tech. 2013;30(7):1295‐1319.
23. Balsley B, Lawrence D, Woodman R, Fritts D. Fine‐scale characteristics of temperature, wind, and turbulence in the lower atmosphere (0‐1,300 m) overthe south Peruvian coast. Bound‐Lay Meteorol. 2013;147(1):165‐178.
24. Jonassen MO, Ólafsson H, Águstsson H, Rognvaldsson O, Reuder J. Improving high resolution numerical weather simulations by assimilating data froman unmanned aerial system. Mon Weather Rev. 2012;140(11):3734‐3756.
25. Wainwright C, Bonin T, Chilson P, Gibbs J, Fedorovich E, Palmer R. Methods for evaluating the temperature structure‐function parameter usingunmanned aerial systems and large‐eddy simulation. Bound‐Lay Meteorol. 2015;155(2):189‐208.
26. Mayer S, Sandvik A, Jonassen M, Reuder J. Atmospheric profiling with the UAS sumo: a new perspective for the evaluation of fine‐scale atmosphericmodels. Meteorol Atmos Phys. 2012a;116(1/2):15‐26.
27. Reuder J, Jonassen M, Ólafsson H. The small unmanned meteorological observer sumo: recent developments and applications of a micro‐UAS foratmospheric boundary layer research. Acta Geophys. 2012;60(5):1454‐1473.
28. Mayer S, Jonassen M, Sandvik A, Reuder J. Profiling the Arctic stable boundary layer in Advent Valley, Svalbard: measurements and simulations.Bound‐Lay Meteorol. 2012b;143(3):507‐526.
29. Jonassen M, Tisler P, Altstadter B, et al. Application of remotely piloted Aircraft Systems in Observing the atmospheric boundary layer over Antarcticsea ice in winter. Polar Res. 2015;34(1).
30. Bonin T, Chilson P, Zielke B, Fedorovich E. Observations of the early evening boundary‐layer transition using a small unmanned aerial system.Bound‐Lay Meteorol. 2013;146(1):119‐132.
31. Mortley DG, Bonsi CK, Loretan PA, Hill WA, Morris CE. Relative humidity influences yield, edible biomass, and linear growth rate of sweetpotato.HortSci. 1994;29:609‐610.
32. Pareek OP, Sivanayagam T, Heydecker W (1969). Humidity: a major factor in crop plant growth. Rep. School of Agriculture, University of Nottingham,pp. 92–95.
33. Ford MA, Thorne GN. Effects of atmospheric humidity on plant growth. Ann Bot. 1974;38(2):441‐452.
34. Tibbitts TW, Bottenberg G. Growth of lettuce under controlled humidity levels. J Amer Soc Hort Sci. 1976;101(1):70‐73.
35. Tibbitts TW. Humidity and plants. Bioscience. 1979;29(6):358‐363.
36. Grange RI, Hand DW. A review of the effects of atmospheric humidity on the growth of horticultural crops. Eur J Hortic Sci. 1987;62(2):125‐134.
37. Adkins K, Sescu A. Differential mapping of relative humidity in the near‐wake of a wind turbine using an instrumented unmanned aerial system. Int JGreen Energy. 2017;14(10):845‐860.
14 ADKINS AND SESCU
38. Sescu A, Meneveau C. A control algorithm for statistically stationary large‐eddy simulations of thermally stratified boundary layers. Q J Roy MeteorolSoc. 2014;140(683):2017‐2022.
39. Pope S. Turbulent Flows. New Delhi: Cambridge University Press; 2008.
40. Blazek J. Computational Fluid Dynamics: Principles and Applications. second ed. London: Elsevier; 2005.
41. Porte‐Agel F, Meneveau C, Parlange MB. A scale‐dependent dynamic model for large‐eddy simulations: application to a neutral atmospheric boundarylayer. J Fluid Mech. 2000;415:261‐284.
42. Bou‐Zeid E, Meneveau C, Parlange M. A scale‐dependent Lagrangian dynamic model for large eddy simulation of complex turbulent flows. Phys Fluids.2005;17(2):025105.
43. Stevens RJAM, Graham J, Meneveau C. A concurrent precursor inflow method for large eddy simulations and applications to finite length wind farms.Renew Energy. 2014;68:46‐50.
44. Businger JA, Wyngaard JC, Izumi Y, Bradley EF. Flux‐profile relationships in the atmospheric surface layer. J Atmos Sci. 1971;28(2):181‐189.
45. Moeng CH. A large‐eddy simulation model for the study of planetary boundary‐layer turbulence. J Atmos Sci. 1984;41(13):2052‐2062. https://doi.org/10.1175/1520‐0469 (1984)041,2052:ALESMF.2.0.CO;2
46. Monin A, Obukhov A. Basic laws of turbulent mixing in the surface layer of the atmosphere. Contrib Geophys Inst Acad Sci USSR. Tr Akad Nauk SSSRGeofiz Inst. 1954;24:163‐187.
47. Obukhov A. Turbulence in an atmosphere with a non‐uniform temperature. Bound‐Layer Meteor. 1971;2(1):7‐29. https://doi.org/10.1007/BF00718085
48. Orszag S. Numerical simulation of incompressible flows within simple boundaries: accuracy. J Fluid Mech. 1971;49(01):75‐112.
49. Miller R. Introduction to Differential Equations. Second ed. Englewood Cliffs, NJ: Prentice‐Hall, Inc; 1991.
50. Wu YT, Porté‐Agel F. Large‐eddy simulation of wind‐turbine wakes: evaluation of turbine parametrizations. Bound‐Lay Meteorol. 2011;138(3):345‐366.
51. Kulunk, E. (2011). Aerodynamics of Wind Power. Fundamental and Advanced Topics in Wind Power.
52. Meyers J and Meneveau C (2010). Large eddy simulations of large wind‐turbine arrays in the atmospheric boundary layer, AIAA‐Paper 2010–827, 48thAIAA Aerospace Sciences Meeting Including the New Horizons Forum and Aerospace Exposition 4–7 January 2010, Orlando, Florida.
53. Meyers J, Meneveau C. Flow visualization using momentum and energy transport tubes and applications to turbulent flow in wind farms. J Fluid Mech.2013;715:335‐358.
How to cite this article: Adkins KA, Sescu A. Analysis of near‐surface relative humidity in a wind turbine array boundary layer using an
instrumented unmanned aerial system and large‐eddy simulation. Wind Energy. 2018;1–14. https://doi.org/10.1002/we.2220