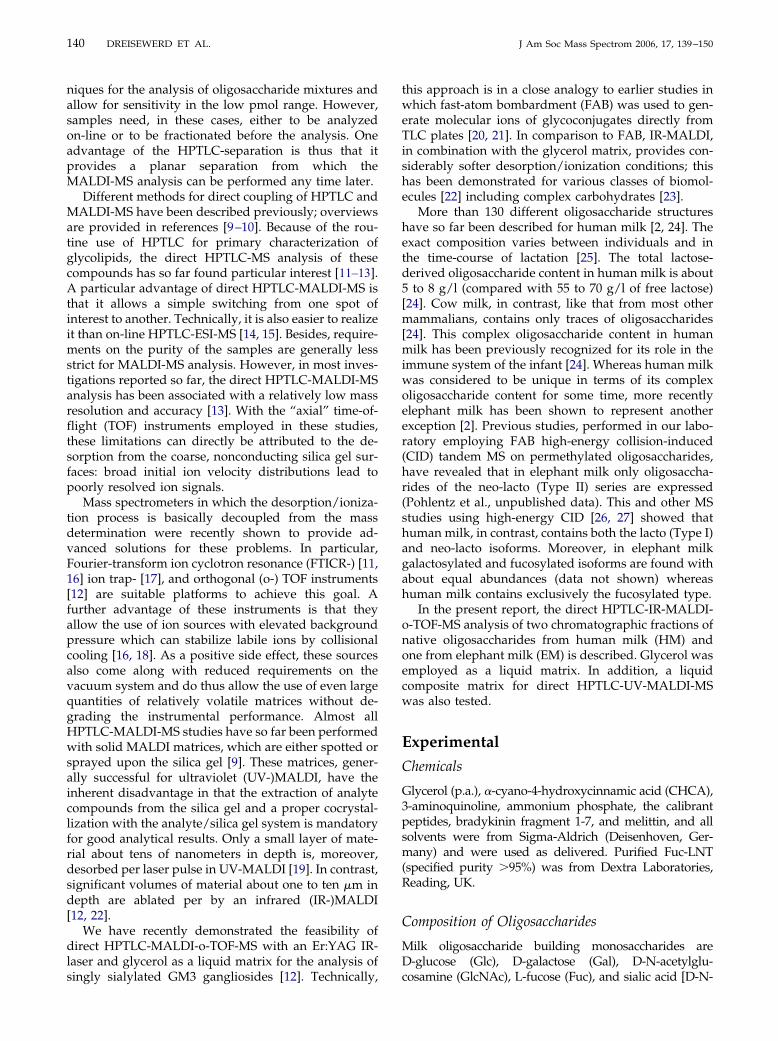
Analysis of Native Milk Oligosaccharides Directly from … disadvantage in that the extraction of...
12
Analysis of Native Milk Oligosaccharides Directly from Thin-Layer Chromatography Plates by Matrix-Assisted Laser Desorption/ Ionization Orthogonal-Time-of-Flight Mass Spectrometry with a Glycerol Matrix Klaus Dreisewerd, Stefanie Kölbl, and Jasna Peter-Katalinic ´ Institute of Medical Physics and Biophysics, Westfälische-Wilhelms Universität Münster, Münster, Germany Stefan Berkenkamp Sequenom GmbH, Hamburg, Germany Gottfried Pohlentz Institute of Medical Physics and Biophysics, Westfälische-Wilhelms Universität Münster, Münster, Germany We have recently presented a new method for direct coupling of high-performance thin-layer chromatography (HPTLC) with matrix-assisted laser desorption/ionization mass spectrome- try (MALDI-MS), illustrated by the analysis of a complex ganglioside mixture (Dreisewerd et al., Anal. Chem. 2005, 77, 4098). In the current communication, an adaptation of this procedure to mixtures of native oligosaccharides from human and from elephant milk is described. The key features in this method are (1) glycerol as a liquid matrix, to provide a homogeneous wetting of the silica gel and a simple and fast MALDI preparation protocol, (2) an infrared (IR) laser for volume material ablation and particular soft desorption/ionization conditions, and (3) an orthogonal time-of-flight mass spectrometer for a high mass accuracy, independent of any irregularity of the silica gel surface. Chromatographic “mobility profiles” were determined by scanning the laser beam across the analyte bands. The current limit of detection for the MS analysis was determined to 10 pmol of individual oligosaccharides spotted for chromatog- raphy. A liquid composite matrix, containing glycerol and the ultraviolet (UV-)MALDI matrix -cyano-4-hydroxycinnamic acid, allows a direct HPTLC-MALDI-MS analysis with a 337 nm-UV laser as well. Compared to the IR-MALDI mode, the analytical sensitivity in UV-MALDI was found to be lower by one order of magnitude, whereas unspecific analyte ion fragmentation as well as adduct formation was found to be more extensive. (J Am Soc Mass Spectrom 2006, 17, 139 –150) © 2006 American Society for Mass Spectrometry T he combination of robust and low-cost, but rather low-resolving high-performance thin-layer chro- matography (HPTLC) with mass spectrometry (MS) systems for the precise analysis of samples of particular interest offers an attractive hybrid technique. HPTLC is frequently used for separation and partial characterization of neutral and acidic oligosaccharides from mixtures [1, 2]. The low resolving power of the method, however, does not usually permit differentia- tion of species of similar structure and “mobility”, and the chromatograms serve mostly for visualization and as a finger-print. Both electrospray ionization (ESI [3]) and matrix-assisted laser desorption/ionization (MALDI [4]) mass spectrometry can be applied for analysis of oligosaccharides from solutions [5, 6]. Either based on a high mass accuracy alone in the standard MS mode [7] or by tandem MS analysis [8], these techniques can in many cases provide an unambiguous identifica- tion of the samples. However, for analysis of oligosac- charide mixtures derived from a single core structure by extension with single monosaccharide units, e.g., fucose, it can often not be differentiated whether an ion detected by MS 1 is a molecular ion species or an in-source cleavage product. By separation of the mix- tures by HPTLC into defined bands, before the MS analysis from distinct positions, this valuable informa- tion can be obtained. Similarly, liquid chromatography (LC-) ESI- or LC-MALDI-MS can provide this informa- tion. These latter methods constitute the standard tech- Published online January 10, 2006 Address reprint requests to Dr. Klaus Dreisewerd, Institute of Medical Physics and Biophysics, University of Münster, Robert Koch Strasse 31, D-48149 Münster, Germany. E-mail: [email protected] © 2006 American Society for Mass Spectrometry. Published by Elsevier Inc. Received August 15, 2005 1044-0305/06/$32.00 Revised September 30, 2005 doi:10.1016/j.jasms.2005.10.003 Accepted October 7, 2005
Transcript of Analysis of Native Milk Oligosaccharides Directly from … disadvantage in that the extraction of...

Analysis of Native Milk OligosaccharidesDirectly from Thin-Layer ChromatographyPlates by Matrix-Assisted Laser Desorption/Ionization Orthogonal-Time-of-Flight MassSpectrometry with a Glycerol Matrix
Klaus Dreisewerd, Stefanie Kölbl, and Jasna Peter-KatalinicInstitute of Medical Physics and Biophysics, Westfälische-Wilhelms Universität Münster, Münster, Germany
Stefan BerkenkampSequenom GmbH, Hamburg, Germany
Gottfried PohlentzInstitute of Medical Physics and Biophysics, Westfälische-Wilhelms Universität Münster, Münster, Germany
We have recently presented a new method for direct coupling of high-performance thin-layerchromatography (HPTLC) with matrix-assisted laser desorption/ionization mass spectrome-try (MALDI-MS), illustrated by the analysis of a complex ganglioside mixture (Dreisewerd etal., Anal. Chem. 2005, 77, 4098). In the current communication, an adaptation of this procedureto mixtures of native oligosaccharides from human and from elephant milk is described. Thekey features in this method are (1) glycerol as a liquid matrix, to provide a homogeneouswetting of the silica gel and a simple and fast MALDI preparation protocol, (2) an infrared (IR)laser for volume material ablation and particular soft desorption/ionization conditions, and (3)an orthogonal time-of-flight mass spectrometer for a high mass accuracy, independent of anyirregularity of the silica gel surface. Chromatographic “mobility profiles” were determined byscanning the laser beam across the analyte bands. The current limit of detection for the MSanalysis was determined to �10 pmol of individual oligosaccharides spotted for chromatog-raphy. A liquid composite matrix, containing glycerol and the ultraviolet (UV-)MALDI matrix�-cyano-4-hydroxycinnamic acid, allows a direct HPTLC-MALDI-MS analysis with a 337nm-UV laser as well. Compared to the IR-MALDI mode, the analytical sensitivity inUV-MALDI was found to be lower by one order of magnitude, whereas unspecific analyte ionfragmentation as well as adduct formation was found to be more extensive. (J Am Soc MassSpectrom 2006, 17, 139–150) © 2006 American Society for Mass Spectrometry
The combination of robust and low-cost, but ratherlow-resolving high-performance thin-layer chro-matography (HPTLC) with mass spectrometry
(MS) systems for the precise analysis of samples ofparticular interest offers an attractive hybrid technique.HPTLC is frequently used for separation and partialcharacterization of neutral and acidic oligosaccharidesfrom mixtures [1, 2]. The low resolving power of themethod, however, does not usually permit differentia-tion of species of similar structure and “mobility”, andthe chromatograms serve mostly for visualization andas a finger-print. Both electrospray ionization (ESI
Published online January 10, 2006Address reprint requests to Dr. Klaus Dreisewerd, Institute of Medical
Physics and Biophysics, University of Münster, Robert Koch Strasse 31,D-48149 Münster, Germany. E-mail: [email protected]© 2006 American Society for Mass Spectrometry. Published by Elsevie1044-0305/06/$32.00doi:10.1016/j.jasms.2005.10.003
[3]) and matrix-assisted laser desorption/ionization(MALDI [4]) mass spectrometry can be applied foranalysis of oligosaccharides from solutions [5, 6]. Eitherbased on a high mass accuracy alone in the standard MSmode [7] or by tandem MS analysis [8], these techniquescan in many cases provide an unambiguous identifica-tion of the samples. However, for analysis of oligosac-charide mixtures derived from a single core structureby extension with single monosaccharide units, e.g.,fucose, it can often not be differentiated whether an iondetected by MS1 is a molecular ion species or anin-source cleavage product. By separation of the mix-tures by HPTLC into defined bands, before the MSanalysis from distinct positions, this valuable informa-tion can be obtained. Similarly, liquid chromatography(LC-) ESI- or LC-MALDI-MS can provide this informa-
tion. These latter methods constitute the standard tech-r Inc. Received August 15, 2005Revised September 30, 2005
Accepted October 7, 2005
140 DREISEWERD ET AL. J Am Soc Mass Spectrom 2006, 17, 139–150
niques for the analysis of oligosaccharide mixtures andallow for sensitivity in the low pmol range. However,samples need, in these cases, either to be analyzedon-line or to be fractionated before the analysis. Oneadvantage of the HPTLC-separation is thus that itprovides a planar separation from which theMALDI-MS analysis can be performed any time later.
Different methods for direct coupling of HPTLC andMALDI-MS have been described previously; overviewsare provided in references [9 –10]. Because of the rou-tine use of HPTLC for primary characterization ofglycolipids, the direct HPTLC-MS analysis of thesecompounds has so far found particular interest [11–13].A particular advantage of direct HPTLC-MALDI-MS isthat it allows a simple switching from one spot ofinterest to another. Technically, it is also easier to realizeit than on-line HPTLC-ESI-MS [14, 15]. Besides, require-ments on the purity of the samples are generally lessstrict for MALDI-MS analysis. However, in most inves-tigations reported so far, the direct HPTLC-MALDI-MSanalysis has been associated with a relatively low massresolution and accuracy [13]. With the “axial” time-of-flight (TOF) instruments employed in these studies,these limitations can directly be attributed to the de-sorption from the coarse, nonconducting silica gel sur-faces: broad initial ion velocity distributions lead topoorly resolved ion signals.
Mass spectrometers in which the desorption/ioniza-tion process is basically decoupled from the massdetermination were recently shown to provide ad-vanced solutions for these problems. In particular,Fourier-transform ion cyclotron resonance (FTICR-) [11,16] ion trap- [17], and orthogonal (o-) TOF instruments[12] are suitable platforms to achieve this goal. Afurther advantage of these instruments is that theyallow the use of ion sources with elevated backgroundpressure which can stabilize labile ions by collisionalcooling [16, 18]. As a positive side effect, these sourcesalso come along with reduced requirements on thevacuum system and do thus allow the use of even largequantities of relatively volatile matrices without de-grading the instrumental performance. Almost allHPTLC-MALDI-MS studies have so far been performedwith solid MALDI matrices, which are either spotted orsprayed upon the silica gel [9]. These matrices, gener-ally successful for ultraviolet (UV-)MALDI, have theinherent disadvantage in that the extraction of analytecompounds from the silica gel and a proper cocrystal-lization with the analyte/silica gel system is mandatoryfor good analytical results. Only a small layer of mate-rial about tens of nanometers in depth is, moreover,desorbed per laser pulse in UV-MALDI [19]. In contrast,significant volumes of material about one to ten �m indepth are ablated per by an infrared (IR-)MALDI[12, 22].
We have recently demonstrated the feasibility ofdirect HPTLC-MALDI-o-TOF-MS with an Er:YAG IR-laser and glycerol as a liquid matrix for the analysis of
singly sialylated GM3 gangliosides [12]. Technically,this approach is in a close analogy to earlier studies inwhich fast-atom bombardment (FAB) was used to gen-erate molecular ions of glycoconjugates directly fromTLC plates [20, 21]. In comparison to FAB, IR-MALDI,in combination with the glycerol matrix, provides con-siderably softer desorption/ionization conditions; thishas been demonstrated for various classes of biomol-ecules [22] including complex carbohydrates [23].
More than 130 different oligosaccharide structureshave so far been described for human milk [2, 24]. Theexact composition varies between individuals and inthe time-course of lactation [25]. The total lactose-derived oligosaccharide content in human milk is about5 to 8 g/l (compared with 55 to 70 g/l of free lactose)[24]. Cow milk, in contrast, like that from most othermammalians, contains only traces of oligosaccharides[24]. This complex oligosaccharide content in humanmilk has been previously recognized for its role in theimmune system of the infant [24]. Whereas human milkwas considered to be unique in terms of its complexoligosaccharide content for some time, more recentlyelephant milk has been shown to represent anotherexception [2]. Previous studies, performed in our labo-ratory employing FAB high-energy collision-induced(CID) tandem MS on permethylated oligosaccharides,have revealed that in elephant milk only oligosaccha-rides of the neo-lacto (Type II) series are expressed(Pohlentz et al., unpublished data). This and other MSstudies using high-energy CID [26, 27] showed thathuman milk, in contrast, contains both the lacto (Type I)and neo-lacto isoforms. Moreover, in elephant milkgalactosylated and fucosylated isoforms are found withabout equal abundances (data not shown) whereashuman milk contains exclusively the fucosylated type.
In the present report, the direct HPTLC-IR-MALDI-o-TOF-MS analysis of two chromatographic fractions ofnative oligosaccharides from human milk (HM) andone from elephant milk (EM) is described. Glycerol wasemployed as a liquid matrix. In addition, a liquidcomposite matrix for direct HPTLC-UV-MALDI-MSwas also tested.
Experimental
Chemicals
Glycerol (p.a.), �-cyano-4-hydroxycinnamic acid (CHCA),3-aminoquinoline, ammonium phosphate, the calibrantpeptides, bradykinin fragment 1-7, and melittin, and allsolvents were from Sigma-Aldrich (Deisenhoven, Ger-many) and were used as delivered. Purified Fuc-LNT(specified purity �95%) was from Dextra Laboratories,Reading, UK.
Composition of Oligosaccharides
Milk oligosaccharide building monosaccharides areD-glucose (Glc), D-galactose (Gal), D-N-acetylglu-
cosamine (GlcNAc), L-fucose (Fuc), and sialic acid [D-N-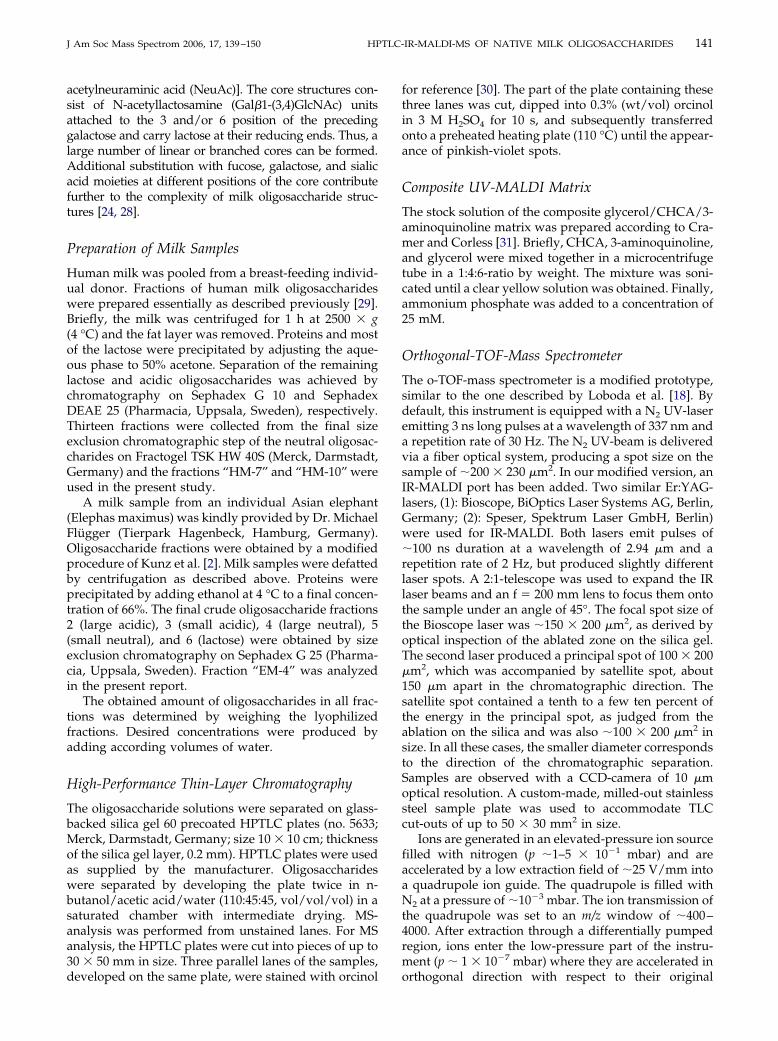
141J Am Soc Mass Spectrom 2006, 17, 139–150 HPTLC-IR-MALDI-MS OF NATIVE MILK OLIGOSACCHARIDES
acetylneuraminic acid (NeuAc)]. The core structures con-sist of N-acetyllactosamine (Gal�1-(3,4)GlcNAc) unitsattached to the 3 and/or 6 position of the precedinggalactose and carry lactose at their reducing ends. Thus, alarge number of linear or branched cores can be formed.Additional substitution with fucose, galactose, and sialicacid moieties at different positions of the core contributefurther to the complexity of milk oligosaccharide struc-tures [24, 28].
Preparation of Milk Samples
Human milk was pooled from a breast-feeding individ-ual donor. Fractions of human milk oligosaccharideswere prepared essentially as described previously [29].Briefly, the milk was centrifuged for 1 h at 2500 � g(4 °C) and the fat layer was removed. Proteins and mostof the lactose were precipitated by adjusting the aque-ous phase to 50% acetone. Separation of the remaininglactose and acidic oligosaccharides was achieved bychromatography on Sephadex G 10 and SephadexDEAE 25 (Pharmacia, Uppsala, Sweden), respectively.Thirteen fractions were collected from the final sizeexclusion chromatographic step of the neutral oligosac-charides on Fractogel TSK HW 40S (Merck, Darmstadt,Germany) and the fractions “HM-7” and “HM-10” wereused in the present study.
A milk sample from an individual Asian elephant(Elephas maximus) was kindly provided by Dr. MichaelFlügger (Tierpark Hagenbeck, Hamburg, Germany).Oligosaccharide fractions were obtained by a modifiedprocedure of Kunz et al. [2]. Milk samples were defattedby centrifugation as described above. Proteins wereprecipitated by adding ethanol at 4 °C to a final concen-tration of 66%. The final crude oligosaccharide fractions2 (large acidic), 3 (small acidic), 4 (large neutral), 5(small neutral), and 6 (lactose) were obtained by sizeexclusion chromatography on Sephadex G 25 (Pharma-cia, Uppsala, Sweden). Fraction “EM-4” was analyzedin the present report.
The obtained amount of oligosaccharides in all frac-tions was determined by weighing the lyophilizedfractions. Desired concentrations were produced byadding according volumes of water.
High-Performance Thin-Layer Chromatography
The oligosaccharide solutions were separated on glass-backed silica gel 60 precoated HPTLC plates (no. 5633;Merck, Darmstadt, Germany; size 10 � 10 cm; thicknessof the silica gel layer, 0.2 mm). HPTLC plates were usedas supplied by the manufacturer. Oligosaccharideswere separated by developing the plate twice in n-butanol/acetic acid/water (110:45:45, vol/vol/vol) in asaturated chamber with intermediate drying. MS-analysis was performed from unstained lanes. For MSanalysis, the HPTLC plates were cut into pieces of up to30 � 50 mm in size. Three parallel lanes of the samples,
developed on the same plate, were stained with orcinolfor reference [30]. The part of the plate containing thesethree lanes was cut, dipped into 0.3% (wt/vol) orcinolin 3 M H2SO4 for 10 s, and subsequently transferredonto a preheated heating plate (110 °C) until the appear-ance of pinkish-violet spots.
Composite UV-MALDI Matrix
The stock solution of the composite glycerol/CHCA/3-aminoquinoline matrix was prepared according to Cra-mer and Corless [31]. Briefly, CHCA, 3-aminoquinoline,and glycerol were mixed together in a microcentrifugetube in a 1:4:6-ratio by weight. The mixture was soni-cated until a clear yellow solution was obtained. Finally,ammonium phosphate was added to a concentration of25 mM.
Orthogonal-TOF-Mass Spectrometer
The o-TOF-mass spectrometer is a modified prototype,similar to the one described by Loboda et al. [18]. Bydefault, this instrument is equipped with a N2 UV-laseremitting 3 ns long pulses at a wavelength of 337 nm anda repetition rate of 30 Hz. The N2 UV-beam is deliveredvia a fiber optical system, producing a spot size on thesample of �200 � 230 �m2. In our modified version, anIR-MALDI port has been added. Two similar Er:YAG-lasers, (1): Bioscope, BiOptics Laser Systems AG, Berlin,Germany; (2): Speser, Spektrum Laser GmbH, Berlin)were used for IR-MALDI. Both lasers emit pulses of�100 ns duration at a wavelength of 2.94 �m and arepetition rate of 2 Hz, but produced slightly differentlaser spots. A 2:1-telescope was used to expand the IRlaser beams and an f � 200 mm lens to focus them ontothe sample under an angle of 45°. The focal spot size ofthe Bioscope laser was �150 � 200 �m2, as derived byoptical inspection of the ablated zone on the silica gel.The second laser produced a principal spot of 100 � 200�m2, which was accompanied by satellite spot, about150 �m apart in the chromatographic direction. Thesatellite spot contained a tenth to a few ten percent ofthe energy in the principal spot, as judged from theablation on the silica and was also �100 � 200 �m2 insize. In all these cases, the smaller diameter correspondsto the direction of the chromatographic separation.Samples are observed with a CCD-camera of 10 �moptical resolution. A custom-made, milled-out stainlesssteel sample plate was used to accommodate TLCcut-outs of up to 50 � 30 mm2 in size.
Ions are generated in an elevated-pressure ion sourcefilled with nitrogen (p �1–5 � 10�1 mbar) and areaccelerated by a low extraction field of �25 V/mm intoa quadrupole ion guide. The quadrupole is filled withN2 at a pressure of �10�3 mbar. The ion transmission ofthe quadrupole was set to an m/z window of �400–4000. After extraction through a differentially pumpedregion, ions enter the low-pressure part of the instru-ment (p � 1 � 10�7 mbar) where they are accelerated in
orthogonal direction with respect to their original
142 DREISEWERD ET AL. J Am Soc Mass Spectrom 2006, 17, 139–150
movement. Analysis was exclusively performed in thepositive ion mode, with the TOF-pusher voltage set to20 kV. Calibration of the instrument was achieved witha two-point calibration using molecular ions of brady-kinin fragment 1-7 and melittin desorbed from a regularglycerol preparation. For acquisition of the IR-MALDImass spectra, �100 single laser pulses were typicallyapplied. The laser fluence was adjusted to a value ofabout 10,000 J/m2. Since at this fluence value, the 200�m-thick silica gel was typically removed after 20 to 30single laser shots, the sample plate was moved to allow4 to 5 positions on a horizontal line next to each other tobe sampled. For acquisition of the UV-MALDI-massspectra, �7500 laser pulses were applied on a few tendifferent positions. Mass spectra were processed usingthe MoverZ3 software (version 2001.02.13, GenomicSolutions, Ann Arbor, MI).
MALDI Preparation Protocols
The direct HPTLC-MALDI-MS analyses were per-formed from unstained bands. Positions of the chro-matographically separated bands were determinedfrom the orcinol-stained reference lanes. For IR-MALDI,a vertical strip of glycerol-wetted silica gel was pro-duced by applying a series of 0.2 to 0.4 �L drops of pureglycerol next to each other. The glycerol was rapidlysoaked up by the silica gel and diffused laterally,producing a uniformly wetted, �2 to 3 mm wide strip.The wetted silica gel areas can easily be differentiatedfrom the nonwetted by their whitish appearance. Thecomposite UV-MALDI matrix was prepared in a similarway.
Results and Discussion
The three orcinol-stained reference lanes from a HPTLCseparation of the two human and the elephant milkfractions are displayed in Figure 1. The numbers next tothe analyte bands indicate the positions from whichmass spectra (Figures 2, 3, 4, 5, and 6) were acquired.Positions below the center of the application zone,indicated by a dashed line, are denoted by negativenumbers. For the HM-10 lane, the center-to-center dis-tance between two neighboring irradiated positionswas �300 �m, for the two other samples it was �400�m. The HM-10 fraction was separated into two majorbands (Figure 1a). These are expected to contain LNTand Fuc-LNT, respectively, as the major components, asdetermined by the FAB-(CID)-MS analysis of the un-separated fractions (data not shown). A third minorband at lower Rf value, expected to contain the doublyfucosylated LNT species, is only faintly visible in thereference chromatogram. Neither the chromatographynor the MS1 analysis allow to differentiate betweenisomeric structures of LNT and neo-lacto-N-tetraose(n-LNT), which may be both present in human milk; forsimplicity, human milk oligosaccharides will, therefore,
in the following be referred in the form of one of thetype I series isomers. The HM-7 fraction (Figure 1b),containing more complex oligosaccharides, was notresolved in discrete HPTLC bands. However, species ofdifferent size can be expected to be present within theoptically unresolved wide area. Because the EM-4 ele-phant milk oligosaccharide sample was only roughlysize-fractionated by the foregoing size exclusion chro-matography, this fraction expectedly generated themost complex chromatogram. EM oligosaccharides areseparated into four major bands (Figure 1c). Of these,the three upper ones are expected to contain nLNT andnLNT extended by a single or by two sugar residues,fucose or galactose, respectively. The structures of thesecompounds have been confirmed previously by FAB-high-energy CID-MS of the permethylated sample (datanot shown). A series of larger, more complex oligosac-charides is distributed at low Rf values.
In Figure 2a– c, three mass spectra acquired fromPositions 38, 30, and 18 of an unstained HM-10 lane ofhuman milk are displayed. An amount of 0.6 �g of milkoligosaccharides was applied for the separation; this is10 times less than that used for the orcinol-stainedreference lane. The three mass spectra were chosen torepresent the two major and one minor analyte band, asshown in Figure 1a. The major ion species, detected atm/z 730.24 in the analyte band with the highest Rf valueat Position 38 can straightforwardly be assigned to thesodiated [M � Na]� molecular ion of lacto-N-tetraose(LNT, calculated m/z 730.24; Figure 2a). The base peak,detected at m/z, 876.30 in the middle analyte band atPosition 30 can be assigned to a singly fucosylated LNT(calculated m/z, 876.30; Figure 2b). Human milk isknown to contain five different isomers of Fuc-LNT,
Figure 1. Orcinol-stained HPTLC chromatograms of human(HM) and elephant milk (EM) fractions. (a) HM-10; (b) HM-7; (c)EM-4. The horizontal lines at the bottom of the chromatogramsindicate the approximate position at which samples were appliedto the HPTLC plate. The figures next to the lanes indicate the laserpositions at which the mass spectra, displayed in Figures 2– 6,were acquired. All mass spectra were acquired from unstainedlanes, which were developed in parallel on the same HPTLC plate.The center-to-center distance between two adjacent laser positionswere �300 �m for the analysis of HM-10 and �400 �m for theexperiments with the HM-7 and EM-4 samples. The assignmentsindicate the expected oligosaccharide species in the analyte bandsfor the EM-4 sample. Only fucosylated LNT but no Gal-LNT isexpressed in human milk. Moreover, in human milk the core unitmay contain both LNT and nLNT. Amounts of 6 �g of HM-10, 5�g of HM-7, and �10 �g of total EM-4 oligosaccharides, respec-tively, were applied for HPTLC.
differing in the binding site of the fucose residue and in

to �4
143J Am Soc Mass Spectrom 2006, 17, 139–150 HPTLC-IR-MALDI-MS OF NATIVE MILK OLIGOSACCHARIDES
the binding type [24]. These isomers cannot be differ-entiated from the MS1 spectrum. In the minor analyteband with the lowest Rf value a difucosylated LNT ionat m/z 1022.37 is present as the major component. Alloligosaccharide species were detected as singly sodi-ated [M � Na]� ions as the base peaks. The FWHMmass resolution was about 10,000 in all measurements.
In addition to the singly sodiated species, ionsformed by adduct formation with glycerol matrix werealso detected. Sizable intensities for these adduct com-pounds were only observed for LNT and Fuc-LNT butnot for the more extended oligosaccharide species (seeFigure 2c and below for the HM-7 and EM-4 fractions).A second series of low abundant adduct ion signals wasgenerated by adduct formation with NaH2PO4 andNa2HPO4 (see Figure 2b and below for the HM-7fraction). The origin of the phosphate is not yet known;it is likely to be present in the original milk fraction. Theparameters which might determine or influence the
600 800 1000 120
0
25
50
75
100
H-T
NL2O
TNL-cu
F
lorecylg+
TNL
TNL
caLcA
NxeH
Position 38
m/z
stinu .bra / ytisnetnI
600 800 1000 120
0
10
20
30
40
50
HaN
+T
NL-cuF
2O
P4
lorecylg+
TNL-cu
F
TNL-cu
F
TNL
Position 30
m/z
stinu .bra / ytisnetnI(a)
(b) (b)
Figure 2. Direct HPTLC-IR-MALDI-o-TOF mafrom different lateral positions on the chromatogat Position 18 (refer to Figure 1a for the assignmof HM-10 oligosaccharides was, in this case, apreference chromatogram in Figure 1a. (d) Mass spdiluted sample, displaying the approximate limsample was applied for HPTLC corresponding
adduct formation, inclusive of that for unspecific
dimers, will be investigated in more detail in successivestudies.
The LNT signal, obtained from the middle HPTLCanalyte band (Figure 2b) at about 10% intensity of themolecular Fuc-LNT signal, could originate from aninsufficient chromatographic separation, or might becaused by an in-source cleavage of the fucose residuefrom the fucosylated precursor. In a control experimentwith purified Fuc-LNT (purity �95% as specified by thesupplier), some LNT was in fact detected. A decrease ofthe laser fluence to values closer to the thresholdfluence can be applied to reduce the degree of LNTformation by about an order of magnitude, but theacquisition times are then extended accordingly. Adecrease of the acceleration potential in the ion sourcewas also found to reduce the in-source fragmentation,but adduct formation and unspecific oligomerization ofthe oligosaccharide was then enhanced.
The limit of detection of the method in its present
600 800 1000 12000
1
2
3
4
S/N ~5Background ions
cuF
2NL-
T
Position 18
m/z
stinu .bra / ytisnetnI
)
600 800 1000 12000
1
2
3
4
5
6
7
10 times diluted sample~40 pmol of Fuc-LNT applied for HPTLC
unspecificbackground ions
lorecylg+
TNL-cu
F
TNL-cu
F
Position 30
m/z
stinu .bra / ytisnetnI
)
ectra of human milk fraction HM-10, recordedic lanes, (a) at Position 38, (b) at Position 30, (c)f the irradiated positions). An amount of 0.6 �g
for HPTLC, ten times less than used for them acquired from Position 30 of a 10 times moreetection. Here, �60 ng of total oligosaccharide0 pmol of Fuc-LNT.
0
0
(c
(d
ss spraph
ent opliedectru
it of d
form is illustrated by the doubly fucosylated LNT ion

144 DREISEWERD ET AL. J Am Soc Mass Spectrom 2006, 17, 139–150
signal, generated from the minor analyte band at Posi-tion 18 (Figure 2c). Since the exact quantity of thisspecies in the initial sample is not known, a dilutionseries was performed. The two major HM-10 signals,LNT and Fuc-LNT, representing about half of theoligosaccharide content of the HM-10 sample each,were still unambiguously detected from a 10 timesmore diluted sample, in which about 30 ng of eachspecies were contained, corresponding to about 40pmol. A mass spectrum acquired from the middleanalyte band is displayed in Figure 2d. Like for all ofthe mass spectra displayed above, a total of 100 singlelaser pulses only were applied. The LNT ion signal-to-noise ratio was about five (Figure 2d). A 10-fold furtherdiluted sample did not deliver interpretable resultsanymore. The detection limit in the mass range below1000 u is apparently mostly determined by the back-ground from the silica gel-matrix system. The limit ofdetection under the present experimental conditions is,therefore, about 10 pmol of an individual oligosaccha-ride species applied to HPTLC.
(c)
(a)
600 800 1000 1200 1400 160
0
50
100
150
200
250
TNL
HaN
+H
NL-cuF
2O
P4
cuF
2T
NL-
HNL-cu
F
HaN
+H
NL2
OP
4cu
F2
TNL-c
ANxe
Hcu
F3
K+
TNL-
TNL-cu
F
HNL
TNL-c
ANxe
HcuF
cuF
3T
NL-
Position 10
m/z
stinu .bra / ytisnetnI
800 1000 1200 1400 1600 1800 200
0
100
200
300
400
cuF
2O
NL-
ONL-cu
F
cuF
3H
NL-
HNL-cu
F
TNL-cu
F
TNL-c
ANxe
H
TNL-c
ANxe
HcuF
cuF
2H
NL-
HNL
Position 2
m/z
stinu .bra / ytisnetnI
1600 1800 2000 2200 24
O
NL-cuF
cuF
2O
NL-
cuF
3
ONL-
D
NL-cuF
cuF
4D
NL-
cuF
3D
NL-
cuF
4
ONL-
Figure 3. Direct HPTLC-IR-MALDI-o-TOF madifferent lateral positions on the chromatograpPosition 2, (d) at Position -2 (refer to Figure 1b forwere applied for HPTLC.
A list of all molecular species detected by direct
HPTLC-IR-MALDI-MS at intermediate to high ion sig-nal intensities from the HM-7 and HM-10 lanes is givenin Table 1 a and b along with their proposed identityand calculated m/z values. All m/z values are given forthe sodiated quasimolecular ion or for adducts derivedfrom this ion. The experimental and calculated massvalues are determined to be within 20 ppm for allspecies. An accuracy in the low ppm range should beachievable if instrumental and evaluation parametersare slightly adjusted [18, 32]. Besides for the isoformdistinction, an unambiguous identification of the oligo-saccharide species composition can be achieved.
As expected, in the HM-7 fraction oligosaccharide specieswith considerably higher complexity were detected. As ex-amples, four mass spectra from Positions 10, 6, 2, and �2 ofan unstained lane of HM-7 are shown in Figure 3 (cf. Figure1b for the reference chromatogram). Fucosylated lacto-N-hexaose (Fuc-LNH, m/z 1241.44 [M � Na]�) was the mostabundant ion species in the mass spectrum recorded fromPosition 10 at a high Rf value (Figure 3a). In addition, the ioncorresponding to the LNH core unit and a trifucosylated
600 800 1000 1200 1400 1600 1800
0
50
100
150
200
250
300
350
cuF
2Ha
N+
HNL-
2O
P4
HNL
TNL-c
ANxe
HcuF
TNL
cuF
2H
NL-Ha
N+
HNL-cu
F2
OP
4
TNL-cu
F
HNL-cu
F
Position 6
m/z
stinu .bra / ytisnetnI
(d)
800 1000 1200 1400 1600 1800 2000
0
10
20
30
40
50
HNL
ONL
cuF
3a
N+
HNL-
2O
PH
4
cuF
3H
NL-
cuF
2O
NL-
cuF
2Ha
N+
HNL-
2O
P4
cuF
3Ha
N+
HNL-
2O
P4
cuF
3O
NL-
ONL-cu
F
HNL-cu
F
cuF
2H
NL-
Position -2
m/z
stinu .bra / ytisnetnI
)
ectra of human milk fraction 7, recorded fromnes, (a) at Position 10, (b) at Position 6, (c) atssignment). �Five �g of HM-7 oligosaccharides
(b
0
0
00
ss sphic la the a
LNT species were found at higher abundances at m/z 1095.38
was
145J Am Soc Mass Spectrom 2006, 17, 139–150 HPTLC-IR-MALDI-MS OF NATIVE MILK OLIGOSACCHARIDES
and 1168.42, respectively. Moreover, FucGlcNAcLNT andFuc2GlcNAc-LNT can be unambiguously correlated withtheir m/z values at 1079.39 and 1215.33, respectively. Themost intense ion signals in the mass spectrum recorded fromPosition 6 were the singly and doubly fucosylated LNH form(Figure 3b and Table 1b). Finally, mass spectra recorded closeto the HPTLC application zone reveal those species which
600 800 1000 1200
0
50
100
150
200
250
300
350
HaN
+lorecylg+
TNLn
2O
P4
H-T
NLn2O Ha
N+
TNLn
2O
P4lorecylg
+T
NLn
TNLn
Position 30
m/z
stinu .bra / ytisnetnI
600 800 1000 1200 14
0
50
100
150
200
250
300
cuF
2Ha
N+
TNLn-
2O
P4
cuF
2T
NLn-laG
HaN
+T
NLn-laGcu
F2
OP
4
HNLn
TNLn-c
ANxe
HcuF
laG
2T
NLn-
cuF
2T
NLn-T
NLn-laGcu
F
TNLn-c
ANxe
H)c
ANxe
H(cuF
2caL
TNL-la
GT
NLn-cuF
TNLn
cA
NcaLcAue
N
Position 10
m/z
stinu .bra / ytisnetnI
(a)
(c)
(e)
800 1000 1200 1400 1600 1800
0
10
20
30
40
50
60
laG
2H
NLn-H
NLn-laGcu
F
cuF
2H
NLn-
HNLn-la
G
HNLn-cu
F
HNLn
TNLn-la
GcuF
cuF
2T
NLn-
TNLn-cu
F
Position 0
m/z
stinu .bra / ytisnetnI
1450 1500 1550 1600 1650
O
NLn
cuF
2Ha
N+
HN
Ln-2
OP
4 HaN
+H
NLn-la
GcuF
2O
P4
cuF
2
HN
L-laG
laG
3
HNL-
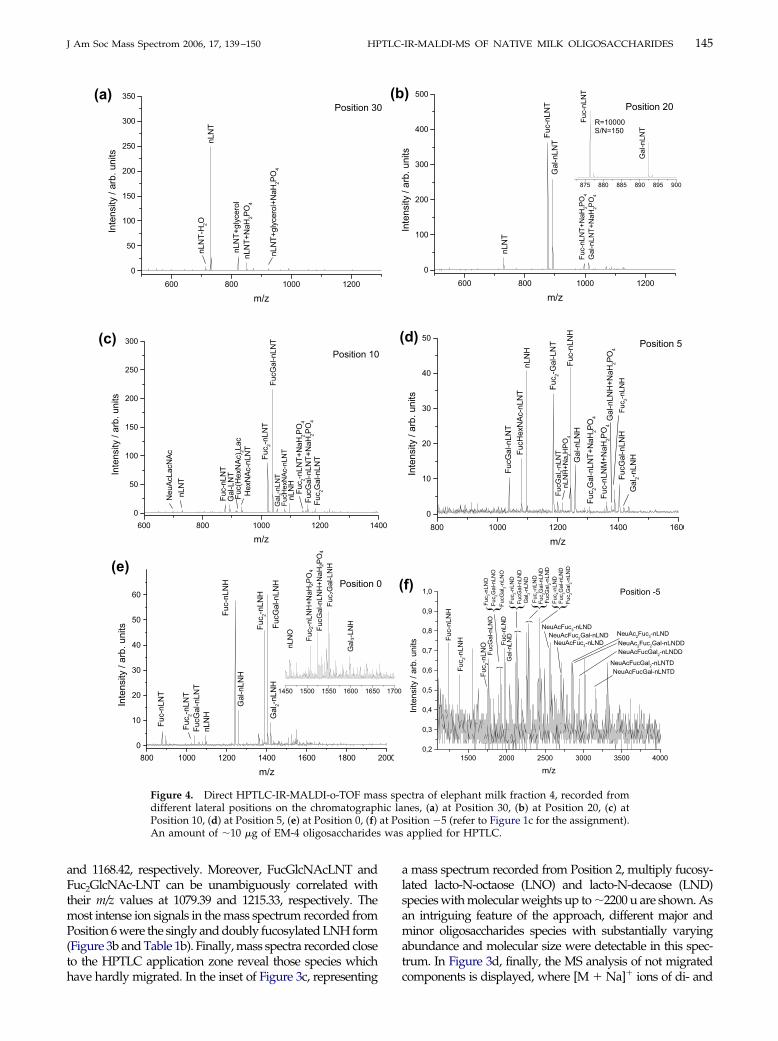
Figure 4. Direct HPTLC-IR-MALDI-o-TOF madifferent lateral positions on the chromatographPosition 10, (d) at Position 5, (e) at Position 0, (f) An amount of �10 �g of EM-4 oligosaccharides
have hardly migrated. In the inset of Figure 3c, representing
a mass spectrum recorded from Position 2, multiply fucosy-lated lacto-N-octaose (LNO) and lacto-N-decaose (LND)species with molecular weights up to �2200 u are shown. Asan intriguing feature of the approach, different major andminor oligosaccharides species with substantially varyingabundance and molecular size were detectable in this spec-trum. In Figure 3d, finally, the MS analysis of not migrated
875 880 885 890 895 900
T
NLn-cuF
T
NLn-laG
R=10000 S/N=150
800 1000 1200 1400 1600
0
10
20
30
40
50
laG
2H
NLn-
HNLn-la
GcuF
cuF
2H
NLn-
HaN
+H
NLn-laG
2O
P4
HaN
+M
NLn-cuF
2O
P4
cuF
2Ha
N+
TNLn-la
G2
OP
4
aN
+H
NLn2
OP
H4
laGcu
F2
TNLn-
HNLn-la
GH
NLn-cuF
cuF
2T
NL-laG-
HNLn
TNLn-c
ANxe
HcuF
TNLn-la
GcuF
Position 5
m/z
stinu .bra / ytisnetnI
)
d)
f)
1500 2000 2500 3000 3500 40000,2
0,3
0,4
0,5
0,6
0,7
0,8
0,9
1,0
NeuAcFucGal2-nLNDD
NeuAcFucGal-nLNTDNeuAcFucGal2-nLNTD
NeuAc2Fuc2Gal-nLNDD
NeuAc2Fuc3-nLND
NeuAcFuc3-nLNDNeuAcFuc2Gal-nLND
NeuAcFuc3-nLND
cuF
2la
G2
DNLn-
cuF
3D
NLn-laG
cuF
4D
NLn-la
G cuF
2D
NLn-cu
F2
DNLn-la
Gcu
F3
DNLn-
{{HNLn-cu
F
cuF
2H
NLn-
{
{
{{
{
laG
2D
NLn-D
NLn-laGcu
Fcu
F2
DNLn-
DNLn-la
GD
NLn-cuF
laGcu
F2
ONLn-
cuF
2O
NLn-laG
cuF
3O
NLn-O
NLn-laGcu
Fcu
F2
ONLn-
Position -5
m/z
stinu .bra / ytis
netnI
600 800 1000 1200
0
100
200
300
400
500
HaN
+T
NLn-la
G2
OP
4
TNLn-cu
F
TNLn
HaN
+T
NLn-cuF
2O
P4
TNLn-la
G
Position 20
m/z
stinu .bra / ytisnetnI
ctra of elephant milk fraction 4, recorded fromnes, (a) at Position 30, (b) at Position 20, (c) atsition �5 (refer to Figure 1c for the assignment).applied for HPTLC.
00
(b
(
(
2000
1700
ss speic la
at Po
components is displayed, where [M � Na]� ions of di- and

for t
146 DREISEWERD ET AL. J Am Soc Mass Spectrom 2006, 17, 139–150
trifucosylated LNH and LNO dominate. In agreement withthe chromatogram (Figure 1b), a low overall ion signalintensity is found at this position.
Six direct HPTLC-MALDI mass spectra, acquiredfrom the HPTLC lane of the EM-4 elephant milkfraction, are displayed in Figure 4a–f. The high com-plexity of the sample, already indicated by the refer-ence chromatogram (Figure 1c), is corroborated bythe mass spectra. In Table 1c all detected ion specieswith sizable intensity, along with their proposedidentity and the m/z values as calculated for the [M �Na]� ion are summarized. Aside from ions of verylow abundance close to the detection limit experi-mental and calculated mass values agree well within50 ppm for all species. Since all experimental valuesfor the EM sample are systematically somewhat toolow in the second digit, a slight calibration offset is
700 800 900
15
12
9
6
3
0
Laet
arP lo
tisnoi
/ m
m
stinU .le
R / ytisnetnI langi
S
m/z
700 800 900 1000 1100 1200 1300 1
Later
alPos
ition / m
m
12
8
4
0
stinU .le
R / ytisnetnI langi
S
m/z
(a) (a)
(b)
Figure 5. “2-D”-HPTLC-MS plot of (a) humanEM-4 showing all recorded MS spectra as traces.positions is �300 �m for the HM and �400 �m
believed to account for this lower accuracy, compared
with the 20 ppm determined above for the twohuman milk samples. In Figure 4a, the mass spectrumrecorded from the analyte band corresponding to thehighest Rf values at Position 30 is presented; thisband contains exclusively nLNT (m/z, 730.29) withsizable abundance. In the second analyte band atPosition 20, fucosylated and galactosylated nLNTspecies are dominating, yielding sodiated molecularions at m/z values of 876.33 and 892.33, respectively(Figure 4b). The third in the reference chromatogram,clearly discernable analyte band contains Fuc2-nLNT,FucGal-nLNT, and Gal2-nLNT as three major species.In Figure 4c the mass spectrum recorded from Posi-tion 10 on this band is displayed, showing the doublyfucosylated/galactosylated LNT ions as the basepeaks. The dominant ion signals in the mass spec-trum, recorded at Position 5, are assigned to nLNT-
1100
HM-10
rebmuN topS / noitisoP laretaL
30
10
20
40
50
1500 1600
EM-4
Late
tisoP lar
ion/
opSt N
ueb
mr
25
3530
2015
05
10
-5
fraction HM-10 and (b) elephant milk fractionenter-to-center distance between two irradiatedhe EM sample.
1000
400
milkThe c
derived oligosaccharides extended by three fucose

147J Am Soc Mass Spectrom 2006, 17, 139–150 HPTLC-IR-MALDI-MS OF NATIVE MILK OLIGOSACCHARIDES
and/or galactose residues, as well as fucosylatedand/or galactosylated nLNH-derived ions (Figure4d). In addition to fucose- and galactose-derivedoligosaccharides, further species are detected at lowRf values, which by their molecular weight must beexpected to contain N-acetylhexosamine (HexNAc),e.g., at Positions 10 and 5. Like for the HM-7 sample,the most complex oligosaccharides are again foundwithin or close to the sample application zone. InFigure 4e, the mass spectrum recorded from Position0 is displayed, where one and two times fucosylated/galactosylated nLNH ions are the main species. Inaddition, triply fucosylated/galactosylated nLNHwas also found but at low abundance (see inset inFigure 4e). Finally, the most complex oligosaccha-rides with molecular weights exceeding 3000 u aredetected in the mass spectrum recorded from Position�5, at the bottom limit of the application zone, wherethe m/z values detected are assigned to the neo-lacto-N-decaose (nLND) and �octaose (nLNO)-derivedsingly and multiply fucosylated/galactosylated ionspecies in the high mass range. The mass spectrumalso reveals the presence of acidic N-acetylneura-minic (NeuAc) acid containing oligosaccharides ofeven larger sizes which had apparently not beenseparated by the foregoing size exclusion chromatog-raphy.
The high complexity of the oligosaccharide com-position in the elephant milk fraction is also illus-trated by a “2-D” HPTLC-MS plot, displaying tracesof all 39 mass spectra, which were recorded from theEM-lane. This reconstructed “MS image” is displayedin Figure 5b, showing the m/z range between 600 and1700. The MS image which was obtained from theHM-10 fraction with less complex composition isshown in Figure 5a. Because the HM-10 fractioncould be separated into distinct analyte bands con-
500 600 700 800 900 1000 1100 1200
0
20000
40000
60000
80000 UV-MALDI with a composite matrixHM-10 fraction, LNT band
TNL
m/z
stinu .bra / ytisnetnI
Figure 6. Direct HTPLC-MALDI-o-TOF mass spectrum of ahuman milk fraction HM-10 recorded from the upper analyteband with a UV laser using the liquid composite matrix. Anamount of 0.6 �g of HM-10 oligosaccharides was applied forHPTLC. The mass spectrum represents the sum of �7500 laserpulses.
taining only one major analyte compound each, the
“lateral resolution” of the MS-imaging can be at bestillustrated by this latter plot. For the species withhighest Rf values, LNT, a width of 3 mm (FWHM) isrevealed from Figure 5a, which corresponds well tothe optically determined width of the orcinol-stainedanalyte band (Figure 1a).
Composite Matrix
A liquid composite matrix containing a highly-con-centrated UV matrix component dissolved in glycerolcan potentially allow an application of the heredescribed method under use of more common UV-MALDI lasers. Liquid composite matrices of this typehave first been described by Sze et al. [33], and laterrefined by Cramer and Corless [31]. A direct HPTLC-UV-MALDI mass spectrum, which was acquiredfrom the upper LNT-containing band of the HM-10chromatogram by using a glycerol/CHCA containingcomposite matrix, is displayed in Figure 6. Anamount of 0.6 �g of the HM-10 fraction was appliedfor HPTLC and about 7500 laser shots were accumu-lated from different neighboring positions. Generally,a decline in signal intensity was observed from oneirradiated position after a few 100 laser shots wereapplied. Even after 1000 shots, an ablation of thesilica gel was, however, not discernible with a high-resolution microscope. Compared with the IR-MALDI mass spectra (cf. Figure 2c), however, asubstantially increased background is found. A com-parison with a mass spectrum, obtained from a blankarea of the developed HPTLC plate, reveals that mostof this background is chemical noise related to boththe MALDI matrix and silica gel derived cluster ions.A similarly high background has been observed in avery recent HPTLC-UV-MALDI-o-TOF-MS study ongangliosides in which sinapinic acid has been used asa solid UV-matrix [32]. Under the present experimen-tal conditions, the limit of detection for directHPTLC-UV-MALDI-MS with the composite matrixwas about an order of magnitude lower than forIR-MALDI-MS with the pure glycerol matrix andabout 100 pmol for the HM-10 oligosaccharides.
Conclusions
In line with our previous study on gangliosides [12],IR-MALDI-o-TOF-MS with a glycerol matrix pro-vides an easy means of analyzing oligosaccharidesdirectly from HPTLC plates. An advantage of themethod compared with standard LC-ESI- or LC-MALDI-MS is that it provides a planar separationfrom which the analysis can then be performed.Moreover, the sample preparation is straightforwardand the use of the o-TOF-instrument allows a highaccuracy in the mass determination independent ofthe morphology of the silica gel surface. An extension
of the method for structural analysis by CID-MS,
148 DREISEWERD ET AL. J Am Soc Mass Spectrom 2006, 17, 139–150
Table 1. Oligosaccharides detected in the human and elephant milk fractions by direct HPTLC-IR-MALDI-o-TOF-MS: (a) HM-10, (b)HM-7, (c) EM-4
(a)Oligosaccharide species m/z found for the [M � Na]� ion m/z calculated for the [M � Na]� ion
GlcNAc-Lac 568.17 568.18LNT 730.24 730.24Fuc-LNT 876.29 876.30Fuc2-LNT 1022.37 1022.35
(b)Oligosaccharide species m/z found for the [M � Na]� ion m/z calculated for the [M � Na]� ion
LNT 730.24 730.24Fuc-LNT 876.30 876.30GlcNAc-LNT 933.32 933.32Fuc2-LNT 1022.36 1022.35FucGlcNAc-LNT 1079.38 1079.38LNH 1095.37 1095.37Fuc3-LNT 1168.42 1168.41Fuc2GlcNAc-LNT 1225.44 1225.43Fuc-LNH 1241.43 1241.43Fuc2-LNH 1387.48 1387.49Fuc3-LNH 1533.54 1533.54Fuc-LNO 1606.56 1606.56Fuc4-LNH 1679.60 1679.60Fuc2-LNO 1752.61 1752.62Fuc3-LNO 1898.67 1898.68Fuc-LND 1971.67 1971.69Fuc4-LNO 2044.73 2044.73Fuc2-LND 2117.77 2117.75Fuc3-LND 2263.84 2263.81
(c)Oligosaccharide species m/z found for the [M � Na]� ion m/z calculated for the [M � Na]� ion
nLNT 730.26 730.24Fuc-nLNT 876.32 876.30Gal-nLNT 892.31 892.29Fuc(HexNAc)2Lac 917.36 917.32HexNAc-nLNT 933.34 933.32Fuc2-nLNT 1022.38 1022.35FucGal-nLNT 1038.36 1038.35Gal2-nLNT 1054.37 1054.34FucHexNAc-nLNT 1079.39 1079.38nLNH 1095.38 1095.37Fuc2Gal-nLNT 1184.42 1184.41Fuc-nLNH 1241.44 1241.43Gal-nLNH 1257.44 1257.42Fuc2-nLNH 1387.52 1387.49FucGal-nLNH 1403.52 1403.48Gal2-nLNH 1419.53 1419.48nLNO 1460.54 1460.50Fuc3-nLNH 1533.58 1533.54Fuc2Gal-nLNH 1549.57 1549.54FucGal2-nLNH 1565.56 1565.53Gal3-nLNH 1581.58 1581.53Fuc-nLNO 1606.60 1606.56Gal-nLNO 1622.59 1622.56Fuc3Gal-nLNH 1695.63 1695.60Fuc2Gal2-nLNH 1711.64 1711.59FucGal3-nLNH 1727.64 1727.59Fuc2-nLNO 1752.66 1752.62FucGal-nLNO 1768.67 1768.61Fuc3-nLNO 1898.73 1898.68
Fuc2Gal-nLNO 1914.71 1914.67
149J Am Soc Mass Spectrom 2006, 17, 139–150 HPTLC-IR-MALDI-MS OF NATIVE MILK OLIGOSACCHARIDES
though not available on the used instrument, isexpected to be straightforwardly achievable.
AcknowledgmentsThe authors thank Sequenom GmbH (Hamburg, Germany) foruse of their o-TOF-instrument, Michael Flügger for providingthe elephant milk sample, Johannes Müthing for use of HPTLCequipment, Andreas Rohlfing for technical assistance, andFranz Hillenkamp for support of the project. The authorsgratefully acknowledge financial support by the DeutscheForschungsgemeinschaft under grant DR416/5-1.
References1. Holmes, E. W.; O’Brien, J. S. Separation of glycoprotein-derived oligo-
Table 1. (continued)
(c)Oligosaccharide species m/z found for the [M
FucGal2-nLNO 1930.73Fuc-nLND 1971.73Gal-nLND 1987.74Fuc2-nLND 2117.81FucGal-nLND 2133.81Gal2-nLND 2149.81NeuAcFuc3-nLNO 2189.78
2211.80 [M � H �NeuAcFuc2Gal-nLNO 2205.89NeuAcFuc-nLND 2262.81Fuc3-nLND 2263.89NeuAcGal-nLND 2278.85Fuc2Gal-nLND 2279.93FucGal2-nLND 2295.91Gal3-nLND 2311.85NeuAcFuc2-nLND 2408.91
2430.86 [M � H �Fuc4-nLND 2409.97NeuAcFucGal-nLND 2424.88
2446.93 [M � H �Fuc3Gal-nLND 2425.89NeuAcGal2-nLND 2440.84Fuc2Gal2-nLND 2441.90FucGal3-nLND 2457.89NeuAc2Fuc-nLND 2553.89NeuAcFuc3-nLND 2554.92NeuAc2Gal-nLND 2569.90NeuAcFuc2Gal-nLND 2570.99NeuAcFucGal2-nLND 2586.95NeuAcFuc-nLNDD 2628.04NeuAcGal-nLNDD 2643.97NeuAc2Fuc2-nLND 2700.00NeuAcFuc4-nLND 2701.03NeuAc2FucGal-nLND 2715.96NeuAcFuc2-nLNDD 2774.05NeuAcFucGal-nLNDD 2790.05NeuAc2Fuc3-nLND 2846.14NeuAcFuc2Gal-nLNDD 2936.10NeuAcFucGal2-nLDD 2952.01NeuAcFuc2-nLNTD 3139.18NeuAcFucGal-nLNTD 3155.14NeuAcGal2-nLNTD 3171.14NeuAcFuc2Gal-nLNTD 3301.12NeuAcFucGal2-nLNTD 3317.22
saccharides by thin-layer chromatography. Anal. Biochem. 1979, 93,167–170.
2. Kunz, C.; Rudloff, S.; Schad, W.; Braun, D. Lactose-derived oligosac-charides in the milk of elephants: Comparison with human milk. Br. J.Nutr. 1999, 82, 391–399.
3. Fenn, J. B.; Mann, M.; Meng, C. K.; Wong, S. F.; Whitehouse, C. M.Electrospray ionization for mass-spectrometry of large biomolecules.Science 1989, 246, 64–71.
4. Karas, M.; Hillenkamp, F. Laser Desorption ionization of proteins withmolecular masses exceeding 10,000 Daltons. Anal. Chem. 1988, 60,2299–2301.
5. Stahl, B.; Steup, M.; Karas, M.; Hillenkamp, F. Analysis of neutraloligosaccharides by matrix-assisted laser desorption ionization massspectrometry. Anal. Chem. 1991, 63, 1463–1466.
6. Carr, S. A.; Huddleston, M. J.; Bean, M. F. Selective identification anddifferentiation of N-linked and O-linked oligosaccharides in glycopro-teins by liquid chromatography mass spectrometry. Protein Sci. 1993, 2,183–196.
7. Bahr, U.; Karas, M. Differentiation of “isobaric” peptides and humanmilk oligosaccharides by exact mass measurements using electrosprayionization orthogonal time-of-flight analysis. Rapid Commun. Mass Spec-trom. 1999, 13, 1052–1058.
8. Reinhold, V. N.; Reinhold, B. B.; Costello, C. E. Carbohydrate molecular
a]� ion m/z calculated for the [M � Na]� ion
1930.671971.691987.692117.752133.752149.742189.77
a]� 2211.752205.772262.782263.812278.782279.802295.802311.792408.85
a]� 2430.832409.872424.84
a]� 2446.822425.862440.842441.862425.862553.882554.902569.882570.902586.892627.922643.922699.942700.962715.942773.982789.972846.002936.032952.033139.113155.103171.103301.163317.16
� N
2N
2N
2N
weight profiling sequence, linkage, and branching data ES-MS and CID.Anal. Chem. 1995, 67, 1772–1784.

150 DREISEWERD ET AL. J Am Soc Mass Spectrom 2006, 17, 139–150
9. Wilson, I. D. The state of the art in thin-layer chromatography-massspectrometry: A critical appraisal. J. Chromatogr. A 1999, 856, 429–442.
10. Gusev, A. I. Interfacing matrix-assisted laser desorption/ionizationmass spectrometry with column and planar separations. Fresenius J.Anal. Chem. 2000, 366, 691–700.
11. Ivleva, V. B.; Elkin, Y. N.; Budnik, B. A.; Moyer, S. C.; O’Connor, P. B.;Costello, C. E. Coupling thin-layer chromatography with vibrationalcooling matrix-assisted laser desorption/ionization Fourier transformmass spectrometry for the analysis of ganglioside mixtures. Anal. Chem.2004, 76, 6484–6491.
12. Dreisewerd, K.; Müthing, J.; Rohlfing, A.; Meisen, I.; Vukelic, Z.;Peter-Katalinic, J.; Hillenkamp, F.; Berkenkamp, F. Analysis of ganglio-sides directly from thin-layer chromatography plates by infrared ma-trix-assisted laser desorption/ionization orthogonal time-of-flight massspectrometry with a glycerol matrix. Anal. Chem. 2005, 77, 4098–4107.
13. Guittard, J.; Hronowski, X. P. L.; Costello, C. E. Direct matrix-assistedlaser desorption/ionization mass spectrometric analysis of glycosphin-golipids on thin layer chromatographic plates and transfer membranes.Rapid Commun. Mass Spectrom. 1999, 13, 1838–1849.
14. Ford, M. J.; Van Berkel, G. J. An improved thin-layer chromatography/mass spectrometry coupling using a surface sampling probe electro-spray ion trap system. Rapid Commun. Mass Spectrom. 2004, 18, 1303–1309.
15. Luftmann, H. A simple device for the extraction of TLC spots: Directcoupling with an electrospray mass spectrometer. Anal. Bioanal. Chem.2004, 378, 964–968.
16. O’Connor, P.; Budnik, B.; Ivleva, V.; Kaur, P.; Moyer, S. C.; Pittman, J. L.;Costello, C. E. A. high pressure matrix-assisted laser desorption ionsource for Fourier transform mass spectrometry designed to accommo-date large targets with diverse surfaces. J. Am. Soc. Mass Spectrom. 2004,15, 128–132.
17. Hayen, H.; Volmer, D. A. Rapid identification of siderophores bycombined thin-layer chromatography/matrix-assisted laser desorp-tion/ionization mass spectrometry. Rapid Commun. Mass Spectrom. 2005,19, 711–720.
18. Loboda, A. V.; Ackloo, S.; Chernushevich, I. V. A. high-performancematrix-assisted laser desorption/ionization orthogonal time-of-flightmass spectrometer with collisional cooling. Rapid Commun. Mass Spec-trom. 2003, 17, 2508–2516.
19. Dreisewerd, K. The desorption process in MALDI. Chem. Rev. 2003, 103,395–425.
20. Chang, T. T.; Lay, J. O.; Francel, R. J. Direct analysis of thin-layer
chromatography spots by fast atom bombardment mass spectrometry.Anal. Chem. 1984, 56, 109–111.21. Karlsson, K. A.; Lanne, B.; Pimlott, W.; Teneber, S. The resolution intomolecular species on desorption of glycolipids from thin-layer chro-matograms, using combined thin-layer chromatography and fast-atom-bombardment mass spectrometry. Carbohydr. Res. 1991, 221, 49–61.
22. Dreisewerd, K.; Berkenkamp, S.; Leisner, A.; Rohlfing, A.; Menzel, C.Fundamentals of matrix-assisted laser desorption/ionization massspectrometry with pulsed infrared lasers. Int. J. Mass Spectrom. 2003,226, 189–209.
23. Von Seggern, C. E.; Moyer, S. C.; Cotter, R. E. Liquid infrared atmo-spheric pressure matrix-assisted laser desorption/ionization ion trapmass spectrometry of sialylated carbohydrates. Anal. Chem. 2003, 75,3212–3218.
24. Kunz, C.; Rudloff, S.; Baier, W.; Klein, N.; Strobel, S. Oligosaccharides inhuman milk: Structural, functional, and metabolic aspects. Annu. Rev.Nutr. 2000, 20, 699–722.
25. Chaturvedi, P.; Warren, C. D.; Altaye, M.; Morrow, A. L.; Ruiz-Palacios,G.; Pickering, L. K.; Newburg, D. S. Fucosylated human milk oligosac-charides vary between individuals and over the course of lactation.Glycobiology 2001, 11, 365–372.
26. Spina, E.; Cozzolino, R.; Ryan, E.; Garozzo, D. Sequencing of oligosac-charides by collision-induced dissociation matrix-assisted laser desorp-tion/ionization mass spectrometry. J. Mass Spectrom. 2000, 35, 1042–1048.
27. Chai, W. G.; Piskarev, V.; Lawson, A. M. Negative ion electrospray massspectrometry of neutral underivatized oligosaccharides. Anal. Chem.2001, 73, 651–667.
28. Urashima, T.; Saito, T.; Nakamura, T.; Messer, M. Oligosaccharides ofmilk and colostrum in nonhuman mammals. Glycoconj. J. 2001, 18,357–371.
29. Bruntz, R.; Dabrowski, U.; Dabrowski, J.; Ebersold, A.; Peter-Katalinic,J.; Egge, H. Fucose-containing oligosaccharides from human milk froma donor of blood group-0 LEA nonsecretor. Biol. Chem. Hoppe-Seyler1988, 369, 257–273.
30. Svennerholm. L. The quantitative estimation of cerebrosides in nervoustissue. J. Neurochem. 1956, 1, 42–53.
31. Cramer, R.; Corless, S. Liquid ultraviolet matrix-assisted laser desorp-tion/ionization mass spectrometry for automated proteomic analysis.Proteomics 2005, 5, 360–370.
32. Ivleva, V. B.; Sapp, L. M.; O’Connor, P. B.; Costello, C. E. Gangliosideanalysis by thin-layer chromatography matrix-assisted laser desorp-tion/ionization orthogonal time-of-flight mass spectrometry. J. Am. Soc.Mass. Spectrom. 2005, 16, 1552–1560.
33. Sze, E. T. P.; Chan, T. W. D.; Wang, G. Formulation of matrix solutions
for use in matrix-assisted laser desorption ionization of biomolecules.J. Am. Soc. Mass Spectrom. 1998, 9, 166–174.