ANALYSIS OF MICRORNA EXPRESSION PATTERN IN SMALL … · afte, alterazioni dello smalto dentale,...
98
ANALYSIS OF MICRORNA EXPRESSION PATTERN IN SMALL INTESTINE OF CELIAC PATIENTS Marina Capuano Dottorato in Scienze Biotecnologiche – XXIII ciclo Indirizzo Biotecnologie Mediche Università di Napoli Federico II
-
Upload
trinhxuyen -
Category
Documents
-
view
217 -
download
0
Transcript of ANALYSIS OF MICRORNA EXPRESSION PATTERN IN SMALL … · afte, alterazioni dello smalto dentale,...

AANNAALLYYSSIISS OOFF MMIICCRROORRNNAA EEXXPPRREESSSSIIOONN
PPAATTTTEERRNN IINN SSMMAALLLL IINNTTEESSTTIINNEE OOFF
CCEELLIIAACC PPAATTIIEENNTTSS
Marina Capuano
Dottorato in Scienze Biotecnologiche – XXIII ciclo
Indirizzo Biotecnologie Mediche Università di Napoli Federico II

Dottorato in Scienze Biotecnologiche – XXIII ciclo Indirizzo Biotecnologie Mediche Università di Napoli Federico II
AANNAALLYYSSIISS OOFF MMIICCRROORRNNAA EEXXPPRREESSSSIIOONN
PPAATTTTEERRNN IINN SSMMAALLLL IINNTTEESSTTIINNEE OOFF
CCEELLIIAACC PPAATTIIEENNTTSS
Marina Capuano
Dottoranda: Dr.ssa Marina Capuano Docenti guida Prof.ssa Giuliana Fortunato Prof.ssa Lucia Sacchetti Coordinatore: Prof. Giovanni Sannia


I would like to acknowledge my supervisor, Prof. Lucia Sacchetti, who guided me through this project with her scientific attitude and gave me the opportunity to learn many things; her understanding, encouraging and personal guidance have provided a good basis for the present thesis. I owe my most sincere gratitude to Dr Nadia Tinto, who gave me the opportunity to work with her and gave me untiring help during my difficult moments. I wish to extend my warmest thanks to all colleagues for numerous stimulating discussions, help with experimental setup and general advice. Special thanks to my parents, my sisters, my boyfriend and my grand mother, for their understanding, endless patience and encouragement and their support. To them I dedicate this thesis.


1
Regolazione microRNA–dipendente dell’espressione genica nella mucosa intestinale del paziente celiaco � Premesse scientifiche
La celiachia La celiachia (CD) è una patologia infiammatoria che si sviluppa in soggetti geneticamente predisposti, caratterizzata da una risposta immunitaria indotta dall'ingestione di glutine. La prevalenza stimata della CD è circa 1% nella popolazione Europea ed Americana; in particolare, in Italia è di 0.55%1,2. La presenza del glutine nella dieta dei celiaci, determina una lesione a livello della mucosa duodeno-digiunale caratterizzata da atrofia dei villi intestinali, iperplasia delle cripte ed incremento dell’infiltrato linfocitario. La diagnosi di CD, secondo i criteri ESPGHAN (European Society for Paediatric Gastroenterology, Hepatology and Nutrition), si basa sulla dimostrazione di una chiara alterazione istologica della mucosa del piccolo intestino mediante biopsia; a rafforzare la diagnosi, in presenza di tale specifico quadro istologico, si valuta la storia e la presentazione clinica compatibile, la presenza nel siero degli auto-anticorpi IgA anti-gliadina (AGA), e/o anti-endomisio (EMA) e/o antitransglutaminasi (tTG) al momento della diagnosi, la loro normalizzazione, parallelamente alla risposta clinica, quando viene intrapresa dieta senza glutine e la genetica compatibile (alleli HLA tipici della malattia). La sintomatologia clinica tipica prevede diarrea, dolori addominali, vomito e significativa perdita di peso. Tuttavia possono esserci anche forme atipiche, silenti e latenti, più difficili da diagnosticare: le forme atipiche sono caratterizzate da una compresenza di sintomi extraintestinali (anemia sideropenica, osteoporosi, dermatite erpetiforme, bassa statura, anoressia, comparsa recidiva di afte, alterazioni dello smalto dentale, stipsi, alopecia); quelle silenti presentano le lesioni tipiche della mucosa intestinale in assenza di un’evidente sintomatologia clinica; infine, le forme latenti sono caratterizzate da una sierologia positiva per CD, ma da negatività alla biopsia intestinale. La CD è un’enteropatia multifattoriale in cui il largo spettro di alterazioni cliniche, istologiche e sierologiche osservate nei differenti stadi e nelle diverse forme della malattia è spiegato dai fattori genetici ed ambientali. Studi di popolazione hanno dimostrato una concordanza tra gemelli monozigoti del 75%, mentre tra gemelli dizigoti e parenti di I grado è rispettivamente del 20% e 10%3. Ciò indica che esiste una forte componente genetica alla base di questa patologia. Ad oggi, la più forte associazione alla celiachia è data dai geni del sistema HLA di classe II, codificanti per gli eterodimeri DQ2 e DQ84. E’ stato dimostrato un aumento nella frequenza delle molecole DQ2/8 nelle donne (94%) rispetto agli uomini (85%) affetti da celiachia (p=1.6 x 10⁻³) in Italia5. Inoltre, circa il 90-95% dei celiaci esprime l’eterodimero DQ2, mentre il restante 5-10% l’eterodimero DQ84; bisogna considerare però, che circa 1% dei celiaci non possiede né il DQ2, né il DQ8, così come esse sono presenti anche nel 35% della popolazione sana; ciò fa intendere che la presenza delle molecole DQ2/8 è una condizione necessaria ma non sufficiente per sviluppare la malattia e quindi ci sono altri fattori che contribuiscono all’insorgere della CD; in tal senso il test genetico di tipizzazione HLA per la ricerca degli aplotipi DQ2/DQ8, ha un alto valore predittivo negativo, fornendo così un valido supporto sia nello screening dei gruppi a rischio (i.e. familiari di primo grado di celiaci), sia nei casi dubbi (i.e. forme latenti). I loci HLA sono parte del complesso MHC (Complesso Maggiore di Istocompatibilità), che mappa sul braccio corto del cromosoma 6 ed è un sistema altamente polimorfico e complesso. Le molecole HLA di classe II, comprendono i geni DR, DQ e DP, sono espresse a

2
livello di cellule immunocompetenti (APC o Antigen Presenting Cell) e cioè macrofagi, cellule dendritiche (DCs) e linfociti B e T; la loro funzione è quella di legare patogeni extracellulari o parte di essi e presentarli ai linfociti T helper CD4+ attivandoli ed innescando così la risposta immunitaria. In particolare, il fattore ambientale in grado di suscitare la risposta immunitaria adattativa ed innata nel piccolo intestino è rappresentato dalla gliadina, una frazione proteica del glutine, che nel tratto gastrico viene deaminata dall’enzima tTG e trasformata in peptidi ricchi di acido glutammico ad alta affinità per le molecole DQ2. Tra i peptidi gliadinici identificati, sono presenti il peptide 31-43 mer, in grado di attivare l’immunità innata, ed il peptide 33mer capace di scatenare la risposta adattativa. Infatti, l’attivazione di cellule T glutine specifiche, determina produzione di anticorpi da parte dei linfociti B sia per la gliadina che per la tTG; quest’ultimi attivano una reazione immunitaria distruttiva sia verso la mucosa intestinale (con infiammazione, iperplasia delle cripte e atrofia dei villi), sia verso altri tessuti in cui è espressa la tTG come sistema nervoso, cute, denti, fegato e pancreas. In particolare, la risposta immunitaria innata è caratterizzata dalla produzione di interleuchina-15 da parte delle cellule dendritiche epiteliali e della lamina propria, che aumenta la permeabilità intestinale ed induce l’apoptosi degli enterociti dopo la riprogrammazione dei linfociti intraepiteliali in natural killer (NK); la risposta adattativa, guida anche una risposta pro infiammatoria, caratterizzata soprattutto dalla produzione di interferone-gamma (IFNγ), che si conclude nell’enteropatia immuno-mediata. Oltre al locus HLA, numerosi studi di associazione genica hanno permesso di identificare 13 loci non-HLA, in cui sono stati individuati geni coinvolti nella risposta adattativa immune (i.e. citochine, chemochine e loro recettori), nell’attivazione delle cellule T, nella motilità e nell’adesione cellulare6. Ad esempio è stata dimostrata un’associazione significativa con MICA 5.1 (major histocompatibility complex class I chain-related gene A 5.1), che codifica per una proteina espressa sulla superficie delle cellule epiteliali che lega NKG2D, recettore delle NK, e può funzionare da attivatore stress-inducibile della risposta immune innata; infatti, è stato dimostrato che individui omozigoti per MICA 5.1 hanno un rischio di sviluppare sintomi gastrointestinali associati alla celiachia statisticamente superiore (p<0.05) a quello di individui eterozigoti (OR=2.79, 95% Intervallo di Confidenza 1.15-6.79)7. In generale, tutti i loci non-HLA concorrono solo per il 3% alla genetica della celiachia, mentre il locus HLA ne spiega circa il 40%; è possibile ipotizzare quindi che altri meccanismi, ad esempio di tipo epigenetico, possano contribuire a spiegare il restante 57% ancora sconosciuto, fornendo così nuovi chiarimenti alla patogenesi della malattia. microRNA I microRNAs (miRNAs) sono piccoli RNA non codificanti di circa 21 nucleotidi prodotti da trascritti che formano strutture stem-and-loop; sono processati da differenti enzimi quali una RNAasi III Drosha e una proteina Pasha in Drosofila o DGC8 nei Mammiferi8. E’ noto nell'uomo che, dal 30% al 50% dei geni è regolato da meccanismi microRNA-dipendenti; studi iniziali suggeriscono che un dato miRNA può regolare tanti mRNA differenti e che, al contrario, uno specifico mRNA può essere regolato da più di un miRNA. In generale, dati in letteratura supportano l’idea che i miRNA siano repressori della trascrizione, ma recentemente è emerso che possano essere anche attivatori della trascrizione in certe condizioni, come ad esempio in specifici momenti del ciclo cellulare. Il ruolo dei microRNA è stato confermato in molti processi fisiologici, tra i quali la proliferazione, il differenziamento, l’apoptosi e la tumorigenesi; ad esempio, è stato dimostrato un coinvolgimento dei
3
miR-155, miR-146, miR-223 e miR181a nella regolazione della risposta immune, facendo supporre cosi, che una loro alterata espressione possa compromettere il sistema immunitario, determinando lo sviluppo di cancro e patologie autoimmunitarie come la CD. Infine recentemente è stato identificato il pattern di espressione dei miRNA nell’intestino del topo, suggerendo un ruolo chiave per queste molecole anche nell’omeostasi intestinale. Cenni sulla fisiologia del piccolo intestino e sul pathway di Notch L’epitelio intestinale consiste di cellule in rapida proliferazione ed in continuo differenziamento, specializzate in specifiche funzioni, che permettono a tale tessuto di assorbire nutrienti ed acqua dal cibo ingerito e fornire una barriera tra il lume intestinale e la mucosa sottostante. L’unità funzionale del piccolo intestino è rappresentata dall’asse cripta-villo; le cellule staminali che risiedono alla base della cripta, sono in continua proliferazione e originano progenitori che differenzieranno in 4 tipi cellulari: gli enterociti con funzione assorbitiva, le cellule di goblet secernenti muco, quelle enteroendocrine secernenti ormoni (come la serotonina, la sostanza P e la secretina) e quelle di Paneth secernenti peptidi antimicrobici ed enzimi come criptidine e lisozimi. Mentre il differenziamento di enterociti, cellule enteroendocrine e cellule di goblet avviene durante la migrazione dalla cripta all’apice del villo, le cellule di Paneth completano il loro differenziamento alla base della cripta. L’omeostasi intestinale è regolata dall’interazione di diversi pathways, tra cui WNT, BMP e Notch9. I geni Wnt codificano per glicoproteine secrete ricche in cisteina, che si legano a specifici recettori attivando una via di trasduzione del segnale in cui la β-catenina agisce regolando l’attività del fattore trascrizionale Tcf. Il complesso β catenina-Tcf si lega al DNA e attiva la trascrizione dei geni target come il recettore per l’efrina B2 che controlla il corretto posizionamento delle cellule lungo l’asse cripta-villo, e la Bone Morphogenetic Protein 4 (BMP4), che regola, tramite un feedback negativo, il signaling di Wnt. Questo meccanismo risulta dunque essenziale per una proliferazione corretta e per il posizionamento delle cellule staminali o differenziate nelle cripte intestinali o nel villo. Anche Notch è coinvolto nell’omeostasi dell’intestino poiché regola il destino delle cellule staminali nelle cripte promuovendo il loro differenziamento in senso assorbitivo. Nei Mammiferi sono state identificate 4 isoforme del gene Notch (Notch 1-4), che appartiene ad una famiglia di recettori transmembrana; dopo interazione con specifici ligandi (DLL1,3,4 e Jagged 1-2), Notch subisce tagli proteolitici che permettono la traslocazione nel nucleo del suo dominio catalitico dove attiva la trascrizione di specifici geni, interagendo con vari regolatori trascrizionali come Hes. La prima evidenza che il pathway di Notch ha un ruolo nel differenziamento intestinale, si è avuto in esperimenti con topi knockout per Hes1, in cui si ha un differenziamento solo di cellule secretive; inoltre è stato dimostrato che Math1, gene represso da Hes1 è necessario per il differenziamento verso le linee secretive, poiché topi con Math1 mutato presentano un epitelio popolato solo da enterociti. Questi dati nel complesso suggeriscono che il pathway di Notch ha un ruolo chiave nel destino delle cellule intestinali, indirizzando il loro differenziamento in enterociti, e che Hes1 e Math1 svolgono un’azione opposta nella scelta in senso assorbitivo o secretorio. � Scopo del progetto
I miRNA sono regolatori dell’espressione genica, ed è perciò plausibile pensare che alterazioni nella loro regolazione e/o nell’espressione di specifici mRNA da essi
4
regolati, possano compromettere la normale funzione cellulare e contribuire alla patogenesi di numerose malattie, tra cui anche la celiachia. In letteratura, non sono stati descritti fino ad oggi, studi sui cambiamenti nell’espressione genica correlati a miRNA nella malattia celiachia; recentemente, però è stato identificato il pattern di espressione dei miRNA nell’intestino del topo. Lo scopo di questo progetto è proprio quello di identificare il profilo di espressione dei miRNA nella mucosa intestinale di celiaci e di controlli, per individuare quelli differentemente espressi nella CD. Si potranno così selezionare i geni target di questi miRNA e le vie metaboliche in cui sono implicati, al fine di individuare quelli correlati all'insorgenza della patologia. In particolare, i miRNA espressi differentemente solo nei celiaci in fase attiva permetteranno di valutare quelli più strettamente correlati con l’infiammazione; quelli invece differentemente espressi sia in fase attiva che in remissione, forniranno utili indicazioni per comprendere le alterazioni nella regolazione trascrizionale globale dei geni associati alla CD. � Risultati e metodologie impiegate
Pazienti Tutti i soggetti inclusi in questo studio (età compresa tra 2 e 10 anni), nell’ambito del previsto iter diagnostico, sono stati sottoposti a endoscopia gastrointestinale durante la quale è stato prelevato un campione della mucosa della seconda/terza porzione del piccolo intestino; il tessuto è stato immediatamente diviso in aliquote: un’aliquota è stata utilizzata per l’esame istologico richiesto per la conferma diagnostica di CD, un’altra aliquota è stata congelata in azoto liquido per la successiva estrazione dell’RNA. Inoltre, ad ogni paziente è stato prelevato un campione di sangue periferico in EDTA per valutare i parametri biochimici e la suscettibilità alle molecole HLA-DQ2/DQ8. Ad ogni partecipante al progetto è stato richiesto il consenso informato e lo studio è stato approvato dal Comitato etico della Facoltà di Medicina e Chirurgia della Federico II di Napoli. Sono stati selezionati 3 gruppi di pazienti: - 17 pazienti con celiachia in fase attiva sintomatologia suggestiva di celiachia, positività per i marcatori genetici (HLA-DQ2 e/o DQ8) e sierologici tipici della CD (tTG), biopsia intestinale con iperplasia delle cripte, atrofia dei villi ed infiltrazione linfocitaria. - 9 pazienti in remissione a dieta senza glutine da almeno 2 anni, negatività per i marcatori anticorpali, biopsia intestinale senza iperplasia delle cripte ed atrofia dei villi. - 11 controlli negatività ai marcatori sierologici tipici della celiachia, biopsia intestinale senza iperplasia delle cripte, atrofia dei villi ed infiltrazione linfocitaria. Analisi dell’espressione dei miRNA nella mucosa intestinale dei pazienti selezionati L'RNA totale comprendente anche i miRNA è stato estratto dalle biopsie di pazienti e controlli utilizzando il Kit mirVana (Ambion). La qualità e la concentrazione dell’RNA sono state valutate rispettivamente mediante elettroforesi e spettrofotometria. L'RNA totale è stato retro trascritto per valutare il profilo di espressione dei miRNA mediante tecnologia TaqMan Low Density Array (TLDA). E’ una nuova metodologia costituita da micro fluidic cards in cui sono depositati differenti saggi di real time per 365 miRNA umani; la TLDA utilizza un nuovo step di retrotrascrizione (RT) sfruttando hairpin-loop RT primers che sono specifici solamente per le specie mature dei miRNA. I dati di fluorescenza così generati, sono stati analizzati dal software SDS
5
2.3 (Applied Biosystems) usando il metodo comparativo ∆CT; tale metodo ha permesso di confrontare il profilo di espressione dei miRNA dei celiaci in fase attiva e in remissione, rispetto ai controlli, al fine di individuare quelli differentemente regolati nella celiachia. I risultati sono stati espressi come RQ (Relative Quantification), che indica il grado di espressione del target (miRNA) nel campione da analizzare (celiaco) rispetto allo stesso target in un campione calibratore (controllo). Sono stati considerati sotto- e sovra- espressi quei miRNA rispettivamente con RQ≤0.5 ed RQ≥2.0 in almeno 15/17 pazienti con CD in fase attiva (82%) ed in almeno 7/9 pazienti in remissione (78%). Il controllo endogeno scelto per normalizzare i dati, cioè per rendere minime le differenze di espressione relative alla quantità di RNA, è l’RNU48. Identificazione dei miRNA regolati differentemente nei celiaci rispetto ai controlli L’analisi del profilo di espressione dei miRNA rivela che 90 dei 365 miRNA testati (25%) non sono espressi nel piccolo intestino; oltre il 50% dei miRNA è espresso in modo simile tra celiaci e controlli, mentre circa il 20% (22% nei celiaci attivi e 23% nei celiaci in remissione) è differentemente espresso tra celiaci e controlli; in particolare, 27 e 55 miRNA sono rispettivamente sovra- e sotto- espressi nei celiaci attivi; 22 e 62 miRNA invece sono rispettivamente sovra- e sotto- espressi nei celiaci in remissione. Tra questi miRNA differentemente espressi, ne sono stati identificati 30, di cui 9 sovraespressi e 21 sottoespressi, con simili livelli di espressione sia nei celiaci in fase attiva che in quelli in remissione. Tra questi miRNA sovraespressi, è stato individuato il miR-449a poiché presenta i livelli di RQ più alti: 55.18±16.45 e 15.43±7.69 (RQ±SEM) rispettivamente nei celiaci attivi ed in quelli in remissione. PCR Real Time quantitativa per il miR-449a Per confermare la sovra-espressione del miR-449a nei celiaci rispetto ai controlli, è stato scelto come metodo di validazione la PCR Real Time quantitativa (qRT-PCR) perché è rapido, sensibile, ad alto rendimento e richiede minori quantità di RNA, rispetto ad altre tecniche di analisi dell’mRNA (i.e. Northern blot). Il risultato ottenuto mediante qRT-PCR nei celiaci attivi (RQ±SEM=2.8±0.9) ha confermato quello conseguito con la TLDA. Identificazione dei geni target del miR-449a e dei pathways ad essi correlati Diversi programmi bioinformatici sono stati usati per predire i geni target del miR-449a; tali algoritmi, valutando diversi parametri (i.e. l’appaiamento e la stabilità termica miRNA-mRNA, la conservazione ed il numero di siti di legame), predicono i geni target con più alta probabilità di legame del miRNA. Per tale scopo è stato usato il programma Mirecords che integra 11 algoritmi di predizione diversi; la correlazione tra il miRNA e il gene target è stata considerata significativa sulla base della predizione di almeno 2 algoritmi. La lista dei geni selezionati in questo modo è stata elaborata con GOTM (Gene Ontology Tree Machine) ed in particolare con KEGG database per identificare i pathways in cui tali target sono implicati. I pathways sono stati raggruppati nei seguenti gruppi funzionali: - Organizzazione e funzione cellulare - Ciclo cellulare e cancro - Biosintesi di macromolecole - Metabolismo E’ interessante notare che, tra i target più ridondanti, in tali gruppi funzionali ci sono geni appartenenti al pathway di Notch, come NOTCH1 (neurogenic locus notch
6
homolog protein 1), KLF-4 (Krueppel-like factor 4), DLL (delta-like 1), LEF1 (lymphoid enhancer-binding factor 1) e NUMBL (numb homolog-like). Poiché Notch ha una funzione importante nel differenziamento delle cellule staminali intestinali, abbiamo investigato tale pathway al fine di valutarne l’eventuale ruolo nella patogenesi della celiachia. Saggio della luciferasi Il saggio della luciferasi ha permesso di confermare che l’interazione del miR-449a con la 3’UTR di NOTCH1 è specifica e funzionale, suggerendo così che cambiamenti nell’espressione di tale miRNA potrebbero effettivamente modulare l’espressione di NOTCH1. qRT-PCR per NOTCH1 ed HES1 Per confermare l’espressione del messaggero di NOTCH1 e di HES1 (noto gene bersaglio di NOTCH1) nel piccolo intestino, è stata allestita una qRT-PCR; nei celiaci attivi i livelli di NOTCH1 ed HES1 sono rispettivamente 3.4±1.3 e 2.2±0.6 (RQ±SEM); nei celiaci in remissione sono rispettivamente 6.5±4.7 e 4.2±2.9 (RQ±SEM). Tale risultato conferma che NOTCH1 ed HES1 sono espressi nel piccolo intestino ed i loro livelli sono sovra-espressi nei celiaci rispetto ai controlli. Analisi immunoistochimica per NOTCH1 ed HES1 E’ stata poi effettuata un’analisi immunoistochimica, mediante anticorpi specifici per NOTCH1 ed HES1 al fine di valutare la loro espressione proteica nel piccolo intestino; in particolare i vetrini colorati sono stati sottoposti a scannerizzazione ed i files ottenuti sono stati elaborati con Definiens Analyst LS5.0 system (Definiens AG, Germany), che permette di contare il numero di cellule positive e di quantificarne il segnale. Tale analisi ha evidenziato che le proteine NOTCH1 ed HES1 sono significativamente meno presenti (p=0.02) nelle cripte dei celiaci (sia in fase attiva che in remissione) rispetto ai controlli. Analisi immunoistochimica per la β-catenina e MUC-2 Dati in letteratura suggeriscono che il destino delle cellule staminali intestinali, sia controllato non solo da Notch, ma anche dal signaling di Wnt10; a tal fine, per valutare la possibile alterazione del pathway di Wnt, è stata eseguita un’analisi immunoistochimica usando anticorpi per la β-catenina (proteina essenziale di questo signaling) e per MUC-2 (mucina-2, glicoproteina espressa dalle cellule di goblet e associata quindi al loro differenziamento). Non ci sono differenze statisticamente significative tra celiaci e controlli per la β-catenina e ciò suggerisce che probabilmente tale pathway non è alterato nella celiachia; inoltre, la localizzazione nucleare della β-catenina è più evidente nelle cripte dei celiaci rispetto ai controlli, indicando che il signaling di Wnt è attivo. Invece, il numero di cellule di goblet nelle cripte è statisticamente ridotto (p<0.04) sia nei celiaci attivi, che in quelli in remissione (numero medio di cellule ± deviazione standard: 18±1.6 e 15±3, rispettivamente) rispetto ai controlli (numero medio di cellule ± deviazione standard: 35.0±7.7). A conferma di tale dato, il numero di cellule di goblet è statisticamente ridotto (p=0.04) anche nei villi dei celiaci in remissione rispetto ai controlli (numero medio di cellule ± deviazione standard: 7.0±1.8 e 20.0±4.9).
7
� Discussione
Lo studio del profilo di espressione dei miRNA nella mucosa intestinale del piccolo intestino, ha permesso di identificare quelli differentemente espressi nei celiaci rispetto ai controlli. In particolare, tra i miRNA upregolati nei celiaci, quello più espresso sia nei pazienti in fase attiva che in quelli in remissione, è il miR-449a. L’analisi bioinformatica ha permesso di identificare come target del miR-449a, geni appartenenti al pathway di Notch, noto signaling coinvolto nel differenziamento delle cellule staminali intestinali. Dopo aver confermato in vitro, che il miR-449a interagisce a livello della 3’UTR di NOTCH1, abbiamo valutato la sua espressione proteica mediante immunoistochimica; nei celiaci, sia in fase attiva che in remissione, c’è una diminuzione dell’espressione di NOTCH1 rispetto ai controlli solo a livello proteico e non del messaggero, e ciò contribuisce a sostenere l’ipotesi che questo recettore possa essere regolato a livello post-trascrizionale. Non ci sono differenze statisticamente significative tra celiaci e controlli per la β-catenina e ciò suggerisce che probabilmente il pathway di Wnt non è alterato nella celiachia; inoltre, la localizzazione nucleare della β-catenina è più evidente nelle cripte dei celiaci rispetto ai controlli, indicando che tale signaling è attivo. Tale risultato è in accordo con dati di western blot ottenuti da Ciccocioppo11 e Juuti-Uusitalo12 in pazienti celiaci e supporta l’ipotesi che il pathway di Notch possa agire in modo separato da quello di Wnt, come dimostrato da uno studio sui topi8. Invece, il numero di cellule di goblet nelle cripte è statisticamente ridotto sia nei celiaci in fase attiva che in quelli in remissione, rispetto ai controlli. In accordo con questi dati, anche Ciacci12 e colleghi riportano una riduzione di tali cellule nei celiaci, anche se, nel loro studio, la differenza è statisticamente significativa solo tra pazienti in fase attiva e controlli (p<0.02). Nel topo invece, è stato dimostrato che la riduzione delle cellule di goblet si osserva attivando Notch8; questo apparente risultato discordante si può spiegare considerando le differenze tra uomo e topo, ma soprattutto l’effetto più complesso esercitato dai miRNA su diversi geni, rispetto all’effetto ottenuto “spegnendo” e/o “accendendo” un singolo gene. Il minor numero di cellule di goblet determina quindi nei celiaci, una diminuita secrezione di muco e quindi un’alterata funzione protettiva della superficie dell’epitelio intestinale a contatto con il lume. Ciò determina un aumento della permeabilità intestinale, come già osservato sia nei celiaci in fase attiva che in quelli in remissione13,14. Da notare che, tra i target del miR-449a, c’e’ anche KLF-4, descritto in letteratura come importante regolatore del differenziamento delle cellule di goblet nel colon15. Infatti, in topi KFL-4-/- si osserva una diminuzione delle cellule di goblet del 90% ed un’espressione di MUC-2 non omogenea nell’epitelio, ad indicare che tale proteina e’ indispensabile per la corretta maturazione di queste cellule16. Abbiamo così ipotizzato, che anche nel piccolo intestino, l’inibizione di KLF-4, mediata dal miR-449a, potrebbe determinare la deplezione di cellule di goblet osservata nei celiaci; tale ipotesi è ovviamente da dimostrare sperimentalmente. In conclusione, tali risultati potrebbero indicare un nuovo evento patogenetico nella CD, contribuendo a spiegare parte del 60% della componente genetica ancora sconosciuta. Bibliografia
1. Bonamico M. et al. Tissue Transglutaminase autoantibody detection in human saliva: a powerful method for celiac disease screening. The Journal of Pediatrics 2004,632-636.
8
2. Dubé C. et al. The prevalence of celiac disease in average-risk and at-risk western European populations: a systematic review. Gastroenterology 2005,128:57-67.
3. Greco l. et al. Genome Search in Celiac Disease. Am. J. Hum. Genet. 1998, 62:669-675.
4. Meresse B. et al. Celiac disease: from oral tolerance to intestinal inflammation, autoimmunity and Lymphomagenesis. Nature 2009,2:8-23
5. Megiorni F. et al. HLA-DQ and Susceptibility to Celiac Disease: Evidence for Gender Differences and Parent-of-Origin Effects. American Journal of Gastroenterology, 2008,997-1003.
6. Tack G. J. et al. The spectrum of celiac disease: epidemiology, clinical aspects and treatment. Nature, 2010,7:204-213.
7. Tinto N. et al. Increased prevalence of celiac disease without gastrointestinal symptoms in adults MICA 5.1 homozygous subjects from the Campania area. Dig Liver Dis. 2008;40,4:248-52.
8. Bartel DP. MicroRNAs: target recognition and regulatory functions. Cell. 2009;136,2:215-233.
9. Fre S. et al. Notch signals control the fate of immature progenitor cells in the intestine. Nature. 2005;435,7044:964-8.
10. Festen E.A.M. et al. Inflammatory bowel disease and celiac disease: overlaps in the pathology and genetics, and their potential drug targets. Endocr Metab Immune Disord Drug Targets 2009;9,2:199-218.
11. Ciccocioppo R. et al. Altered Expression, Localization, and Phosphorylation of Epithelial Junctional Proteins in Celiac Disease. Am J Clin Pathol 2006;125:502-511.
12. Juuti-Uusitalo K. et al. Gluten affects epithelial differentiation-associated genes in small intestinal mucosa of coeliac patients. Clin Exp Immunol. 2007;150,2:294-305.
13. Ciacci C. et al. Selective reduction of intestinal trefoil factor in untreated coeliac disease. Clin Exp Immunol. 2002;130,3:526-531.
14. Greco L. et al. Genome Search in Celiac Disease Am. J. Hum. Genet. 1998,62:669-675.
15. Katz J.P. et al. The zinc-finger transcription factor Klf4 is required for terminal differentiation of goblet cells in the colon. Development 2002;129:2619-2628.
16. McConnell B.B. et al. The diverse functions of Krüppel-like factors 4 and 5 in epithelial biology and pathobiology. Bioessays 2007;29,6:549-557.

9
Analysis of microRNAs expression pattern in small intestine of celiac patients Celiac disease (CD) is a chronic inflammatory disease characterized by small intestinal mucosal injury and nutrient malabsorption in genetically susceptible individuals following the dietary ingestion of gluten1. The disease is characterized by villous atrophy, intraepithelial lymphocyte infiltration, chronic inflammation and activation of lamina propria T cells. The common genetic background in CD is the presence of heterodimeric HLA class II molecules DQ2 or DQ8 that account for ~40% of the genetic predisposition in CD2; several susceptibility loci not related HLA have been identified, but their contribution is only 3-4%3. Further, in addition to DNA variations, also gene transcription regulation, such as microRNAs (miRNAs) mechanism, could be involved in CD pathogenesis. MiRNAs are small non coding RNAs regulating basic cellular functions including proliferation, differentiation and death4. Indeed, it is easy to conceive that a defective miRNA-based mRNA regulation may compromise normal cell function and cause genetic diseases. The aim of this project is to perform an extensive study of the different miRNAs expression pattern in intestinal mucosa from CD patients at different stages of the disease [17 with active CD and 9 at gluten free diet (GFD)] and from 11 controls, to investigate the role of these molecules in transcriptional regulation in CD. We detect and quantify the expression profiling of 365 mature miRNAs using TaqMan Low Density Array methodology and Comparative CT method. Expression profiling revealed that the 25% of miRNAs tested are not expressed in jejunal intestine. Among the large set of expressed microRNAs over 50% of miRNAs are expressed at similar levels in CD and in control patients whereas respectively, the 22% and 23% of miRNAs were differently expressed in active CD and in GFD patients vs controls. Among these miRNAs upregulated, miR-449a shows very high levels: 55.18±16.45 and 15.43±7.69 (RQ±SEM) in active CD and in GFD children respectively. The quantitative RT-PCR confirmed the high level of miR-449a in active CD patients vs controls (mean RQ±SEM: 2.8±0.9). The bioinformatic analysis identified several target genes of miR-449a, belonging to Notch pathway such as NOTCH1, KLF-4, DLL, LEF1 and NUMBL. Notch signaling is a gatekeeper of the progenitor/stem cell compartment of the intestine5. The luciferase reporter assay confirmed that the effective, specific and functional interaction between miR-449a and NOTCH1. The quantitative RT-PCR confirmed the expression of NOTCH1 and HES1 (a target gene of NOTCH1) mRNAs in active CD patients (RQ±SEM: 3.4±1.3 and 2.2±0.6, respectively) and in GFD patients (RQ±SEM: 6.5±4.7 and 4.2±2.9, respectively). In addition, immunohistochemistry showed that NOTCH1- and HES1- positive cells were significantly fewer in CD patients vs controls. Because NOTCH1 signals interact with the Wnt pathway to influence the intestinal stem cell fate, we investigated both the Wnt pathway and secretory goblet cells. We showed a similar β-catenin expression in CD and in control children, suggesting that the Wnt pathway is not altered in CD, and a reduced number of goblet cells indicating an altered differentiation in celiac small intestine. In conclusion, we investigated miRNA expression in celiac small intestine and detected very high miR-449a expression levels in both active CD and GFD patients. These data demonstrate an altered miRNA gene regulation in CD patients than in controls, in association with a reduced NOTCH1 pathway and with a decrease differentiation of intestinal cells towards the secretory goblet cell lineage. Our findings suggest a novel pathogenic event in CD. References: 1Meresse B. et al. Celiac disease: from oral tolerance to intestinal inflammation, autoimmunity and Lymphomagenesis. Nature 2009(2):8-23.

10
2Di Sabatino A. et al. Coeliac disease. The Lancet 2009 (373)1480-1493. 3Schuppan D. et al. Celiac disease: from pathogenesis to novel therapies. Gastroenterology. 2009 137(6):1912-1933. 4Hwang H-W. et al. MicroRNAs in cell proliferation, cell death, and tumorigenesis. British Journal of Cancer 2006(94):776-780. 5Radtke F. et al. From Gut Homeostasis to Cancer. Current Molecular Medicine 2006(6):275-289.

11
INDEX
RIASSUNTO pag. 1
SUMMARY pag. 9
INDEX pag. 11
INTRODUCTION pag. 13
CELIAC DISEASE pag. 13
Epidemiology pag. 13
Clinical features and Diagnosis pag. 13
Pathogenesis of Celiac Disease pag. 16
Environmental Factors pag. 16
Environmental trigger pag. 16
Environmental cofactors pag. 18
Genetic factors pag. 19
HLA Class II genes pag. 19
Non-HLA genes pag. 22
The innate and the adaptive immunity pag. 22
Therapy in celiac disease pag. 26
MICRORNAs pag. 28
Role of miRNAs in the intestine pag. 31
MicroRNA-449a pag. 31
PHYSIOLOGY OF THE SMALL INTESTINE pag. 33
Signaling pathways regulating intestinal homeostasis pag. 35
Wnt pathway pag. 35
Notch pathway pag. 36
TGF-/BMP pathway pag. 39
Hedgehog pathway pag. 41
AIMS OF THIS PROJECT pag. 43
MATERIALS AND METHODS pag. 44
Patients and controls pag. 44
Biochemical parameters pag. 44
DNA extraction pag. 46
HLA typing pag. 46
Electrophoresis pag. 46
Histopathological analysis pag. 47
12
RNA extraction pag. 47
TaqMan Low Density Array (TLDA) technology pag. 47
SDS Software Plate Documents pag. 48
Comparative CT Method (∆∆Ct) and SDS Version 2.3 Software pag. 48
TaqMan chemistry pag. 51
Bioinformati prediction of target genes for miRNAs pag. 52
Reverse Trascription–PCR (RT-PCR) pag. 53
Quantitative Real Time-PCR (qRT-PCR) of miRNA and mRNAs pag. 53
Transfection and inhibition experiments pag. 55
Immunohistochemistry for NOTCH1, HES1, β-catenin and MUC-2 pag. 55
Scanning and automated image analysis of NOTCH1, HES1 and β-catenin proteins
pag. 56
RESULTS pag. 57
Identification of miRNAs in small intestine through TLDA methodology pag. 57
qRT-PCR for miR-449a pag. 61
Identification of miRNA targets pag. 61
Identification of interesting pathways pag. 61
Luciferase assay and validation of the interaction between miR-449a and NOTCH1-3’UTR
pag. 64
qRT-PCR for NOTCH1 and HES1 pag. 64
Immunohistochemistry for NOTCH1 and HES1 pag. 64
Immunohistochemistry for β-catenin and MUC-2 pag. 67
DISCUSSION pag. 71
BIBLIOGRAPHY pag. 73
LIST OF ORAL COMUNICATIONS AND POSTERS pag. 83
PUBLICATIONS LIST pag. 83
INTERNATIONAL WORK EXPERIENCE pag. 83
13
INTRODUCTION CELIAC DISEASE Epidemiology Celiac disease (CD) is a chronic inflammatory disease characterised by small intestinal mucosal injury and nutrient malabsorption in genetically susceptible individuals following the dietary ingestion of “gluten”. Environmental factors have also been reported to exert an important role. This pathology is characterized by the presence of anti-tissue transglutaminase antibodies in the serum and by damage at the level of the small intestine with villous atrophy, intraepithelial lymphocyte infiltration, chronic inflammation and activation of lamina propria T cells. The currently estimated prevalence is 1%, with a statistical range of probability of 0.5-1.26% in the general population in Europe and USA1-2. The prevalence of biopsy-proven celiac disease in Italian school children was reported to be 1:1063. The true prevalence of CD is difficult to estimate because of its different presentation, particularly in presence of few or no symptoms (underestimated cases); moreover, advances in diagnostic methods and improvement in screening have played a part in the increase observed. The prevalence of CD is increased in subjects with elevated aminotransferase levels, autoimmune diseases and chromosomal aberrations. For example, the prevalence of autoimmune thyroiditis (AT) in CD is about 4 times greater than that found in the age matched Sardinian schoolchildren background population, indicating that CD is a risk factor predisposing to AT4. A large multicenter study in the United States showed an increased CD prevalence in high-risk groups, including patients with autoimmune insulin-dependent diabetes mellitus (AIDDM), Sjogren’s syndrome, osteoporosis, Down syndrome5 and first-degree relatives of CD patients. These findings raise interesting questions as to whether abnormal immune responses at the level of the gut mucosa, when exposed to environmental antigens, have a role in systemic autoimmune disease, or whether these associations reflect more an underlying genetic predisposition. Proposed mechanisms of association include abnormal regulation of intestinal permeability and increased autoantibody production in the setting of chronic gut inflammation6. Clinical features and Diagnosis The first case of CD was described by Aretaeus of Cappadocia, living in the second century, which recorded a malabsorptive syndrome with chronic diarrhoea7. The typical jejunal damage associated with active celiac disease, showing villous atrophy, crypt hypertrophy and increased intraepithelial lymphocyte count, was first described in 1957 by John Paulley in the UK. The clinical spectrum of celiac disease is wide, including cases with either typical intestinal or “atypical” extraintestinal features, or silent forms that are occasionally discovered because of serological screening8. The variability in the age of onset of symptoms may be dependent on the amount of gluten in the diet and other environmental factors such as for example, duration of breast-feeding. The classic form of CD in children consists of gastrointestinal symptoms starting between 6 and 24 months of age, after the introduction of gluten in the diet. Infants and young children typically present with chronic diarrhea, anorexia, abdominal distension, abdominal pain, poor weight gain or weight loss and vomiting. Severe malnutrition and even cachexia can occur if the diagnosis is delayed9.
14
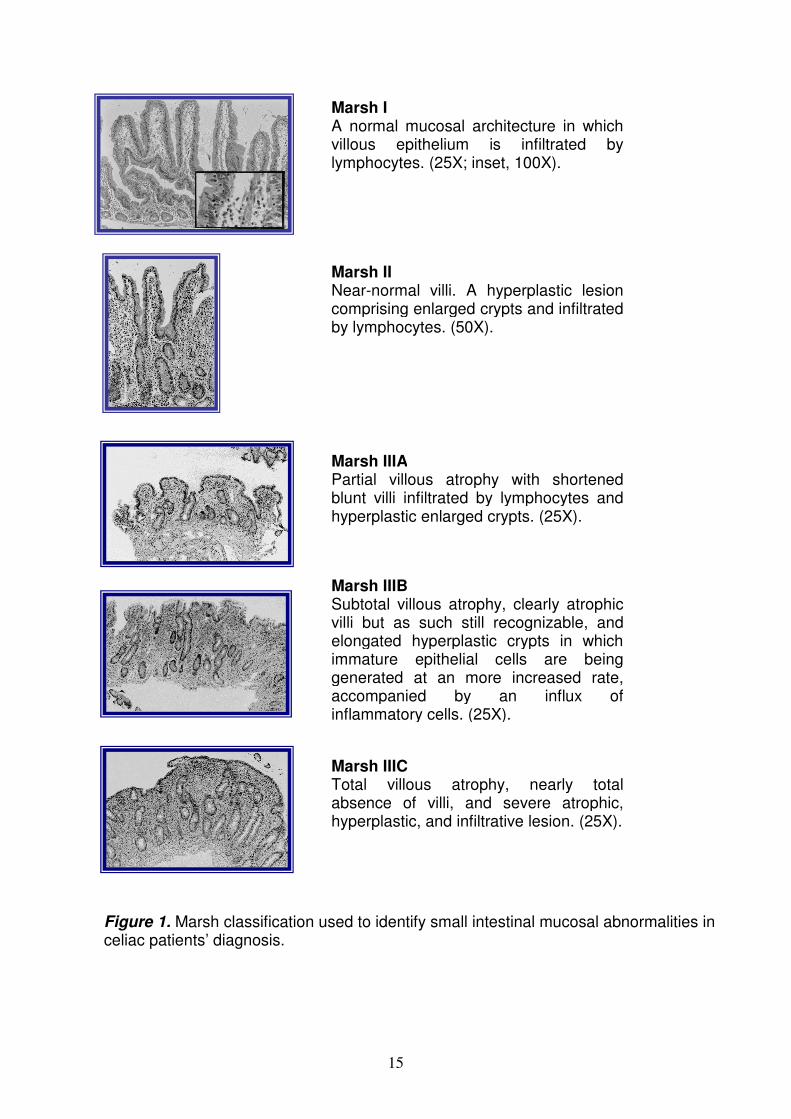
According to the revised criteria of the European Society for Paediatric Gastroenterology, Hepatology and Nutrition (ESPGHAN) and European Society for Paediatric Gastroenterology and Nutrition (ESPGN), the diagnosis of celiac disease is firstly based on the characteristic small intestinal mucosal abnormalityies on histological examination of a biopsy specimen10. The lesion in CD is localized in the proximal part of the small intestine; the duodenal histology showed intraepithelial lymphocytosis, crypt hyperplasia and various degree of villous atrophy. The small intestinal mucosal abnormalities are classified according to Marsh criteria in 3 groups. Marsh I comprises normal mucosal architecture in which the villous epithelium is markedly infiltrated by lymphocytes only when the lymphocytosis score is >30 (30 lymphocytes per 100 enterocytes); a hyperplastic lesion comprising enlarged crypts in which immature epithelial cells are being generated at an increased rate, accompanied by an influx of inflammatory cells, characterizes Marsh II. Marsh III comprised a large spectrum ranging from minor to severe destructive lesion and for this reason is classified into three subgroups as follows: Marsh IIIA, in which shortened blunt villi are associated with a mild infiltration of lymphocytes in epithelial cells, accompanied by enlarged and hyperplastic crypts; Marsh IIIB, clearly atrophic but still recognizable villi, with the addition of enlarged crypts whose immature epithelial cells are being generated at an more increased rate, accompanied by an influx of inflammatory cells; and Marsh IIIC, nearly total absence of villi, with severe atrophic, hyperplastic, and infiltrative lesions11 (Figure 1). Secondly a clear cut clinical remission has to be observed on a strict gluten free diet (GFD) with relief of all symptoms of the disease. In asymptomatic patients, however, a control biopsy is needed to prove mucosal recovery when the patient is taking a gluten free diet. Although an intestinal biopsy is still considered necessary to confirm the diagnosis of CD, serological tests are frequently used as screening method; they include anti-gliadin IgA and IgG (AGA), anti-endomysium IgA (EMA) and anti-tissue transglutaminase IgA (tTG or TG2) antibodies. The single most sensitive and specific serologic marker of celiac disease is the IgA anti-tTG or anti-EMA11. These antibodies are present at diagnosis in a child with typical abnormalities in small intestinal mucosa, and they disappear in parallel to a clinical response to a gluten free diet12. Measurement of serum concentration of tTG-IgA is often recommended for initial testing because of its high sensitivity and specificity for celiac disease. In symptomatic individuals, the positive predictive value of EMA and tTG assays for finding biopsy evidence of CD approaches 1.00 and the probability of identifying a celiac enteropathy at the small intestinal biopsy is almost 100%13. In screening-identified individuals, AGA+EMA, EMA alone and tTG alone have positive predictive values for biopsy evidence of CD ranging from 0.6 to 1.0012. Recently a new test detects antibodies binding synthetic deamidated gliadin-related peptides (DGPs)14. Although their sensitivity for CD is lower than that of EMA and tTG, DGP-AGA IgG has a very high specificity (98.9%) for CD14. In addition, a novel non-invasive method [sensitive fluid-phase radioimmunoassay (RIA)] can detect tTG autoantibodies (tTG-Ab) in saliva; the correlation between saliva and serum tTG-Ab titers was r=0.826, p=0.0142. Patients with so called “potential” celiac disease show positivity of serum celiac autoantibodies despite a (nearly) normal histological picture at the small intestinal biopsy. In many of these cases, the deterioration of jejunal architecture takes place over time. Implementation of the gluten-free diet is indicated in potential celiac disease, both for treating symptoms and for preventing late-onset complications.
15
Marsh I A normal mucosal architecture in which villous epithelium is infiltrated by lymphocytes. (25X; inset, 100X).
Marsh II Near-normal villi. A hyperplastic lesion comprising enlarged crypts and infiltrated by lymphocytes. (50X).
Marsh IIIA Partial villous atrophy with shortened blunt villi infiltrated by lymphocytes and hyperplastic enlarged crypts. (25X).
Marsh IIIB Subtotal villous atrophy, clearly atrophic villi but as such still recognizable, and elongated hyperplastic crypts in which immature epithelial cells are being generated at an more increased rate, accompanied by an influx of inflammatory cells. (25X).
Marsh IIIC Total villous atrophy, nearly total absence of villi, and severe atrophic, hyperplastic, and infiltrative lesion. (25X).
Figure 1. Marsh classification used to identify small intestinal mucosal abnormalities in celiac patients’ diagnosis.
16
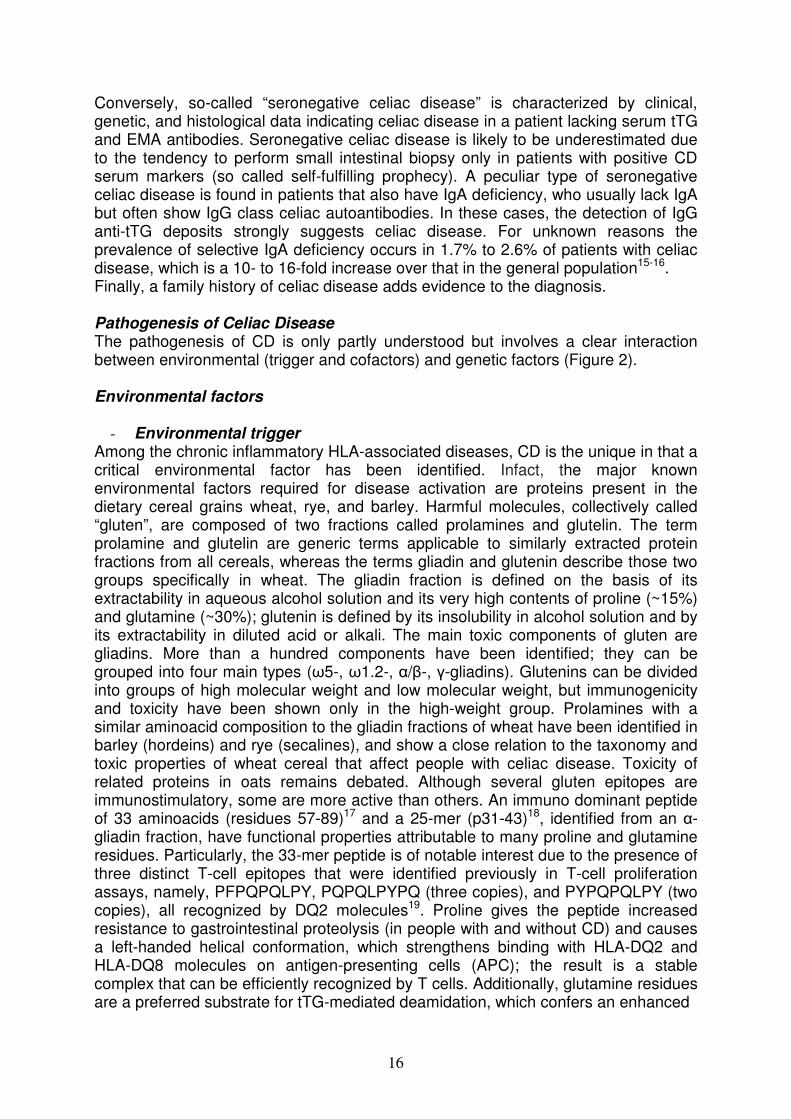
Conversely, so-called “seronegative celiac disease” is characterized by clinical, genetic, and histological data indicating celiac disease in a patient lacking serum tTG and EMA antibodies. Seronegative celiac disease is likely to be underestimated due to the tendency to perform small intestinal biopsy only in patients with positive CD serum markers (so called self-fulfilling prophecy). A peculiar type of seronegative celiac disease is found in patients that also have IgA deficiency, who usually lack IgA but often show IgG class celiac autoantibodies. In these cases, the detection of IgG anti-tTG deposits strongly suggests celiac disease. For unknown reasons the prevalence of selective IgA deficiency occurs in 1.7% to 2.6% of patients with celiac disease, which is a 10- to 16-fold increase over that in the general population15-16. Finally, a family history of celiac disease adds evidence to the diagnosis. Pathogenesis of Celiac Disease The pathogenesis of CD is only partly understood but involves a clear interaction between environmental (trigger and cofactors) and genetic factors (Figure 2). Environmental factors
- Environmental trigger Among the chronic inflammatory HLA-associated diseases, CD is the unique in that a critical environmental factor has been identified. Infact, the major known environmental factors required for disease activation are proteins present in the dietary cereal grains wheat, rye, and barley. Harmful molecules, collectively called “gluten”, are composed of two fractions called prolamines and glutelin. The term prolamine and glutelin are generic terms applicable to similarly extracted protein fractions from all cereals, whereas the terms gliadin and glutenin describe those two groups specifically in wheat. The gliadin fraction is defined on the basis of its extractability in aqueous alcohol solution and its very high contents of proline (~15%) and glutamine (~30%); glutenin is defined by its insolubility in alcohol solution and by its extractability in diluted acid or alkali. The main toxic components of gluten are gliadins. More than a hundred components have been identified; they can be grouped into four main types (ω5-, ω1.2-, α/β-, γ-gliadins). Glutenins can be divided into groups of high molecular weight and low molecular weight, but immunogenicity and toxicity have been shown only in the high-weight group. Prolamines with a similar aminoacid composition to the gliadin fractions of wheat have been identified in barley (hordeins) and rye (secalines), and show a close relation to the taxonomy and toxic properties of wheat cereal that affect people with celiac disease. Toxicity of related proteins in oats remains debated. Although several gluten epitopes are immunostimulatory, some are more active than others. An immuno dominant peptide of 33 aminoacids (residues 57-89)17 and a 25-mer (p31-43)18, identified from an α-gliadin fraction, have functional properties attributable to many proline and glutamine residues. Particularly, the 33-mer peptide is of notable interest due to the presence of three distinct T-cell epitopes that were identified previously in T-cell proliferation assays, namely, PFPQPQLPY, PQPQLPYPQ (three copies), and PYPQPQLPY (two copies), all recognized by DQ2 molecules19. Proline gives the peptide increased resistance to gastrointestinal proteolysis (in people with and without CD) and causes a left-handed helical conformation, which strengthens binding with HLA-DQ2 and HLA-DQ8 molecules on antigen-presenting cells (APC); the result is a stable complex that can be efficiently recognized by T cells. Additionally, glutamine residues are a preferred substrate for tTG-mediated deamidation, which confers an enhanced
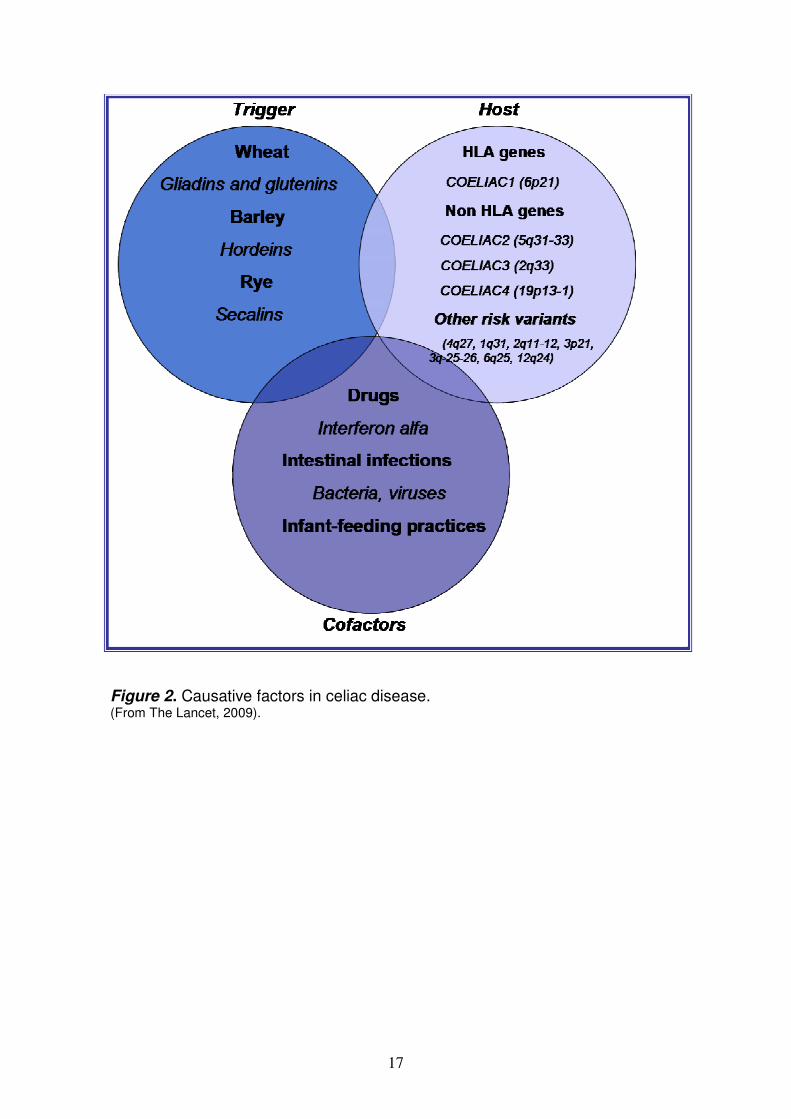
17
Figure 2. Causative factors in celiac disease. (From The Lancet, 2009).
18
immunogenicity; tTG is constitutively expressed in the intestinal lamina propria and transiently activated upon tissue damage. It plays a physiological role in tissue repair by promoting protein cross-linking via the formation of isopeptide bonds between lysine and glutamine residues. In active celiac disease, the expression of tTG is increased and it is considered to be the predominant autoantigen for this pathology. It has been suggested that tTG cross-linked to gluten can be recognized as a hapten and stimulate the production of specific IgA. This attractive hypothesis to explain the appearance of CD specific autoantibodies, however, could not be demonstrated even though the disappearance of autoantibodies occurs with a gluten-free diet. So, CD is the result of the “civilized” human diet becoming rich in gluten-containing grains and the coincidence that protease-resistant peptides derived from partially digested gluten contain motifs that favour their deamidation by intestinal tTG and enhance their binding to DQ2 and DQ8 molecules20. In addition, gluten can trigger CD8+ T cell responses in the lamina propria and may expand the intraepithelial lymphocyte population independently of HLA presentation. How the immunogenic gluten peptides reach the lamina propria from the intestinal lumen remains controversial. There is evidence of a paracellular pathway through defective tight junctions (TJ), but other studies showed that much of the transport occurs via epithelial transcytosis, especially in the inflammed mucosa of patients with celiac disease. A third but yet unproven possibility is the sampling of gluten peptides by lamina propria dendritic cells (DCs). This latter was shown in mice but not in humans; DCs can infact project protrusions between intestinal epithelial cells reaching the intestinal lumen. For the transcellular pathway, macromolecule uptake occurs by endocytosis, followed by fusion with lysosomes (phagolysosomes) with possible degradation of the macromolecules before being delivered in the submucosa. Conversely, macromolecules crossing through the paracellular pathway reach the submucosa unmodified21. Particularly, the paracellular passage of gluten is not proven, but under physiologic conditions, access of gliadin to gut associated lymphoid tissue is prevented by competent intercellular TJ that limit passage of macromolecules (including gliadin peptides) across the intestinal epithelial barrier. Instead, in susceptible individuals, the interplay between the initiating stimulus (i.e. gliadin) and intestinal cells triggers TJ disassembly. It has been demonstrated an amplified expression of zonulin (a protein implicated in the opening of tight junctions) and Th1-induced changes in the expression, localisation, or phosphorylation of epithelial junctional proteins in active disease22. Wapenaar and co-workers identified variants in genes coding for tight junctional proteins such as PARD3, MAGI2 and MYO9B20, suggesting that heritable factors might contribute to intestinal barrier impairment23.
- Environmental cofactors Recent observational studies suggest that the introduction of small amounts of gluten while the infant is still breast-fed may reduce the risk of CD. A metaanalysis showed that the risk of CD was significantly reduced in infants who were breast-feeding at the time of gluten introduction (pooled odds ratio 0.48, 95% CI 0.40-0.59) compared with infants who were not breastfeeding during this period. Both breast-feeding during the introduction of dietary gluten, and increasing duration of breast-feeding, were associated with reduced risk for the development of CD24. Infact, breast milk is not only a source of nutrition for the infant during this time, but it also provides antigens for the developing immune system to learn and develop appropriate immune regulatory mechanisms for maintenance of intestinal homeostasis; milk provides bioactive factors that directly modulate immune response development as well as
19
factors that promote colonization of the intestine by bacterial flora, which in turn influence immune response development. Particularly, the breast milk cytokines present in mammalian milks have the potential to regulate the immune response to food antigens in infants because they are capable of inhibiting excess inflammation and modulating epithelial proliferation25. The timing of gluten introduction in the diet seems also important in the pathogenesis of CD: children exposed to gluten containing foods in the first 3 months of life had a 5-fold increased risk of CD compared with children exposed to gluten containing foods at 4 to 6 months26. So, an optimal window (between 4 and 7 months) for dietary gluten introduction, when tolerogenic responses may be promoted, has been suggested by ESPGHAN. Other factors such as socioeconomic conditions must contribute to the CD incidence in the population because inferior prosperity, standard of hygiene, variation in gut flora, infections (such as hepatitis A virus, Helicobacter pylori and Toxoplasma gondii) and differences in diet, which are factors involved in the maturation of immunoregulatory functions, may in turn precipitate CD development27. Infact, among the environmental factors investigated in the development of celiac disease are specific infectious agents. A prospective study showed that frequent rotavirus infections, the most common cause of childhood gastroenteritis, represent an independent risk factor for CD in genetically susceptible individuals28. Most children had an infection with rotavirus by 3 years of age. Rotavirus infection changes the cytokine balance and the permeability in the intestinal mucosa, potentially enhancing penetration of gluten peptides and may initiate the immune process leading to celiac disease. If this is the case, worldwide implementation of a rotavirus vaccine might diminish the occurrence of this pathology. In addition, it is well known that the intestinal microbiota impacts the integrity and maturation of the gut immune system and may therefore modulate immune host responses to dietary antigens29. Infact, probiotic strains can differently modulate both the innate and adaptive immune responses in DQ8 transgenic mice, a model of gluten sensitivity; for example, L. Fermentum and L. plantarum were able to stimulate the lipopolysaccharide (LPS)-inducible interleukin-12 (IL-12), a critical Th1-skewing cytokine that elicits interferon-γ (IFN-γ) production by T cells and by natural killer (NK) cells; B. lactis, L. plantarum and L. paracasei were able to induce high levels of tumor necrosis factor-α8 (TNF-α) in DCs30. Genetic Factors
- HLA Class II Genes The strong genetic influence in CD is apparent, as the concordance rate in monozygotic twins is ~75%, whereas in dizygotic twins is 20% and in first degree relatives is 10%31. The common genetic background in CD is the presence of heterodimeric HLA class II genes HLA-DQ2 or HLA-DQ8. It is currently estimated that HLA genes account for ~40% of the genetic predisposition in CD32 and there is an increased frequency in females (94%) compared with males (85%) of celiac disease (p=1.6x10⁻³) in Italy33. The class II molecules, encoded on CELIAC 1 locus (Chr. 6p21.31), are expressed on APC, mainly macrophages, DCs and B cells. These molecules conferred CD susceptibility by promoting the presentation of gluten peptides to the intestinal adaptive immune system; this can lead to activation of gluten-specific CD4+ T-helper 1 (Th1) cells in the lamina propria that are central effector cells of the intestinal inflammation resulting in crypt hyperplasia and villus atrophy. Infact, the derivation of DQ2/8-restricted gluten specific CD4+ T cell clones from duodenal lamina propria of CD patients, was the first evidence that these molecules conferred susceptibility to CD. Approximately 5-10% CD subjects express
20
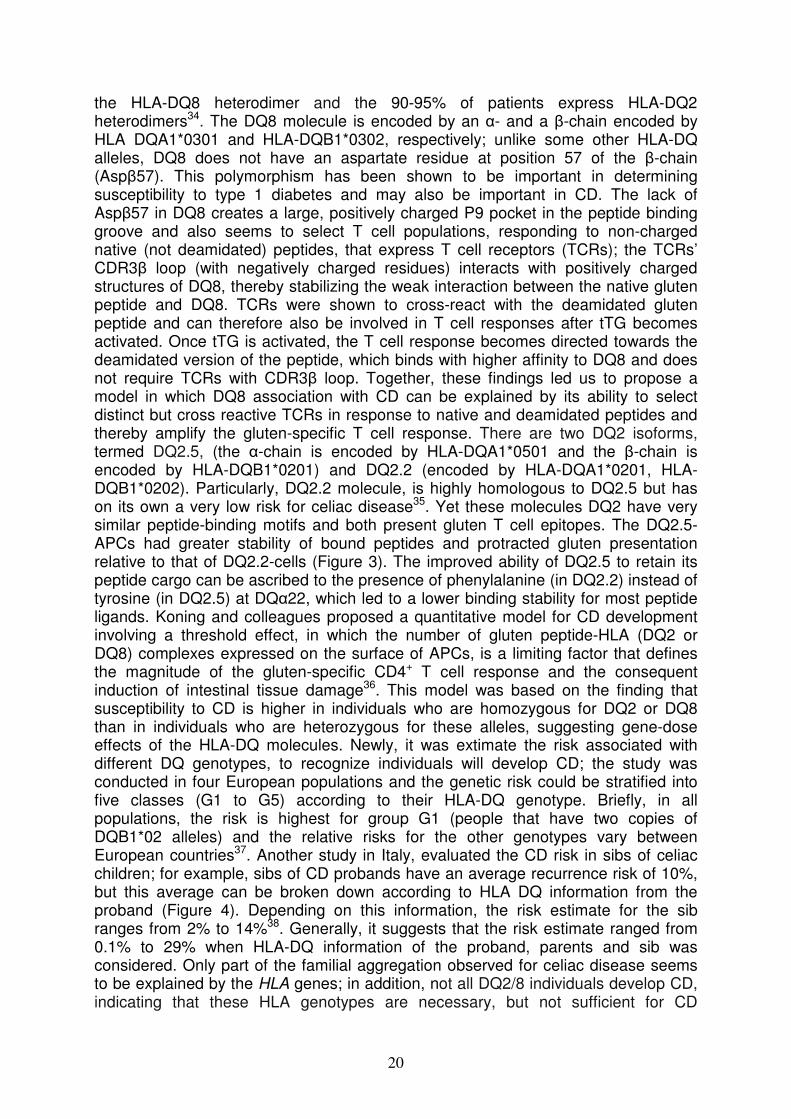
the HLA-DQ8 heterodimer and the 90-95% of patients express HLA-DQ2 heterodimers34. The DQ8 molecule is encoded by an α- and a β-chain encoded by HLA DQA1*0301 and HLA-DQB1*0302, respectively; unlike some other HLA-DQ alleles, DQ8 does not have an aspartate residue at position 57 of the β-chain (Aspβ57). This polymorphism has been shown to be important in determining susceptibility to type 1 diabetes and may also be important in CD. The lack of Aspβ57 in DQ8 creates a large, positively charged P9 pocket in the peptide binding groove and also seems to select T cell populations, responding to non-charged native (not deamidated) peptides, that express T cell receptors (TCRs); the TCRs’ CDR3β loop (with negatively charged residues) interacts with positively charged structures of DQ8, thereby stabilizing the weak interaction between the native gluten peptide and DQ8. TCRs were shown to cross-react with the deamidated gluten peptide and can therefore also be involved in T cell responses after tTG becomes activated. Once tTG is activated, the T cell response becomes directed towards the deamidated version of the peptide, which binds with higher affinity to DQ8 and does not require TCRs with CDR3β loop. Together, these findings led us to propose a model in which DQ8 association with CD can be explained by its ability to select distinct but cross reactive TCRs in response to native and deamidated peptides and thereby amplify the gluten-specific T cell response. There are two DQ2 isoforms, termed DQ2.5, (the α-chain is encoded by HLA-DQA1*0501 and the β-chain is encoded by HLA-DQB1*0201) and DQ2.2 (encoded by HLA-DQA1*0201, HLA-DQB1*0202). Particularly, DQ2.2 molecule, is highly homologous to DQ2.5 but has on its own a very low risk for celiac disease35. Yet these molecules DQ2 have very similar peptide-binding motifs and both present gluten T cell epitopes. The DQ2.5-APCs had greater stability of bound peptides and protracted gluten presentation relative to that of DQ2.2-cells (Figure 3). The improved ability of DQ2.5 to retain its peptide cargo can be ascribed to the presence of phenylalanine (in DQ2.2) instead of tyrosine (in DQ2.5) at DQα22, which led to a lower binding stability for most peptide ligands. Koning and colleagues proposed a quantitative model for CD development involving a threshold effect, in which the number of gluten peptide-HLA (DQ2 or DQ8) complexes expressed on the surface of APCs, is a limiting factor that defines the magnitude of the gluten-specific CD4+ T cell response and the consequent induction of intestinal tissue damage36. This model was based on the finding that susceptibility to CD is higher in individuals who are homozygous for DQ2 or DQ8 than in individuals who are heterozygous for these alleles, suggesting gene-dose effects of the HLA-DQ molecules. Newly, it was extimate the risk associated with different DQ genotypes, to recognize individuals will develop CD; the study was conducted in four European populations and the genetic risk could be stratified into five classes (G1 to G5) according to their HLA-DQ genotype. Briefly, in all populations, the risk is highest for group G1 (people that have two copies of DQB1*02 alleles) and the relative risks for the other genotypes vary between European countries37. Another study in Italy, evaluated the CD risk in sibs of celiac children; for example, sibs of CD probands have an average recurrence risk of 10%, but this average can be broken down according to HLA DQ information from the proband (Figure 4). Depending on this information, the risk estimate for the sib ranges from 2% to 14%38. Generally, it suggests that the risk estimate ranged from 0.1% to 29% when HLA-DQ information of the proband, parents and sib was considered. Only part of the familial aggregation observed for celiac disease seems to be explained by the HLA genes; in addition, not all DQ2/8 individuals develop CD, indicating that these HLA genotypes are necessary, but not sufficient for CD

21
HLA-DQ2.2
HLA-DQ2.5
HLA-DQ2.5
HLA-DQ2.2
T cell response
Reaches threshold
HLA-DQ2.2
HLA-DQ2.5
HLA-DQ2.5
HLA-DQ2.2
T cell response
Reaches threshold
HLA-DQ2.2
HLA-DQ2.5
HLA-DQ2.5
HLA-DQ2.2
T cell response
Reaches threshold
Figure 3. The two types of HLA-DQ2 molecule: HLA-DQ2.5 (encoded by HLA-DQA1*05 and HLA-DQB1*02) and HLA-DQ2.2 (encoded by HLA-DQA1*0201 and HLA-DQB1*02). Only HLA-DQ2.5 is a strong risk factor for celiac disease because binds gluten peptides with higher kinetic stability and allows longer gluten presentation than HLA-DQ2.2. (Modified from Nature Review Immunology, 2009).
Figure 4. Risk for a sib of a proband according to the DQ genotype of the parents. (From Gut, 2007).

22
development. Infact, DQ2 or DQ8 are expressed in 30%-35% of the populations where celiac disease is prevalent, with only 2%-5% of gene carriers developing celiac disease12. Therefore, additional risk factors probably play a role.
- Non-HLA Genes The identification of HLA heterodimers as the major predisposing factor and of its role in the development of an intestinal inflammatory CD4+ T cell response to gluten established a decisive link between the triggering environmental factor and the major predisposing gene; however, the puzzle remains incomplete because it’s still unclear why only a subset of individuals with at risk HLA develop CD, and why some so do very early in infancy closely after their first exposure to gluten, whereas others develop the disease much later in adulthood. So, additional susceptibility loci not related to HLA have been identified by genome-wide association studies [large-scale case control-based association studies using single nucleotide polymorphisms (SNP)], genetic linkage study (identification of chromosomal regions that likely contain disease-causing genes in families with a high prevalence of CD) and candidate gene association study (candidate genes, selected on the basis of current understanding of CD immunopathology, tested for association with CD); each of these loci was estimated to be associated with only a small risk of developing celiac disease. The susceptibility loci that have been identified are 1239 and are summarized in Table 1. Most of these loci contain immune-related genes, in particular genes implicated in the control of the adaptive immune response [integrin (i.e. ITGA4 at 2q31), chemokines, cytokines and their receptors (IL2 and IL21 at 4q2740, IL18RAP at 2q11-2q12, IL12A at 3q25–3q26, CCR1 and CCR3 cluster locus at 3p2141), in T-cell activation (i.e. TAGAP at 6q23.3)41-42, and in maintaining cell adhesion and motility (i.e. LPP at 3q28)43. Furthermore, researchers report that additional susceptibility might be conferred by CELIAC344-45 that encodes the negative costimulatory molecule CTLA4, and CELIAC446, which contains the myosin IXB gene variant encoding an unconventional myosin that alters epithelial actin remodelling. A recent study demostred that the major histocompatibility complex class I chain-related gene A 5.1 allele (MICA 5.1, ligands for NKG2D) occurred more frequently in CD patients than in controls (p<0.05), and that the 5.1/5.1 homozygous genotype increased the risk of gastrointestinal symptoms associated with celiac disease (OR=2.79, 95% CI 1.15-6.79). The notice that most of these genes encode proteins involved in immunity47 supports the notion that CD is an immune-related disorder and possibly provides clues on the immunopathogenesis of CD. However, the overall genetic contribution of these polymorphisms combined was estimated at only 3%-4%12. The innate and the adaptive immunity The immune system, built up progressively during evolution to fight pathogens, involves both innate and adaptive mechanisms. The innate system has a dual function in mammals: a role of immediate barrier albeit with low specificity and no memory, and a second role of antigen-presentation to the adaptive immune system via MHC molecules. The adaptive immune system relies on B and T lymphocytes to permit a delayed but highly specific response endowed with long-term memory. While the immune system has evolved to allow efficacious
23
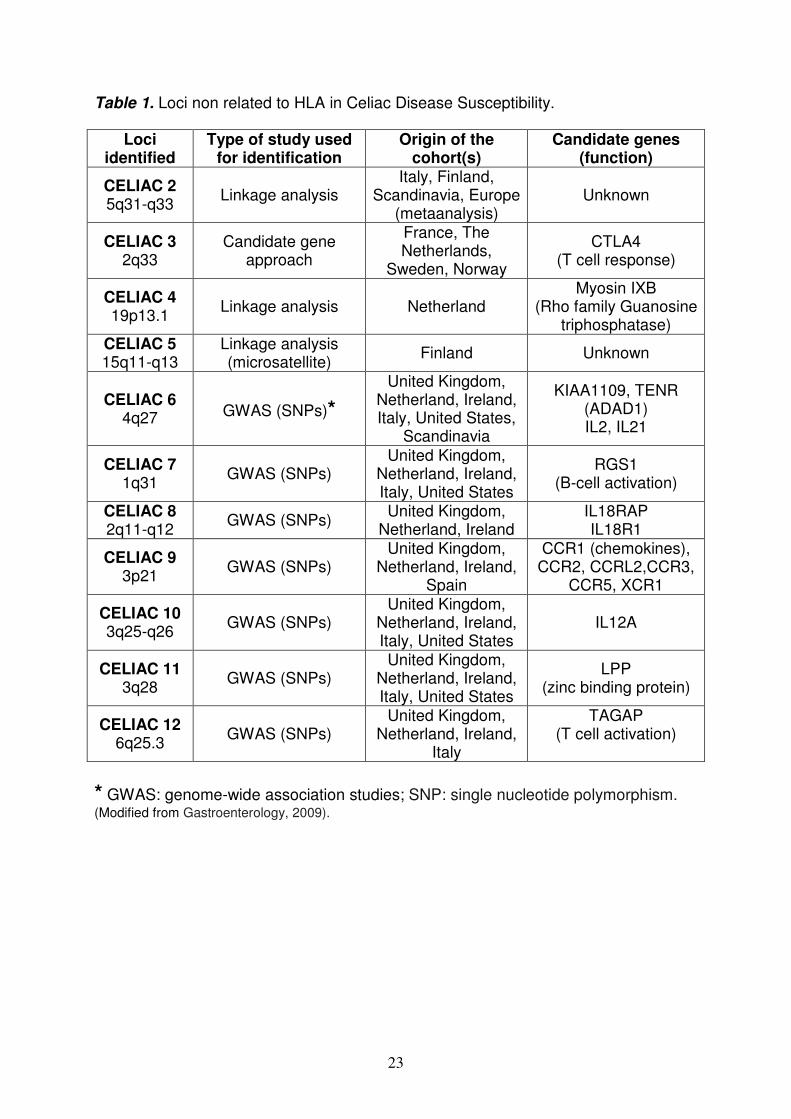
Table 1. Loci non related to HLA in Celiac Disease Susceptibility.
* GWAS: genome-wide association studies; SNP: single nucleotide polymorphism. (Modified from Gastroenterology, 2009).
Loci identified
Type of study used for identification
Origin of the cohort(s)
Candidate genes (function)
CELIAC 2 5q31-q33
Linkage analysis Italy, Finland,
Scandinavia, Europe (metaanalysis)
Unknown
CELIAC 3 2q33
Candidate gene approach
France, The Netherlands,
Sweden, Norway
CTLA4 (T cell response)
CELIAC 4 19p13.1
Linkage analysis Netherland Myosin IXB
(Rho family Guanosine triphosphatase)
CELIAC 5 15q11-q13
Linkage analysis (microsatellite)
Finland Unknown
CELIAC 6 4q27 GWAS (SNPs)*
United Kingdom, Netherland, Ireland, Italy, United States,
Scandinavia
KIAA1109, TENR (ADAD1) IL2, IL21
CELIAC 7 1q31
GWAS (SNPs) United Kingdom,
Netherland, Ireland, Italy, United States
RGS1 (B-cell activation)
CELIAC 8 2q11-q12
GWAS (SNPs) United Kingdom,
Netherland, Ireland IL18RAP IL18R1
CELIAC 9 3p21
GWAS (SNPs) United Kingdom,
Netherland, Ireland, Spain
CCR1 (chemokines), CCR2, CCRL2,CCR3,
CCR5, XCR1
CELIAC 10 3q25-q26
GWAS (SNPs) United Kingdom,
Netherland, Ireland, Italy, United States
IL12A
CELIAC 11 3q28
GWAS (SNPs) United Kingdom,
Netherland, Ireland, Italy, United States
LPP (zinc binding protein)
CELIAC 12 6q25.3
GWAS (SNPs) United Kingdom,
Netherland, Ireland, Italy
TAGAP (T cell activation)
24
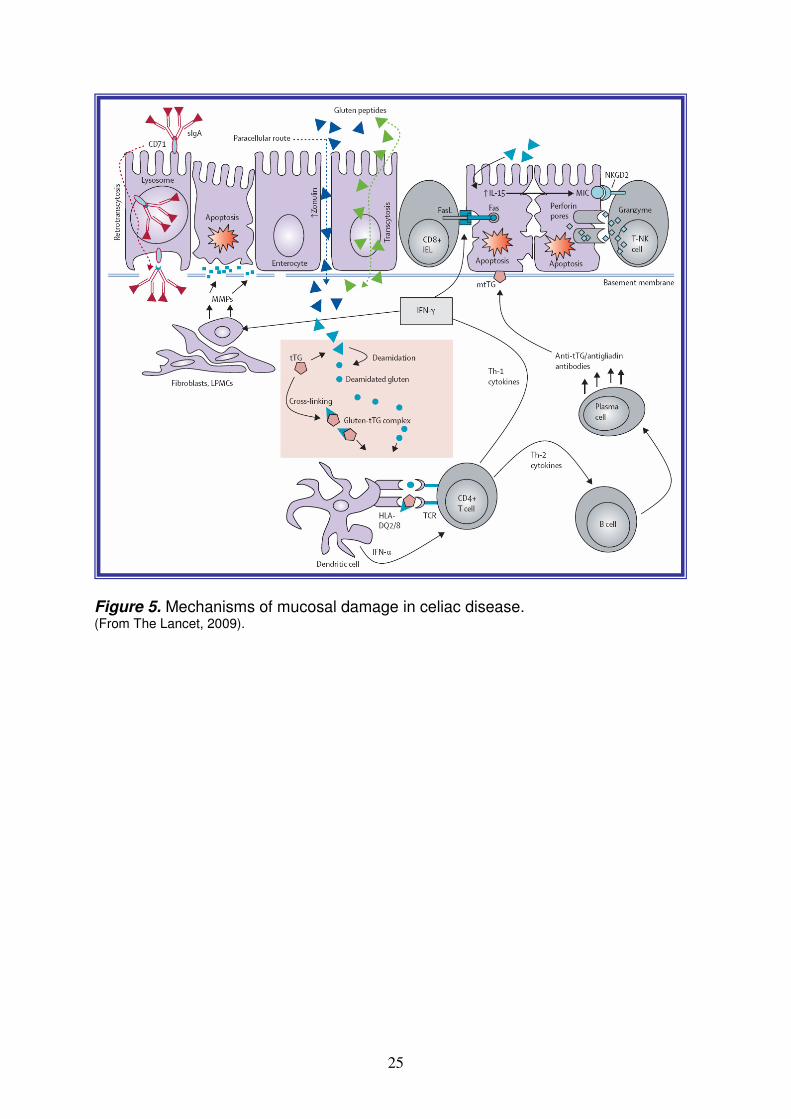
protection against pathogens of increasing sophistication, the counterpart has been the appearance of detrimental immune responses against self antigen or harmless antigens derived from the environment. CD is a well example in which an environmental factor, cereal derived-gluten, can induce an inappropriate immune reaction in genetically predisposed individuals and simultaneously promote immune reactivity against self antigens (Figure 5). The adaptive immunity plays a central role in intestinal inflammation and provides an undisputable link between the two main genetic and environmental factors. Infact, in the small intestinal mucosa, pathogenic gluten-specific CD4+ T cells are central effectors of the intestinal inflammation3,48. Activated CD4+ T-cells produce high levels of pro-inflammatory cytokines (i.e. TNF-α, IL-6, IL-18, IL-12 and IL-21) thus inducing a Th1 pattern dominated by IFN-γ. TNF-α triggers intestinal fibroblasts to secrete matrix metalloproteinases (MMPs), wich leads to mucosal destruction by dissolution of connective tissue. In vivo, expression of MMP-1 and MMP-3 mRNA is increased in fibroblasts of celiac small bowel mucosa. Additionally, through the production of Th-2 cytokines (i.e. IL-4), activated CD4+ T-cells drive the activation and clonal expansion of B cells, which differentiate into plasma cells and produce antigliadin and anti-tTG antibodies. By interacting with the extracellular membrane-bound tTG (mtTG), tTG-autoantibody deposits in the basement-membrane region might induce enterocyte cytoskeleton changes with actin redistribution and consequent epithelial damage. IFN-γ will in turn lead to higher expression of the HLA-DQ molecules and thereby, to increased gluten peptide presentation. Key factors that influence the efficiency of gluten presentation include:
- the level of gluten intake - the enzyme tTG which modifies gluten into high affinity binding peptides for
DQ2 and DQ8 - the HLA-DQ type, as DQ2 binds a wider range of gluten peptides than DQ8 - the gene dose of DQ2 and DQ8 - additional genetic polymorphisms that may influence T cell reactivity49.
The current idea is that gluten could become a self-amplifying loop that could cause limited tissue damage locally. This tissue damage would lead to the release of tTG that will modify native gluten peptides into high affinity ligands for DQ2 and/or DQ8, thereby expanding the gluten-specific CD4+ T cell responses enhancing the role of adaptive immunity; the consequence is an additional tissue damage: the initiation of a second self-amplifying loop. Alternatively, it’s possible that infections occurring in the gastrointestinal tract would generate a pro-inflammatory milieu that might lead to loss of tolerance to native gluten peptides and generate tissue damage simultaneously and thus, initiate deamidation by tTG. Once activated, the CD4+ T cells drive a Th1 response that leads to the development of typical mucosal celiac lesions. Yet, it has become increasingly clear that a highly specific adaptive response against gluten is not sufficient to trigger intestinal inflammation; thus, only a subset of individuals bearing DQ2/8 develops CD. A complementary mechanism is innate immunity, with both a massive increase of intraepithelial lymphocytes (IELs) and gluten peptides toxic for patients despite the fact that they are not recognized by lamina propria CD4+ T cells. Proteins from wheat, rye, or barley (particularly, α2-gliadin peptide p31-43/49) which are distinct from peptides that elicit adaptive immunity, were shown to trigger innate immunity in intestinal epithelia and intestinal organ cultures12. IELs are localized between intestinal epithelial cells at the basolateral side of the epithelium and are thought to play an important role in immunosurveillance of the epithelium. Innate immune activation of IELs by gluten,
25
Figure 5. Mechanisms of mucosal damage in celiac disease. (From The Lancet, 2009).
26
induces up-regulation on the intestinal epithelium, of MICA and HLA-E the ligands for NKG2D and CD94/NKG2C, respectively. Interaction of NKG2D and CD94/NKG2C with their ligands will enhance IFN-γ production and cytolysis, leading to tissue damage; IFN-γ and secreted mediators may cause activation of macrophages which, in turn, produce pro-inflammatory cytokines contributing to the damage of the mucosal matrix50-51. Particularly, NKG2D also links innate and adaptive immunity, because it both triggers antigen-specific lymphocyte-mediated cytotoxicity and induces a direct cytolytic function independent of TCR specificity in effector CD8+ T cells. Similarly, the NKG2C receptor stimulated IEL proliferation and cytokine secretion in patients with CD. IELs can also have an immunoregulatory capacity through the secretion of transforming growth factor TGF-β, a negative regulator of the immune response. Interleukin-15 (IL-15) has a central role at the interface between innate and adaptive immunity in CD in synergy with interleukin-21 (IL-21), a cytokine expressed on CD4+ T cells; IL-15 is synthesized both by epithelial and lamina propria mononuclear cells and can acts on multiple targets: in the epithelium, IL-15 has a direct action on IEL that promotes their survival and accumulation, stimulates their production of INF-γ and their cytotoxicity via innate immune NK receptor; IL-15 may also directly or indirectly promote the expression of epithelial ligands for these NK receptors. These combined effects of IL-15 result in an autoimmune attack of the epithelium and promote the emergence of lymphomas. Lymphomas infact, develop as a consequence of uncontrolled activation of IELs and provoke a severe enteropathy refractory to the GFD. Moreover, IL-15 can acts directly on DCs and stimulate their maturation and antigen presentation. This effect of IL-15 is thought to bolster the activation of gluten-specific CD4+ LPL. Finally, IL-15 can hamper local immunoregulation by blocking the Smad-3 pathway of TGF-β in both IEL and LPL. IL-15 can thus indirectly promote the release of Th1 cytokines and the cytotoxicity of intestinal lymphocytes52. In conclusion, while gluten-specific CD4+ T cells elicit an inflammatory response in the lamina propria, IELs in the epithelium acquire activating NK receptors and the ability to lyse stressed epithelial cells independent of T cell receptor signaling, which likely contributes to the typical tissue damage in CD49. As a result, the gluten-specific CD4+ T cell repertoire is substantially expanded, which enhances the inflammation and disease development12,49. Therapy in celiac disease The cornerstone treatment of CD remains a lifelong GFD and supportive nutritional care in case of iron, calcium and vitamin deficiencies53. A life-long GFD is a well tolerated therapy that improves health and quality life in the vast majority of patients with celiac disease, even in those with minimal symptoms. This treatment is, however, difficult to sustain, owing to small levels of gluten contamination in food products, high costs and restricted availability of gluten-free food alternatives, and cultural practices leading to a substantial social burden. Restriction of the GFD may cause anger, sadness and despair. In a general population-based cohort study, it was found that CD was associated with an increased risk of subsequent depression (hazard ratio=1.8)54. Allowing patients to occasionally consume small amounts of gluten would greatly improve their quality of life. Owing to recent advances in the understanding of the pathogenesis of CD, different targets have been identified and have motivated the development of several experimental therapeutic strategies. These therapies focus on alteration of dietary food products, decrease of gluten exposure by rapid enzymatic degradation, inhibition of small intestinal permeability or
27
modulation of the immune response55. Attractive therapeutical targets, but in progress, were: - The selection of grains with low or absent immunogenic sequences, but with reasonable baking properties (detoxification of wheat via genetic alteration to remove or scramble the toxic peptides of gluten). - The enzymatic degradation of gluten as an attractive alternative strategy for oral therapy in CD to abolish its immunogenic and toxigenic activities; for this scope, several enzymes, such as prolyl endopeptidase (a gliadin detoxifier), were studied following different approaches. - The gluten hydrolysis using probiotic bacteria to decrease gluten toxicity ex vivo56-58 and gluten intolerance in humans59; in the same way as probiotic preparation was capable to hydrolyze gliadin peptides responsible for CD60. - The inhibition of the permeability using molecules such as AT-1001 that is an inhibitor of paracellular permeability; its structure derived from a protein secreted by Vibrio cholerae; it was well tolerated and reduced intestinal permeability, proinflammatory cytokines production and gastrointestinal symptoms in celiacs following gluten exposure61. - Inhibition of tTG with molecules such as KCC009 that inhibits intestinal tTG when given orally; it’s well tolerated by rodents and it has short serum half-life. - The use of anti-inflammatory cytokines to suppress gluten-dependent T-cell activation, antibodies neutralizing INF-γ and humanized anti-IL-1556. - The improvement of peptide vaccines using α- and ω-gliadin 17-mer peptides62. - The improvement of integrin-α4 antagonist and humanized anti integrin-α4β7 as potential candidates for CD inflammatory modulation56. Therefore, early prevention of CD may represent a cost-effective strategy, as the disease is highly prevalent. As pharmacological treatments of CD are not yet available, preventive measures (i.e. breast-feeding at the time of gluten introduction and dietary gluten introduction at 4-7 months) are regarded as potential options to reduce the incidence of the disease.

28
MICRORNAs MicroRNAs (miRNAs) belong to RNA-mediated silencing pathways that, with DNA methylation and modification of core histones, constitute epigenetic machinery. Epigenetic mechanisms regulate gene expression and operate at the transcriptional and post-transcriptional level of gene activity as well as at the level of protein translation and post-translational modifications, in order to determine the phenotype without changes in genotype. MicroRNAs are endogenous, non-transcribed but functional RNAs of approximately 22 nucleotides, occurring in both plants and animals; the first small RNA, lin-4, was discovered in 1993 by genetic screens in nematode worms63. MiRNAs are expressed in a tissue-specific manner and function as endogenous silencers of numerous target genes; infact, a rapidly growing number of publications demonstrate the great importance of these molecules by repressing translation or inducing cleavage of mRNA, with implications in cell differentiation, metabolism and diseases such as cancer. In mammals, miRNAs comprise 2-3% of genes, with ~700 different sequences so far identified in humans (miRBase 14.0 at www.mirbase.org/); they are predicted to control the activity of more than 60% of all protein-coding genes and participate in the regulation of almost every cellular process investigated to date64. MiRNAs are processed from precursor molecules (pri-miRNAs), which are either transcribed by RNA polymerase II from independent genes or represent introns of protein-coding genes. The pri-miRNAs fold into hairpins, which act as substrates for two members of the RNase III family of enzymes, Drosha and Dicer. The product of Drosha cleavage, an ~70-nucleotide pre-miRNA, is exported to the cytoplasm where Dicer processes it to an ~20-bp miRNA/miRNA duplex. One strand of this duplex, representing a mature miRNA, is then incorporated into the miRNA-induced silencing complex (miRISC or microRNP) (Figure 6). In this complex, the mature miRNA is able to regulate gene expression, binding through partial complementary generally, for the most part to the 3’-untranslated region (3’-UTR) of target mRNAs, and leading at the same time to some degree of mRNA degradation and translation inhibition65. The most stringent requirement for this interaction is a contiguous and perfect Watson-Crick base-pairing of the miRNA 5’nucleotides 2-8, representing the “seed region” nucleating the interaction. In addition an A residue across position 1 of the miRNA and A or U across position 9 improve miRNA activity, although they do not need to base-pair with mRNA nucleotides. Usually, miRNA-mRNA duplexes contain mismatches and bulges in the central region (miRNA positions 10-12) that prevent endonucleolytic cleavage of mRNA by an RNAi mechanism. AU-rich sequence context and structural accessibility of the sites may improve their efficacy66. MiRISC functions as a highly modifiable scaffold that associates with specific mRNAs via the bound miRNA and facilitates the localized activity of a variety of accessory proteins67. MiRISC contains several proteins such as Dicer, TRBP, PACT, GW182 and Gemin3, but the components directly associated with miRNAs are Argonaute proteins68. Argonaute proteins (AGO) contain four domains: the N-terminal, PAZ, middle, and Piwi domains69; the PAZ domain is implicated in the binding of single-stranded RNA while the PIWI domain confers the endonucleolytic activity of Argonaute proteins and requires coordination of divalent cations by Aspartate-Aspartate-Histidine (DDH) motif for catalysis. In animals, some Argonaute proteins can cleave RNA molecules while others have lost their catalytic activity and participate in a gene regulatory mechanism that does not require RNA cleavage.
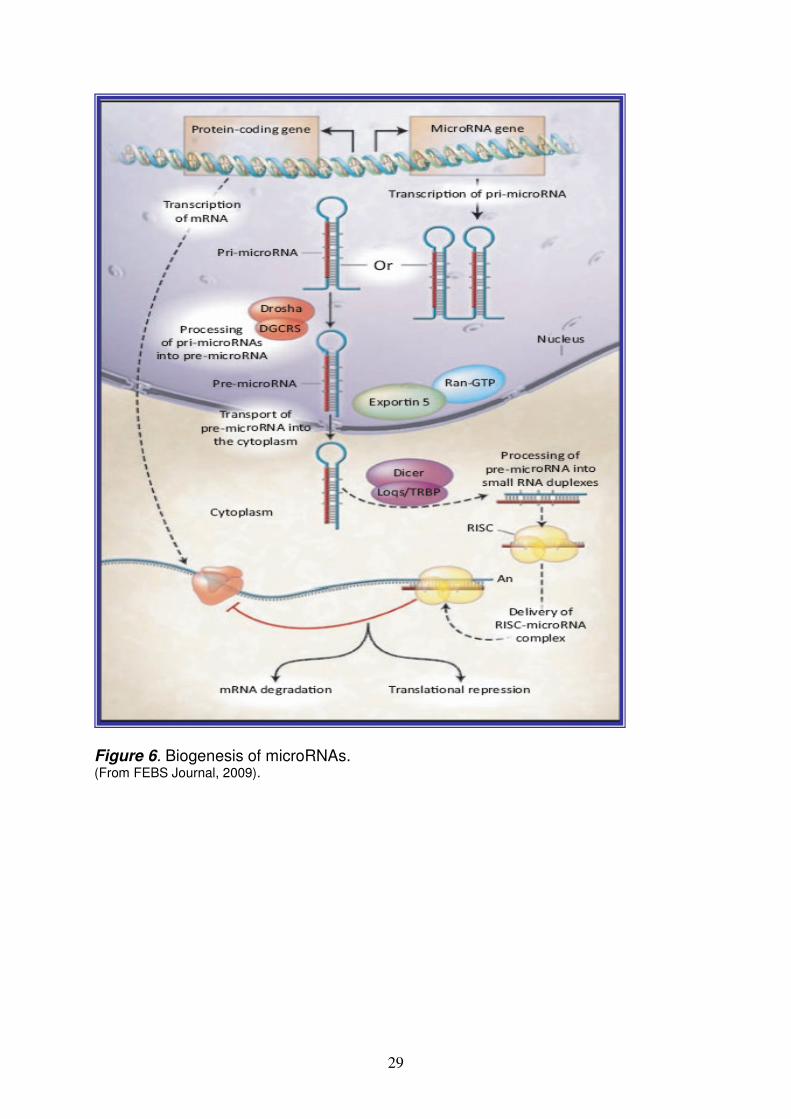
29
Figure 6. Biogenesis of microRNAs. (From FEBS Journal, 2009).
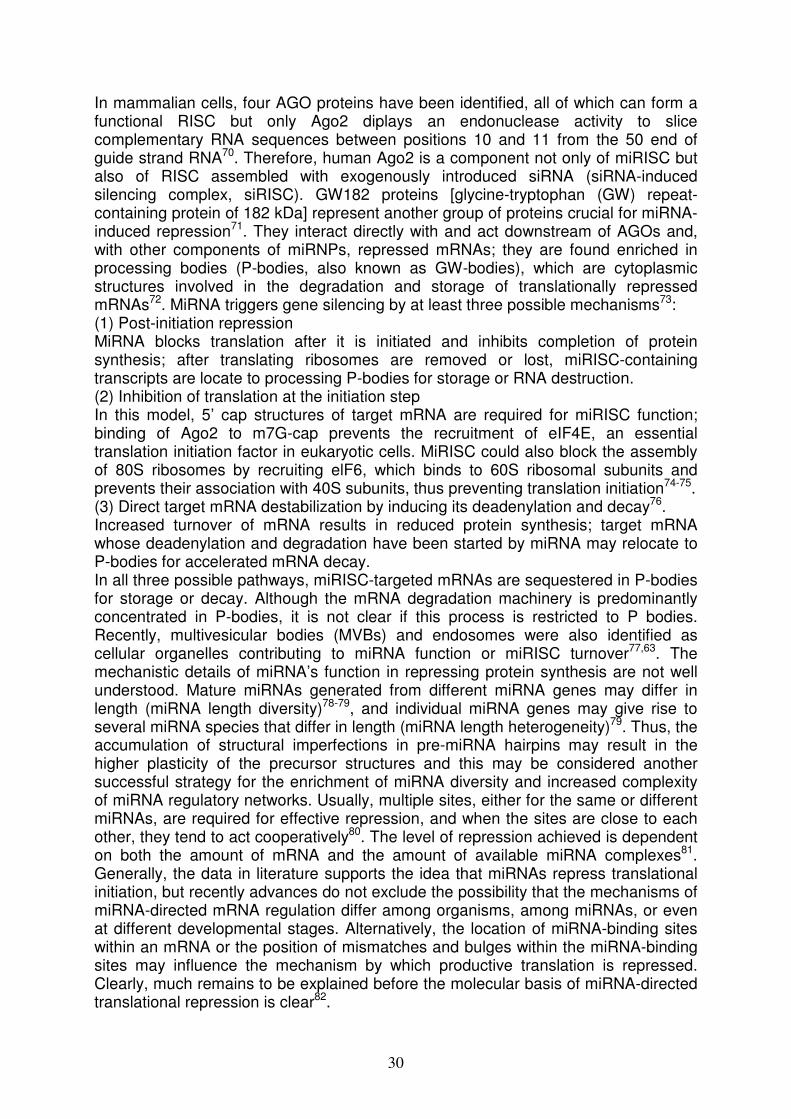
30
In mammalian cells, four AGO proteins have been identified, all of which can form a functional RISC but only Ago2 diplays an endonuclease activity to slice complementary RNA sequences between positions 10 and 11 from the 50 end of guide strand RNA70. Therefore, human Ago2 is a component not only of miRISC but also of RISC assembled with exogenously introduced siRNA (siRNA-induced silencing complex, siRISC). GW182 proteins [glycine-tryptophan (GW) repeat-containing protein of 182 kDa] represent another group of proteins crucial for miRNA-induced repression71. They interact directly with and act downstream of AGOs and, with other components of miRNPs, repressed mRNAs; they are found enriched in processing bodies (P-bodies, also known as GW-bodies), which are cytoplasmic structures involved in the degradation and storage of translationally repressed mRNAs72. MiRNA triggers gene silencing by at least three possible mechanisms73: (1) Post-initiation repression MiRNA blocks translation after it is initiated and inhibits completion of protein synthesis; after translating ribosomes are removed or lost, miRISC-containing transcripts are locate to processing P-bodies for storage or RNA destruction. (2) Inhibition of translation at the initiation step In this model, 5’ cap structures of target mRNA are required for miRISC function; binding of Ago2 to m7G-cap prevents the recruitment of eIF4E, an essential translation initiation factor in eukaryotic cells. MiRISC could also block the assembly of 80S ribosomes by recruiting elF6, which binds to 60S ribosomal subunits and prevents their association with 40S subunits, thus preventing translation initiation74-75. (3) Direct target mRNA destabilization by inducing its deadenylation and decay76. Increased turnover of mRNA results in reduced protein synthesis; target mRNA whose deadenylation and degradation have been started by miRNA may relocate to P-bodies for accelerated mRNA decay. In all three possible pathways, miRISC-targeted mRNAs are sequestered in P-bodies for storage or decay. Although the mRNA degradation machinery is predominantly concentrated in P-bodies, it is not clear if this process is restricted to P bodies. Recently, multivesicular bodies (MVBs) and endosomes were also identified as cellular organelles contributing to miRNA function or miRISC turnover77,63. The mechanistic details of miRNA’s function in repressing protein synthesis are not well understood. Mature miRNAs generated from different miRNA genes may differ in length (miRNA length diversity)78-79, and individual miRNA genes may give rise to several miRNA species that differ in length (miRNA length heterogeneity)79. Thus, the accumulation of structural imperfections in pre-miRNA hairpins may result in the higher plasticity of the precursor structures and this may be considered another successful strategy for the enrichment of miRNA diversity and increased complexity of miRNA regulatory networks. Usually, multiple sites, either for the same or different miRNAs, are required for effective repression, and when the sites are close to each other, they tend to act cooperatively80. The level of repression achieved is dependent on both the amount of mRNA and the amount of available miRNA complexes81. Generally, the data in literature supports the idea that miRNAs repress translational initiation, but recently advances do not exclude the possibility that the mechanisms of miRNA-directed mRNA regulation differ among organisms, among miRNAs, or even at different developmental stages. Alternatively, the location of miRNA-binding sites within an mRNA or the position of mismatches and bulges within the miRNA-binding sites may influence the mechanism by which productive translation is repressed. Clearly, much remains to be explained before the molecular basis of miRNA-directed translational repression is clear82.

31
During the last years, several groups have reported that miRNAs can activate rather than repress their targets under certain conditions71,83-84. Infact, for example, Vasudevan and collegues propose that miRNAs oscillate between repression and activation in coordination with the cell cycle: in proliferating cells they repress translation, whereas in G1/G0 arrest (which often precedes differentiation), they mediate activation. This regulation occurs on at least two levels: first, recruitment of the microRNP reflects both its expression level and its ability to productively interact with mRNA target sites; second, the AGO2 complex must be subject to modification because tethered AGO2 differentially regulates translation according to cell growth conditions83. MiRNAs expression can be regulated by several mechanisms such as inherited mutations and polymorphisms in the primary trascripts of miRNAs and/or defects in their biogenesis machinery; also epigenetic mechanisms, such as promoter methylation or histone acetylation, can modulate their expression. Role of miRNAs in the intestine As a consequence of their ability to regulate gene expression, miRNAs are involved in the most crucial cellular processes, spanning from development, differentiation, cell cycle regulation to senescence and metabolism. As with other complex gene regulatory networks, aberrant expression or processing of miRNAs could have profound effects on cellular function and contribute to diseases. Whereas the importance of miRNAs for the development of several tissues is well established, their role in the intestine and particularly both in human and in celiac gut, is unknown. Recently, McKenna has quantified the complete miRNAs expression profile of the mouse intestinal mucosa to determine the contribution of these molecules to gut homeostasis85. Particularly, in Dicer1-deficient mice (mice lacking of functional miRNAs), intestinal barrier function is impaired, resulting both in intestinal inflammation with lymphocyte and neutrophil infiltration, and in disorganization of epithelium with a decrease of goblet cell. Another miRNAs expression profile was performed in the active ulcerative colitis in mice; particularly, among 11 miRNAs differently expressed, miR-192 was downregulated and regulated colonic epithelial cell-derived chemokine expression86. Chassin and collegues demonstrate that miR-146a regulates the responsiveness of intestinal epithelial cells during microbial colonization of the neonatal intestine of mice: the upregulation of miR-146a in the developing gut is essential to protect the neonatal intestine from mucosal damage after introduction of bacteria87. Patients with irritable bowel syndrome (IBS) have increased intestinal permeability (such as in celiac disease) that is associated with upregulation of miR-29a in blood microvesicles, small bowel and colon tissue88. The most studies about miRNAs dysregulation in human, were performed in intestinal cancer tissues, such as colorectal tumor samples (in which it was observed the down-regulation of miR-143 and miR-145) and gastrointestinal cancers samples (in which it was observed the up-regulation of miR-21)89. MicroRNA-449a Human miRNA 449 family (a, b and c) is encoded on chromosome 5q11.2. The mature miR-449a (accession number miRBase: MIMAT0001648) sequence is evolutionarily conserved across a variety of species (monkey, horse, rodents and dogs) and therefore it probably exerts an important function90. It structurally resembles the p53-inducible miRNA 34 family mediating cell cycle arrest and tumor suppression. Infact, the majority of studies about miR-449 was performed in cancer tissue and revealed a proapoptotic role for it; for example it has demonstrate that

32
miR-449 is upregulated in multiple myeloma with t(14;16)91 and it’s one of the highest downregulated microRNAs in primary pigmented nodular adrenocortical disease (PPNAD)92. In agreement with a putative tumor-suppressive role, miR-449a as well as miR-34a reduced proliferation and strongly promoted apoptosis by at least partially p53-independent mechanisms93. Infact, miR-449 (both a and b) is a E2F1-inducible target and negatively regulates E2F activity through a feedback loop mechanism. E2F1 is a potent inducer of apoptosis essential for cell proliferation and its uncontrolled activity is one of the most widely acknowledged reasons for malignant growth. MiR-449 contributes to the due control in two ways, by antagonizing E2F1 and also by eliminating the cell when necessary. As both mechanisms can occur independently of p53, miR-449 may represent an essential barrier to cancer progression in cells that have already lost p53 function through mutations. Infact, functional analysis indicates that this inhibitory effect was found to be conveyed by directly targeting CDK6 and CDC25A, two oncoproteins that positively regulate retinoblastoma protein (pRb) phosphorylation; reduced level of CDK6 and CDC25A leads to dephosphorylation and consequently inhibition of E2F1 activity and cell cycle progression. This negative feedback effect of miR-449 on E2F1 is distinguishable from other miRNA targets of E2F1 that feedback E2F1 by directly decreasing E2F1 expression. Interestingly, the genomic region encoding both miR-449a and miR-449b is embedded into an intronic sequence of the mRNA-encoding gene CDC20B, a paralog of CDC20. Mir-449 thus seems to be regulated through the activation of its host gene. Infact, although little is known about the function of this gene, its paralog CDC20 is an essential component of the cellular machinery that enables the anaphase-promoting complex to destruct its targets in a timely manner, allowing progression through mitosis. It is to be noted that several mitosis-promoting genes, for example, Polo-like kinase and others, have previously been identified as E2F1 targets, implying E2F1 in mitotic progression. It is tempting to speculate that E2F1 may further promote mitosis through CDC20B, whereas uncontrolled E2F1 activity is avoided by building a negative feedback into the same gene. In addition, miR-449 gene locus was characterized with bivalent histone methylations, H3K4me3 and H3K27me3, a chromatin marker associated with gene repression. So, epigenetic control of this miRNA in cancer cells could make it more applicable as therapeutic targets, because miRNA can be delivered to tumor tissue on site to suppress cancer cell growth due to its pleiotropic nature. Thus, restoration of miR-449 expression through epigenetic drug treatment may result in inhibition of multiple oncogenic signaling in cancer cells94-95. Recently, for its proapoptotic function as well as its ability to block cell cycle progression, Lizè and collegues propose miR-449a as a sensitive and specific biomarker for the differentiation of bronchial epithelia; infact, miR-449a may actively promote also mucociliary differentiation and it may contribute to a first line of defence against genotoxic stress96.
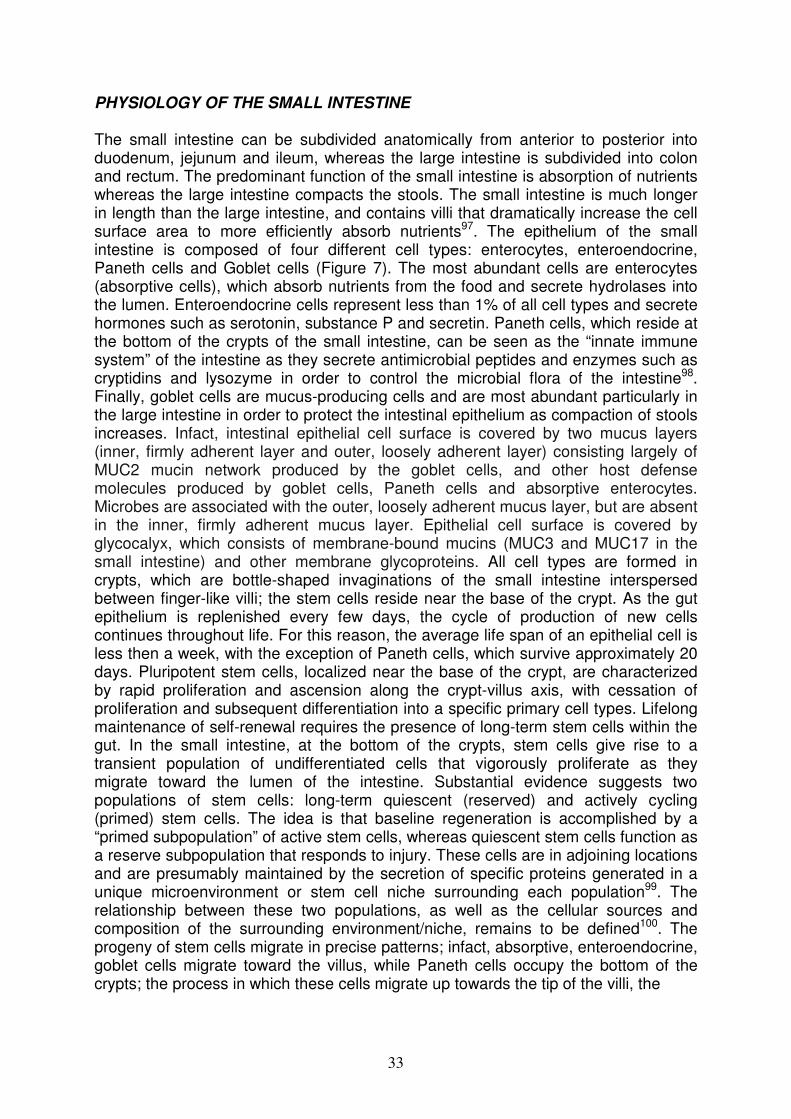
33
PHYSIOLOGY OF THE SMALL INTESTINE The small intestine can be subdivided anatomically from anterior to posterior into duodenum, jejunum and ileum, whereas the large intestine is subdivided into colon and rectum. The predominant function of the small intestine is absorption of nutrients whereas the large intestine compacts the stools. The small intestine is much longer in length than the large intestine, and contains villi that dramatically increase the cell surface area to more efficiently absorb nutrients97. The epithelium of the small intestine is composed of four different cell types: enterocytes, enteroendocrine, Paneth cells and Goblet cells (Figure 7). The most abundant cells are enterocytes (absorptive cells), which absorb nutrients from the food and secrete hydrolases into the lumen. Enteroendocrine cells represent less than 1% of all cell types and secrete hormones such as serotonin, substance P and secretin. Paneth cells, which reside at the bottom of the crypts of the small intestine, can be seen as the “innate immune system” of the intestine as they secrete antimicrobial peptides and enzymes such as cryptidins and lysozyme in order to control the microbial flora of the intestine98. Finally, goblet cells are mucus-producing cells and are most abundant particularly in the large intestine in order to protect the intestinal epithelium as compaction of stools increases. Infact, intestinal epithelial cell surface is covered by two mucus layers (inner, firmly adherent layer and outer, loosely adherent layer) consisting largely of MUC2 mucin network produced by the goblet cells, and other host defense molecules produced by goblet cells, Paneth cells and absorptive enterocytes. Microbes are associated with the outer, loosely adherent mucus layer, but are absent in the inner, firmly adherent mucus layer. Epithelial cell surface is covered by glycocalyx, which consists of membrane-bound mucins (MUC3 and MUC17 in the small intestine) and other membrane glycoproteins. All cell types are formed in crypts, which are bottle-shaped invaginations of the small intestine interspersed between finger-like villi; the stem cells reside near the base of the crypt. As the gut epithelium is replenished every few days, the cycle of production of new cells continues throughout life. For this reason, the average life span of an epithelial cell is less then a week, with the exception of Paneth cells, which survive approximately 20 days. Pluripotent stem cells, localized near the base of the crypt, are characterized by rapid proliferation and ascension along the crypt-villus axis, with cessation of proliferation and subsequent differentiation into a specific primary cell types. Lifelong maintenance of self-renewal requires the presence of long-term stem cells within the gut. In the small intestine, at the bottom of the crypts, stem cells give rise to a transient population of undifferentiated cells that vigorously proliferate as they migrate toward the lumen of the intestine. Substantial evidence suggests two populations of stem cells: long-term quiescent (reserved) and actively cycling (primed) stem cells. The idea is that baseline regeneration is accomplished by a “primed subpopulation” of active stem cells, whereas quiescent stem cells function as a reserve subpopulation that responds to injury. These cells are in adjoining locations and are presumably maintained by the secretion of specific proteins generated in a unique microenvironment or stem cell niche surrounding each population99. The relationship between these two populations, as well as the cellular sources and composition of the surrounding environment/niche, remains to be defined100. The progeny of stem cells migrate in precise patterns; infact, absorptive, enteroendocrine, goblet cells migrate toward the villus, while Paneth cells occupy the bottom of the crypts; the process in which these cells migrate up towards the tip of the villi, the
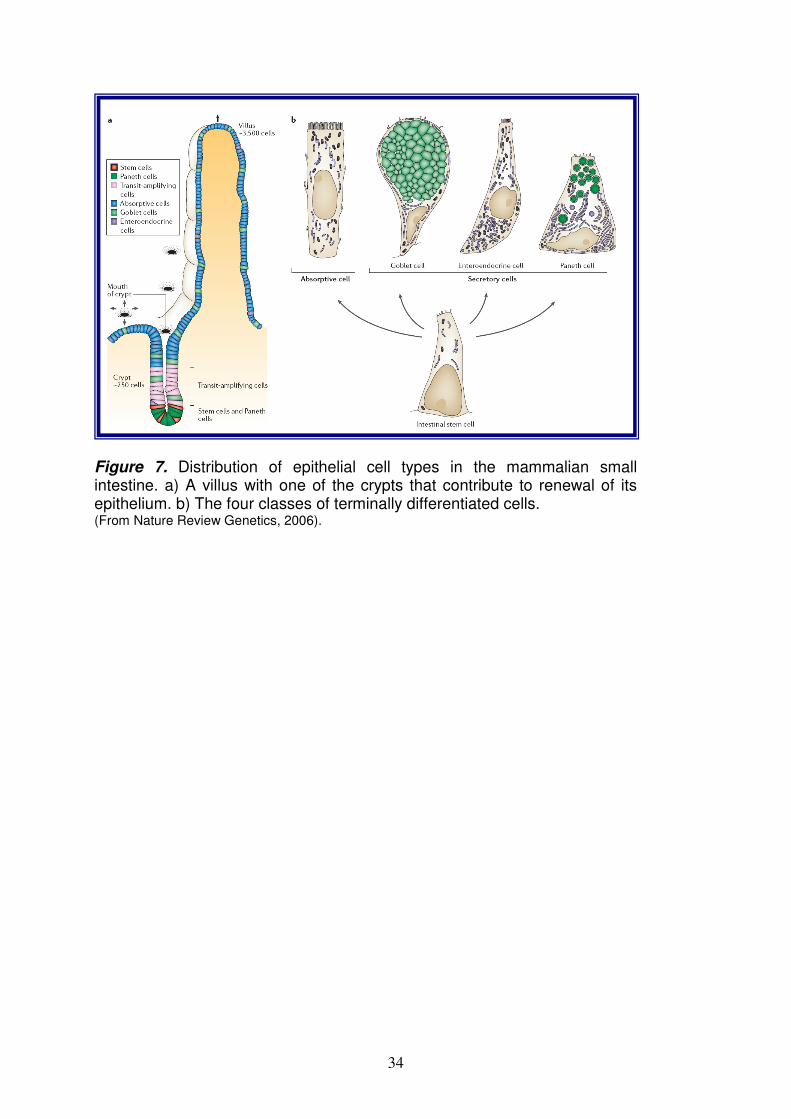
34
Figure 7. Distribution of epithelial cell types in the mammalian small intestine. a) A villus with one of the crypts that contribute to renewal of its epithelium. b) The four classes of terminally differentiated cells. (From Nature Review Genetics, 2006).

35
consequent apoptosis and the leakege into the lumen of the intestine is called “exfoliation”. In the adult small intestine, it is generally known that the microenvironment around the stem cells, called the “niche”, plays important roles in the epithelial cell renewal101. Structurally, the stem cell niche mainly consists of subepithelial myofibroblasts, which secrete various factors including extracellular matrix components, growth factors, cytokines, Wnt and epimorphin. Recent studies identified a number of signaling molecules whose localization is associated with the crypt-villus axis; although their functions have not yet been clarified enough, a growing body of evidence has shown that the Wnt and Notch signaling pathways play important roles in the epithelial cell renewal. In addition, it has long been known that the modelling of the intestinal epithelium depends on epithelial-mesenchymal interactions, and recent data have identified the hedgehog, platelet-derived growth factor (PDGF) and BMP signalling pathways as key mediators of these two-way communications; infact, mutations in these pathways derange the construction of crypts and villi. Moreover, within the epithelium, cells signal to one another through the Wnt, Notch and Eph/ephrin pathways: mutations that affect these pathways cause marked changes in the distribution of cell types along the crypt-villus axis. The challenge is to understand not just the action of each type of signal individually, but how the whole set of signals operates as a system to organize the crypt-villus architecture and to control the patterning and renewal of the gut epithelium102. Signaling pathways regulating intestinal homeostasis
- Wnt pathway The Wnt pathway is certainly one of the best studied signallings in the intestine due to its relevance to gut biology and cancer. Infact, in the intestine, the canonical Wnt signaling cascade plays a crucial role in driving the proliferation of epithelial cells. Wnts are secreted glycoproteins that mediate cell-to-cell communication during development. They bind to the family of Frizzled receptors that are 7 transmembrane molecules in a complex with the Low-density lipoprotein receptor related proteins (LRP-5 and -6)103-104. Activation of these receptor complexes results in stabilization and accumulation of a protein called β-catenin. In the absence of Wnt signaling, β-catenin is retained in the cytoplasm in a multi-protein complex comprising the tumor suppressor APC (Adenomatous Polyposis Coli), the scaffold protein Axin, CK-1 (Caseine Kinase-1) and GSK-3b (Glycogen Synthase Kinase-3b). In this complex β-catenin is sequentially phosphorylated by CK-1 and GSK3-b and thereby tagged for ubiquitination and proteosomal degradation. Upon activation of the Wnt pathway, GSK3-b is inhibited by Dishevelled (Dsh) and β-catenin can no longer be phosphorylated at its N-terminus. Unphosphorylated β-catenin is more stable so it accumulates in the cytoplasm and translocates to the nucleus where it binds transcription factors of the TCF/LEF family thereby activating transcription of downstream target genes. A large body of evidence shows that activation of the canonical Wnt pathway is essential to maintain the crypt cell population in a proliferative state in the intestine105; infact, the nuclear accumulation of β-catenin is preferentially observed in cells located at the base of crypts and decreases as cells move toward the top of the crypts106. This clearly indicates that the transit-amplifying progenitors are under the influence of the Wnt signal, whereas terminally differentiated cells, other than Paneth cells, are in areas where the canonical Wnt signal is inactive.

36
Consistently, it has been shown that aberrant activation of Wnt signaling, by mutations in APC or β-catenin, is strongly associated with the development of colorectal cancer because many of the epithelial cells enter into the proliferative state and display a failure of the differentiation programs107. Conversely, blockage of canonical Wnt signals in the intestine, either through deletion of Transcription Factor 4 (TCF4) or overexpression of the Wnt antagonist Dickkopf (Dkk)-1, results in arrested epithelial cell proliferation107-110; infact, TCF4 knockout mice die soon after birth; at the time when the gut epithelium is normally in a highly proliferative phase, these mice lacked any proliferative epithelial compartments, and the neonatal epithelium was composed exclusively of differentiated, nondividing villous-type cells. TCF4 thus appears to have a critical role in maintining intestinal crypt stem cells and its mutation has dramatic consequences for intestinal morphogenesis. All these data suggest that the Wnt signalling pathway is required for the maintenance of the crypt progenitor phenotype111; briefly, when the pathway is overactivated, crypts enlarge and when the pathway is blocked, they disappear. In addition, Wnt signaling is necessary for positioning Paneth cells near the base of the crypts, and for separating proliferating and differentiated cells; infact, the Wnt controls expression of the Ephrin sorting receptors and ligands (EphB/ephrinB) that are TCF4 target genes. These receptors allow the correct positioning of epithelial cells in a Wnt gradient along the crypt-villus axis as well as the positioning of postmitotic Paneth cells at the bottom of the crypt112-113. More recent evidence has shown that Wnt may also stimulate cellular responses independently of β-catenin and TCF. Examples of these so-called “non canonical pathways” involve either the intracellular release of calcium ions and activation of Ca2+-dependent kinases or morphogenic changes dependent on RhoA and Jun kinase stimulation, also termed the “planar cell polarity pathway”114. Finally, β-catenin has an additional role as a component of adherens junctions as it binds to the cytoplasmic tail of cadherin proteins thereby linking them to the cytoskeleton of epithelial cells. The mechanisms controlling whether β-catenin joins the signaling pool or is part of adherens junctions is currently unknown.
- Notch pathway The Notch pathway plays a central role in intestinal homeostasis because it is involved in the specification of cell fate in a wide variety of cell types and is perhaps instructive for the generation of all cells in invertebrates and vertebrates; infact, it is highly conserved in evolution and is found in organisms as diverse as worms and humans97. Depending on the context, Notch signaling may result in diametrically different outcomes, from inhibition or promotion of differentiation to proliferation or apoptosis. For this reason, it can interact with a variety of the important signaling networks. Key pathways where interactions with Notch have emerged are the fibroblast growth factor (FGF) pathway, the transforming growth factor-β (TGFβ) and bone morphogenetic protein (BMP) pathway, the nuclear factor kB (NF-κB), Wnt, Ras, and signal transducer and activation of transcription (STAT) signaling pathway. All these pathways are involved at some stage in gut function and, with the widespread expression of Notch in the gut, potentially herald its extensive involvement in diverse cellular processes. The Notch genes encode single pass transmembrane receptors that interact with transmembrane ligands on adjacent cells. The mammalian genome encodes four receptors (Notch 1-4) and five ligands (Delta-like-1, -3, -4 and Jagged-1 and -2). Ligand engagement initiates a process called “regulated intramembrane proteolysis” (RIP), in which the Notch receptor is first cleaved at a juxtamembrane extracellular site by a mettalloprotease of the ADAM (a
37
disintegrin and metalloprotease) family. This cleavage renders the truncated receptor sensitive to subsequent intramembrane cleavage(s) by the γ-secretase multiprotein enzyme complex. Processing by γ-secretase releases the Notch intracellular domain (NICD) from the membrane, allowing it to translocate into the nucleus where it assembles into a trascriptional activation complex that permits the expression of Notch-responsive genes such as Hes. Components of this complex are DNA-binding trascription factor CSL (C-promoter-binding factor, also known as RBP-J) and co-activator such as protein of the Mastermind (MAM) family (Figure 8). NICD comprises several functional regions, including an N-terminal RBP-Jk (recombination binding protein-jk-associated molecule) domain, a unique negative regulatory region (NRR), an ANK (ankyrin repeat) domain and less-conserved regions including a variable transactivation domain and a C-terminal PEST (Pro-Glu-Ser-Thr) sequence; the ANK domain is essential for the folding and for the function of NICD and it can render CSL competent for MAML loading; the RAM region is necessary to recruite NICD and the PEST domain is involved in NICD turnover. The extracellular domain (ECD) of Notch, contains between 29 and 36 tandem repeats of EGF domains (epidermal growth factor-like domains), that can be modified by three different types of O-linked glycosylation: O-fucosylation, O-glucosylation, and O-GlcNAc’ylation115-116. The best characterized modification is the O-fucosylation, that is catalyzed by an O-fucosyltransferase (Pofut1 in mammals and Ofut1 in Drosophila) that uses GDP-fucose as a substrate. There are two models proposed to elucided the role of Ofut1: the first model proposes that Ofut1 acts in the endoplasmic reticulum, where it performs two separable functions: to O-fucosylate Notch, thereby modulating Notch-ligand interaction, and to promote the correct folding of the extracellular domain of Notch (a non-catalytic function). The second model proposes that Ofut1 is required for secretion of Notch117. The O-fucose residue added by Pofut1 can be further elongated by the addition of an N-acetylglucosamine by Fringe, an EGF-O-fucose β1.3 N acetylglucosamyltransferase. The Notch signaling requires regulation by Fringe glycosyltransferases that determine which ligands can bind to activate the receptor. Infact, Fringe potentiates the activation of Notch by Delta and inhibits activation by Serrate in a cell-autonomous manner118. This ligand specificity switch is employed in stage- and tissue-specific regulation of Notch signaling to establish tissue boundaries during animal development119. Particularly, in mammals, elucidation of the effects of Fringe on Notch activity is complicated by the presence of multiple receptors, ligands, and Fringe proteins (Lfng, Lunatic fringe; Mfng, Manic fringe and Rfng, Radical fringe). Notch signaling can be regulated by endocytosis; NICD becomes monoubiquitylated (Ub), targeting the receptor to the lysosome for degradation. The first evidence that Notch signaling plays a role in cell-type specification in the intestine was reported in Hes1 knockout mice120. The deletion of the Hes1 gene resulted in the generation of excessive numbers of goblet cells, enteroendocrine cells, and Paneth cells, all of which possess a secretory character121. Subsequently, it was shown that the gene encoding another bHLH factor, Math1 (mouse atonal homolog1), one of the genes repressed by Hes1, is required for the differentiation into the three secretory lineages, because the intestinal epithelium of Math1-mutant mice is populated only by absorptive cells121. These data suggest that the choice between the absorptive or secretory fate might be the first decision made by each progenitor cell, and that Hes1 and Math1 play opposite roles in this decision making105,121-122. While the specification of precursors into enterocyte fate is determined by Hes1, the differentiation of secretory precursors into goblet or endocrine fate is regulated by Math1; it has been shown that the choice
38
Figure 8. The canonical Notch signalling pathway. (From Nature Review Immunology, 2009).
39
of lineage commitment among the Math1-specified secretory cell types123 is controlled by several other transcriptional regulators124 such as NeuroD3 (neurogenin3 for enteroendocrine cell differentiation)125, KLF-4 (Kruppel-like factor-4 for goblet cell differentiation)126 or Gfi 1 (for goblet/Paneth cells differentiation)127. These studies are of considerable importance for understanding the stepwise regulation of the differentiation into each lineage of epithelial cells and for clarifying the molecular hierarchy during this process105. Another direct genetic evidence showing an essential role of Notch signaling in the intestinal homeostasis, is derived from inducible tissue specific inactivation of CSL/RBP-J. Loss of CSL/RBP-J within the crypt compartment leads to a complete loss of proliferating transient amplifying cells followed by their conversion into postmitotic goblet cells111. Conversely, expression of NICD in the gut inhibits differentiation of crypt progenitor cells resulting in an intestine that largely consists of undifferentiated transient amplifying cells128. These complementary loss- and gain-of-function studies suggest that Notch signaling is a gatekeeper of the progenitor/stem cell compartment of the gut97. In addition, blocking of all Notch/ligand interaction by targeted inactivation of the Pofut1 gene in mouse small intestinal and colonic epithelia enhanced the commitment of crypt progenitor cells toward secretory cell lineages, and leads to hypersecretion of mucus, modification of the gut microbiota and development of intestinal inflammation122. Additional evidence is derived from toxicology studies of γ-secretase inhibitors. These small molecules are currently being developed by pharmaceutical companies to inhibit the protease (γ-secretase) activity of presenilins for the treatment of Alzheimer’s disease. The primary target of these drugs is the disease causing amyloid precursor protein (APP). The treatment with γ-secretase inhibitors in mouse models for Alzheimer’s disease displays unwanted side effects such as a large increase in mucus secreting goblet cells129 and in Han Wistar rats, goblet cell metaplasia130 both due to inhibition of Notch signaling. Taken together these results suggest that Notch signaling is essential for maintenance of undifferentiated crypt progenitors. In this respect the Notch and Wnt signaling pathways appear to work hand in hand. Loss of either signaling cascade results in loss of the crypt compartment (Figure 9). In addition to the classic functions of Notch in regulating development and cell fate selection, new insights into an ongoing role of Notch in lymphocyte function are emerging that are relevant to the gut. These studies reveal that Notch signaling can regulate T-cell receptor-mediated T-cell proliferation and apoptosis, development of Th1/Th2 immune responses, and the decision between immunity and tolerance.
- TGF-/BMP pathway The TGF-β superfamily consists of a number of secreted cytokines including different TGF-β isoforms (TGFβ 1, TGFβ 2, and TGFβ 3), BMPs and activins. These proteins are known to regulate a broad spectrum of different processes such as embryonic development, differentiation, proliferation, adhesion, wound healing

40
Figure 9. Cell fate specification within the intestine and involvement of Wnt and Notch signalling pathways. (From Current Molecular Medicine, 2006) .

41
and inflammation131-132. The activated TGF-β mediates its effects on cells through heteromeric complexes of TGF-β type I and II (TβRI and TβRII) receptors to activate intracellular signaling pathways, including Smad signaling. The resulting Smad complex then moves into the nucleus, where it interacts in a cell specific manner with various transcription factors to regulate the transcription of many genes133. Deregulation of the TGF-β signaling can occur at multiple levels of the pathway, and the cancer-related alterations frequently appear to promote progression of tumors. In normal cells, TGF-β induces differentiation or promotes apoptosis because it arrests the cell cycle at the G1 stage to inhibit proliferation, acting as a tumor suppressor. The immunosuppressive cytokine TGF-β is abundantly expressed in the gut and plays an important role in maintaining immune homeostasis. TGF-β is produced by both stroma and T cells in the gut; in contrast to signaling components of Wnt and Notch pathways, which are localized to the undifferentiated crypt, TGF-β receptor and ligands, are expressed in the differentiated compartment of the gut. In addition to its immunosuppressive properties, TGF-β is also a critical factor for IgA class switching that helps generating the IgA-predominated immunoglobulin milieu characteristic to the intestine. In the intestine, the BMP pathway is seen most strongly in the epithelium of the villi, whereas noggin, the BMP antagonist, is expressed in the neighbourhood of the crypts. When the receptor is knocked out, or the antagonist noggin is overexpressed, excessive quantities of cryptlike structures develop: in the noggin overexpression mutant, these occur on the sides of the villi134; in the mouse Bmpr1a knockout, there is also a marked increase in the number of crypts in the region within which crypts normally lie135. Similar abnormalities are seen in humans with juvenile polyposis syndrome, which can be traced to mutations in BMPR1A or SMAD4 (a key downstream effector of BMP signalling). All this evidence strongly suggests that BMP signalling is a key factor that blocks the formation of ectopic crypts, mediating the action of hedgehog, and that the expression of noggin in the neighbourhood of each crypt base protects the epithelium in this region from the action of BMPs, thereby enabling proliferation to continue136.
- Hedgehog pathway The Hedgehog (Hh) signalling pathway was originally described in the development of Drosophila melanogaster as a segment polarity gene required for embryonic patterning. There are 3 vertebrate homologues of Hh: Sonic hedgehog (Shh), Indian hedgehog (Ihh) and Desert hedgehog (Dhh). The Hedgehog signal is transmitted by a seven-span transmembrane receptor Smoothened (Smo). Interestingly, Hedgehogs do not bind to Smo but control the activity of Smo indirectly by binding to a second receptor, Patched (Ptc) that acts in a negative-feedback loop to restrict the range of Hedgehog signaling in a tissue137. This pathway is responsible for several relatively common congenital malformations such as tracheoesophageal fistula and anorectal malformations. The Hh signaling pathway has an established role in growth and patterning during embryonic development of the gastrointestinal tract, when both Sonic hedgehog and Indian hedgehog are expressed by the endoderm throughout the gut tube138. Infact, in the small intestine, both Shh and Ihh are produced only in those sites at which proliferation persists: the intervillus pockets and subsequently the bases of the crypts. The suggestion, therefore, is that hedgehog proteins diffuse outwards from these sites and exert their effect at a distance, promoting villous formation and inhibiting crypt-like behaviour in the neighbourhood of each established crypt. In the colon Hh signalling is strongly implicated in directing enterocyte differentiation139. Infact, constitutive activation of Hh signaling resulted in
42
accumulation of myofibroblasts and colonic crypt hypoplasia. A reduction in the number of epithelial precursor cells was observed with premature development into the enterocyte lineage and inhibition of Wnt signaling. Activation of Hh signaling resulted in induction of an increased BMP signaling in the epithelium138. Conversively, blocking of the hedgehog signal by strong overexpression of an inhibitor, hedgehog-interacting protein (HHIP), leads to a complete absence of villi and the persistence of a highly proliferative, and sometimes pseudostratified, intestinal epithelium, with increased activation of the Wnt pathway and a deficit of properly differentiated cells140. The general conclusion is that hedgehog signalling from epithelium to mesenchyme is required for the formation of villi and the concomitant restriction of proliferation to the intervillus regions within the intestinal epithelium. This process must depend on a feedback loop in which mesenchymal cells respond directly to hedgehog from the epithelium, and deliver a signal back to the epithelium by some other signalling pathway136.
43
AIMS OF THIS PROJECT
Epigenetics is becoming important in several fields, also in the field of nutritional genomics, which try to fill fundamental gaps in the knowledge of nutrient-genome interactions in health and disease. For example, human epidemiologic studies as well as increasing animal models demonstrate that maternal nutrition can “programme” gene expression patterns in the embryo that persist into adulthood and contribute to metabolic disease141. So, epigenetic mechanisms may provide a possible explanation for how environmental influences in early life cause long-term changes in disease susceptibility. Further, among a variety of epigenetic factors, essential nutrients, but also environmental toxins, have been show to affect epigenetic mechanisms, such as DNA methylation, modification of histone proteins and RNA silencer pathway. It is evident that the potentially reversible epigenetic dysregulations, for example involving miRNAs, may also have an important role in the disease origin, such as CD. The aim of this project is to perform an extensive study of the different miRNAs expression pattern in intestinal mucosa from celiac patients at different stages of the disease (with active CD and at gluten free diet) and from controls, to investigate the role of these molecules in transcriptional regulation in CD. The identification of miRNAs differently expressed in CD patients respect to controls will allow to identify their gene target and the metabolic pathways that could be involved in the disease insurgence. Particularly, the identification of miRNAs expressed differently only in active CD vs remitted CD, could identify genes involved in mucosal inflammation; the miRNAs expressed similar in CD and in GFD patients vs controls, could identify genes involved in pathogenesis of CD. So, these results could contribute to explain molecular mechanisms involved in CD pathogenesis. Deeper understanding of miRNAs mechanism in health and CD, their relationship with the environmental influences and the way they are associated with the disease phenotype, may lead to development of new biomarkers and new appropriate therapeutic strategies. Infact, it can clarify molecular mechanisms involved in pathogenesis of CD and can drive new terapeuthical approach based on miRNA-oligonucleotides. For example, miRNAs differently expressed in CD and in GFD patients vs controls, can be used as genetic marker to identified precociously CD in risk subjects (subjects with clinical suspicious of CD, but with normal mucosal architecture, and first grade parents).

44
MATERIALS AND METHODS Patients and controls We recruited 20 children with suspected CD, 9 undergoing CD follow-up and 15 controls, among patients consecutively attending the Department of Paediatrics and the European Laboratory for the Investigation of food-induced diseases (ELFID) of the University of Naples “Federico II”. From all patients and controls, we collected a fasting serum sample, a blood sample with EDTA, and a small intestinal bioptic sample. The general characteristics of the celiac patients and control children are reported in Table 2. The 55% of CD patients were girls and the age at diagnosis was 4.3±1.3 (mean±SEM) years. The 80% of these had gastrointestinal symptoms; the 85% of active CD (17/20) had a villous atrophy classified as TIIIC according to the modified Marsh classification; instead, the remaining 15% (3/20) had a villous atrophy classified as TIIIB. All active CD children were positive for tTG or EMA (IgA); only 1 subject was negative for these antibodies but was positive for both AGA IgG/IgA antibodies. The control patients were 15 and the 45% of these were girls; they were not-CD age-matched because the age at diagnosis was 6.1±1.0 (mean±SEM) years. Control subjects also underwent histological examination of the small intestine, even if they were negative for serum autoimmune markers, in order to confirm the diagnosis or to rule out the silent form of CD. Eleven of the 15 control patients were enrolled in the study with one of the following final diagnoses: Helicobacter pylori infection, recurrent vomiting, lack of appetite or reflux esophagitis. The remaining 4 patients were affected by IgA deficit (2 cases), De George syndrome (1 case) and autoimmune thyroiditis (1 case), and were excluded from the study because considered potentially confounding diseases. All control subjects had slight or no abnormalities in the mucosal architecture: infact, the 64% of these (7/11) has normal mucosal architecture classified as type T0-Marsh stage, but the remaining 36% (4/11) revelead normal mucosal architecture in which the villous epithelium was markedly infiltrated by lymphocytes (TI Marsh stage). The 9 GFD patients had been on a GFD for at least 2 years; infact, the histological examination of the small intestine carried out after 2 years of free-gluten diet, revelead normal mucosal architecture; the 55% of these (5/9) were girls and the age at diagnosis was 7.6±2.5 (mean±SEM) years. Written informed consent was obtained from all individuals before their enrollment. The study was conducted according to the Helsinki II declaration and it was approved by the Ethics Committee of our School of Medicine. Biochemical parameters A fasting serum sample was used to evaluete the biochemical parameters. Anti-Endomysium IgA were detected by indirect immunofluorescence microscopy on rhesus monkey esophagus substrate (Eurospital, Trieste, Italy); tTG IgA, anti-gliadin (AGA) IgA/IgG were analyzed by ELISA with human recombinant tTG as antigen (DIA Medix Corp., Miami, FL, USA). IgA deficiency was evalueted using a nephelometric assay (DADE BEHRING, BNProSpec) in all subjects negative for CD antibodies.
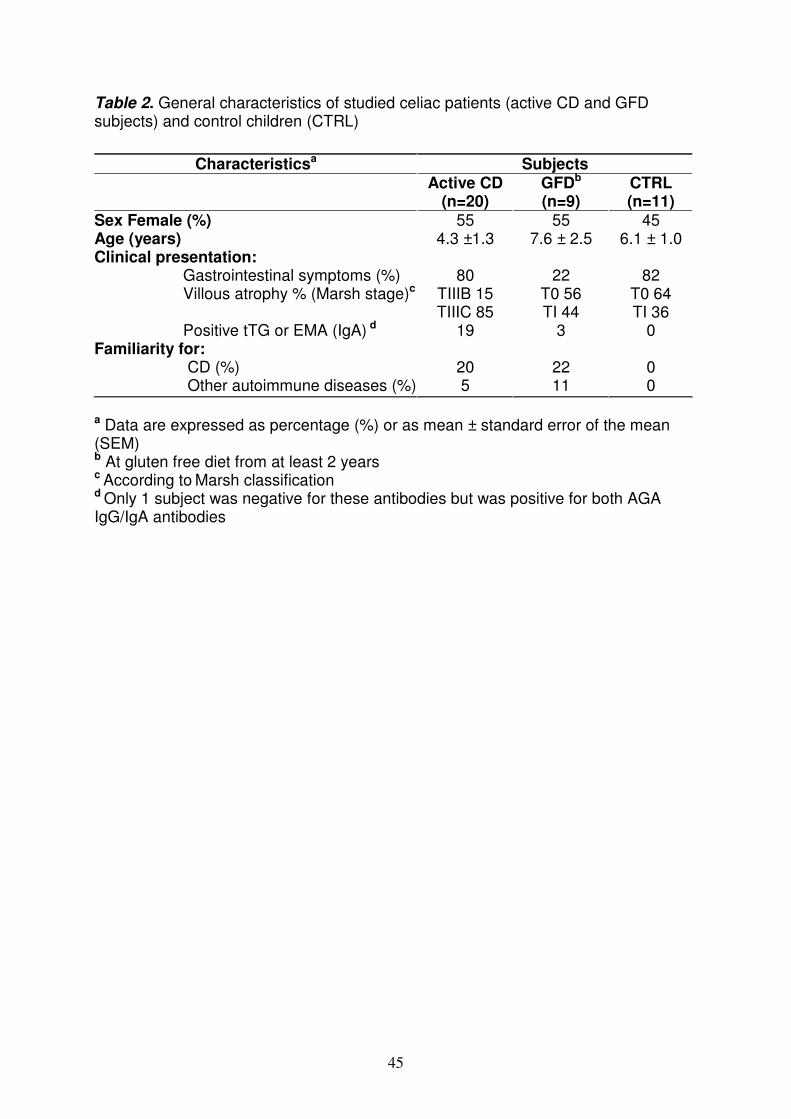
45
Table 2. General characteristics of studied celiac patients (active CD and GFD subjects) and control children (CTRL)
a Data are expressed as percentage (%) or as mean ± standard error of the mean (SEM) b At gluten free diet from at least 2 years c According to Marsh classification d Only 1 subject was negative for these antibodies but was positive for both AGA IgG/IgA antibodies
Characteristicsa Subjects Active CD
(n=20) GFDb (n=9)
CTRL (n=11)
Sex Female (%) 55 55 45 Age (years) 4.3 ±1.3 7.6 ± 2.5 6.1 ± 1.0 Clinical presentation: Gastrointestinal symptoms (%) 80 22 82 Villous atrophy % (Marsh stage)c TIIIB 15
TIIIC 85 T0 56 TI 44
T0 64 TI 36
Positive tTG or EMA (IgA) d 19 3 0 Familiarity for: CD (%) 20 22 0 Other autoimmune diseases (%) 5 11 0

46
DNA extraction Genomic DNA was extracted from a blood sample plus EDTA using the Nucleon BACC 2 kit (Amersham Biosciences Europe, Milan, Italy). The DNA was dissolved in water; the final DNA concentration and purity was measured using a NanoDrop ND-1000 spectrophotometer (NanoDrop technologies, Wilmington, DE, USA). The agarose gel electrophoresis was used to determine the success of the extraction and to evaluate the amount of high molecular weight nucleic acids and eventually its degradation (see “electrophoresis” section). The purified DNA was storage at -20°C. HLA typing DQ2/DQ8 HLA susceptibility molecules were identified using specific primer-PCR typing of the HLA-DQA1*/DQB1*/DRB1* loci (BAG Health care GmbH, Lich Germany). This kit uses Sequence Specific Primers (SSP)-PCR to detect specific HLA genotype. Infact, the kit consists of a 24 wells-plate, in which are deposited the prealiquoted and dried reaction mixtures for both DQ2/DQ8 alleles specific primers and internal control primers (specific for the human G3PDH gene). Ten µl of Master-Mix [consisting of 10X PCR-buffer, 50 µl DNA (50 ng/µl), 1 ul Taq-Polymerase (5U/µl) and H2O] were added to pre-dropped reaction mixtures. The plate was put on a thermal cycler and the PCR program was the following: 1x (5’at 96°C); 5x (20”at 96°C, 1’at 68°C); 10x (20”at 96°C, 50”at 64°C, 45”at 72°C); 15x ( 20”at 96°C, 50”at 61°C, 45”at 72 °C); 1x (5’at 72°C). The amplification products were separated by electrophoresis agarose gel and the results were interpretated using the specific software (see “electrophoresis” section). Electrophoresis Agarose gel electrophoresis is a method that separates a mixed population of nucleic acids (DNA and RNA) fragments by length, to estimate their size. Nucleic acid molecules are separated by applying an electric field to move the negatively charged molecules through an agarose matrix. Shorter molecules move and migrate faster than longer ones because shorter molecules migrate more easily through the pores of the gel. Agar or agar-agar is a gelatinous substance derived from a polysaccharide that accumulates in the cell walls of agarophyte red algae. The gel concentration used to separate SSP-PCR products was 2.0% (2 gr of agarose in 100ml 1X TBE), but to evaluete DNA purity was 1% (1 gr of agarose in 100ml 1X TBE); the agarose solution was boiled to dissolve the agarose and then was added 5 µl ethidium bromide stock (10 mg/ml) for a final concentration of 0.5 µg/ml. The ethidium bromide is a common dye used to make nucleic acids bands visible because it fluoresces under UV light when intercalated into DNA or RNA. The solution was stired to disperse the ethidium bromide and then it was poured into the gel rack. When the gel has cooled down and become solid, it was puted into a tank with the electrophoresis buffer 0.5X TBE (45 mM of tris, 45 mM of boric acid, 0.5 mM of EDTA). The PCR mixtures were loaded with 2 µl 6X loading buffer (0.25% w/v bromophenol blue, 30% glycerol and 0.25% w/v xylene cianol) in each slot of the gel; in addition, 10 µl of the DNA length standard for size comparison [Marker XVI Roche (0.25-3.090 kbp)] was loaded into a well. Electrophoretic separation was done at 100 V/cm, for 20-40 minutes. After the run has been completed, the DNA bands were visualized on a UV transilluminator. The gel can then be photographed with a polaroid camera. Particularly, to detect the overall quality of an RNA preparation it was preferred the electrophoresis on a denaturing agarose gel: the RNA was denaturated for 5 min at
47
94°C and then it was loaded on the gel; the electrophoresis was performed at 50 V/cm and then the RNA was visualized on a UV transilluminator. Histopathological analysis Biopsy specimens from the distal duodenum were obtained by upper gastrointestinal endoscopy from all CD patients and controls enrolled in this study; each bioptic sample was divided in two aliquots: one was used to histopathological analysis and the other was frozen in liquid nitrogen to RNA extraction. RNA extraction Total RNA, including miRNAs, was extracted from an aliquot of bioptyc samples for each patient, using the Mirvana extraction kit (Applied Biosystems, Foster City, CA, USA). Each frozen biopsy has been removed from -80°C freezer and immediately processed to evoid that ice crystals could rupture cellular compartments, releasing RNases. The extraction was performed in 3 steps:
- Tissue lysis The weight of the bioptyc sample was measured and then was added 10 volumes of lysis/binding buffer per tissue mass to preserve RNA; then the sample was homogenate using a tissue lyser system (Tissue Lyser II-Retsch Quiagen) using beads of 3 mm diameter, for 2 minutes at 18 oscillations for second
- Organic extraction At the homogenate sample was added 1/10 volume of miRNA homogenate Additive and then the mixture was leaved on ice for 10 minutes; then it was added a volume of acid-phenol:Chloroform to remove proteins and cellular residues; the mixture was vortexed for 1 minute and then was centrifugated for 5 minutes at 10.000 g at room temperature. The upper phase was transferred into a fresh tube.
- Isolation of total RNA including miRNAs At the sample was added 1.25 volumes of room temperature 100% ethanol and then it was loaded onto a filter; it was centrifugated for 15 seconds at 10.000 g to pass the mixture through the filter, and then the filter was washed with 2 differently solutions; the filter was trasfered into a fresh tube, it was applyied 100µl of pre-heated water (95°C) and then was centrifugated at 10.000 g for 30 seconds to elute the total RNA. The final RNA concentration was measured using a NanoDrop ND-1000 spectrophotometer (NanoDrop Technologies). The agarose gel electrophoresis was used to evaluate the amount of high molecular weight nucleic acids and eventually its degradation, because the RNA purity and integrity were critical factors for the real-time PCR (see “electrophoresis” section). The purified RNA was storage at -80°C. TaqMan Low Density Array (TLDA) technology The TaqMan Low Density Array (TLDA) is an efficient and flexible technology that enables real-time PCR in a low-density array format and streamline gene expression using ABI PRISM 7900HT Sequence Detection System. TLDA are 384-well micro fluidic cards, pre-loaded with real-time PCR assays available for human, mouse, and rat gene. This technology is used to obtain a miRNA profiling because it selectively detect and quantify the mature, biologically active form of miRNAs; infact, TLDA takes advantage of a novel reverse transcription step utilizing unique hairpin-loop RT primers that are specific to only the mature miRNA species. Infact, the design of a random-primer RT is prohibited for the short length of mature miRNAs (~22 nucleotides), but the stem-loop structure provides specificity for only the mature

48
miRNA target and forms an RT primer/mature miRNA chimera that extends the 3’ end of the miRNA. The resulting longer RT amplicon presents a template amenable to standard real-time PCR using TaqMan Assays. It can also discriminate between highly homologous targets (http://mirna.appliedbiosystems.com). The TLDA used (Human MicroRNA Array v1.0) contains 365 different human miRNA assays in addition to two carefully selected small nucleolar RNAs (snoRNAs: RNU48 and RNU44) that function as endogenous controls for data normalization (Figure 10). Usually, the amplification of an endogenous control is performed to standardize the amount of RNA sample. Our normalization was performed using as endogenous control the RNU48 because its expression was relatively constant in all studied intestinal samples. The TaqMan Array is designed for two-step RT-PCR:
1) In the reverse-transcription (RT) step, cDNA is reverse transcribed from total RNA samples (800 ng).
2) In the PCR step, PCR products are amplified from cDNA. Particularly, an equivalent amount of RNA into RT reaction and an equivalent volume of the cDNA for the real-time PCR reactions were used. All 365 miRNA targets were reverse transcribed in eight separate RT reactions for the 8 fill ports present in each card; the components used to prepare the RT-Mix are described in Table 3 and the termal cycler’ program used for RT-PCR are reported in Table 4. The eight predefined RT primer pools were a mixture containing up to 48 RT primers each. A total of eight independent RT reactions were run for sample. After the RT-PCR, the 8 RT reactions were diluited and 8 RT Master Mix was prepared as described in Table 5. Each RT Master Mix was pipetted into the corresponding filling ports on the TaqMan Array. The loaded card was centrifugated 2 times at 1200 rpm for 1 min to obtain a complete distribution of PCR reaction mix in the multiple wells; then it was sealed to prevent well-to-well contamination and the fill consumable was trimmed off. Finally, the cards were processed on an ABI Prism 7900 HT apparatus (Applied Biosystems) using the thermal cycler conditions described in Table 6. SDS Software Plate Documents Each TLDA was supplied of SDS plate documents contained information necessary to run the card on the 7900HT instrument because it configured the plate document plate grid and setup table. Then, SDS plate documents stored data collected from a run including sample names and detectors. The fluorescence data generated in this step were elaborated with System Relative Quantitation software 2.3 to determine relative levels of miRNAs expression. Comparative C
T Method (∆∆Ct) and SDS Version 2.3 Software
SDS Version 2.3 Software delivers a complete suite of tools to perform the ∆∆CT
calculations in addition to real-time PCR plate set-up and analysis of gene expression, pathogens, and SNPs (www.7900ht.com). This software analyzes fluorescence data generated during PCR for each card using Comparative CT method (∆∆C
T) that is a convenient method to analyze the relative changes in gene
expression. The ∆∆CT
Method is similar to the Relative Standard Curve Method,
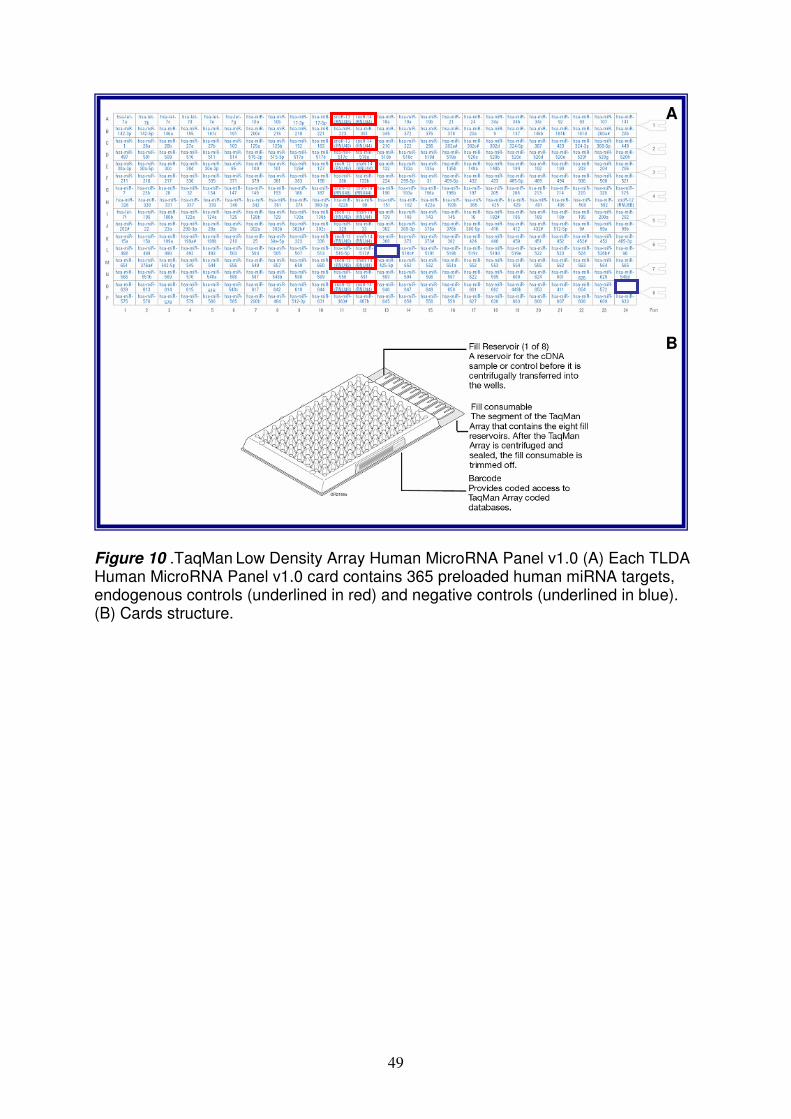
49
Figure 10 .TaqMan
Low Density Array Human MicroRNA Panel v1.0 (A) Each TLDA Human MicroRNA Panel v1.0 card contains 365 preloaded human miRNA targets, endogenous controls (underlined in red) and negative controls (underlined in blue). (B) Cards structure.
A
B
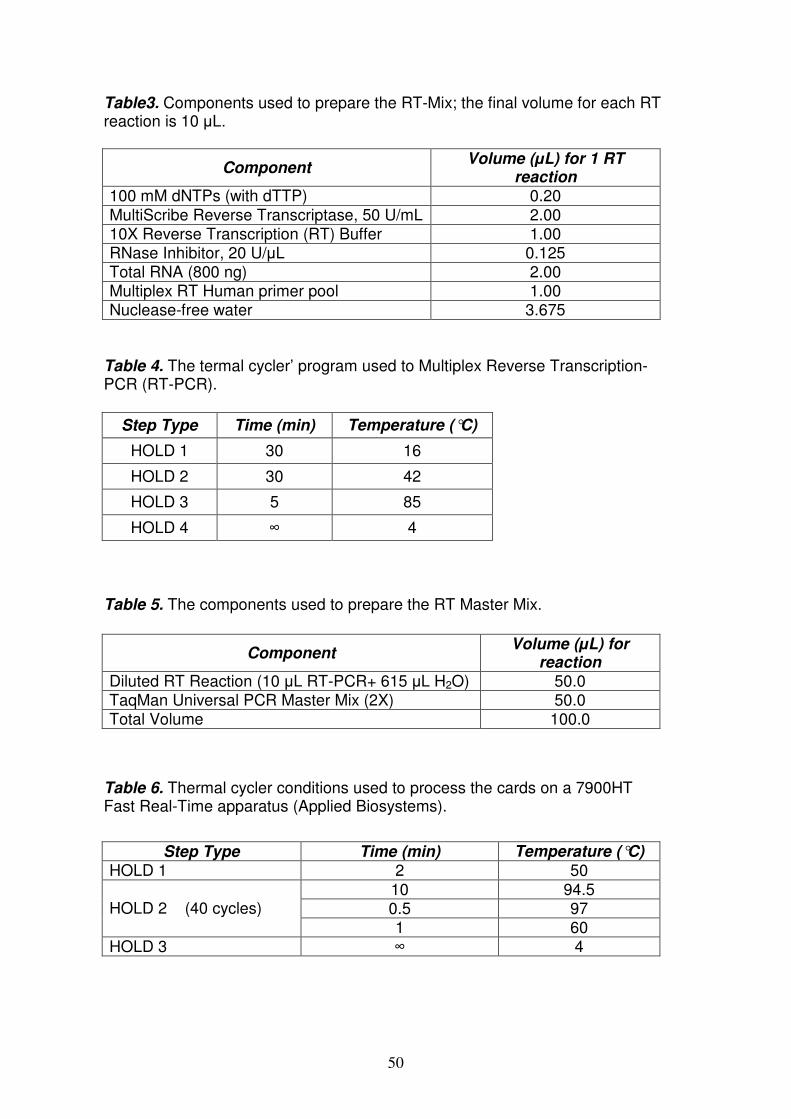
50
Table3. Components used to prepare the RT-Mix; the final volume for each RT reaction is 10 µL.
Table 4. The termal cycler’ program used to Multiplex Reverse Transcription-PCR (RT-PCR).
Table 5. The components used to prepare the RT Master Mix.
Table 6. Thermal cycler conditions used to process the cards on a 7900HT Fast Real-Time apparatus (Applied Biosystems).
Component Volume (µL) for 1 RT
reaction 100 mM dNTPs (with dTTP) 0.20 MultiScribe Reverse Transcriptase, 50 U/mL 2.00 10X Reverse Transcription (RT) Buffer 1.00 RNase Inhibitor, 20 U/µL 0.125 Total RNA (800 ng) 2.00 Multiplex RT Human primer pool 1.00 Nuclease-free water 3.675
Step Type Time (min) Temperature (°C)
HOLD 1 30 16
HOLD 2 30 42
HOLD 3 5 85
HOLD 4 ∞ 4
Component Volume (µL) for
reaction Diluted RT Reaction (10 µL RT-PCR+ 615 µL H2O) 50.0 TaqMan Universal PCR Master Mix (2X) 50.0 Total Volume 100.0
Step Type Time (min) Temperature (°C) HOLD 1 2 50
10 94.5 0.5 97 HOLD 2 (40 cycles) 1 60
HOLD 3 ∞ 4
51
except it uses arithmetic formulas to achieve the result for relative quantitation. It is possible to eliminate the use of standard curves and to use the ∆∆C
T Method for
relative quantitation as long as the PCR efficiencies between the target(s) and endogenous control(s) are relatively equivalent. This method is useful when a high number of targets and/or number of samples are tested; infact, the standard curves are not required to run on each plate. It requires the assignment of one or more housekeeping genes (endogenous controls), which are assumed to be uniformly and constantly expressed in all samples, as well as one or more reference samples. Because the endogenous control is used to normalize differences in the amount of cDNA that is loaded into PCR reaction wells, endogenous control expression levels must be similar in all samples in the study (while the target’s expression levels may vary widely, expression of the endogenous control remains constant). The endogenous sample used in this study was RNU48 because it observed this feature. The fold-differences in miRNAs expression are first determined from the threshold cycle (C
T) values normalized to the expression of the reference sample. The CT
indicates the fractional cycle number at which the amount of amplified target reaches a fixed threshold. The expression of other samples is then compared to that in the reference sample. The amount of target, normalized to an endogenous reference and relative to a calibrator, is given by 2-∆∆CT. The ∆C
T value is calculated by: ∆CT=CT
target-CT reference. The ∆∆CT
is calculated by: ∆∆CT=∆C
T test sample-∆C
T calibrator
sample. The calibrator is a sample that is used as the basis for comparative expression results. In this study the calibrator was a mean of fluorescence data obtained from controls. So, the RQ of each miRNA calculated with the 2-∆∆CT algorithm represented, in this study, the miRNA fold change expression level measured in CD patients vs the mean level obtained in the controls. We considered differently expressed in CD patients vs control, the miRNAs whose mean RQ levels were ≤0.5 (downregulated) or ≥2.0 (upregulated) in almost 15/20 active CD (75%) and 7/9 GFD patients (78%). The RQ levels were expressed as mean±standard error of the mean (SEM) between 3 study groups (active CD and GFD patients vs control subjects). TaqMan chemistry After the reverse transcription, the PCR is performed using MGB probe; the TaqMan MGB probes contain a reporter dye (6-FAM™ dye) linked to the 5´ end of the probe, a minor groove binder (MGB) and a non fluorescent quencher (NFQ) at the 3´ end of the probe. MGBs increase the melting temperature (Tm) without increasing probe length142; they also allow the design of shorter probes. Briefly, during PCR each TaqMan MGB probe anneals specifically to its complementary sequence between the forward and reverse primer sites; when the oligonucleotide probe is intact, the proximity of the quencher dye to the reporter dye causes the reporter dye signal to be quenched. A DNA polymerase extends the primers bound to the cDNA and (a 5´nuclease) cleaves the probes that are hybridized to the target sequence; when the hybridized probes are cleaved by enzyme, the quencher is separated from the reporter dye, increasing the fluorescence of the reporter dye. Therefore, the fluorescence signal generated by PCR amplification indicates the gene expression level in the sample.

52
Bioinformatic prediction of target genes for miRNAs Computational algorithms for target prediction in mammals combine base pairing pattern, thermodynamic stability of miRNA-mRNA hybrid, comparative sequence analysis to check conservation and examination of the presence of multiple site, in order to maximize specificity. To determine possible target genes for the differentially expressed miRNAs in celiac disease, we used miRecords (http://mirecords.biolead.org/). MiRecords is an integration of 11 established miRNA target prediction programs: DIANA-microT, MicroInspector, miRanda, MirTarget2, miTarget, NBmiRTar, PicTar, PITA, RNA22, RNAhybrid, and TargetScan/TargertScanS. We considered only the target genes predicted by two or more programs of Mirecords; particularly, based on literature data, we considered preferentially, TargetScan, PicTar and Miranda. TargetScan (http://www.targetscan.org/) is an algorithm that identified the targets of vertebrate miRNAs. The program integrates thermodynamics-based modeling of miRNA-mRNA interactions and comparative sequence analysis to predict miRNA targets conserved across multiple genomes such as human, mouse and rat. It searches for seed matches in the first organism such as human and expand each seed match with additional base pairings to the miRNA. The thermodynamic properties of miRNA-mRNA duplexes are assessed by calculating free-energy (∆G) of the putative binding site by using the RNAFold package (http://www.tbi.univie.ac.at/~ivo/RNA/) and assign a score to each UTR. This is very important because allow to identify complex RNA secondary structures located in the 3’UTR that may prevent miRNA/mRNA interactions; in fact, a common feature of most validated targets is that miRNAs preferentially target 3’-UTR sites that do not have complex secondary structures and are located in accessible regions of the mRNA based on favourable thermodynamics. Moreover, a low free energy of hybridization does not guarantee accurate prediction of miRNA target genes143, thus, it is inevitable to consider additional features such as conservation analysis for reliable prediction of target transcript. Contrary to TargetScan that require a seed match at exactly corresponding positions in a cross-species UTR alignment, PicTar requires binding sites that are coregulated by multiple miRNAs across species; infact, multiple copies of miRNA target sites on the 3′ UTR of the gene in question increase the degree of translational suppression and enhance specificity of gene regulation. In detail, PicTar checks the alignments of 3' UTRs for those displaying seed matches to miRNAs, filters the retained alignments based on their thermodynamic stability, and computes a hidden Markov model (HMM) maximum likelihood score (PicTar score) for each predicted target. To filter out false positives, PicTar used statistical tests based on genome-wide alignments of eight vertebrate genomes and considered clustering co-expressed miRNAs and matching miRNAs with putative targets that are expressed in the same context. Finally, MiRanda selected target genes for each miRNA, on the basis of three properties: sequence complementarity using a position-weighted local alignment algorithm, free energies of RNA-RNA duplexes, and conservation of target sites in related genomes. Infact, evolutionary conservation is another important factor to filter out false positive targets and increase specificity. It helps to predict only the target sites which are under selective pressure to preserve their sequence and presumably functionality, across evolution. The genes predicted by two or more programs of Mirecords, were then combined and analyzed using WebGestalt (WEB-based GEne SeT AnaLysis Toolkit) (http://bioinfo.vanderbilt.edu/webgestalt/). It is designed for functional genomic, proteomic and large-scale genetic studies from which large number of gene lists (e.g. differentially expressed gene sets, co-expressed gene sets etc) are
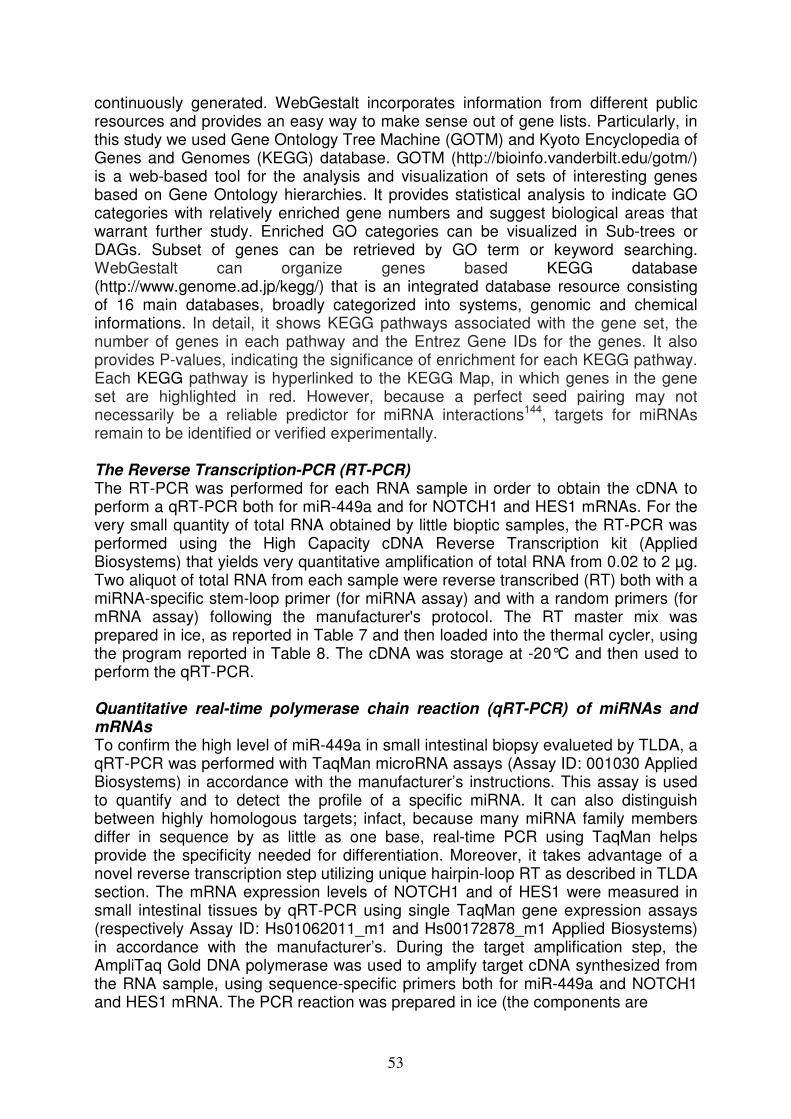
53
continuously generated. WebGestalt incorporates information from different public resources and provides an easy way to make sense out of gene lists. Particularly, in this study we used Gene Ontology Tree Machine (GOTM) and Kyoto Encyclopedia of Genes and Genomes (KEGG) database. GOTM (http://bioinfo.vanderbilt.edu/gotm/) is a web-based tool for the analysis and visualization of sets of interesting genes based on Gene Ontology hierarchies. It provides statistical analysis to indicate GO categories with relatively enriched gene numbers and suggest biological areas that warrant further study. Enriched GO categories can be visualized in Sub-trees or DAGs. Subset of genes can be retrieved by GO term or keyword searching. WebGestalt can organize genes based KEGG database (http://www.genome.ad.jp/kegg/) that is an integrated database resource consisting of 16 main databases, broadly categorized into systems, genomic and chemical informations. In detail, it shows KEGG pathways associated with the gene set, the number of genes in each pathway and the Entrez Gene IDs for the genes. It also provides P-values, indicating the significance of enrichment for each KEGG pathway. Each KEGG pathway is hyperlinked to the KEGG Map, in which genes in the gene set are highlighted in red. However, because a perfect seed pairing may not necessarily be a reliable predictor for miRNA interactions144, targets for miRNAs remain to be identified or verified experimentally. The Reverse Transcription-PCR (RT-PCR) The RT-PCR was performed for each RNA sample in order to obtain the cDNA to perform a qRT-PCR both for miR-449a and for NOTCH1 and HES1 mRNAs. For the very small quantity of total RNA obtained by little bioptic samples, the RT-PCR was performed using the High Capacity cDNA Reverse Transcription kit (Applied Biosystems) that yields very quantitative amplification of total RNA from 0.02 to 2 µg. Two aliquot of total RNA from each sample were reverse transcribed (RT) both with a miRNA-specific stem-loop primer (for miRNA assay) and with a random primers (for mRNA assay) following the manufacturer's protocol. The RT master mix was prepared in ice, as reported in Table 7 and then loaded into the thermal cycler, using the program reported in Table 8. The cDNA was storage at -20°C and then used to perform the qRT-PCR. Quantitative real-time polymerase chain reaction (qRT-PCR) of miRNAs and mRNAs To confirm the high level of miR-449a in small intestinal biopsy evalueted by TLDA, a qRT-PCR was performed with TaqMan microRNA assays (Assay ID: 001030 Applied Biosystems) in accordance with the manufacturer’s instructions. This assay is used to quantify and to detect the profile of a specific miRNA. It can also distinguish between highly homologous targets; infact, because many miRNA family members differ in sequence by as little as one base, real-time PCR using TaqMan helps provide the specificity needed for differentiation. Moreover, it takes advantage of a novel reverse transcription step utilizing unique hairpin-loop RT as described in TLDA section. The mRNA expression levels of NOTCH1 and of HES1 were measured in small intestinal tissues by qRT-PCR using single TaqMan gene expression assays (respectively Assay ID: Hs01062011_m1 and Hs00172878_m1 Applied Biosystems) in accordance with the manufacturer’s. During the target amplification step, the AmpliTaq Gold DNA polymerase was used to amplify target cDNA synthesized from the RNA sample, using sequence-specific primers both for miR-449a and NOTCH1 and HES1 mRNA. The PCR reaction was prepared in ice (the components are
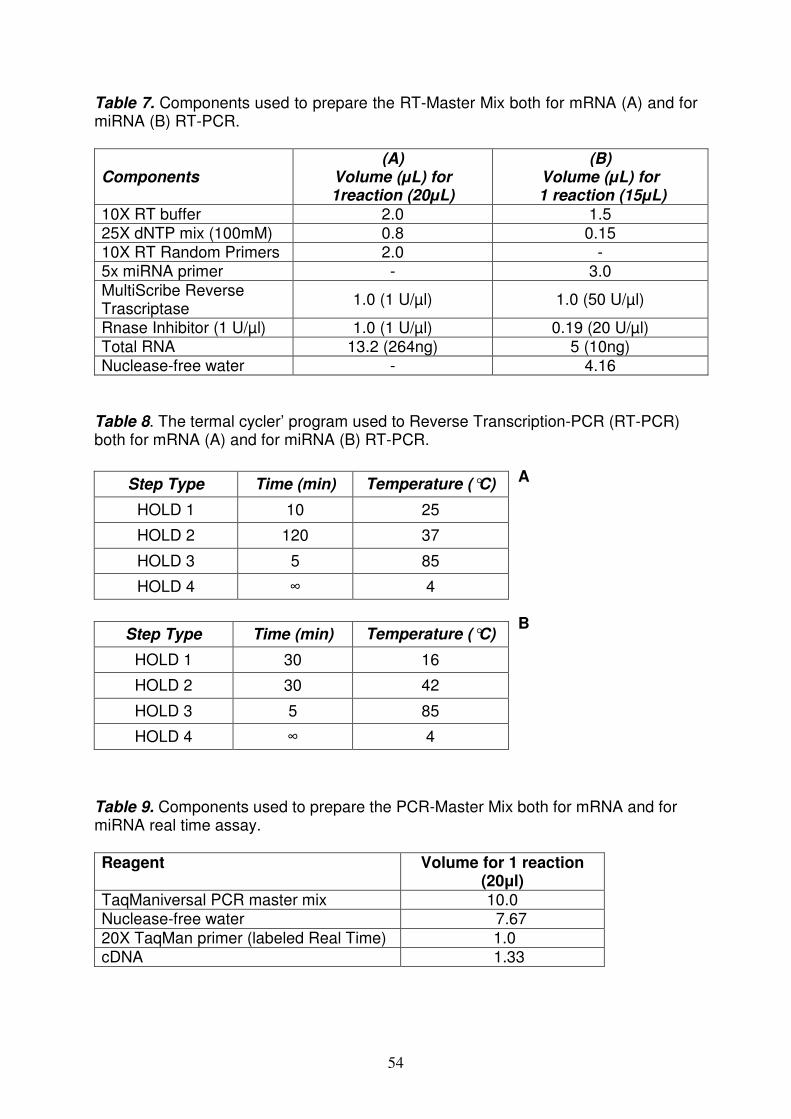
54
Table 7. Components used to prepare the RT-Master Mix both for mRNA (A) and for miRNA (B) RT-PCR.
Components (A)
Volume (µL) for 1reaction (20µL)
(B) Volume (µL) for
1 reaction (15µL) 10X RT buffer 2.0 1.5 25X dNTP mix (100mM) 0.8 0.15 10X RT Random Primers 2.0 - 5x miRNA primer - 3.0 MultiScribe Reverse Trascriptase
1.0 (1 U/µl) 1.0 (50 U/µl)
Rnase Inhibitor (1 U/µl) 1.0 (1 U/µl) 0.19 (20 U/µl) Total RNA 13.2 (264ng) 5 (10ng) Nuclease-free water - 4.16
Table 8. The termal cycler’ program used to Reverse Transcription-PCR (RT-PCR) both for mRNA (A) and for miRNA (B) RT-PCR.
A B
Table 9. Components used to prepare the PCR-Master Mix both for mRNA and for miRNA real time assay. Reagent Volume for 1 reaction
(20µl) TaqManiversal PCR master mix 10.0 Nuclease-free water 7.67 20X TaqMan primer (labeled Real Time) 1.0 cDNA 1.33
Step Type Time (min) Temperature (°C)
HOLD 1 10 25
HOLD 2 120 37
HOLD 3 5 85
HOLD 4 ∞ 4
Step Type Time (min) Temperature (°C)
HOLD 1 30 16
HOLD 2 30 42
HOLD 3 5 85
HOLD 4 ∞ 4
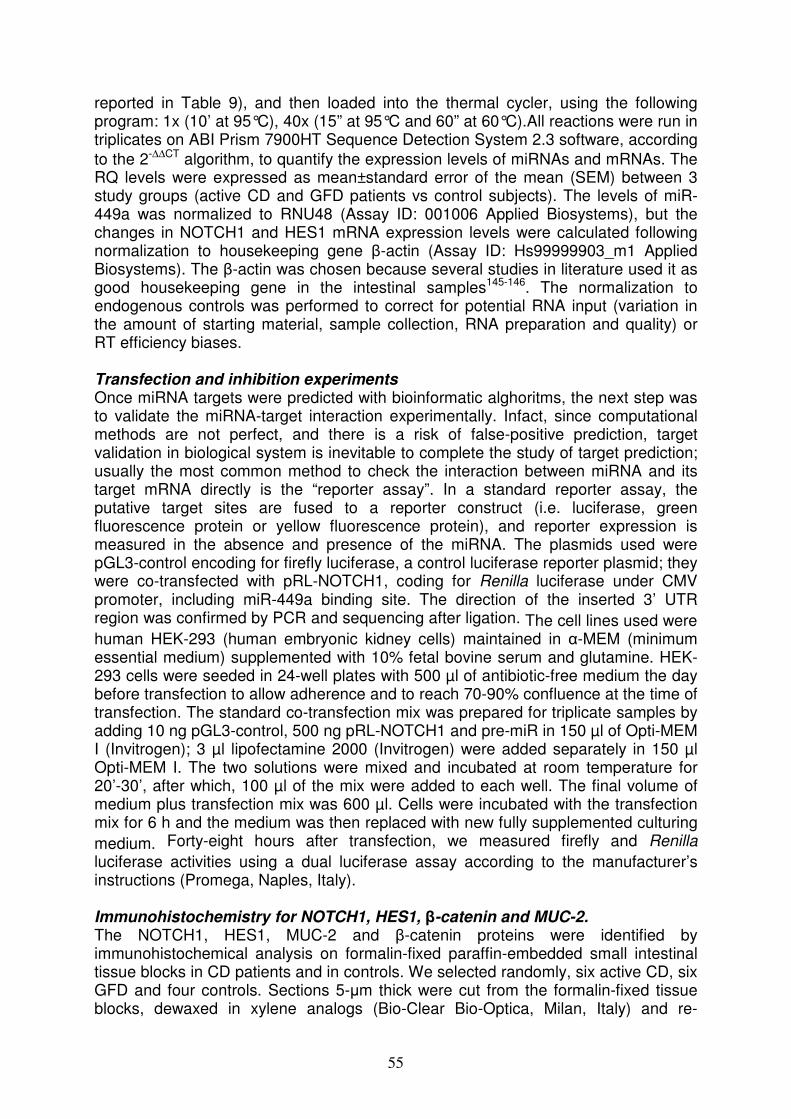
55
reported in Table 9), and then loaded into the thermal cycler, using the following program: 1x (10’ at 95°C), 40x (15” at 95°C and 60” at 60°C).All reactions were run in triplicates on ABI Prism 7900HT Sequence Detection System 2.3 software, according to the 2-∆∆CT algorithm, to quantify the expression levels of miRNAs and mRNAs. The RQ levels were expressed as mean±standard error of the mean (SEM) between 3 study groups (active CD and GFD patients vs control subjects). The levels of miR-449a was normalized to RNU48 (Assay ID: 001006 Applied Biosystems), but the changes in NOTCH1 and HES1 mRNA expression levels were calculated following normalization to housekeeping gene β-actin (Assay ID: Hs99999903_m1 Applied Biosystems). The β-actin was chosen because several studies in literature used it as good housekeeping gene in the intestinal samples145-146. The normalization to endogenous controls was performed to correct for potential RNA input (variation in the amount of starting material, sample collection, RNA preparation and quality) or RT efficiency biases. Transfection and inhibition experiments Once miRNA targets were predicted with bioinformatic alghoritms, the next step was to validate the miRNA-target interaction experimentally. Infact, since computational methods are not perfect, and there is a risk of false-positive prediction, target validation in biological system is inevitable to complete the study of target prediction; usually the most common method to check the interaction between miRNA and its target mRNA directly is the “reporter assay”. In a standard reporter assay, the putative target sites are fused to a reporter construct (i.e. luciferase, green fluorescence protein or yellow fluorescence protein), and reporter expression is measured in the absence and presence of the miRNA. The plasmids used were pGL3-control encoding for firefly luciferase, a control luciferase reporter plasmid; they were co-transfected with pRL-NOTCH1, coding for Renilla luciferase under CMV promoter, including miR-449a binding site. The direction of the inserted 3’ UTR region was confirmed by PCR and sequencing after ligation. The cell lines used were human HEK-293 (human embryonic kidney cells) maintained in α-MEM (minimum essential medium) supplemented with 10% fetal bovine serum and glutamine. HEK-293 cells were seeded in 24-well plates with 500 µl of antibiotic-free medium the day before transfection to allow adherence and to reach 70-90% confluence at the time of transfection. The standard co-transfection mix was prepared for triplicate samples by adding 10 ng pGL3-control, 500 ng pRL-NOTCH1 and pre-miR in 150 µl of Opti-MEM I (Invitrogen); 3 µl lipofectamine 2000 (Invitrogen) were added separately in 150 µl Opti-MEM I. The two solutions were mixed and incubated at room temperature for 20’-30’, after which, 100 µl of the mix were added to each well. The final volume of medium plus transfection mix was 600 µl. Cells were incubated with the transfection mix for 6 h and the medium was then replaced with new fully supplemented culturing medium. Forty-eight hours after transfection, we measured firefly and Renilla luciferase activities using a dual luciferase assay according to the manufacturer’s instructions (Promega, Naples, Italy). Immunohistochemistry for NOTCH1, HES1, β-catenin and MUC-2. The NOTCH1, HES1, MUC-2 and β-catenin proteins were identified by immunohistochemical analysis on formalin-fixed paraffin-embedded small intestinal tissue blocks in CD patients and in controls. We selected randomly, six active CD, six GFD and four controls. Sections 5-µm thick were cut from the formalin-fixed tissue blocks, dewaxed in xylene analogs (Bio-Clear Bio-Optica, Milan, Italy) and re-
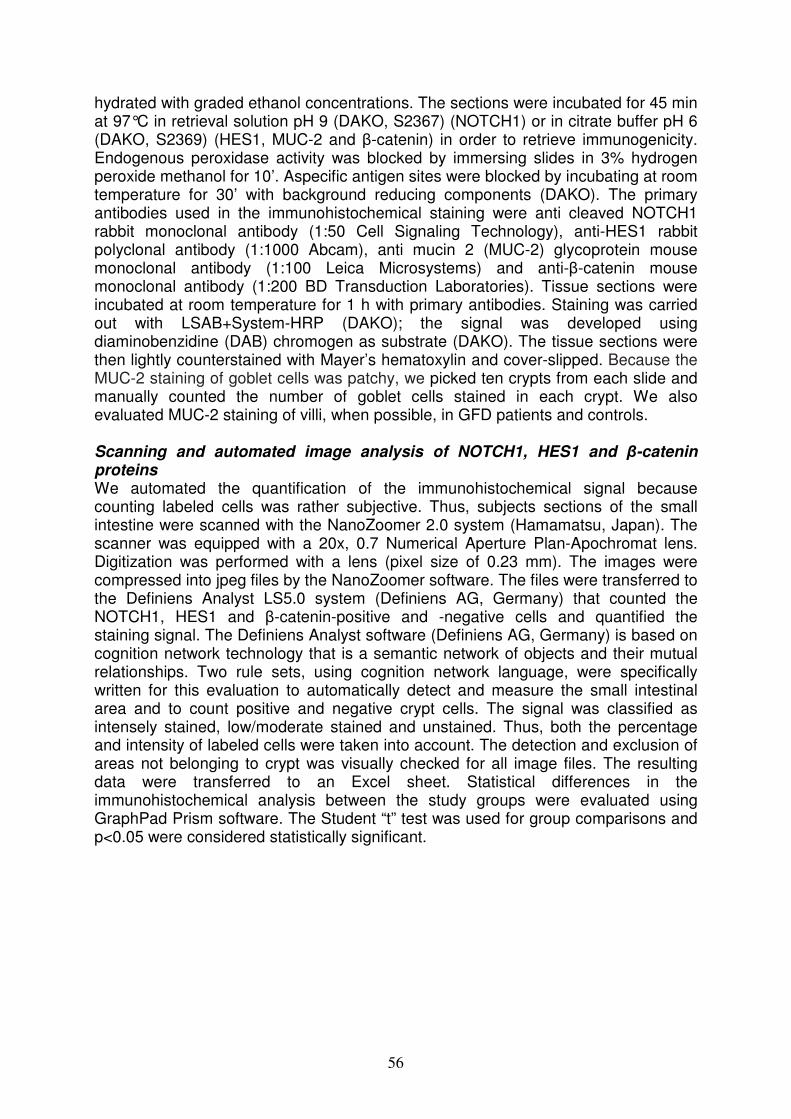
56
hydrated with graded ethanol concentrations. The sections were incubated for 45 min at 97°C in retrieval solution pH 9 (DAKO, S2367) (NOTCH1) or in citrate buffer pH 6 (DAKO, S2369) (HES1, MUC-2 and β-catenin) in order to retrieve immunogenicity. Endogenous peroxidase activity was blocked by immersing slides in 3% hydrogen peroxide methanol for 10’. Aspecific antigen sites were blocked by incubating at room temperature for 30’ with background reducing components (DAKO). The primary antibodies used in the immunohistochemical staining were anti cleaved NOTCH1 rabbit monoclonal antibody (1:50 Cell Signaling Technology), anti-HES1 rabbit polyclonal antibody (1:1000 Abcam), anti mucin 2 (MUC-2) glycoprotein mouse monoclonal antibody (1:100 Leica Microsystems) and anti-β-catenin mouse monoclonal antibody (1:200 BD Transduction Laboratories). Tissue sections were incubated at room temperature for 1 h with primary antibodies. Staining was carried out with LSAB+System-HRP (DAKO); the signal was developed using diaminobenzidine (DAB) chromogen as substrate (DAKO). The tissue sections were then lightly counterstained with Mayer’s hematoxylin and cover-slipped. Because the MUC-2 staining of goblet cells was patchy, we picked ten crypts from each slide and manually counted the number of goblet cells stained in each crypt. We also evaluated MUC-2 staining of villi, when possible, in GFD patients and controls. Scanning and automated image analysis of NOTCH1, HES1 and β-catenin proteins We automated the quantification of the immunohistochemical signal because counting labeled cells was rather subjective. Thus, subjects sections of the small intestine were scanned with the NanoZoomer 2.0 system (Hamamatsu, Japan). The scanner was equipped with a 20x, 0.7 Numerical Aperture Plan-Apochromat lens. Digitization was performed with a lens (pixel size of 0.23 mm). The images were compressed into jpeg files by the NanoZoomer software. The files were transferred to the Definiens Analyst LS5.0 system (Definiens AG, Germany) that counted the NOTCH1, HES1 and β-catenin-positive and -negative cells and quantified the staining signal. The Definiens Analyst software (Definiens AG, Germany) is based on cognition network technology that is a semantic network of objects and their mutual relationships. Two rule sets, using cognition network language, were specifically written for this evaluation to automatically detect and measure the small intestinal area and to count positive and negative crypt cells. The signal was classified as intensely stained, low/moderate stained and unstained. Thus, both the percentage and intensity of labeled cells were taken into account. The detection and exclusion of areas not belonging to crypt was visually checked for all image files. The resulting data were transferred to an Excel sheet. Statistical differences in the immunohistochemical analysis between the study groups were evaluated using GraphPad Prism software. The Student “t” test was used for group comparisons and p<0.05 were considered statistically significant.

57
RESULTS Identification of miRNAs on small intestine through TLDA methodology In order to identify miRNAs differently expressed in small intestine that might be relevant in the development of celiac disease, 3 different groups of children were enrolled. The first group was composed of 17 patients with active CD; the second group was composed of 9 GFD celiac patients at gluten free-diet from at least 2 years; the third group was composed of 11 control children negative for serum autoimmune markers and with normal intestinal architecture. For each patient a fasting serum sample was collected to test biochemical parameters and the presence of DQ2/DQ8 HLA susceptibility molecules. From all children enrolled in this study, a biopsy specimen from the distal duodenum was obtained; it was then divided in two aliquots: one was used for histopathological analysis and the other was liquid nitrogen frozen for the RNA extraction. The histopathological analysis of small intestine from all patients confirmed the CD diagnosis by showing the typical architectural abnormalities (intraepithelial lymphocytosis, or crypt hyperplasia and/or various degree of villous atrophy, according to Marsh IIIB or IIIC classification); whereas, in GFD patients and in controls, the mucosa was normal or showed a slight lymphocytosis (Marsh I classification). Total RNA was extracted from samples of small intestinal tissues from each subject. It was purified and quantified and only high quality RNA was used for the screening. The RNA was used to analyze miRNAs expression profile by TLDA. Generally, TLDA is a new methodology designed for analyzing gene expression patterns in many samples across a defined set of gene targets. TLDA consist of 384-well micro fluidic cards, pre-loaded with real-time PCR assays available for 365 human mature miRNAs; in literature, many groups used this card to study miRNAs profile in several tissues as brain147, blood148, breast cancer149 and in acute leukemias91. To determine relative levels of miRNAs expression, the fluorescence data generated by TLDA for each card were elaborated with SDS software 2.3 using ∆∆Ct method. This method was used to calculate the changes in miRNA expression of all samples respect to a non-disease sample (calibrator). Assay normalization was performed versus the constitutively expressed RNU-48 (endogenous control). MiRNAs whose mean RQ levels were ≤0.5 in almost CD patients [15/20 active CD (75%) and 7/9 GFD patients (78%)] were considered downregulated; miRNAs whose mean RQ levels were ≥2.0 in almost CD patients were considered upregulated. Expression profiling revealed that a large set of miRNAs were expressed in small intestine. Infact, Figure 11 showed the miRNA expression profile in the small intestine of children with active CD (panel A) and in children on a GFD (panel B). Ninety of the 365 (25%) miRNAs tested were not expressed in small intestine. Over 50% of miRNAs were expressed at similar levels in the two groups of CD patients and in control patients. On the contrary, the expression levels of about 20% of miRNAs (22% in active CD and 23% in GFD) were different between CD patients and controls. In detail, 33% (27 miRNAs) of these differently expressed miRNAs were upregulated (RQ≥2.0) in the active CD in comparison to controls and the 67% (55 miRNAs) remaining were downregulated (RQ≤0.5); they were listed in Table 10. Instead, in the GFD patients, 26% (22 miRNAs) of these differently expressed miRNAs were up-regulated (RQ≥2.0) and 74% (62 miRNAs) were down-regulated (RQ≤0.5) in comparison to controls; they were listed in Table 11.

58
Figure 11. MiRNA expression pattern in the small intestine of patients with active CD (A) and of CD patients on a GFD (B). Data are expressed as percentage of miRNAs tested (n=365). White areas, miRNAs whose expression levels were similar in the two CD groups and controls; gray areas, miRNAs not expressed;black areas, miRNAs whose expression levels differed between CD patients and controls [upregulated ↑(RQ≥2.0) or downregulated ↓(RQ≤0.5)].
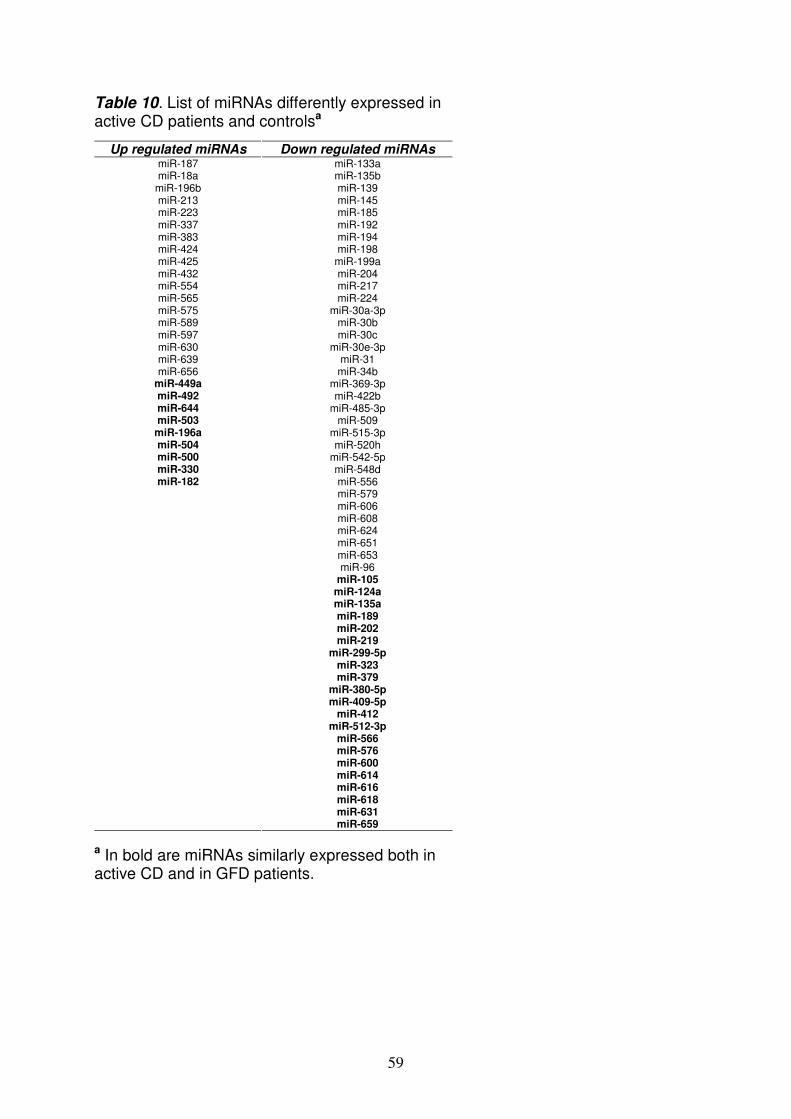
59
Table 10. List of miRNAs differently expressed in active CD patients and controlsa
a In bold are miRNAs similarly expressed both in active CD and in GFD patients.
Up regulated miRNAs Down regulated miRNAs miR-187 miR-133a miR-18a miR-135b
miR-196b miR-139 miR-213 miR-145 miR-223 miR-185 miR-337 miR-192 miR-383 miR-194 miR-424 miR-198 miR-425 miR-199a miR-432 miR-204 miR-554 miR-217 miR-565 miR-224 miR-575 miR-30a-3p miR-589 miR-30b miR-597 miR-30c miR-630 miR-30e-3p miR-639 miR-31 miR-656 miR-34b
miR-449a miR-369-3p miR-492 miR-422b miR-644 miR-485-3p miR-503 miR-509
miR-196a miR-515-3p miR-504 miR-520h miR-500 miR-542-5p miR-330 miR-548d miR-182 miR-556
miR-579 miR-606 miR-608
miR-624 miR-651 miR-653 miR-96 miR-105 miR-124a miR-135a miR-189 miR-202 miR-219 miR-299-5p miR-323 miR-379 miR-380-5p miR-409-5p miR-412 miR-512-3p miR-566 miR-576 miR-600 miR-614 miR-616 miR-618 miR-631 miR-659

60
Table 11. List of miRNAs differently expressed in GFD patients and controlsa
Up regulated miRNAs Down regulated miRNAs
miR-422a miR-99a miR-190 miR-100 miR-422b miR-125b miR-489 miR-153 miR-490 miR-203 miR-518d miR-383 miR-184 miR-432 miR-193b miR-433 miR-338 miR-518b miR-524 miR-622 miR-627 miR-639 miR-591 miR-132 miR-205 miR-411
miR-449a miR-376a miR-492 miR-410 miR-644 miR-630 miR-503 miR-99b miR-196a miR-105 miR-504 miR-125a miR-500 miR-130a miR-330 miR-133b miR-182 miR-143
miR-148a miR-17-3p miR-193a miR-27b miR-589 miR-650 miR-422a miR-190 miR-422b miR-489 miR-490 miR-518d miR-184 miR-193b miR-338 miR-524 miR-627 miR-591 miR-205 miR-105 miR-124a miR-135a miR-189 miR-202 miR-219 miR-299-5p miR-323 miR-379 miR-380-5p miR-409-5p miR-412 miR-512-3p miR-566 miR-576 miR-600 miR-614 miR-616 miR-618 miR-631 miR-659
a In bold are miRNAs similarly expressed both in active CD and in GFD patients.
61
The comparison bethween these two tables, evidentiated 30 miRNAs with similar expression levels in both CD patients vs controls; particularly, 9 were upregulated and 21 were downregulated (Table 12). It’s interesting to notice that miR-124a, miR-189, miR-299-5p and miR-379, downregulated in CD patients, were described in literature in association with autoimmune disorders. Particularly, miR-124a levels were significantly decreased in rheumatoid arthritis150; miR-189 and miR-379 levels were decreased in idiopathic thrombocytopenic purpura151; miR-299-5p levels “were increased” in primary biliary cirrhosis152. Among the miRNAs upregulated both in active CD and in GFD patients, miR-449a was expressed at very high levels: in all active CD the mean RQ±SEM was 55.18±16.45; in GFD children the mean RQ±SEM was 15.43±7.69. qRT- PCR for miR-449a The successive step was to perform a qRT-PCR in order to confirm the high level of miR-449a. Real-Time PCR assay is a highly sensitive approach for identifying miRNA profiles153. For this assay, we used stem-loop RT primers rather than conventional linear ones, because of their higher specificity and sensitivity likely due to the base stacking and spatial constraint of the stem-loop structure. The assays target only mature miRNAs, not their precursors, ensuring biologically relevant results. In almost all patients, miRNA profiling data correlated with qRT-PCR data; in fact, the expression levels of miR-449a were confirmed in active CD patients with a mean RQ±SEM of 2.8±0.9. Identification of miRNA targets Next, a bioinformatic approach was performed to select target genes of the miR449a. A gene target of miRNA regulation, might be predicted by various computational algorithms which utilize distinct parameters (such as base pairing pattern, thermodynamic stability of miRNA-mRNA hybrid, comparative sequence analysis to check conservation and examination of the presence of multiple site) to predict the probability of a functional miRNA binding site within a given mRNA target. Infact, computational algorithms have been the major driving force in predicting miRNA targets154. We used the bioinformatic algorithm Mirecords. Mirecords, for miR-449a, gave a list of 32936 predicted gene targets. So, to further reduce the number of putative repressed gene targets by miR-449a, they were selected if predicted by two or more programs and on basis of the best score allocated by different algorithms. In detail, six of the 11 programs of mirecords [Target Scan 5.1, PicTar, Miranda 1.9, MirTarget2 (v2.0), PITA (Catalog version 3) and RNAhybrid (V2.2)] identified several proteins that are present in relevant biological pathways. Identification of interesting pathways The list of these good gene targets was then combined and analyzed using WebGestalt to detect probably pathways in which they were involved. Particularly, GOTM and KEGG database were used to identify the biological pathways predicted to be deregulated by miR-449a; they were then sorted in functional groups and were reported in Figure 12. The functional groups selected were:
� cell organization and function � cell cycle and cancer � macromolecules biosynthesis � metabolism
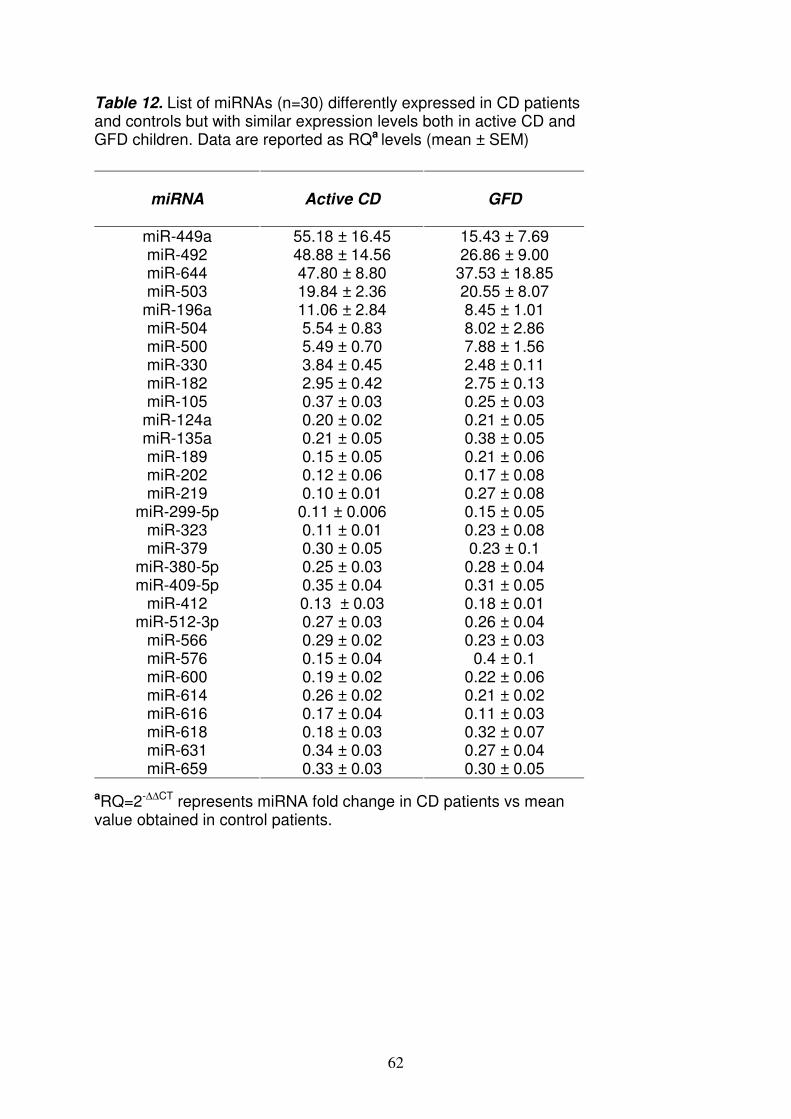
62
Table 12. List of miRNAs (n=30) differently expressed in CD patients and controls but with similar expression levels both in active CD and GFD children. Data are reported as RQa levels (mean ± SEM)
aRQ=2-∆∆CT represents miRNA fold change in CD patients vs mean value obtained in control patients.
miRNA
Active CD
GFD
miR-449a 55.18 ± 16.45 15.43 ± 7.69 miR-492 48.88 ± 14.56 26.86 ± 9.00 miR-644 47.80 ± 8.80 37.53 ± 18.85 miR-503 19.84 ± 2.36 20.55 ± 8.07
miR-196a 11.06 ± 2.84 8.45 ± 1.01 miR-504 5.54 ± 0.83 8.02 ± 2.86 miR-500 5.49 ± 0.70 7.88 ± 1.56 miR-330 3.84 ± 0.45 2.48 ± 0.11 miR-182 2.95 ± 0.42 2.75 ± 0.13 miR-105 0.37 ± 0.03 0.25 ± 0.03
miR-124a 0.20 ± 0.02 0.21 ± 0.05 miR-135a 0.21 ± 0.05 0.38 ± 0.05 miR-189 0.15 ± 0.05 0.21 ± 0.06 miR-202 0.12 ± 0.06 0.17 ± 0.08 miR-219 0.10 ± 0.01 0.27 ± 0.08
miR-299-5p 0.11 ± 0.006 0.15 ± 0.05 miR-323 0.11 ± 0.01 0.23 ± 0.08 miR-379 0.30 ± 0.05 0.23 ± 0.1
miR-380-5p 0.25 ± 0.03 0.28 ± 0.04 miR-409-5p 0.35 ± 0.04 0.31 ± 0.05
miR-412 0.13 ± 0.03 0.18 ± 0.01 miR-512-3p 0.27 ± 0.03 0.26 ± 0.04
miR-566 0.29 ± 0.02 0.23 ± 0.03 miR-576 0.15 ± 0.04 0.4 ± 0.1 miR-600 0.19 ± 0.02 0.22 ± 0.06 miR-614 0.26 ± 0.02 0.21 ± 0.02 miR-616 0.17 ± 0.04 0.11 ± 0.03 miR-618 0.18 ± 0.03 0.32 ± 0.07 miR-631 0.34 ± 0.03 0.27 ± 0.04 miR-659 0.33 ± 0.03 0.30 ± 0.05
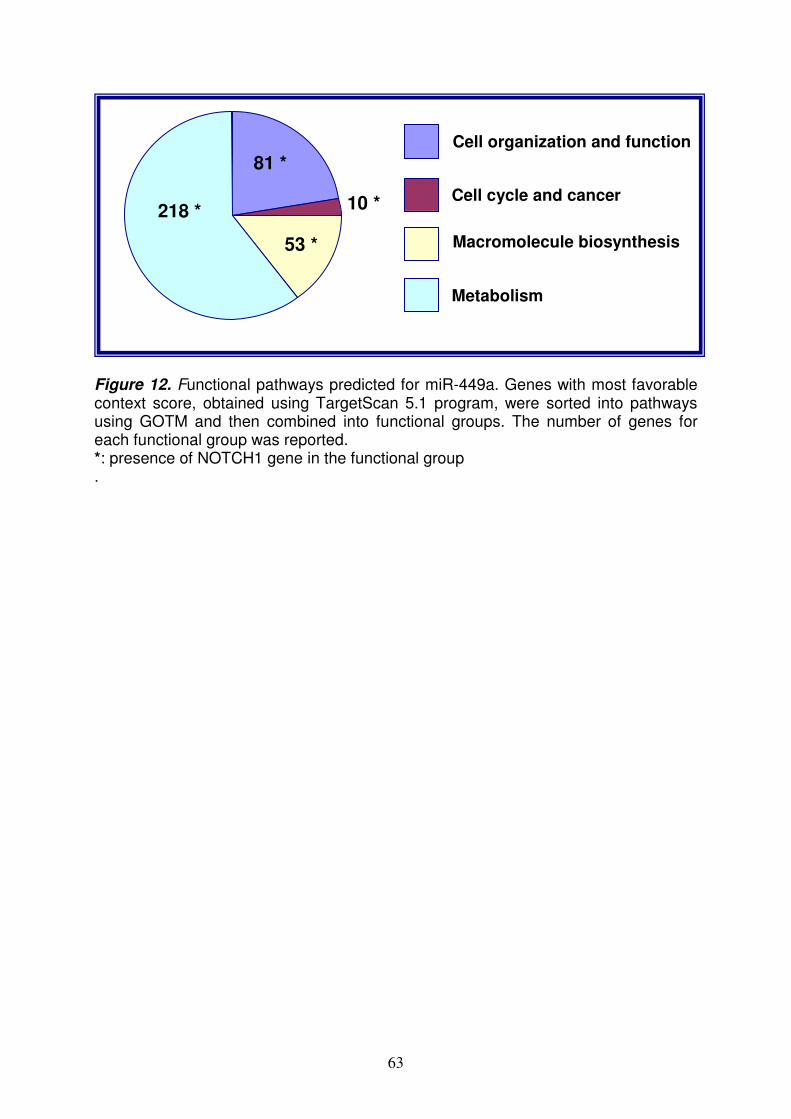
63
Figure 12. Functional pathways predicted for miR-449a. Genes with most favorable context score, obtained using TargetScan 5.1 program, were sorted into pathways using GOTM and then combined into functional groups. The number of genes for each functional group was reported. *: presence of NOTCH1 gene in the functional group .
81 *
10 *
53 *
218 *
Cell organization and function
Cell cycle and cancer
Macromolecule biosynthesis
Metabolism

64
It was interesting to notice that several genes were redundant in these groups and belonging to Notch pathway; they were:
� NOTCH1 (neurogenic locus notch homolog protein 1) � KLF-4 (Krueppel-like factor-4) � DLL (delta-like 1) � LEF1 (lymphoid enhancer-binding factor 1) � NUMBL (numb homolog-like)
Luciferase assay and validation of the interaction between miR-449a and NOTCH1 3’UTR The interaction between miR-449a and the 3′ UTR of NOTCH1 was validated using the luciferase reporter assay. The luciferase reporter assays is common experimental reporter system able to verify predicted miRNA/mRNA pairings on the basis that the binding of a given miRNA to its specific mRNA target site will repress reporter protein production thereby reducing activity/expression that could be measured and compared to a control. In cells co-transfected with pRL-NOTCH1 vector and pre-miR-449a, a pre-miR-449a concentration of 100 nmol/L was sufficient to significantly reduce (p=0.001) Renilla luciferase activity vs control values after 48h (Figure 13). This finding confirmed that there is an effective, specific and functional interaction between miR-449a and the 3’ UTR of NOTCH1. It suggests that changes in miR-449a levels may effectively modulate the expression of NOTCH1. qRT- PCR for NOTCH1 and HES1 To confirm the expression of NOTCH1 and HES1 mRNA in small intestine of CD patients vs controls, we performed the qRT-PCR; the data were normalized vs the house-keeping gene β-actin. In CD patients vs controls, the levels of NOTCH1 and HES1 mRNAs (expressed as RQ±SEM) were 3.4±1.3 and 2.2±0.6 respectively; in GFD patients were RQ±SEM: 6.5±4.7 and 4.2±2.9, respectively. These data confirm that NOTCH1 and HES1 are expressed in small intestine and their levels are up-regulated in CD patients respect to controls. Immunohistochemistry for NOTCH1 and HES1 We next investigated the protein expression of NOTCH1 and of HES1, in small intestinal biopsies from CD patients and controls. Figure 14 shows an example of the results obtained for NOTCH1. NOTCH1 was more homogeneously distributed and expressed at a higher level in the intestinal crypts of controls than in crypts of CD patients (panel A, left). On the right are the images converted for automated analysis (white: unstained cells, yellow/orange: low/moderately stained cells, brown: intensely stained cells). Significantly more intensely stained and less unstained cells (p=0.02) were detected in controls than in the two groups of CD patients (Figure 14, panel B). These results indicate that NOTCH1 is less expressed in the small intestine of CD patients than in controls.
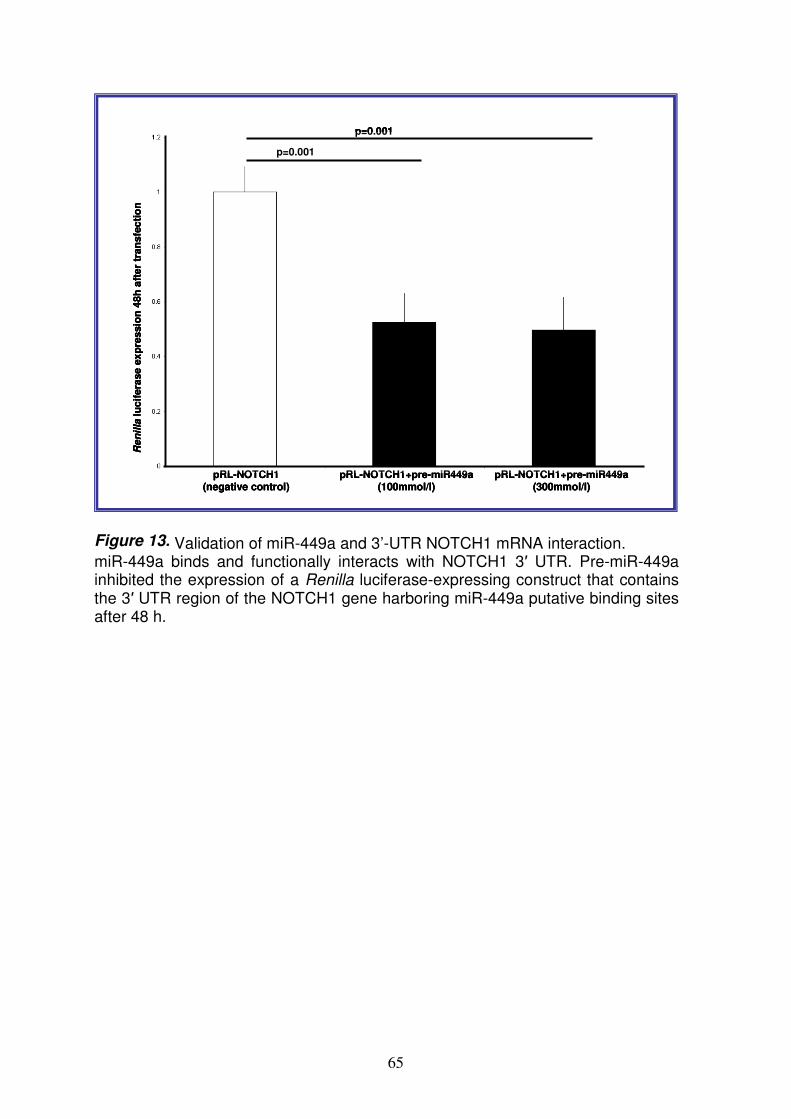
65
p=0.001
p=0.001
pRL-NOTCH1 (negative control)
pRL-NOTCH1+pre-miR449a (100mmol/l)
pRL-NOTCH1+pre-miR449a (300mmol/l)
Re
nil
lalu
cif
era
se
ex
pre
ssio
n 4
8h
aft
er
tran
sfe
cti
on
p=0.001
p=0.001
pRL-NOTCH1 (negative control)
pRL-NOTCH1+pre-miR449a (100mmol/l)
pRL-NOTCH1+pre-miR449a (300mmol/l)
Re
nil
lalu
cif
era
se
ex
pre
ssio
n 4
8h
aft
er
tran
sfe
cti
on
p=0.001
p=0.001
pRL-NOTCH1 (negative control)
pRL-NOTCH1+pre-miR449a (100mmol/l)
pRL-NOTCH1+pre-miR449a (300mmol/l)
Re
nil
lalu
cif
era
se
ex
pre
ssio
n 4
8h
aft
er
tran
sfe
cti
on
Figure 13. Validation of miR-449a and 3’-UTR NOTCH1 mRNA interaction. miR-449a binds and functionally interacts with NOTCH1 3′ UTR. Pre-miR-449a inhibited the expression of a Renilla luciferase-expressing construct that contains the 3′ UTR region of the NOTCH1 gene harboring miR-449a putative binding sites after 48 h.
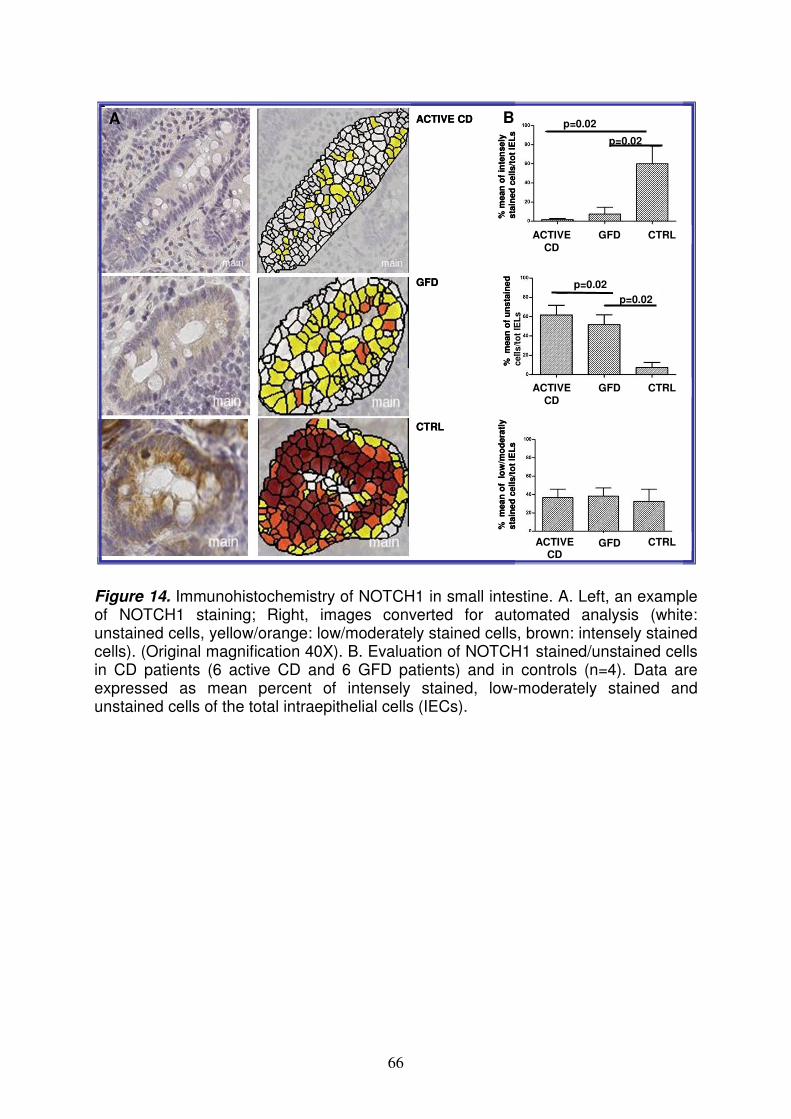
66
ACTIVE CD
GFD
CTRL
% m
ean
of
inte
nse
ly
sta
ined
ce
lls/t
ot
IEL
s
ACTIVE CD
GFD CTRL
ACTIVE CD
GFD CTRL
ACTIVE CD
GFD CTRL
% m
ea
n o
f u
ns
tain
ed
cell
s/t
ot
IEL
s
%
mean
of
lo
w/m
od
era
tly
sta
ine
d c
ell
s/t
ot
IEL
s
p=0.02
p=0.02
p=0.02
p=0.02
ACTIVE CD
GFD
CTRL
% m
ean
of
inte
nse
ly
sta
ined
ce
lls/t
ot
IEL
s
ACTIVE CD
GFD CTRL
ACTIVE CD
GFD CTRL
ACTIVE CD
GFD CTRL
% m
ea
n o
f u
ns
tain
ed
cell
s/t
ot
IEL
s
%
mean
of
lo
w/m
od
era
tly
sta
ine
d c
ell
s/t
ot
IEL
s
p=0.02
p=0.02
p=0.02
p=0.02
Figure 14. Immunohistochemistry of NOTCH1 in small intestine. A. Left, an example of NOTCH1 staining; Right, images converted for automated analysis (white: unstained cells, yellow/orange: low/moderately stained cells, brown: intensely stained cells). (Original magnification 40X). B. Evaluation of NOTCH1 stained/unstained cells in CD patients (6 active CD and 6 GFD patients) and in controls (n=4). Data are expressed as mean percent of intensely stained, low-moderately stained and unstained cells of the total intraepithelial cells (IECs).
A B

67
Because in CD patients, the NOTCH1 mRNA levels were high and the protein levels were down, it may suggest a regulation post-trascriptional of this receptor. Figure 15 shows an example of the results obtained for HES1. HES1 was more homogeneously distributed and expressed at a higher level in the intestinal crypts of controls than in those of active CD and GFD patients (panel A). On the right are the images converted for automated analysis. Significantly more intensely stained cells were detected in controls than in CD patients (p=0.02) and significantly less unstained cells were detected in controls than in active CD patients (p=0.03) (Figure 15B). These results indicate that HES1 is less expressed in the small intestine of CD patients respect to controls. Because HES1 is a well know target gene of NOTCH1, it is possible that NOTCH1 signaling is altered in patients affected by CD. Immunohistochemistry for β-catenin and MUC-2 Because NOTCH1 signals interact with the Wnt pathway to influence the intestinal stem cell fate, we investigated both the Wnt pathway (using β-catenin antibodies) and secretory goblet cells (using anti- MUC-2 antibodies). The Figure 16 shows a similar β-catenin expression in CD and control children, suggesting that this pathway not is altered in CD. Further, the Figure 17A and B show a statistically fewer MUC-2-stained cells in the crypts of CD patients; infact in active CD patients the goblet cells number was 18±1.6, in GFD patients was 15±3 and in controls was 35.0±7.7(mean number of cells± SD) (p=0.04). In confirmation of this data, the number of goblet cells in the villi of GFD patients and controls was 7.0±1.8 and 20.0±4.9 respectively (p=0.04).
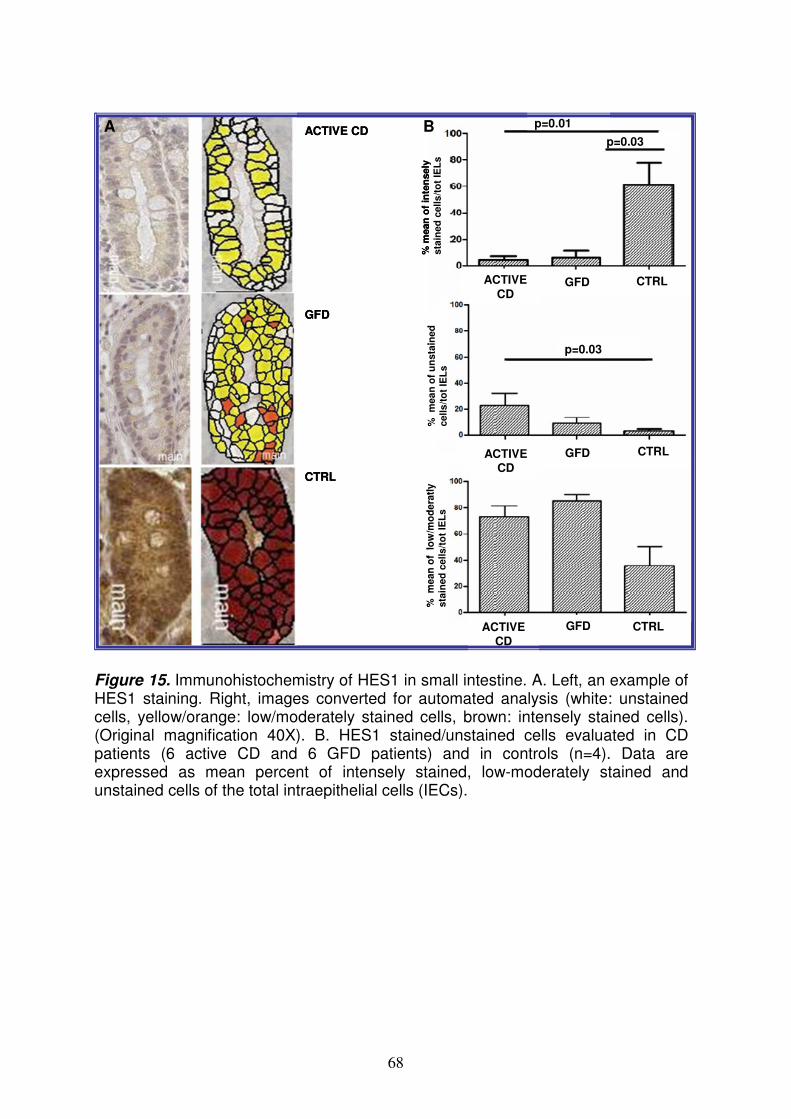
68
ACTIVE CD
GFD CTRL
ACTIVE CD
GFD CTRL
ACTIVE
CDGFD CTRL
ACTIVE CD
GFD
CTRL
p=0.01
p=0.03
p=0.03
% m
ean
of
inte
nsely
sta
ined
cells
/to
t IE
Ls
% m
ea
n o
f u
nsta
ined
cells
/to
t IE
Ls
% m
ean
of
lo
w/m
od
era
tly
sta
ined
cells/t
ot
IEL
s
ACTIVE CD
GFD CTRL
ACTIVE CD
GFD CTRL
ACTIVE
CDGFD CTRL
ACTIVE CD
GFD
CTRL
p=0.01
p=0.03
p=0.03
% m
ean
of
inte
nsely
sta
ined
cells
/to
t IE
Ls
% m
ea
n o
f u
nsta
ined
cells
/to
t IE
Ls
% m
ean
of
lo
w/m
od
era
tly
sta
ined
cells/t
ot
IEL
s
Figure 15. Immunohistochemistry of HES1 in small intestine. A. Left, an example of HES1 staining. Right, images converted for automated analysis (white: unstained cells, yellow/orange: low/moderately stained cells, brown: intensely stained cells). (Original magnification 40X). B. HES1 stained/unstained cells evaluated in CD patients (6 active CD and 6 GFD patients) and in controls (n=4). Data are expressed as mean percent of intensely stained, low-moderately stained and unstained cells of the total intraepithelial cells (IECs).
A B
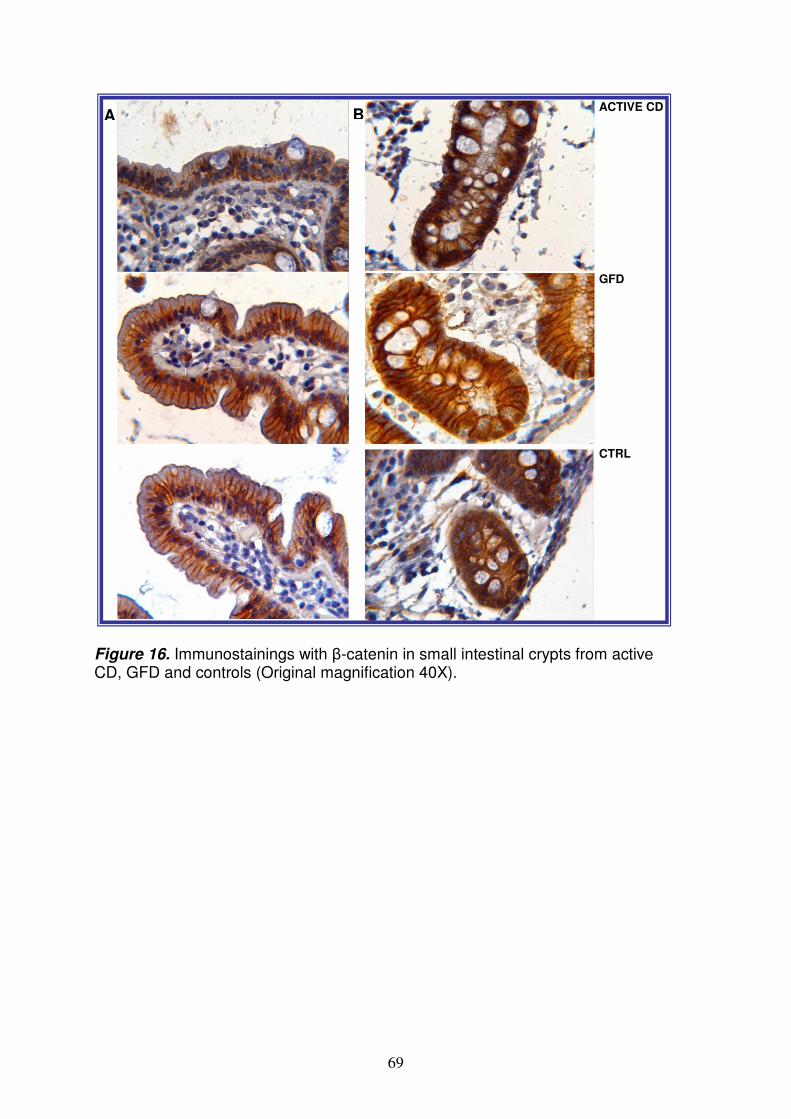
69
Figure 16. Immunostainings with β-catenin in small intestinal crypts from active CD, GFD and controls (Original magnification 40X).
A BACTIVE CD
GFD
CTRL
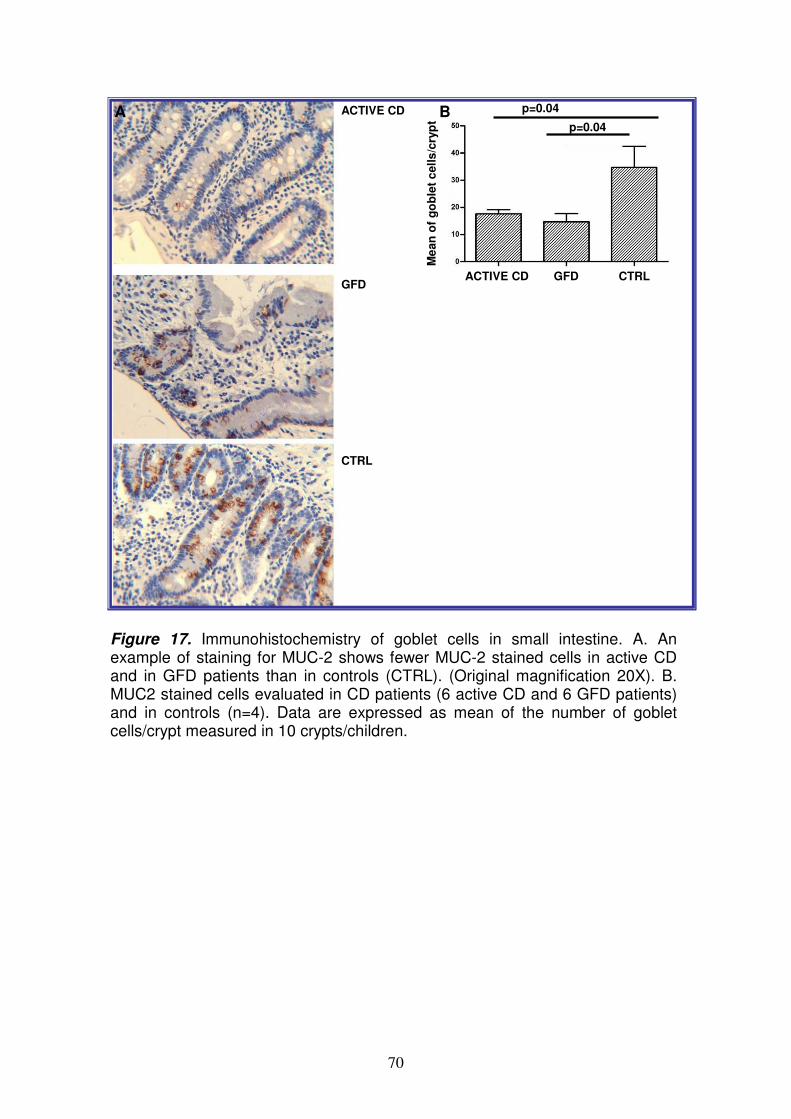
70
A BACTIVE CD
GFD
CTRL
Me
an
of
go
ble
t c
ells
/cry
pt
ACTIVE CD GFD CTRL
p=0.04
p=0.04A BACTIVE CD
GFD
CTRL
Me
an
of
go
ble
t c
ells
/cry
pt
ACTIVE CD GFD CTRL
p=0.04
p=0.04
Figure 17. Immunohistochemistry of goblet cells in small intestine. A. An example of staining for MUC-2 shows fewer MUC-2 stained cells in active CD and in GFD patients than in controls (CTRL). (Original magnification 20X). B. MUC2 stained cells evaluated in CD patients (6 active CD and 6 GFD patients) and in controls (n=4). Data are expressed as mean of the number of goblet cells/crypt measured in 10 crypts/children.
71
DISCUSSION During the last decades, several evidences suggested that microRNAs regulate basic cellular functions including proliferation, differentiation and death155; dysregulation of miRNA expression has been extensively described in a variety of diseases, including cancer, obesity, diabetes and schizophrenia; therefore, it is important to identify and validate miRNA/mRNA target pairs. This study identified for the first time, both miRNAs expression pattern in human small intestine and miRNAs differently expressed in the jejunal biopsies of CD children vs control by TLDA. Some miRNAs, such as miR-124a, miR-189, miR-299-5p and miR-379, precedently described in association with autoimmune disorders156, are downregulated in both active CD and GFD patients, suggesting that they are involved also in celiac disease, whether the disease is active or not. About 20% of miRNAs differs bethween patients and controls. A global analysis of these miRNAs, identified miR-449a as microRNA probably involved in CD pathogenesis. Infact, miR-449a has the highest level among miRNAs upregulated in active CD patients. The most obvious function of miR-449a, in analogy with miR-34, is induction of apoptosis; infact, the levels of miR-449a are reported to be lower in various tumor-derived cell lines (lung adenocarcinoma, osteosarcoma, testicular cancer, colorectal cancer) than in the respective normal human tissues, which suggests that miR-449a exerts tumor suppressor activity93,157. The bioinformatic analysis showed that, among several targets predicted for miR-449a, there were most redundant and with favourite score, genes belonging to the Notch pathway: NOTCH1, KLF-4, DLL1, LEF1 and NUMBL. Using a qRT-PCR, we confirmed that NOTCH1 and HES1 mRNA are expressed in small intestine of both CD patients and controls; in addition, we observed that these mRNAs are higher expressed in celiac small intestine than in the controls. After verifying the interaction between miR-449a, we evaluated the NOTCH1 protein in small intestinal biopsies of CD children. NOTCH1-positive cells were significantly fewer in biopsies from CD patients vs controls. Similar results were obtained with HES1, a target gene of NOTCH1158. In fact, HES1-stained cells were fewer in CD patients than in controls. Globally, these data indicate that the Notch pathway is dysregulated in CD children, irrespective of whether the disease is active or not, and that this alteration correlates with the very high miR-449a expression levels. Because NOTCH1 protein was less present in CD than in controls, but mRNA levels were similar, we speculated that this receptor could be regulated at post-trascriptional level. Data in literature showed that the Notch deactivation in intestine, leads to a complete loss of proliferating transient amplifying cells followed by their conversion into postmitotic goblet cells113; conversely its costitutive expression in the gut inhibited differentiation of crypt progenitor cells resulting in an intestine that largely consists of undifferentiated transient amplifying cells128. These complementary loss- and gain-of-function studies suggest that Notch signaling is a gatekeeper of the progenitor/stem cell compartment of the gut97. This study shows that in celiac small intestine, in association with high levels of miR-449a and with an altered NOTCH1 signals, the number of goblet cells were lower compared with controls. Ciacci et collegues, in according with these data, reported fewer goblet cells/mm2 in untreated (29.1) and in treated CD patients (42.2) than in controls (50.5), although the differences were statistically significant only in untreated patients (p<0.02)159. Conversely, in a mouse model, activation of NOTCH1 resulted in a reduction of goblet cells128. The differences between mouse and human models and the more complex effect exerted by miRNAs on many gene targets, respect to knock out a single gene, could explain these apparently contrasting

72
results. In literature it is shown that the Notch pathway plays a central role in intestinal homeostasis in cooperation with other pathways, such as Wnt signals128; moreover, experimental data obtained in double transgenic mice indicated that the effect of Notch activation on goblet cell differentiation is independent of Wnt signals128. The Wnt pathway in the small intestine of our CD patients, evaluated through β-catenin, did not differ from that of control children. This result is in agreement with the western blot data obtained by Ciccocioppo160 and by Juuti-Uusitalo161. However, the nuclear localization of β-catenin that is more evident in the small intestinal crypts from our active CD and GFD patients than in controls is a sign of activation of the Wnt pathway, in agreement with a previous report. In addition, it is interesting to note that besides NOTCH1, KLF-4 is also a target gene of miR-449a. KLF-4 has been reported to be a master regulator of goblet cell differentiation in the colon126. In fact, in KFL-4-/- mice, goblet cells were depleted by 90% in the colon, and the expression of MUC-2 was patchy throughout the colonic epithelium, indicating that KLF-4 is required for correct goblet cell maturation162. Given KLF-4’s regulation of goblet cell differentiation in the colon126, it is possible speculate that also in small intestine KLF-4 inhibition, by upregulated miR-449a, could thereby contribute to the depletion of goblet cells observed in our CD patients. Obviously, further experiments are necessary to verify this hypothesis. In conclusion, the maintenance of a correct number of functional goblet cells is required for the homeostasis of the intestinal mucosal environment, and deficiencies in the mucin composition renders the mucosa more susceptible to damaging agents in the lumen162-164. In fact, loss of goblet cell function leads to spontaneous colitis in mice165 and an altered mucous layer, increased rod-shaped bacteria and INF-γ mRNA levels were found in intestine from CD patients166. These findings globally, indicate that the small intestinal epithelium of CD patients is different from that of controls subjects. Infact, as it is well known, the active celiac disease is characterized by an inversion of the differentiation/proliferation program of the intestine with a reduction in the differentiated compartment, up to complete villi atrophy, and an increase of proliferative compartment, with crypt hyperplasia167,161. Furthermore, although GFD intestinal mucosa is characterized by an apparently normal mucosal architecture, it can also be associated with increased crypt cell proliferation (Barone M.V. et al., personal communication). Interestingly, in our study the number of goblet cells was significantly lower in the two CD groups than in control children. Based on these experimental data, we suggest that the altered mucus layer observed in our CD children could derange the protective function of the mucosal barrier that interfaces with the environment, thereby resulting in the altered permeability that has been reported in treated and untreated CD patients164,168. This alteration is not related to inflammation; in fact, it occurred in both the active CD and GFD patients. In conclusion, we investigated miRNA expression in celiac small intestine and detected very high miR-449a expression levels in both active CD and GFD patients. This finding could represent an epigenetic mechanism of gene regulation that is associated with a reduced NOTCH1 pathway and with decrease of differentiation of intestinal cells towards the secretory goblet cell lineage.

73
BIBLIOGRAPHY
1. Dubé C, Rostom A, Sy R et al. The prevalence of celiac disease in average-risk and at-risk western European populations: a systematic review. Gastroenterology 2005,128(Suppl.1)S57-S67.
2. Bonamico M, Ferri M, Nenna R et al. Tissue Transglutaminase autoantibody detection in human saliva: a powerful method for celiac disease screening. The Journal of Pediatrics 2004:632-636.
3. Di Sabatino A, Corazza GR. Coeliac disease. The Lancet 2009,373:1480-1493.
4. Meloni A, Mandas C, Desire´Jores R et al. Prevalence of Autoimmune Thyroiditis in Children with Celiac Disease and Effect of Gluten Withdrawal. The Journal of Pediatrics 2009,155:51-55.
5. George EK, Mearin ML, Bouquet J et al. High frequency of celiac disease in Down Syndrome. The JournaI of Pediatrics 1996:555-557.
6. Barton SH, Murray JA. Celiac Disease and Autoimmunity in the Gut and Elsewhere. Gastroenterol Clin N Am 2008,37:411-428.
7. Gasbarrini G, Miele L, Corazza GR et al. When Was Celiac Disease Born? The Italian Case From the Archeologic Site of Cosa. J Clin Gastroenterol 2010,44(7):502-503.
8. Catassi C and Fasano A. Celiac Disease Diagnosis: Simple Rules Are Better Than Complicated Algorithms. The American Journal of Medicine 2010,123(8):691-693.
9. Hill ID, Dirks MH, Liptak GS, et al. Guideline for the diagnosis and treatment of celiac disease in children: recommendations of the North American Society for Pediatric Gastroenterology, Hepatology and Nutrition. J Pediatr Gastroenterol Nutr 2005,40(1):1-19.
10. [No authors listed] Revised criteria for diagnosis of coeliac disease. Archives of Disease in Childhood 1990,65:909-911.
11. Rostami K, Kerckhaert J, Tiemessen R et al. Sensitivity of antiendomysium and antigliadin antibodies in untreated celiac disease: disappointing in clinical practice. Am J Gastroenterol 1999,94(4):888-94.
12. Schuppan D, Junker Y, Barisani D. Celiac disease: from pathogenesis to novel therapies. Gastroenterology 2009,137(6):1912-33.
13. P.G. Hill and G.K. Holmes. Coeliac disease: a biopsy is not always necessary for diagnosis. Aliment Pharmacol Ther 2008,27:572-577.
14. Volta U, Granito A, Parisi C et al. Deamidated gliadin peptide antibodies as a routine test for celiac disease: a prospective analysis. Clin Gastroenterol 2010,44(3):186-190.
15. Cataldo F, Marino V, Ventura A et al. Prevalence and clinical features of selective immunoglobulin A deficiency in coeliac disease: an Italian multicentre study. Gut 1998,42:362-365.
16. Cataldo F, Marino V, Bottaio G et al. Celiac disease and selective immunoglobulin A deficiency. The Journal of Pediatrics 1997;131(2):306-308.
17. Shan L, Molberg Ø, Parrot I. Structural basis for gluten intolerance in celiac sprue. Science 2002,297(5590):2275-2279.
18. Mamone G, Ferranti P, Rossi M et al. Identification of a peptide from alpha-gliadin resistant to digestive enzymes: implications for celiac

74
disease. J Chromatogr B Analyt Technol Biomed Life Sci 2007,855(2):236-241.
19. Guandalini S and Setty M. Celiac disease. Curr Opin Gastroenterol 2008,4(6):707-712.
20. Anderson RP, Degano P, Godkin AJ et al. In vivo antigen challenge in celiac disease identifies a single transglutaminase-modified peptide as the dominant A-gliadin T-cell epitope. Nat Med 2000,3:337-342.
21. Fasano A. and Schulzke JD. The Role of the Intestinal Barrier Function in the Pathogenesis of Celiac Disease. Pediatr Adolesc Med 2008;12:89-98.
22. Lammers KM, Lu R, Brownley J et al. Gliadin Induces an Increase in Intestinal Permeability and Zonulin Release by Binding to the Chemokine Receptor CXCR3. Gastroenterology 2008,135:194-204.
23. Wapenaar MC, Monsuur AJ, Van Bodegraven AA et al. Associations with tight junction genes PARD3 and MAGI2 in Dutch patients point to a common barrier defect for coeliac disease and ulcerative colitis. Gut 2008,57(4):463-467.
24. Agostani C, Decsi T, Fewtrell M et al. Complementary Feeding: A Commentary by the ESPGHAN Committee on Nutrition Journal of Pediatric Gastroenterology and Nutrition 2008,46:99-110.
25. Penttila IA. Milk-Derived Transforming Growth Factor-b and the Infant Immune Response. The Journal of Pediatrics 2010,156(2):Suppl1:S21-S25.
26. Norris JM, Barriga K, Hoffenberg EJ et al. Risk of Celiac Disease Autoimmunity and Timing of Gluten Introduction in the Diet of Infants at Increased Risk of Disease. JAMA 2005,293(19):2343-2351.
27. Kondrashova A, Mustalahti K, Kaukinen K et al. Lower economic status and inferior hygienic environment may protect against celiac disease. Ann Med 2008,40(3):223-231.
28. Stene LC, Honeyman MC, Hoffenberg EJ et al. Rotavirus infection frequency and risk of celiac disease autoimmunity in early childhood: a longitudinal study. Am J Gastroenterol 2006,101(10):2333-2340.
29. Pinier M, Fuhrmann G, Verdu E et al. Prevention Measures and Exploratory Pharmacological Treatments of Celiac Disease. Am J Gastroenterol 2010:1-11.
30. D'Arienzo R, Maurano F, Lavermicocca P et al. Modulation of the immune response by probiotic strains in a mouse model of gluten sensitivity. Cytokine 2009,48(3):254-259.
31. Greco L, Babron MC, Corazza GR et al. Existence of a genetic risk factor on chromosome 5q in Italian coeliac disease families. Ann Hum Genet 2001,65:35-41.
32. Meresse B, Ripoche J, Heyman M et al. Celiac disease: from oral tolerance to intestinal inflammation, autoimmunity and Lymphomagenesis. Nature 2009,2:8-23.
33. Megiorni F, Mora B, Bonamico M. et al. HLA-DQ and Susceptibility to Celiac Disease: Evidence for Gender Differences and Parent-of-Origin Effects. American Journal of Gastroenterology 2008:997-1003.
34. Sollid LM, Markussen G, Ek J et al. Evidence for a primary association of celiac disease to a particular HLA-DQ alpha/beta heterodimer. J. Exp. Med 1989,169:345-350.
75
35. Fallang LE, Bergseng E, Hotta K et al. Differences in the risk of celiac disease associated with HLA-DQ2.5 or HLA-DQ2.2 are related to sustained gluten antigen presentation. Nature Immunology 2009,10:1096-1102.
36. Vader W, Stepniak D, Kooy Y et al. The HLA-DQ2 gene dose effect in celiac disease is directly related to the magnitude and breadth of gluten-specific T cell responses. Proc Natl Acad Sci USA 2003,100(21).
37. Margaritte-Jeannin P, Babron MC, Bourgey M et al. HLA-DQ relative risks for coeliac disease in European populations: a study of the European Genetics Cluster on Coeliac Disease. Tissue Antigens 2004,63:562-567.
38. Bourgey M, Calcagno G, Tinto N et al. HLA related genetic risk for coeliac disease. Gut 2007,56:1054-1059.
39. Dubois PC, Trynka G, Franke L et al. Multiple common variants for celiac disease influencing immune gene expression. Nature Genetics 2010,42:295-302.
40. Van Heel DA, Franke L, Hunt KA et al. A genome-wide association study for celiac disease identifies risk variants in the region harboring IL2 and IL21. Nature Genetics 2007,39:827-829.
41. Romanos J, Barisani D, Trynka G et al. Six new coeliac disease loci replicated in an Italian population confirm association with coeliac disease. J Med Genet 2009,46(1):60-63.
42. Trynka G, Zhernakova A, Romanos J et al. Coeliac disease-associated risk variants in TNFAIP3 and REL implicate altered NF- k B signaling. Gut 2009,58:1078-1083 .
43. Tack G J, Verbeek WHM, Schreurs MWJ et al. The spectrum of celiac disease: epidemiology, clinical aspects and treatment. Nature 2010,7:204-213.
44. Holopainen P, Naluai AT, Moodie S et al. Candidate gene region 2q33 in European families with coeliac disease. Tissue Antigens 2004,3:212-222.
45. Hunt KA, Zhernakova A, Graham T et al. Newly identified genetic risk variants for celiac disease related to the immune response. Nature Genetics 2008,40:395-402.
46. Van Belzen MJ, Meijer JW, Sandkuijl LA et al. A major non-HLA locus in celiac disease maps to chromosome 19. Gastroenterology 2003,125(4):1032-1041.
47. Tinto N, Ciacci C, Calcagno G et al. Increased prevalence of celiac disease without gastrointestinal symptoms in adults MICA 5.1 homozygous subjects from the Campania area. Dig Liver Dis 2008,40(4):248-252.
48. Martin S. Against the grain: An overview of celiac disease. Journal of the American Academy of Nurse Practitioners 2008,20:243–250.
49. Tjon JM-L, Van Bergen J, Koning F. Celiac disease: how complicated can it get?. Immunogenetics 2010,62:641-651.
50. Przemioslo RT, Kontakou M, Nobili V et al. Raised pro-inflammatory cytokines interleukin 6 and tumour necrosis factor alpha in coeliac disease mucosa detected by immunohistochemistry. Gut 1994,35(10):1398-1403.
76
51. Kontakou M, Przemioslo RT, Sturgess RP et al. Expression of tumour necrosis factor-alpha, interleukin-6, and interleukin-2 mRNA in the jejunum of patients with coeliac disease. Scand J Gastroenterol 1995,30(5):456-463.
52. Benahmed M, Meresse B, Arnulf B et al. Inhibition of TGF-beta signaling by IL-15: a new role for IL-15 in the loss of immune homeostasis in celiac disease. Gastroenterology 2007,132(3):994-1008.
53. Selimog˘lu MA, Karabiber H. Celiac Disease Prevention and Treatment. J Clin Gastroenterology 2010,44(1).
54. Ludvigsson JF, Reutfors J, Ösby U et al. Coeliac disease and risk of mood disorders-A general population-based cohort study. Journal of Affective Disorders 2007,99:117-126.
55. Lerner A. New therapeutic strategies for celiac disease. Autoimmun. Rev.2010,9:144-147.
56. Sollid LM and Khosla C. Future therapeutic options for celiac disease. Nature Clinical Practice Gastroenterology & hepatology 2005,2(3):140-147.
57. Di Cagno R, de Angelis M, Alfonsi G et al. Pasta made from durum wheat semolina fermented with selected lactobacilli as a tool for a potential decrease of the gluten intolerance. J Agric Food Chem 2005,53:4393-4402.
58. Lindfors K, Blomqvist T, Juuti-Uusitalo K et al. Live probiotic Bifidobacterium lactis bacteria inhibit the toxic effects induced by wheat gliadin in epithelial cell culture. Clinical and Experimental Immunology 2008,152:552-558.
59. Di Cagno R, De Angelis M, Auricchio S et al. Sourdough Bread Made from Wheat and Nontoxic Flours and Started with Selected Lactobacilli Is Tolerated in Celiac Sprue Patients. Applied and environmental microbiology 2004,70(2):1088-1096.
60. De Angelis M, Rizzello CG, Fasano A et al. VSL#3 probiotic preparation has the capacity to hydrolyze gliadin polypeptides responsible for Celiac Sprue. Biochim Biophys Acta 2006,1762:80-93.
61. Paterson BM, Lammers KM, Arrieta MC et al. The safety, tolerance, pharmacokinetic and pharmacodynamic effects of single doses of AT- 1001 in coeliac disease subjects: a proof of concept study. Aliment Pharmacol Ther 2007,26:757-766.
62. Anderson RP. Coeliac disease: current approach and future prospects. Internal Medicine Journal 2008,38:790-799.
63. Lee RC, Feinbaum RL, Ambros V. The C. elegans heterochronic gene lin-4 encodes small RNAs with antisense complementarity to lin-14. Cell 1993,75(5):843-854.
64. Fabian MR, Sonenberg N and Filipowicz W. Regulation of mRNA Translation and Stability by microRNAs. Annu. Rev. Biochem. 2010,79:351-379.
65. Krol J, Loedige I and Filipowicz W. The widespread regulation of microRNA biogenesis, function and decay. Nature Review Genetics 2010,11:597-610.
66. Bartel DP. MicroRNAs: target recognition and regulatory functions. Cell 2009,23,136(2):215-233.

77
67. Hammell CM. The microRNA-argonaute complex: a platform for mRNA modulation. RNA Biol 2008,5(3):123-127.
68. Liu J, Carmell MA, Rivas FV et al. Argonaute2 Is the Catalytic Engine of Mammalian RNAi. Science 2004,305:1437-1444.
69. Song JJ, Smith SK, Hannon GJ et al. Crystal Structure of Argonaute and Its Implications for RISC Slicer Activity. Science 2004,305:1434-1437.
70. Bossè GD, Simard MJ. A new twist in the microRNA pathway: Not Dicer but Argonaute is required for a microRNA production. Cell Research 2010,20:735-737.
71. Chekulaeva M, Filipowicz W. Mechanisms of miRNA-mediated post-transcriptional regulation in animal cells. Curr Opin Cell Biol 200,21(3):452-460.
72. Rehwinkel J, Behm-Ansmant I, Gatfield D et al. A crucial role for GW182 and the DCP1:DCP2 decapping complex in miRNA-mediated gene silencing. RNA 2005,11:1530-1544.
73. Chu CY, Rana TM. Small RNAs: regulators and guardians of the genome. J Cell Physiol 2007,213(2):412-419.
74. Wang B, Love TM, Call ME et al. Recapitulation of short RNA-directed translational gene silencing in vitro. Mol Cell 2006,19;22(4):553-560.
75. Pillai RS, Bhattacharyya SN, Artus CG et al. Inhibition of translational initiation by Let-7 MicroRNA in human cells. Science 2005,2;309(5740):1573-1576.
76. Bagga S, Bracht J, Hunter S et al. Regulation by let-7 and lin-4 miRNAs results in target mRNA degradation. Cell 2005,122(4):553-563.
77. Gibbings DJ, Ciaudo C, Erhardt M et al. Multivesicular bodies associate with components of miRNA effector complexes and modulate miRNA activity. Nat Cell Biol 2009,11(9):1143-1149.
78. Griffiths-Jones S, Saini HK, Van Dongen S et al. miRBase: tools for microRNA genomics. Nucleic Acids Res 2008,36:D154-D158.
79. Starega-Roslan J, Krol J, Koscianska E et al. Structural basis of microRNA length variety. Nucleic Acids Research 2010:1-12.
80. Grimson A, Farh KK, Johnston WK et al. MicroRNA targeting specificity in mammals: determinants beyond seed pairing. Mol Cell 2007,27(1):91-105.
81. Doench JG, Sharp PA. Specificity of microRNA target selection in translational repression. Genes Dev 2004,18(5):504-511.
82. Du T, Zamore PD. Beginning to understand microRNA function. Cell Research 2007,17:661-663.
83. Vasudevan S, Tong Y, Steitz JA. Switching from repression to activation: microRNAs can up-regulate translation. Science 2007,318(5858):1931-1934.
84. Ørom UA, Nielsen FC, Lund AH. MicroRNA-10a binds the 5'UTR of ribosomal protein mRNAs and enhances their translation. Mol Cell 2008,30(4):460-471.
85. McKenna LB, Schug J, Vourekas A et al. MicroRNAs Control Intestinal Epithelial Differentiation, Architecture, and Barrier Function. Gastroenterology 2010,139(5):1654-1664.

78
86. Wu F, Zikusoka M, Trindade A et al. MicroRNAs Are Differentially Expressed in Ulcerative Colitis and Alter Expression of Macrophage Inflammatory Peptide-2α. Gastroenterology 2008,135:1624-1635.
87. Chassin C, Kocur M, Pott J et al. miR-146a Mediates Protective Innate Immune Tolerance in the Neonate Intestine. Cell Host Microbe 2010,8(4):358-368.
88. Zhou QQ, Souba WW, Croce CM et al. MicroRNA-29a regulates intestinal membrane permeability in patients with irritable bowel syndrome. Gut 2010,59:775-784.
89. O’Hara SP, Mott JL, Splinter PL et al. MicroRNAs: Key Modulators of Posttranscriptional Gene Expression. Gastroenterology 2009,136:17-25.
90. Noonan EJ, Place RF, Pookot D et al. miR-449a targets HDAC-1 and induces growth arrest in prostate cancer. Oncogene 2009,28(14):1714-1724.
91. Gutie´rrez NC, Sarasquete ME, Misiewicz-Krzeminska I et al. Deregulation of microRNA expression in the different genetic subtypes of multiple myeloma and correlation with gene expression profiling. Leucemia 2010,24:629-637.
92. Iliopoulos D, Bimpaki EI, Nesterova M et al. MicroRNA signature of primary pigmented nodular adrenocortical disease: clinical correlations and regulation of Wnt signaling. Cancer Res 2009,69(8):3278-3282.
93. Lizé M, Pilarski S, Dobbelstein M. E2F1-inducible microRNA 449a/b suppresses cell proliferation and promotes apoptosis. Cell Death and Differentiation 2009,17:452-458.
94. Yang X, Feng M, Jiang X et al. miR-449a and miR-449b are direct transcriptional targets of E2F1 and negatively regulate pRb-E2F1 activity through a feedback loop by targeting CDK6 and CDC25A. Genes Dev 2009,23(20):2388-2393.
95. Feng M and Yu Q. miR-449 regulates CDK-Rb-E2F1 through an auto-regulatory feedback circuit. Cell Cycle 2010,2:213-214.
96. Lizé M, Herr C, Klimke A et al. microRNA-449a levels increase by several orders of magnitude during mucociliary differentiation of airway epithelia. Cell Cycle 2010,9(22).
97. Radtke F, Clevers H and Riccio O. From Gut Homeostasis to Cancer. Current Molecular Medicine 2006,6:275-289.
98. Porter EM, Bevins CL, Ghosh D et al. The multifaceted Paneth cell. Cell Mol Life Sci 2002,59(1):156-70.
99. Li L, Clevers H. Coexistence of quiescent and active adult stem cells in mammals. Science 2010,327(5965):542-545.
100. Shaker A and Rubin CD. Intestinal stem cells and epithelial-mesenchymal interactions in the crypt and stem cell niche. Translational Research 2010,56(3):180-187.
101. Ishizuya-Oka A and Hasebe T. Sonic Hedgehog and Bone Morphogenetic Protein-4 Signaling Pathway Involved in Epithelial Cell Renewal along the Radial Axis of the Intestine. Digestion 2008,77(suppl 1):42-47.
102. Crosnier C, Stamataki D and Lewis J. Organizing cell renewal in the intestine: stem cells, signals and combinatorial control. Nature Review Genetics 2006,6:349-359.
79
103. Rao TP and Ku¨hl M. An Updated Overview on Wnt Signaling Pathways. A Prelude for More. Circulation Research 2010:1798-1806.
104. Bhanot P, Brink M, Samos CH et al. A new member of the frizzled family from Drosophila functions as a Wingless receptor. Nature 1996,382(6588):225-230.
105. Nakamura T, Tsuchiya K, Watanabe M. Crosstalk between Wnt and Notch signaling in intestinal epithelial cell fate decision. J Gastroenterol 2007,42(9):705-710.
106. Van de Wetering M, Sancho E, Verweij C et al. The beta-catenin/TCF-4 complex imposes a crypt progenitor phenotype on colorectal cancer cells. Cell 2002,111:241-250.
107. Gregorieff A, Pinto D, Begthel H et al. Expression Pattern of Wnt Signaling Components in the Adult Intestine. Gastroenterology 2005,129;2:626-638.
108. Korinek V, Barker N, Moerer P et al. Depletion of epithelial stem-cell compartments in the small intestine of mice lacking Tcf-4. Nat Genet 1998,19:379-383.
109. Kuhnert F, Davis CR, Wang HT et al. Essential requirement for Wnt signaling in proliferation of adult small intestine and colon revealed by adenoviral expression of Dickkopf-1. Proc Natl Acad Sci USA 2004,101:266-271.
110. Pinto D, Gregorieff A, Begthel H et al. Canonical Wnt signals are essential for homeostasis of the intestinal epithelium. Genes Dev 2003,17:1709-1713.
111. Van Es JH, Clevers H. Notch and Wnt inhibitors as potential new drugs for intestinal neoplastic disease. Trends Mol Med 2005,11(11):496-502.
112. Batlle E, Bacani J, Begthel H et al. EphB receptor activity suppresses colorectal cancer progression. Nature 2005,435(7045):1126-1130.
113. Van Es JH, Jay P, Gregorieff A et al. Wnt signalling induces maturation of Paneth cells in intestinal crypts. Nat Cell Biol 2005,7(4):381-386.
114. Veeman MT, Axelrod JD, Moon RT. A second canon. Functions and mechanisms of beta-catenin-independent Wnt signaling. Dev Cell 2003,5:367-377.
115. Takeuchi H. and Haltiwanger R.S. et al. Role of glycosylation of Notch in development. Seminars in Cell & Developmental Biology 2010;21:638-645.
116. Kopan R and Ilagan MXG. The Canonical Notch Signaling Pathway: Unfolding the Activation Mechanism. Cell 2009;137:216-233.
117. Vodovar N, Schweisguth F. Functions of O-fucosyltransferase in Notch trafficking and signaling: towards the end of a controversy? J Biol 2008,7(2):7.
118. Jinek M, Chen YW, Clausen H et al. Structural insights into the Notch-modifying glycosyltransferase Fringe Nat Struct Mol Biol 2006,13(10):945-946.
119. Panin VM, Shao L, Lei L et al. Notch ligands are substrates for protein O-fucosyltransferase-1 and Fringe. J Biol Chem 2002,277(33):29945-29952.
120. Jensen J, Pedersen EE, Galante P et al. Control of endodermal endocrine development by Hes-1. Nat Genet 2000,24(1):36-44.
80
121. Yang Q, Bermingham NA, Finegold MJ et al. Requirement of Math1 for secretory cell lineage commitment in the mouse intestine. Science 2001,294(5549):2155-2158.
122. Guilmeau S, Flandez M, Bancroft L et al. Intestinal deletion of Pofut1 in the mouse inactivates notch signaling and causes enterocolitis. Gastroenterology 2008,135(3):849-860.
123. Shroyer NF, Helmrath MA, Wang VY et al. Intestine-specific ablation of mouse atonal homolog 1 (Math1) reveals a role in cellular homeostasis. Gastroenterology 2007,132(7):2478-2488.
124. Schonhoff SE, Giel-Moloney M, Leiter AB. Minireview: Development and differentiation of gut endocrine cells. Endocrinology 2004,145(6):2639-2644.
125. Jenny M, Uhl C, Roche C et al. Neurogenin3 is differentially required for endocrine cell fate specification in the intestinal and gastric epithelium. EMBO J 2002,21(23):6338-6347.
126. Katz JP, Perreault N, Goldstein BG et al. The zinc-finger transcription factor Klf4 is required for terminal differentiation of goblet cells in the colon. Development 2002,129:2619-2628.
127. Shroyer NF, Wallis D, Venken KJ et al. Gfi1 functions downstream of Math1 to control intestinal secretory cell subtype allocation and differentiation. Genes Dev 2005,19(20):2412-2417.
128. Fre S, Huyghe M, Mourikis P et al. Notch signals control the fate of immature progenitor cells in the intestine. Nature 2005,435(7044):964-968.
129. Wong GT, Manfra D, Poulet FM et al. Chronic treatment with the gamma-secretase inhibitor LY-411,575 inhibits beta-amyloid peptide production and alters lymphopoiesis and intestinal cell differentiation. J Biol Chem 2004,279(13):12876-12882.
130. Milano J, McKay J, Dagenais C et al. Modulation of notch processing by gamma-secretase inhibitors causes intestinal goblet cell metaplasia and induction of genes known to specify gut secretory lineage differentiation. Toxicol Sci 2004,82(1):341-358.
131. Miyazono K, Kamiya Y, Morikawa M. Bone morphogenetic protein receptors and signal transduction. J Biochem 2010,147(1):35-51.
132. Blobe GC, Schiemann WP, Lodish HF. Role of transforming growth factor beta in human disease. N Engl J Med 2000,342(18):1350-1358.
133. Nakao A, Imamura T, Souchelnytskyi S et al. TGF-b receptor-mediated signalling through Smad2, Smad3 and Smad4. The EMBO Journal 1997,16(17):5353-5362.
134. Haramis AP, Begthel H, Van den Born M et al. De novo crypt formation and juvenile polyposis on BMP inhibition in mouse intestine. Science 2004,303(5664):1684-1686.
135. He XC, Zhang J, Tong WG et al. BMP signaling inhibits intestinal stem cell self-renewal through suppression of Wnt–β-catenin signaling. 2004 Nature Genetics,36:1117-1121.
136. Crosnier C, Stamataki D and Lewis J. Organizing cell renewal in the intestine: stem cells, signals and combinatorial control. Nature Review Genetics 2006,346(7):349-359.
81
137. Van Den Brink GR. Hedgehog Signaling in Development and Homeostasis of the Gastrointestinal Tract. Physiol Rev 2007,87:1343-1375.
138. Van Dop WA, Uhmann A, Wijgerde M et al. Depletion of the Colonic Epithelial Precursor Cell Compartment Upon Conditional Activation of the Hedgehog Pathway. Gastroenterology 2009,136:2195-2203.
139. Lees C, Howie S, Sartor BR et al. The Hedgehog Signalling Pathway in the Gastrointestinal Tract: Implications for Development, Homeostasis, and Disease. Gastroenterology 2005,129:1696-1710.
140. Madison BB, Braunstein K, Kuizon E, et al. Epithelial hedgehog signals pattern the intestinal crypt-villus axis. Development 2005,132(2):279-289.
141. Stover PJ, Caudill MA. Genetic and epigenetic contributions to human nutrition and health: managing genome-diet interactions. J Am Diet Assoc 2008,108(9):1480-1487.
142. Afonina E, Neumann M, Pavlakis GN. Preferential binding of poly(A)-binding protein 1 to an inhibitory RNA element in the human immunodeficiency virus type 1 gag mRNA. J Biol Chem 1997,272(4):2307-2311.
143. Watanabe Y, Tomita M, Kanai A. Computational Methods for MicroRNA Target Prediction. Methods in Enzymology 2007,427:65-86.
144. Didiano D, Hobert O. Perfect seed pairing is not a generally reliable predictor for miRNA-target interactions. Nat Struct Mol Biol 2006,13(9):849-851.
145. Orchel A, Molin I, Dzierzewicz Z et al. Quantification of p21 gene expression in Caco-2 cells treated with sodium butyrate using real-time reverse transcription-PCR (RT-PCR) assay. Acta Pol Pharm 2003,60(2):103-105.
146. Smith JL, Rangaraj K, Simpson R et al. Quantitative analysis of the expression of ACAT genes in human tissues by real-time PCR. J Lipid Res 2004,45(4):686-696.
147. Kim AH, Reimers M, Maher B et al. MicroRNA expression profiling in the prefrontal cortex of individuals affected with schizophrenia and bipolar disorders. Schizophr Res 2010.
148. Cucci A, Barbero P, Clerico M et al Pro-inflammatory cytokine and chemokine mRNA blood level in multiple sclerosis is related to treatment response and interferon-beta dose. J Neuroimmunol 2010,226(1-2):150-157.
149. Satih S, Savinel H, Rabiau N et al. Expression analyses of nuclear receptor genes in breast cancer cell lines exposed to soy phytoestrogens after BRCA2 knockdown by TaqMan Low-Density Array (TLDA). Journal of Molecular Signaling 2009,4:3.
150. Nakamachi Y, Kawano S, Takenokuchi M et al. MicroRNA-124a is a key regulator of proliferation and monocyte chemoattractant protein 1 secretion in fibroblast-like synoviocytes from patients with rheumatoid arthritis. Arthritis Rheum 2009,60(5):1294-1304.
151. Dai Y, Huang YS, Tang M et al. Microarray analysis of microRNA expression in peripheral blood cells of systemic lupus erythematosus patients. Lupus 2007,16(12):939-946.
82
152. Padgett KA, Lan RY, Leung PC et al. Primary biliary cirrhosis is associated with altered hepatic microRNA expression. J Autoimmun 2009,32(3-4):246-253.
153. Chen C, Ridzon DA, Broomer AJ et al. Real-time quantification of microRNAs by stem-loop RT-PCR. Nucleic Acids Res 2005,33(20).
154. Rajewsky N. microRNA target predictions in animals. Nat Genet 2006;38 Suppl:S8-S13.
155. H-W Hwang and JT Mendell. MicroRNAs in cell proliferation, cell death, and tumorigenesis. British Journal of Cancer 2006,94:776-780.
156. Iborra M, Bernuzzi F, Invernizzi P et al. MicroRNAs in autoimmunity and inflammatory bowel disease: Crucial regulators in immune response. Autoimmun Rev 2010.
157. Noonan EJ, Place RF, Pookot D et al. miR-449a targets HDAC-1 and induces growth arrest in prostate cancer. Oncogene 2009,28(14):1714-1724.
158. Yin L, Velazquez OC, Liu ZJ. Notch signaling: emerging molecular targets for cancer therapy. Biochem Pharmacol 2010,80(5):690-701.
159. Ciacci C, Di Vizio D, Seth R et al. Selective reduction of intestinal trefoil factor in untreated coeliac disease. Clin Exp Immunol 2002,130:526-531.
160. Ciccocioppo R, Finamore A, Ara C et al. Altered Expression, Localization, and Phosphorylation of Epithelial Junctional Proteins in Celiac Disease. Am J Clin Pathol 2006,125:502-511.
161. Juuti-Uusitalo K, Mäki M, Kainulainen H et al. Gluten affects epithelial differentiation-associated genes in small intestinal mucosa of coeliac patients. Clin Exp Immunol 2007,150(2):294-305.
162. McConnell BB, Ghaleb AM, Nandan MO et al. The diverse functions of Krüppel-like factors 4 and 5 in epithelial biology and pathobiology. Bioessays 2007,29(6):549-557.
163. Corfield AP, Myerscough N, Longman R et al. Mucins and mucosal protection in the gastrointestinal tract: new prospects for mucins in the pathology of gastrointestinal disease. Gut 2000,47(4):589-594.
164. Festen EAM, Szperl AM, Weersma RK et al. Inflammatory bowel disease and celiac disease: overlaps in the pathology and genetics, and their potential drug targets. Endocr Metab Immune Disord Drug Targets 2009,9(2):199-218.
165. Van der Sluis M, De Koning BA, De Bruijn AC et al. Muc2-deficient mice spontaneously develop colitis, indicating that MUC2 is critical for colonic protection. Gastroenterology 2006,131(1):117-129.
166. Forsberg G, Fahlgren A, Hörstedt P et al. Presence of bacteria and innate immunity of intestinal epithelium in childhood celiac disease. Am J Gastroenterol 2004,99(5):894-904.
167. Marsh MN.Gluten, major histocompatibility complex, and the small intestine. A molecular and immunobiologic approach to the spectrum of gluten sensitivity ('celiac sprue'). Gastroenterology 1992,102(1):330-354.
168. Greco L, D'Adamo G, Truscelli A et al. Intestinal permeability after single dose gluten challenge in coeliac disease. Arch Dis Child 1991,66(7):870-872.
83
LIST OF ORAL COMUNICATIONS AND POSTERS - M. Capuano, C. Garcia-Herrero, N. Tinto, V. Capobianco, A. Franzese, M.A.
Navas, L. Sacchetti. “ Caratterizzazione funzionale di mutazioni nel gene GCK associate al MODY2, identificate in pazienti della regione Campania”. Roma, Italia, 5-8/10/2010.
- L. Sacchetti, M. Capuano “La malattia celiaca: diagnostica molecolare”- Congresso di Microbiologia Molecolare-Napoli, Italia, 11/09/2010.
- L. Sacchetti, M. Capuano, N. Tinto. “Le nuove frontiere del Laboratorio al servizio del paziente/cliente diabetico” 13/02/2010, Bari.
- M. Capuano, N. Tinto, V. Capobianco, L. Sacchetti “Genetic of celiac disease”- Retreat del Dipartimento di Biochimica e Biotecnologie Mediche, Università di Napoli Federico II 2008-Napoli, Italia, 4-5 aprile 2008
- N. Tinto, M. Capuano, V. Capobianco, L. Sacchetti “Identification and functional characterization of GCK mutations in diabetic children from Campania region” – Retreat del Dipartimento di Biochimica e Biotecnologie Mediche, Università di Napoli Federico II –2008- Napoli, Italia, 4-5 aprile 2008
- N.Tinto, A. Zagari, M. Capuano, A. De Simone, V. Capobianco, G. Daniele, M. Giugliano, R. Spadaro, A. Franzese L.Sacchetti. “Glucokinase gene mutations in MODY2 patients from South Italy” (11 CFU) - 39° Congresso Nazionale SIBIOC 2007-Rimini,Italia, 2-4 Ottobre 2007.
- R. Di Giaimo, M. Capuano, R. del Gaudio, G. Geraci “CpG methylation and angiogenin gene expression during CaCO-2 cell differentiation”- SIB 2007-Riccione, Italia,26-28 Settembre 2007(relazionato al congresso).
- N.Tinto, A. Zagari, M. Capuano, A. De Simone, V. Capobianco, G. Daniele, M. Giugliano, R. Spadaro, A. Franzese L.Sacchetti. “Analisi del gene glucochinasi in pazienti del sud Italia con sospetto MODY”- XIII Giornate scientifiche 2007- Napoli, Italia 20-21 settembre 2007.
PUBLICATIONS LIST
- Capuano M, Iaffaldano L, Tinto N, Montanaro D, Capobianco V, Izzo V, Tucci F, Troncone G, Greco L. and Sacchetti L.. “MicroRNA-449a overexpression is associated with weak NOTCH1 signals and scarce goblet cells in celiac small intestine” paper in submission.
- Tinto N, Zagari A, Capuano M, De Simone A, Capobianco V, Daniele G, Giugliano M, Spadaro R, Franzese A, Sacchetti L.. “Glucokinase gene mutations: structural and genotype-phenotype analyses in MODY children from South Italy” PLoS ONE. 2008 Apr 2;3(4):e1870.
INTERNATIONAL RESEARCH EXPERIENCE Dates: April 2009 - July 2009 Project: Functional characterization of GCK gene mutations in MODY2 patients of Campania. Supervisor: Prof. M.A. Navas Lab. de Bioquímica y Biología Molecular, Dpto Bioquímica y Biología Molecular III, Facultad de Medicina, Universidad Complutense de Madrid Ciudad Universitaria 28040-Madrid, Spain.
This work has been carried out at the Department of Biochemistry and Medical Biotechnology, University of Naples “Federico II” and CEINGE Biotecnologie Avanzate, Naples.
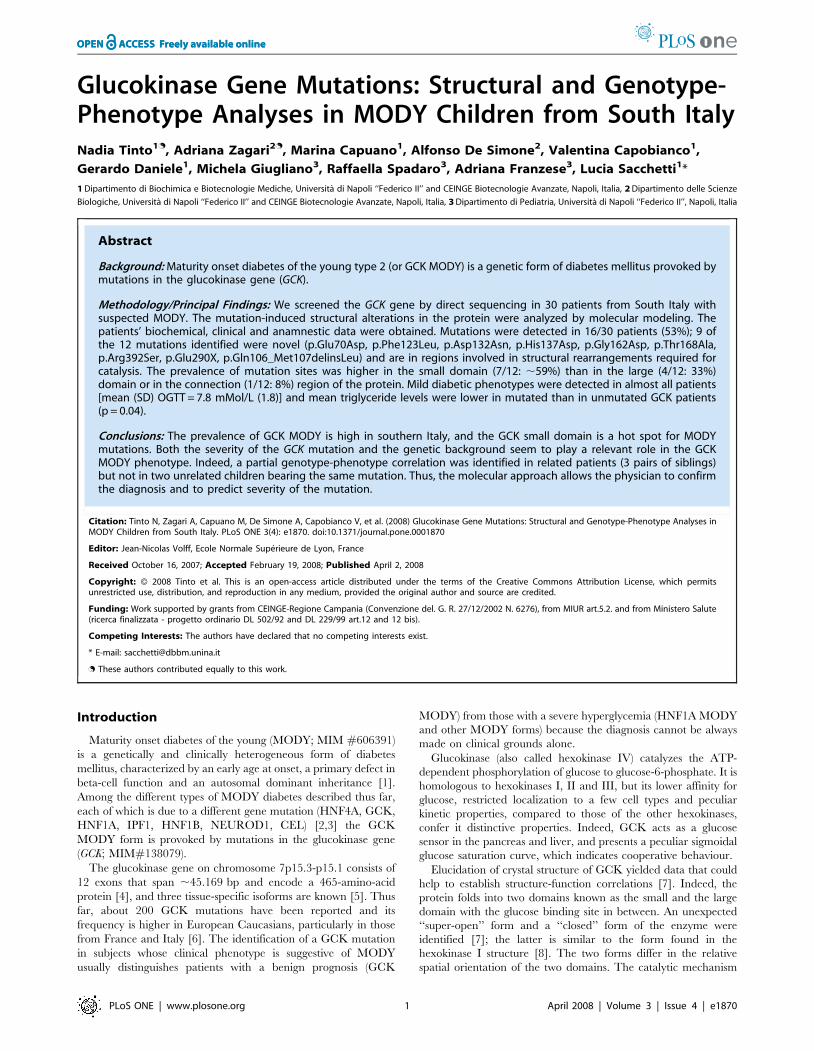
Glucokinase Gene Mutations: Structural and Genotype-Phenotype Analyses in MODY Children from South ItalyNadia Tinto1., Adriana Zagari2., Marina Capuano1, Alfonso De Simone2, Valentina Capobianco1,
Gerardo Daniele1, Michela Giugliano3, Raffaella Spadaro3, Adriana Franzese3, Lucia Sacchetti1*
1 Dipartimento di Biochimica e Biotecnologie Mediche, Universita di Napoli ‘‘Federico II’’ and CEINGE Biotecnologie Avanzate, Napoli, Italia, 2 Dipartimento delle Scienze
Biologiche, Universita di Napoli ‘‘Federico II’’ and CEINGE Biotecnologie Avanzate, Napoli, Italia, 3 Dipartimento di Pediatria, Universita di Napoli ‘‘Federico II’’, Napoli, Italia
Abstract
Background: Maturity onset diabetes of the young type 2 (or GCK MODY) is a genetic form of diabetes mellitus provoked bymutations in the glucokinase gene (GCK).
Methodology/Principal Findings: We screened the GCK gene by direct sequencing in 30 patients from South Italy withsuspected MODY. The mutation-induced structural alterations in the protein were analyzed by molecular modeling. Thepatients’ biochemical, clinical and anamnestic data were obtained. Mutations were detected in 16/30 patients (53%); 9 ofthe 12 mutations identified were novel (p.Glu70Asp, p.Phe123Leu, p.Asp132Asn, p.His137Asp, p.Gly162Asp, p.Thr168Ala,p.Arg392Ser, p.Glu290X, p.Gln106_Met107delinsLeu) and are in regions involved in structural rearrangements required forcatalysis. The prevalence of mutation sites was higher in the small domain (7/12: ,59%) than in the large (4/12: 33%)domain or in the connection (1/12: 8%) region of the protein. Mild diabetic phenotypes were detected in almost all patients[mean (SD) OGTT = 7.8 mMol/L (1.8)] and mean triglyceride levels were lower in mutated than in unmutated GCK patients(p = 0.04).
Conclusions: The prevalence of GCK MODY is high in southern Italy, and the GCK small domain is a hot spot for MODYmutations. Both the severity of the GCK mutation and the genetic background seem to play a relevant role in the GCKMODY phenotype. Indeed, a partial genotype-phenotype correlation was identified in related patients (3 pairs of siblings)but not in two unrelated children bearing the same mutation. Thus, the molecular approach allows the physician to confirmthe diagnosis and to predict severity of the mutation.
Citation: Tinto N, Zagari A, Capuano M, De Simone A, Capobianco V, et al. (2008) Glucokinase Gene Mutations: Structural and Genotype-Phenotype Analyses inMODY Children from South Italy. PLoS ONE 3(4): e1870. doi:10.1371/journal.pone.0001870
Editor: Jean-Nicolas Volff, Ecole Normale Superieure de Lyon, France
Received October 16, 2007; Accepted February 19, 2008; Published April 2, 2008
Copyright: � 2008 Tinto et al. This is an open-access article distributed under the terms of the Creative Commons Attribution License, which permitsunrestricted use, distribution, and reproduction in any medium, provided the original author and source are credited.
Funding: Work supported by grants from CEINGE-Regione Campania (Convenzione del. G. R. 27/12/2002 N. 6276), from MIUR art.5.2. and from Ministero Salute(ricerca finalizzata - progetto ordinario DL 502/92 and DL 229/99 art.12 and 12 bis).
Competing Interests: The authors have declared that no competing interests exist.
* E-mail: [email protected]
. These authors contributed equally to this work.
Introduction
Maturity onset diabetes of the young (MODY; MIM #606391)
is a genetically and clinically heterogeneous form of diabetes
mellitus, characterized by an early age at onset, a primary defect in
beta-cell function and an autosomal dominant inheritance [1].
Among the different types of MODY diabetes described thus far,
each of which is due to a different gene mutation (HNF4A, GCK,
HNF1A, IPF1, HNF1B, NEUROD1, CEL) [2,3] the GCK
MODY form is provoked by mutations in the glucokinase gene
(GCK; MIM#138079).
The glucokinase gene on chromosome 7p15.3-p15.1 consists of
12 exons that span ,45.169 bp and encode a 465-amino-acid
protein [4], and three tissue-specific isoforms are known [5]. Thus
far, about 200 GCK mutations have been reported and its
frequency is higher in European Caucasians, particularly in those
from France and Italy [6]. The identification of a GCK mutation
in subjects whose clinical phenotype is suggestive of MODY
usually distinguishes patients with a benign prognosis (GCK
MODY) from those with a severe hyperglycemia (HNF1A MODY
and other MODY forms) because the diagnosis cannot be always
made on clinical grounds alone.
Glucokinase (also called hexokinase IV) catalyzes the ATP-
dependent phosphorylation of glucose to glucose-6-phosphate. It is
homologous to hexokinases I, II and III, but its lower affinity for
glucose, restricted localization to a few cell types and peculiar
kinetic properties, compared to those of the other hexokinases,
confer it distinctive properties. Indeed, GCK acts as a glucose
sensor in the pancreas and liver, and presents a peculiar sigmoidal
glucose saturation curve, which indicates cooperative behaviour.
Elucidation of crystal structure of GCK yielded data that could
help to establish structure-function correlations [7]. Indeed, the
protein folds into two domains known as the small and the large
domain with the glucose binding site in between. An unexpected
‘‘super-open’’ form and a ‘‘closed’’ form of the enzyme were
identified [7]; the latter is similar to the form found in the
hexokinase I structure [8]. The two forms differ in the relative
spatial orientation of the two domains. The catalytic mechanism
PLoS ONE | www.plosone.org 1 April 2008 | Volume 3 | Issue 4 | e1870

requires dramatic GCK conformational changes. In fact, when
bound to glucose, the enzyme goes from the super-open inactive
form to the closed form. Therefore, the inter-domain motions are
crucial for the enzyme activity.
In this study, we report the identification of 9 novel and 3
known mutations of the GCK gene in children from south Italy. All
mutations co-segregated with the diabetic phenotype in the
respective families and resulted in perturbation of the 3D structure
of the protein. Our data show that molecular screening is useful in
the diagnosis of MODY because it allows to confirm the diagnosis
and to predict severity of the mutation.
Methods
SubjectsThirty patients aged 1–14 years, 9 boys and 21 girls whose
clinical presentation was suggestive of MODY were selected for
GCK gene screening from among 240 diabetic children seen in the
Paediatric Clinic of our Medical School between 2001 and 2006.
Other MODY genes were not investigated. Most patients were
unrelated; 6 were except (3 pairs of siblings, 1: M022–M023, 2:
M024–M025, 3: M028–M029). Inclusion criteria were: early onset
(,25 years) of diabetes, mild hyperglycemia, no autoimmune
markers of type I diabetes, without obesity [c.o. body mass index
(BMI) z score .2] and family history of diabetes for at least two
consecutive generations [1,9]. No treatment was administered to
the patients and no diabetes complications were evident up to
diagnosis. A fasting blood sample was drawn from both parents of
mutated patients and from 100 unrelated controls, who came from
the same geographical area, and used for the GCK molecular
characterization. The parents of all subjects gave their written
informed consent to the study. The research was conducted
according to Helsinki II declaration and approved by the ethics
committee of our Faculty.
Clinical and anamnestic examinationWe collected the following data for each patient upon
diagnosis: age, birth weight, family history of diabetes and/or
other diseases and BMI. The BMI was transformed into BMI-z-
score (z-BMI) based on the Centre for Disease Control normative
curves [10,11].
Biochemical analysesThe following biochemical parameters were measured on
fasting blood samples: plasma glucose (FPG) by the enzymatic
hexokinase method and triglycerides by the standard enzymatic
method (Hitachi Modular, Tokyo, Japan); glycosylated haemo-
globin (HbA1c) by HPLC (HLC-723 G7 TOSOH Bioscience
Tokyo, Japan); serum insulin by the chemiluminescence method
(Immulight 2000; Medical System Genoa, Italy). After an oral
glucose dose of 0.75g/kg body weight (maximum 75 g), oral
glucose tolerance test (OGTT) was evaluated on blood samples
collected every 30 min up to 2 h. The first-phase insulin response
(FPIR) was calculated as the sum of T+1 and +3 min serum insulin
concentrations, evaluated after an i.v. glucose dose of 0.5 g/kg
body weight in 3 min [12].
DNA extractionGenomic DNA from patients, parents and controls was
extracted from a blood sample plus EDTA using Nucleon BACC
2 kit (Amersham Biosciences Europe, Milan, Italy).
Sequence analysisExons and flanking intron regions of GCK, including tissue
specific variants of exon 1, were amplified by PCR using
previously reported primers (exons 1a, 2, 3, 4) [13] or chosen by
the Primer 3 program (exons 1b, 1c, 5, 6, 7, 8, 9 and 10) [14]. The
PCR mixture contained in a final volume of 50 ml: 20 mM each
primer, 1x PCR buffer (Applied Biosystems, Foster City, CA,
USA), 10 mM each deoxynucleotide triphosphate, 2.5 U of Taq
DNA polymerase (Applied Biosystems) and 200 ng of genomic
DNA. Each PCR was performed on Gene-Amp PCR system 9700
thermocycler (Applied Biosystems) and consisted of a initial
denaturation step at 95uC for 5 min and a final extension at
72uC for 7min.
The primers and PCR conditions are detailed in table 1.
Product sizes were evaluated by agarose gel electrophoresis and
amplicons were sequenced in both directions using the Big Dye
terminator sequencing kit (Applied Biosystems) on ABI PRISM
sequencing apparatus 3730 (Applied Biosystems). We preliminarily
analyzed the GCK coding sequence of a healthy subject by
sequence analysis and verified that it overlapped the wild-type
reference sequence (GenBank NM_000162). All sequences of the
Table 1. Primers used for PCR amplification of GCK exons and PCR conditions.
Exons1 Forward primer Reverse primerPCR annealingtemperatures
PCR annealingtimes
PCR extensiontimes (72uC)
Number ofcycles
1a (2) 59-TCCACTTCAGAAGCCTACTG 59-TCAGATTCTGAGGCTCAAAC 60uC 30’’ 60’’ 35
1b 59-AGCAGGCAGGAGCATCTCTG 59-GCTGCTCTCCCAGTGCAAAG 62uC 20’’ 60’’ 30
1c 59-GGCCAACTGCTACTTGGAAC 59-AGGAGGTGAGAAGCCTGGAG 54uC 20’’ 30’’ 35
2 (2) 59-TGCAGATGCCTGGTGACAGC 59-CACAGCTGCTTCTGGATGAG 60uC 15’’ 30’’ 30
3 (2) 59-TAATATCCGGCTCAGTCACC 59-CTGAGATCCTGCATGCCTTG 57uC 15’’ 30’’ 30
4 (2) 59-TAGCTTGGCTTGAGGCCGTG 59-TGAAGGCAGAGTTCCTCTGG 62uC 20’’ 60’’ 30
5/6 59-TCTGAGCCTGTTTCCTCAGC 59-GGCCCTTGAAGCCTGTTGTA 57uC 20’’ 45’’ 35
7 59-CCAGACAAAGCAGAGACAGG 59-TGCTTTTCCCCAGAGTTGTT 54uC 20’’ 45’’ 35
8 59-TGGCTCATTAACGAGGGAAA 59-CTGAGACCAAGTCTGCAGTG 51uC 15’’ 45’’ 35
9 59-CCCTCCCTGGAGAACGAGAG 59-AATCTTGGAGCTTGGGAACC 60uC 20’’ 45’’ 35
10 59-GAGTCTTCTCGACCCCCTTG 59-CACCGAAAAACTGAGGGAAG 55uC 20’’ 45’’ 35
1GenBank: accession nu (AH005826)2Taken from Stoffel M. et al. 1992 Proc Natl Acad Sci USA 89:7698–7702.doi:10.1371/journal.pone.0001870.t001
Glucokinase Gene Mutations
PLoS ONE | www.plosone.org 2 April 2008 | Volume 3 | Issue 4 | e1870
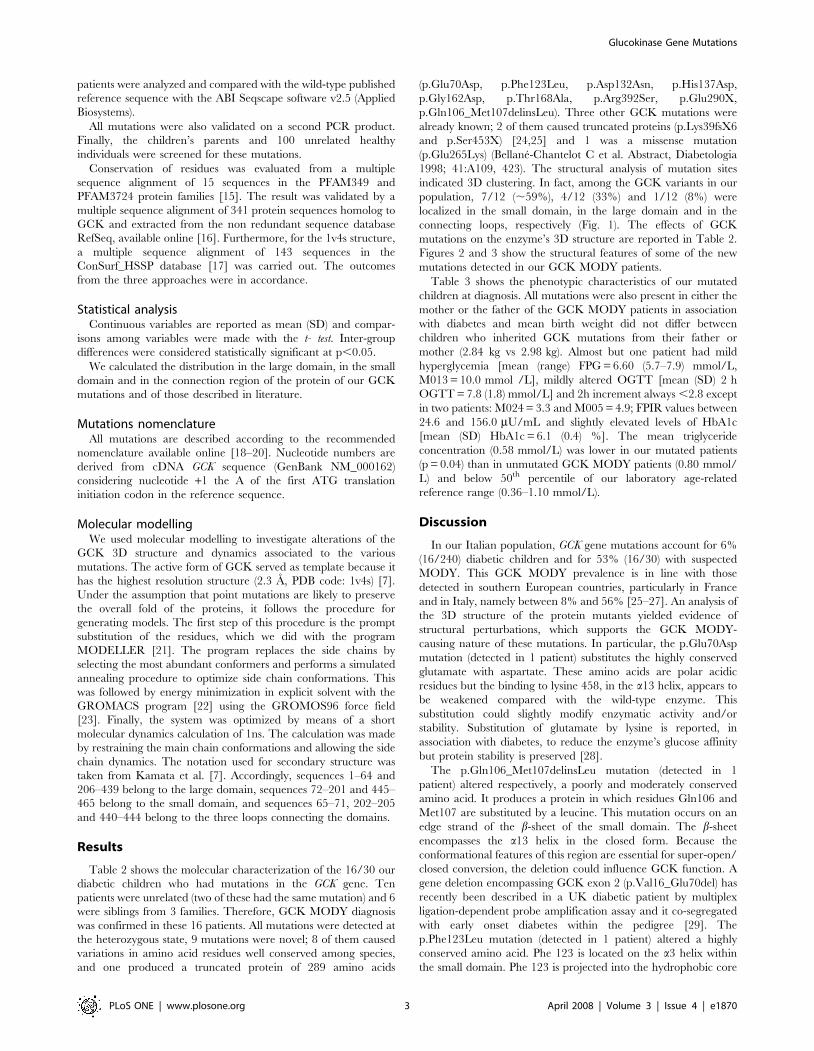
patients were analyzed and compared with the wild-type published
reference sequence with the ABI Seqscape software v2.5 (Applied
Biosystems).
All mutations were also validated on a second PCR product.
Finally, the children’s parents and 100 unrelated healthy
individuals were screened for these mutations.
Conservation of residues was evaluated from a multiple
sequence alignment of 15 sequences in the PFAM349 and
PFAM3724 protein families [15]. The result was validated by a
multiple sequence alignment of 341 protein sequences homolog to
GCK and extracted from the non redundant sequence database
RefSeq, available online [16]. Furthermore, for the 1v4s structure,
a multiple sequence alignment of 143 sequences in the
ConSurf_HSSP database [17] was carried out. The outcomes
from the three approaches were in accordance.
Statistical analysisContinuous variables are reported as mean (SD) and compar-
isons among variables were made with the t- test. Inter-group
differences were considered statistically significant at p,0.05.
We calculated the distribution in the large domain, in the small
domain and in the connection region of the protein of our GCK
mutations and of those described in literature.
Mutations nomenclatureAll mutations are described according to the recommended
nomenclature available online [18–20]. Nucleotide numbers are
derived from cDNA GCK sequence (GenBank NM_000162)
considering nucleotide +1 the A of the first ATG translation
initiation codon in the reference sequence.
Molecular modellingWe used molecular modelling to investigate alterations of the
GCK 3D structure and dynamics associated to the various
mutations. The active form of GCK served as template because it
has the highest resolution structure (2.3 A, PDB code: 1v4s) [7].
Under the assumption that point mutations are likely to preserve
the overall fold of the proteins, it follows the procedure for
generating models. The first step of this procedure is the prompt
substitution of the residues, which we did with the program
MODELLER [21]. The program replaces the side chains by
selecting the most abundant conformers and performs a simulated
annealing procedure to optimize side chain conformations. This
was followed by energy minimization in explicit solvent with the
GROMACS program [22] using the GROMOS96 force field
[23]. Finally, the system was optimized by means of a short
molecular dynamics calculation of 1ns. The calculation was made
by restraining the main chain conformations and allowing the side
chain dynamics. The notation used for secondary structure was
taken from Kamata et al. [7]. Accordingly, sequences 1–64 and
206–439 belong to the large domain, sequences 72–201 and 445–
465 belong to the small domain, and sequences 65–71, 202–205
and 440–444 belong to the three loops connecting the domains.
Results
Table 2 shows the molecular characterization of the 16/30 our
diabetic children who had mutations in the GCK gene. Ten
patients were unrelated (two of these had the same mutation) and 6
were siblings from 3 families. Therefore, GCK MODY diagnosis
was confirmed in these 16 patients. All mutations were detected at
the heterozygous state, 9 mutations were novel; 8 of them caused
variations in amino acid residues well conserved among species,
and one produced a truncated protein of 289 amino acids
(p.Glu70Asp, p.Phe123Leu, p.Asp132Asn, p.His137Asp,
p.Gly162Asp, p.Thr168Ala, p.Arg392Ser, p.Glu290X,
p.Gln106_Met107delinsLeu). Three other GCK mutations were
already known; 2 of them caused truncated proteins (p.Lys39fsX6
and p.Ser453X) [24,25] and 1 was a missense mutation
(p.Glu265Lys) (Bellane-Chantelot C et al. Abstract, Diabetologia
1998; 41:A109, 423). The structural analysis of mutation sites
indicated 3D clustering. In fact, among the GCK variants in our
population, 7/12 (,59%), 4/12 (33%) and 1/12 (8%) were
localized in the small domain, in the large domain and in the
connecting loops, respectively (Fig. 1). The effects of GCK
mutations on the enzyme’s 3D structure are reported in Table 2.
Figures 2 and 3 show the structural features of some of the new
mutations detected in our GCK MODY patients.
Table 3 shows the phenotypic characteristics of our mutated
children at diagnosis. All mutations were also present in either the
mother or the father of the GCK MODY patients in association
with diabetes and mean birth weight did not differ between
children who inherited GCK mutations from their father or
mother (2.84 kg vs 2.98 kg). Almost but one patient had mild
hyperglycemia [mean (range) FPG = 6.60 (5.7–7.9) mmol/L,
M013 = 10.0 mmol /L], mildly altered OGTT [mean (SD) 2 h
OGTT = 7.8 (1.8) mmol/L] and 2h increment always ,2.8 except
in two patients: M024 = 3.3 and M005 = 4.9; FPIR values between
24.6 and 156.0 mU/mL and slightly elevated levels of HbA1c
[mean (SD) HbA1c = 6.1 (0.4) %]. The mean triglyceride
concentration (0.58 mmol/L) was lower in our mutated patients
(p = 0.04) than in unmutated GCK MODY patients (0.80 mmol/
L) and below 50th percentile of our laboratory age-related
reference range (0.36–1.10 mmol/L).
Discussion
In our Italian population, GCK gene mutations account for 6%
(16/240) diabetic children and for 53% (16/30) with suspected
MODY. This GCK MODY prevalence is in line with those
detected in southern European countries, particularly in France
and in Italy, namely between 8% and 56% [25–27]. An analysis of
the 3D structure of the protein mutants yielded evidence of
structural perturbations, which supports the GCK MODY-
causing nature of these mutations. In particular, the p.Glu70Asp
mutation (detected in 1 patient) substitutes the highly conserved
glutamate with aspartate. These amino acids are polar acidic
residues but the binding to lysine 458, in the a13 helix, appears to
be weakened compared with the wild-type enzyme. This
substitution could slightly modify enzymatic activity and/or
stability. Substitution of glutamate by lysine is reported, in
association with diabetes, to reduce the enzyme’s glucose affinity
but protein stability is preserved [28].
The p.Gln106_Met107delinsLeu mutation (detected in 1
patient) altered respectively, a poorly and moderately conserved
amino acid. It produces a protein in which residues Gln106 and
Met107 are substituted by a leucine. This mutation occurs on an
edge strand of the b-sheet of the small domain. The b-sheet
encompasses the a13 helix in the closed form. Because the
conformational features of this region are essential for super-open/
closed conversion, the deletion could influence GCK function. A
gene deletion encompassing GCK exon 2 (p.Val16_Glu70del) has
recently been described in a UK diabetic patient by multiplex
ligation-dependent probe amplification assay and it co-segregated
with early onset diabetes within the pedigree [29]. The
p.Phe123Leu mutation (detected in 1 patient) altered a highly
conserved amino acid. Phe 123 is located on the a3 helix within
the small domain. Phe 123 is projected into the hydrophobic core
Glucokinase Gene Mutations
PLoS ONE | www.plosone.org 3 April 2008 | Volume 3 | Issue 4 | e1870
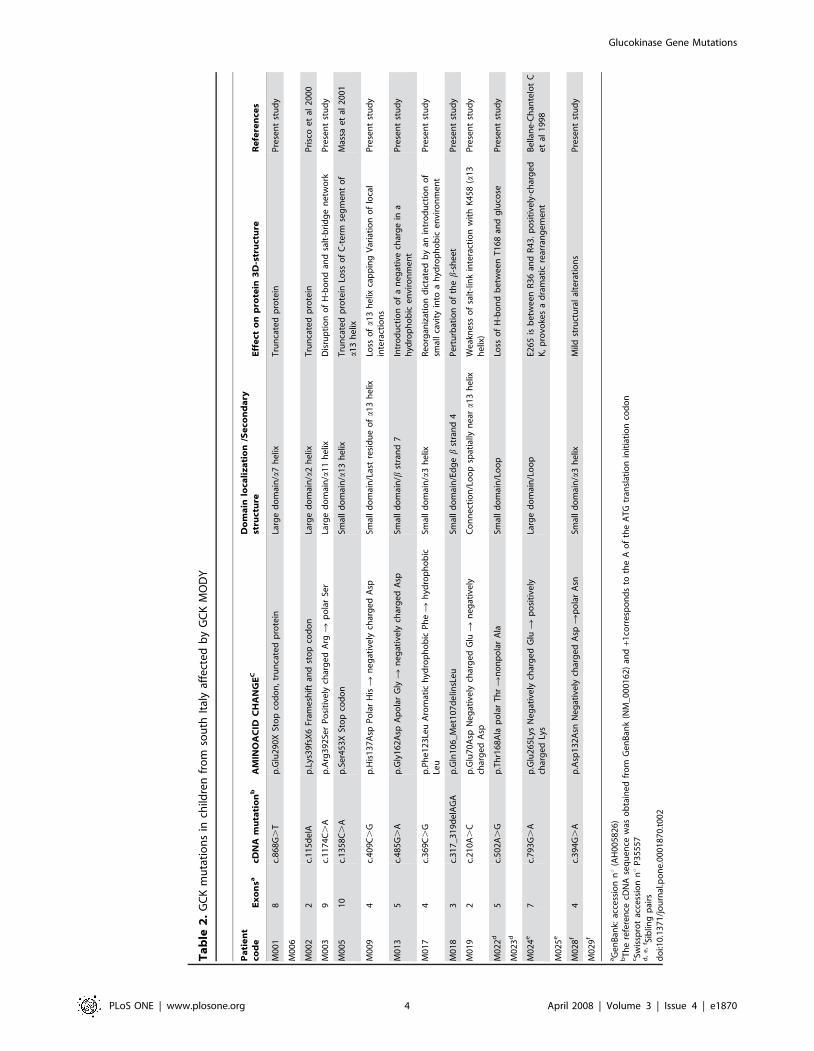
Ta
ble
2.
GC
Km
uta
tio
ns
inch
ildre
nfr
om
sou
thIt
aly
affe
cte
db
yG
CK
MO
DY
Pa
tie
nt
cod
eE
xo
nsa
cDN
Am
uta
tio
nb
AM
INO
AC
IDC
HA
NG
EC
Do
ma
inlo
cali
za
tio
n/S
eco
nd
ary
stru
ctu
reE
ffe
cto
np
rote
in3
D-s
tru
ctu
reR
efe
ren
ces
M0
01
8c.
86
8G
.T
p.G
lu2
90
XSt
op
cod
on
,tr
un
cate
dp
rote
inLa
rge
do
mai
n/a
7h
elix
Tru
nca
ted
pro
tein
Pre
sen
tst
ud
y
M0
06
M0
02
2c.
11
5d
elA
p.L
ys3
9fs
X6
Fram
esh
ift
and
sto
pco
do
nLa
rge
do
mai
n/a
2h
elix
Tru
nca
ted
pro
tein
Pri
sco
et
al2
00
0
M0
03
9c.
11
74
C.
Ap
.Arg
39
2Se
rP
osi
tive
lych
arg
ed
Arg
Rp
ola
rSe
rLa
rge
do
mai
n/a
11
he
lixD
isru
pti
on
of
H-b
on
dan
dsa
lt-b
rid
ge
ne
two
rkP
rese
nt
stu
dy
M0
05
10
c.1
35
8C
.A
p.S
er4
53
XSt
op
cod
on
Smal
ld
om
ain
/a1
3h
elix
Tru
nca
ted
pro
tein
Loss
of
C-t
erm
seg
me
nt
of
a1
3h
elix
Mas
sae
tal
20
01
M0
09
4c.
40
9C
.G
p.H
is1
37
Asp
Po
lar
His
Rn
eg
ativ
ely
char
ge
dA
spSm
all
do
mai
n/L
ast
resi
du
eo
fa
13
he
lixLo
sso
fa
13
he
lixca
pp
ing
Var
iati
on
of
loca
lin
tera
ctio
ns
Pre
sen
tst
ud
y
M0
13
5c.
48
5G
.A
p.G
ly1
62
Asp
Ap
ola
rG
lyR
ne
gat
ive
lych
arg
ed
Asp
Smal
ld
om
ain
/bst
ran
d7
Intr
od
uct
ion
of
an
eg
ativ
ech
arg
ein
ah
ydro
ph
ob
ice
nvi
ron
me
nt
Pre
sen
tst
ud
y
M0
17
4c.
36
9C
.G
p.P
he
12
3Le
uA
rom
atic
hyd
rop
ho
bic
Ph
eR
hyd
rop
ho
bic
Leu
Smal
ld
om
ain
/a3
he
lixR
eo
rgan
izat
ion
dic
tate
db
yan
intr
od
uct
ion
of
smal
lca
vity
into
ah
ydro
ph
ob
ice
nvi
ron
me
nt
Pre
sen
tst
ud
y
M0
18
3c.
31
7_
31
9d
elA
GA
p.G
ln1
06
_M
et1
07
de
linsL
eu
Smal
ld
om
ain
/Ed
ge
bst
ran
d4
Pe
rtu
rbat
ion
of
the
b-s
he
et
Pre
sen
tst
ud
y
M0
19
2c.
21
0A
.C
p.G
lu7
0A
spN
eg
ativ
ely
char
ge
dG
luR
ne
gat
ive
lych
arg
ed
Asp
Co
nn
ect
ion
/Lo
op
spat
ially
ne
ara
13
he
lixW
eak
ne
sso
fsa
lt-l
ink
inte
ract
ion
wit
hK
45
8(a
13
he
lix)
Pre
sen
tst
ud
y
M0
22
d5
c.5
02
A.
Gp
.Th
r16
8A
lap
ola
rT
hr
Rn
on
po
lar
Ala
Smal
ld
om
ain
/Lo
op
Loss
of
H-b
on
db
etw
ee
nT
16
8an
dg
luco
seP
rese
nt
stu
dy
M0
23
d
M0
24
e7
c.7
93
G.
Ap
.Glu
26
5Ly
sN
eg
ativ
ely
char
ge
dG
luR
po
siti
vely
char
ge
dLy
sLa
rge
do
mai
n/L
oo
pE2
65
isb
etw
ee
nR
36
and
R4
3.
po
siti
vely
-ch
arg
ed
K,
pro
voke
sa
dra
mat
icre
arra
ng
em
en
tB
ella
ne
-Ch
ante
lot
Ce
tal
19
98
M0
25
e
M0
28
f4
c.3
94
G.
Ap
.Asp
13
2A
snN
eg
ativ
ely
char
ge
dA
spR
po
lar
Asn
Smal
ld
om
ain
/a3
he
lixM
ildst
ruct
ura
lal
tera
tio
ns
Pre
sen
tst
ud
y
M0
29
f
aG
en
Ban
k:ac
cess
ion
nu
(AH
00
58
26
)b
Th
ere
fere
nce
cDN
Ase
qu
en
cew
aso
bta
ine
dfr
om
Ge
nB
ank
(NM
_0
00
16
2)
and
+1co
rre
spo
nd
sto
the
Ao
fth
eA
TG
tran
slat
ion
init
iati
on
cod
on
cSw
issp
rot
acce
ssio
nnu
P3
55
57
d,
e,
f Sib
ling
pai
rsd
oi:1
0.1
37
1/j
ou
rnal
.po
ne
.00
01
87
0.t
00
2
Glucokinase Gene Mutations
PLoS ONE | www.plosone.org 4 April 2008 | Volume 3 | Issue 4 | e1870
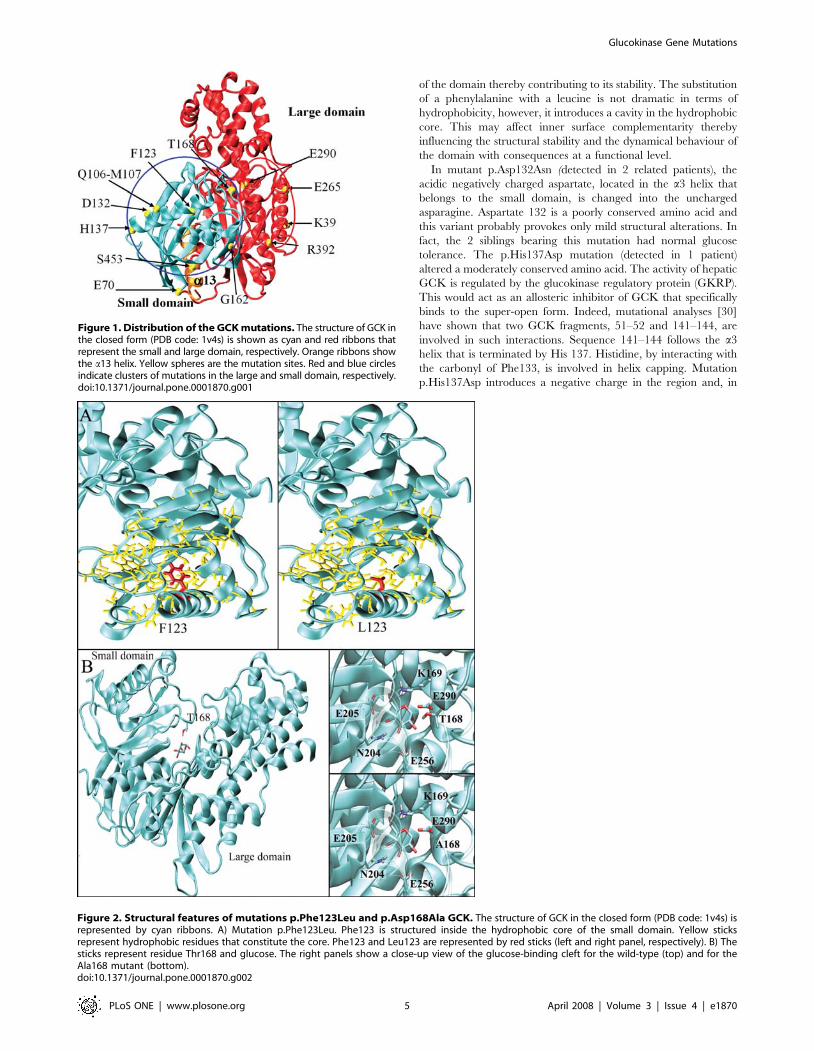
of the domain thereby contributing to its stability. The substitution
of a phenylalanine with a leucine is not dramatic in terms of
hydrophobicity, however, it introduces a cavity in the hydrophobic
core. This may affect inner surface complementarity thereby
influencing the structural stability and the dynamical behaviour of
the domain with consequences at a functional level.
In mutant p.Asp132Asn (detected in 2 related patients), the
acidic negatively charged aspartate, located in the a3 helix that
belongs to the small domain, is changed into the uncharged
asparagine. Aspartate 132 is a poorly conserved amino acid and
this variant probably provokes only mild structural alterations. In
fact, the 2 siblings bearing this mutation had normal glucose
tolerance. The p.His137Asp mutation (detected in 1 patient)
altered a moderately conserved amino acid. The activity of hepatic
GCK is regulated by the glucokinase regulatory protein (GKRP).
This would act as an allosteric inhibitor of GCK that specifically
binds to the super-open form. Indeed, mutational analyses [30]
have shown that two GCK fragments, 51–52 and 141–144, are
involved in such interactions. Sequence 141–144 follows the a3
helix that is terminated by His 137. Histidine, by interacting with
the carbonyl of Phe133, is involved in helix capping. Mutation
p.His137Asp introduces a negative charge in the region and, in
Figure 1. Distribution of the GCK mutations. The structure of GCK inthe closed form (PDB code: 1v4s) is shown as cyan and red ribbons thatrepresent the small and large domain, respectively. Orange ribbons showthe a13 helix. Yellow spheres are the mutation sites. Red and blue circlesindicate clusters of mutations in the large and small domain, respectively.doi:10.1371/journal.pone.0001870.g001
Figure 2. Structural features of mutations p.Phe123Leu and p.Asp168Ala GCK. The structure of GCK in the closed form (PDB code: 1v4s) isrepresented by cyan ribbons. A) Mutation p.Phe123Leu. Phe123 is structured inside the hydrophobic core of the small domain. Yellow sticksrepresent hydrophobic residues that constitute the core. Phe123 and Leu123 are represented by red sticks (left and right panel, respectively). B) Thesticks represent residue Thr168 and glucose. The right panels show a close-up view of the glucose-binding cleft for the wild-type (top) and for theAla168 mutant (bottom).doi:10.1371/journal.pone.0001870.g002
Glucokinase Gene Mutations
PLoS ONE | www.plosone.org 5 April 2008 | Volume 3 | Issue 4 | e1870

our simulations, Asp137 does not exert a capping function, but
strongly interacts with Lys104 by making a salt bridge.
Accordingly, p.His137Asp may affect the conformational proper-
ties of fragment 141–144 thereby indirectly influencing the
binding with GKRP. The p.His137Arg mutation has been
described in association with diabetes [31].
The p.Gly162Asp mutation (detected in 1 patient) altered a
highly conserved amino acid. Gly162 is located on the b-sheet that
encloses the small domain hydrophobic core. p.Gly162Asp is one
of the most dramatic mutations we identified because it introduces
a negative residue inside the hydrophobic core. p.Gly162Asp very
probably influences the stability of the core thereby altering the
structure and dynamics of the domain. This scenario is indicative
of functional impairment of the enzyme.
The p.Thr168Ala mutation (detected in 2 related patients)
affected a conserved amino acid. The glucose-binding cleft is
located at the interface between small and large domains. It is
constituted by residues Glu256 and Glu290 from the large
domain, Thr168 and Lys169 from the small domain, and
Asn204 and Asp205 from the interconnecting region. Binding a
glucose molecule requires a precise pattern of H-bonds between
the substrate and GCK. Thr168 binds glucose, therefore the
p.Thr168Ala substitution prevents the formation of the H-bond
and probably perturbs the enzyme’s binding affinity and efficiency.
Mutation p.Thr168Ala has been described in patients affected by
diabetes [32]; it greatly increased Vmax and resulted in a complete
loss of cooperative behaviour associated with glucose binding, the
2 siblings bearing this mutation had normal glucose tolerance and
impaired glycosylated hemoglobin. Glutamate 290 is a highly
conserved residue involved in glucose binding. The p.Glu290X
mutation (detected in 2 unrelated patients) introduces a stop codon
and generates a truncated protein of only 289 amino acids, which
is thus unable to function.
The p.Arg392Ser mutation (detected in 1 patient) alters a
conserved amino acid. Arg392, is located on the a11 helix in the
large domain and is involved in a local H-bond/salt bridge
network. Arg392 is positively charged and makes a salt bridge with
the negative residues Asp42 (a2) and Glu236. The H-bond
network extends to two water molecules and residue Asn240.
These residues, which are far in sequence, are relevant for the
tertiary structure of the domain, in fact serine is unable to replace
the wild-type Arg392 interactions. The p.Arg392Cys mutation was
reported in co-segregation with hyperglycemia in pregnancy [33].
Three patients carried already known GCK mutations:
p.Lys39fsX6, p.Ser453X and p.Glu265Lys. All these mutations
were described in association with hyperglycemia. In particular,
the Ser R Leu mutation at residue 453 was recently found to
reduce GCK activity in a GCK MODY patient [34]. In our GCK
MODY patients, the distribution of mutation sites in the GCK
protein (59%, 33% and 8% in the small domain, large domain and
in the connection region, respectively) differed from the distribu-
tion observed in European Caucasians and in other ethnic groups
(41%, 58% and 1% in the small domain, large domain and in the
connection region, respectively) [5,35]. Consequently, the GCK
small domain may be a hot spot for MODY mutations typical of
Southern Italy. Interestingly, almost all the mutation sites we
describe are in regions involved in structural rearrangements
required for catalysis. This finding supports the notion that
mutations may affect GCK function, which is intimately related to
intermotion domain [7]. Our data confirm the association
between low triglyceride values and GCK mutations and support
a low rate of cardiovascular complications in GCK MODY
diabetes [36]. Interestingly, the two patients (M001 and M013)
with the lowest BMI z scores also had the lowest FPIR values,
which is in line with the finding that, at low levels, insulin does not
exert an anabolic effect [37].
Massa et al. [25] did not find an association between phenotype
and genotype in GCK MODY patients. Two of our unrelated
patients, M001 and M006, who both carried the p.Glu290X
mutation, had a low birth weight but a different diabetic
phenotype as evaluated by OGTT, FPIR tests and triglyceride
level. In contrast, among the three pairs of siblings, each with the
same mutation, two pairs (M022-M023, M028-M029) had almost
identical metabolic phenotypes. In the third pair of siblings (M024-
M025, aged 12 and 5 years respectively), the elder child was
diabetic and the younger had impaired glucose tolerance. In these
two patients, the p.Glu265Lys mutation provoked a dramatic
rearrangement of GCK, which indicates a more severe prognosis.
Thus, both the severity of the GCK mutation and the genetic
background seem to play a relevant role in the GCK MODY
phenotype.
In conclusion, all mutations detected in our diabetic children
from south Italy co-segregated with the diabetic status in one or
two family members of each patient and were not detected during
the screening of 200 normal chromosomes. The new deletion and
missense mutations produced an amino acid substitution at
positions that are well conserved among several species. Finally,
our data show that molecular screening is useful in the diagnosis of
MODY because it allows one to confirm the diagnosis and to
predict the prognosis as well as the clinical course of the patient.
Acknowledgments
We are grateful to Jean Ann Gilder for text editing.
Figure 3. Structural features of mutations p.His137Asp,p.Arg392Ser and p.Gly162Asp GCK. The structure of GCK in theclosed form (PDB code:1v4s) is shown as cyan ribbons. A) p.His137Asp.Loop 141–144, which is involved in GKRP binding, is in red. His137 is atthe end of the a3 helix. His137 is a capping residue of the helix, which isterminated by the interaction between side chain of His137 andPhe133. Asp137 (right) is not able to replace His137 interactions butadds a new interaction with Lys104. B) p.Gly162Asp. Yellow sticksrepresent hydrophobic residues that constitute the core. The location ofGly162 is marked in red (left of the panel). Asp162 is on the right of thepanel. C) p.Arg392Ser. Residues Asp42, Glu236, Asn240 and Arg392 arerepresented by yellow sticks. H-bonds are shown in green. The wild-type enzyme and the p.Arg392Ser mutant are on the left and right ofthe panel, respectively.doi:10.1371/journal.pone.0001870.g003
Glucokinase Gene Mutations
PLoS ONE | www.plosone.org 6 April 2008 | Volume 3 | Issue 4 | e1870
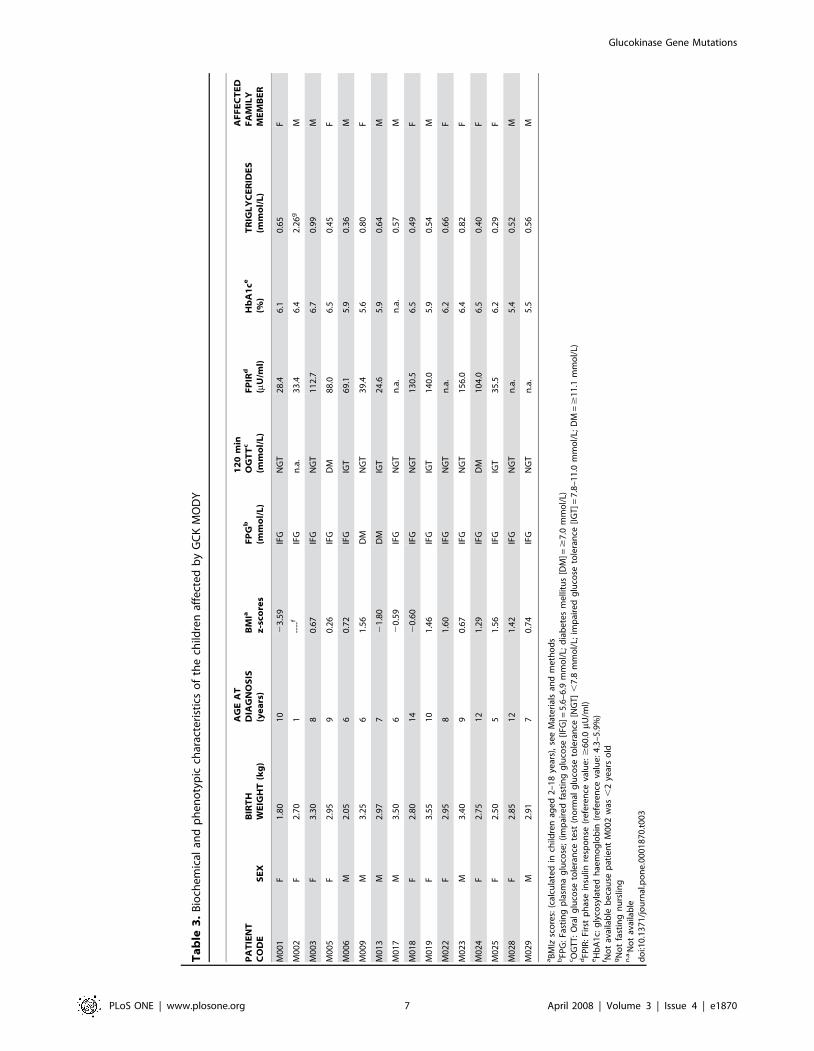
Ta
ble
3.
Bio
che
mic
alan
dp
he
no
typ
icch
arac
teri
stic
so
fth
ech
ildre
naf
fect
ed
by
GC
KM
OD
Y
PA
TIE
NT
CO
DE
SE
XB
IRT
HW
EIG
HT
(kg
)
AG
EA
TD
IAG
NO
SIS
(ye
ars
)B
MIa
z-s
core
sF
PG
b
(mm
ol/
L)
12
0m
inO
GT
Tc
(mm
ol/
L)
FP
IRd
(mU
/ml)
Hb
A1
ce
(%)
TR
IGL
YC
ER
IDE
S(m
mo
l/L
)
AF
FE
CT
ED
FA
MIL
YM
EM
BE
R
M0
01
F1
.80
10
23
.59
IFG
NG
T2
8.4
6.1
0.6
5F
M0
02
F2
.70
1--
--f
IFG
n.a
.3
3.4
6.4
2.2
6g
M
M0
03
F3
.30
80
.67
IFG
NG
T1
12
.76
.70
.99
M
M0
05
F2
.95
90
.26
IFG
DM
88
.06
.50
.45
F
M0
06
M2
.05
60
.72
IFG
IGT
69
.15
.90
.36
M
M0
09
M3
.25
61
.56
DM
NG
T3
9.4
5.6
0.8
0F
M0
13
M2
.97
72
1.8
0D
MIG
T2
4.6
5.9
0.6
4M
M0
17
M3
.50
62
0.5
9IF
GN
GT
n.a
.n
.a.
0.5
7M
M0
18
F2
.80
14
20
.60
IFG
NG
T1
30
.56
.50
.49
F
M0
19
F3
.55
10
1.4
6IF
GIG
T1
40
.05
.90
.54
M
M0
22
F2
.95
81
.60
IFG
NG
Tn
.a.
6.2
0.6
6F
M0
23
M3
.40
90
.67
IFG
NG
T1
56
.06
.40
.82
F
M0
24
F2
.75
12
1.2
9IF
GD
M1
04
.06
.50
.40
F
M0
25
F2
.50
51
.56
IFG
IGT
35
.56
.20
.29
F
M0
28
F2
.85
12
1.4
2IF
GN
GT
n.a
.5
.40
.52
M
M0
29
M2
.91
70
.74
IFG
NG
Tn
.a.
5.5
0.5
6M
aB
MIz
sco
res:
(cal
cula
ted
inch
ildre
nag
ed
2–
18
year
s),
see
Mat
eri
als
and
me
tho
ds
bFP
G:
Fast
ing
pla
sma
glu
cose
;(i
mp
aire
dfa
stin
gg
luco
se[I
FG]=
5.6
–6
.9m
mo
l/L;
dia
be
tes
me
llitu
s[D
M]=
$7
.0m
mo
l/L)
cO
GT
T:
Ora
lg
luco
seto
lera
nce
test
(no
rmal
glu
cose
tole
ran
ce[N
GT
],
7.8
mm
ol/
L;im
pai
red
glu
cose
tole
ran
ce[I
GT
]=7
.8–
11
.0m
mo
l/L;
DM
=$
11
.1m
mo
l/L)
dFP
IR:
Firs
tp
has
ein
sulin
resp
on
se(r
efe
ren
ceva
lue
:$
60
.0mU
/ml)
eH
bA
1c:
gly
cosy
late
dh
aem
og
lob
in(r
efe
ren
ceva
lue
:4
.3–
5.9
%)
f No
tav
aila
ble
be
cau
sep
atie
nt
M0
02
was
,2
year
so
ldg
No
tfa
stin
gn
urs
ling
n.a
. No
tav
aila
ble
do
i:10
.13
71
/jo
urn
al.p
on
e.0
00
18
70
.t0
03
Glucokinase Gene Mutations
PLoS ONE | www.plosone.org 7 April 2008 | Volume 3 | Issue 4 | e1870
Author Contributions
Conceived and designed the experiments: AD NT LS AZ. Performed the
experiments: AD NT LS MC VC GD. Analyzed the data: AD NT LS AZ
MC VC MG RS AF. Contributed reagents/materials/analysis tools: LS.
Wrote the paper: NT LS AZ MC MG AF.
References
1. Fajans SS, Bell GI, Polonsky KS (2001) Molecular mechanisms and clinical
pathophysiology of maturity-onset diabetes of the young. N Engl J Med 345:
971–980.2. Raeder H, Johansson S, Holm PI, Haldorsen IS, Mas E, et al. (2006) Mutations
in the CEL VNTR cause a syndrome of diabetes and pancreatic exocrinedysfunction. Nat Genet. 38: 54–62.
3. Weedon MN, Frayling TM (2007) Insights on pathogenesis of type 2 diabetesfrom MODY genetics. Curr Diab Rep 7: 131–8.
4. Iynedjian PB (1993) Mammalian glucokinase and its gene. Biochem J 293: 1–13.
5. Gloyn AL (2003) Glucokinase (GCK) mutations in hyper- and hypoglycemia:maturity-onset diabetes of the young, permanent neonatal diabetes, and
hyperinsulinemia of infancy. Hum Mutat 22: 353–362.6. Pinterova D, Ek J, Kolostova K, Pruhova S, Novota P, et al. (2007) Six novel
mutations in the GCK gene in MODY patients. Clin Genet 71: 95–96.
7. Kamata K, Mitsuya M, Nishimura T, Eiki J, Nagata Y (2004) Structural basisfor allosteric regulation of the monomeric allosteric enzyme human glucokinase.
Structure 12: 429–438.8. Aleshin AE, Zeng C, Bartunik HD, Fromm HJ, Honzatko RB (1998) Regulation
of hexokinase I: crystal structure of recombinant human brain hexokinasecomplexed with glucose and phosphate. J Mol Biol 282: 345–357.
9. Garcia-Herrero CM, Galan M, Vincent O, Flandez B, Gargallo M, et al. (2007)
Functional analysis of human glucokinase gene mutations causing GCKMODY: exploring the regulatory mechanisms of glucokinase activity. Diabe-
tologia 50: 325–333.10. Centre for Disease Control normative curves. http://www.cdc.gov.
11. Kuczmarski RJ, Ogden CL, Guo SS, Grummer-Strawn LM, Flegal KM, et al.
(2002) 2000 CDC Growth Charts for the United States: methods anddevelopment. Vital Health Stat 11. 246: 1–190.
12. Shield JP, Temple IK, Sabin M, Mackay, Robinson DO, et al. (2004) Anassessment of pancreatic endocrine function and insulin sensitivity in patients
with transient neonatal diabetes in remission. Arch Dis Child Fetal Neonatal Ed89: F341–343.
13. Stoffel M, Froguel PH, Takeda J, Zouali H, Vionnet N, et al. (1992) Human
glucokinase gene: isolation, characterization, and identification of two missensemutations linked to early-onset non-insulin-dependent (type 2) diabetes mellitus.
Proc Natl Acad Sci U S A 89: 7698–7702.14. Primer3 Input 0.4.0. http://frodo.wi.mit.edu/.
15. Protein families database of alignments. Pfam. http://www.sanger.ac.uk/
Software/Pfam/.16. National Center for Biotechnology Information. NCBI. http://www.ncbi.nlm.
nih.gov/.17. Glaser F, Rosemberg Y, Kessel A, Pupko T, Ben-Tal N (2005) The ConSurf-
HSSP database: the mapping of evolutionary conservation among homologsonto PDB structures. Proteins 58: 610–617.
18. Human Genome Variation Society. HGVS. http://www.hgvs.org/mutnomen/.
19. den Dunnen JT, Antonarakis E (2001) Nomenclature for the description ofhuman sequence variations. Hum Genet 109: 121–124.
20. den Dunnen JT, Paalman MH (2003) Standardizing mutation nomenclature:why bother? Hum Mutat 22: 181–182.
21. Fiser A, Sali A (2003) Modeller: generation and refinement of homology-based
protein structure models. Methods Enzymol 374: 461–491.
22. Berendsen HJ, van der Spoel D, van Drunen R (1995) GROMACS: ‘‘A
message-passing parallel molecular dynamics implementation’’. Comp. Phys.
Comm 91: 43–56.23. Fraternali F, Van Gunsteren WF (1996) An efficient mean solvation force model
for use in molecular dynamics simulations of proteins in aqueous solution. J MolBiol 256: 939–948.
24. Prisco F, Iafusco D, Franzese A, Sulli N, Barbetti F (2000) Mody 2 presenting asneonatal hyperglycaemia: a need to reshape the definition of ‘‘neonatal
diabetes’’? Diabetologia 43: 1331–1332.
25. Massa O, Meschi F, Cuesta-Munoz A, Caumo A, Cerutti F, et al. (2001) Highprevalence of glucokinase mutations in Italian children with MODY. Influence
on glucose tolerance, first-phase insulin response, insulin sensitivity and BMI.Diabetologia 44: 898–905.
26. Mantovani V, Salardi S, Cerreta V, Bastia D, Cenci M, et al. (2003)
Identification of eight novel glucokinase mutations in Italian children withmaturity-onset diabetes of the young. Hum Mutat 22(4): 338.
27. Toaima D, Nake A, Wendenburg J, Praedicow K, Rohayem J, et al. (2005)Identification of novel GCK and HNF1A/TCF1 mutations and polymorphisms
in German families with maturity-onset diabetes of the young (MODY). HumMutat 25: 503–504.
28. Burke CV, Buettger CW, Davis EA, McClane SJ, Matschinsky FM, et al. (1999)
Cell-biological assessment of human glucokinase mutants causing maturity-onsetdiabetes of the young type 2 (MODY-2) or glucokinase-linked hyperinsulinaemia
(GK-HI). Biochem J 342: 345–352.29. Ellard S, Thomas K, Edghill EL, Owens M, Ambye L, et al. (2007) Partial and
whole gene deletion mutations of the GCK and HNF1A genes in maturity-onset
diabetes of the young. Diabetologia 50: 2313–7.30. Veiga-da-Cunha M, Courtois S, Michel A, Gosselain E, Van Schaftingen E
(1996) Amino acid conservation in animal glucokinases. Identification of residuesimplicated in the interaction with the regulatory protein. J Biol Chem. 271:
6292–6297.31. Velho G, Blanche H, Vaxillaire M, Bellanne-Chantelot C, Pardini VC, et al.
(1997) Identification of 14 new glucokinase mutations and description of the
clinical profile of 42 MODY-2 families. Diabetologia 40: 217–224.32. Miller SP, Anand GR, Karschnia EJ, Bell GI, LaPorte DC, et al. (1999)
Characterization of glucokinase mutations associated with maturity-onsetdiabetes of the young type 2 (MODY-2): different glucokinase defects lead to
a common phenotype. Diabetes 48: 1645–1651.
33. Hattersley AT, Beards F, Ballantyne E, Appleton M, Harvey R, et al. (1998)Mutations in the glucokinase gene of the fetus result in reduced birth weight. Nat
Genet 19: 268–270.34. Sagen JV, Odili S, Bjorkhaug L, Zelent D, Buettger C, et al. (2006) From
clinicogenetic studies of maturity-onset diabetes of the young to unravelingcomplex mechanisms of glucokinase regulation. Diabetes 55: 1713–1722.
35. The Human Gene Mutation Database at the Institute of Medical Genetics in
Cardiff (HGMD). http://www.hgmd.cf.ac.uk/ac/index.php.36. Berger M, Monks D, Schmidt H, Krane V, Wanner C, et al. (2005) Are
glucokinase mutations associated with low triglycerides? Clin Chem 51:791–793.
37. Rhodes CJ, White MF (2002) Molecular insight into insulin action and secretion.
Eur J Clin Invest 32: 3–13.
Glucokinase Gene Mutations
PLoS ONE | www.plosone.org 8 April 2008 | Volume 3 | Issue 4 | e1870