Analysis of Metro rail Project selection Bias with...
31
A case of Delhi,Bangalore,Mumbai,Jaipur and Chennai Analysis of Metro rail Project selection Bias with Principal-Agent Model Vinod Rathod
Transcript of Analysis of Metro rail Project selection Bias with...

A case of Delhi,Bangalore,Mumbai,Jaipur and Chennai
Analysis of Metro rail Project selection Bias with Principal-Agent Model
Vinod Rathod
Urban Metro Projects have proven to be very useful in decongesting large cities. 148 cities around the world had Metro System. In World Metro systems carry 150 million passengers per day.
In India, many cities are now considering the Metro system as an alternativeThe 12th fifth year plan Urban Transport group has recommended, Metro is only one of the Options for decongestion.
Background
(Canavan, 2015)
Growth of Metro rail system
0
50
100
150
200
250
300
2002 2004 2006 2008 2010 2012 2014 2016
kms
UnderConstruction (in Kms) Operational (in Kms)
Growth of Metro rail system in India

Background
Metro rail Transit is attached with the High capital and operating costs. It found that most of
the metro systems around the world are not financially viable.
Public investment in rail transit has long been controversial (Wenling, 2006)
Failures of rail projects to materialize the targeted performance in terms of ridership
speed, operating costs, and development benefits, on which grounds they had been justified
(Pickrell ,1989)
Anticipated project objectives are moderately met but at very high costs.
Under-investment on low-cost and more cost-effective transit alternatives, such as the
conventional bus or Bus Rapid Transit (BRT), because resources are often allocated to light rail
investments. (Wenling, 2006)

Need of Study
Why Such ahuge CapitalIntensive Project???
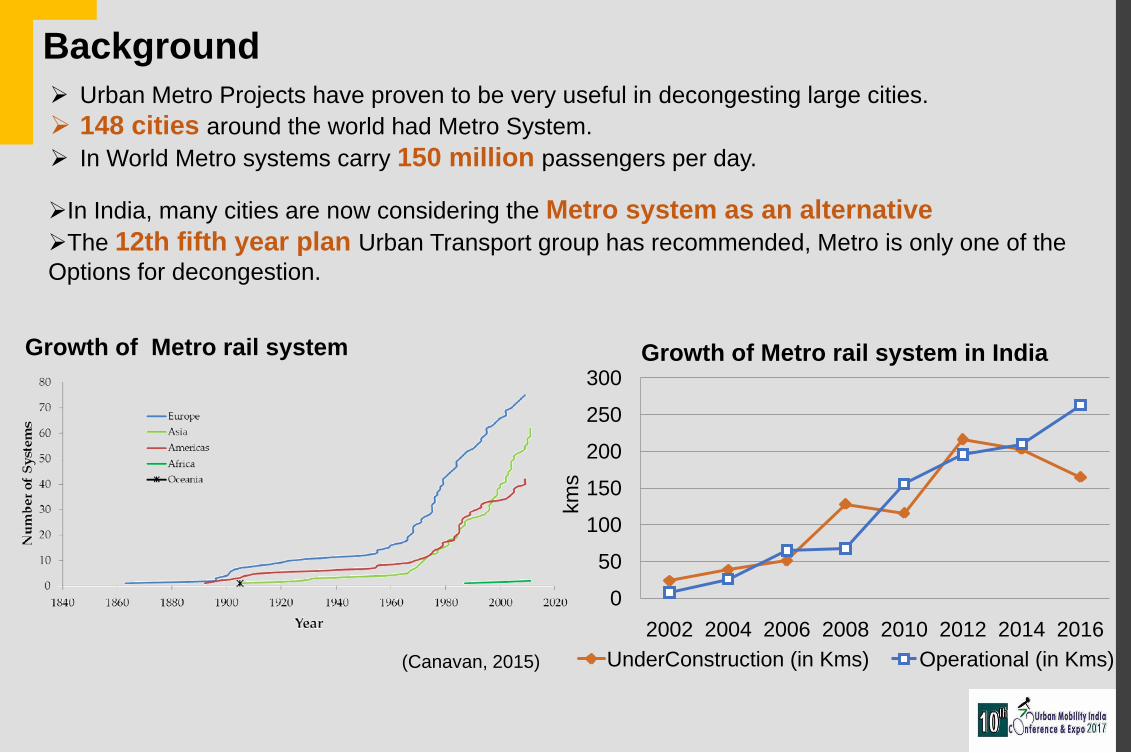
Aim
Objective
Analysis of Metro Rail Project Selection Bias with Principal agent Problem model
To Analyze performance of metro rail project
investments in terms of
objective, ridership, revenue, and capital cost
To identifying the causes of metro rail forecast errors
and its sources
Test the hypothesis through the application of the
Principal-agent problem to Metro rail funding process

Methodology
1.Literature Review
Reviewing papers and Metro rail policy
Decision Making Concept (Economic Behaviour Theory)
Identification of Metro rail Operation Indicators
How to measure Public Transport Operation Performance ?
What Sampling method can be used?
What is impact of principal-agent problem on decision making
process.
2.Need for the studyIdentification of Metro rail failure
reason
Identification of different actor
(s) role in decision process.
3.Process
1.Data Collection(Metro DPRs & Policy documents)2.Converting raw data into graphs
1.Delhphi Method2.Interview with Experts3.Schedule of Survey and Analyzing the questionnaire prepared.
Primary Secondary
Data
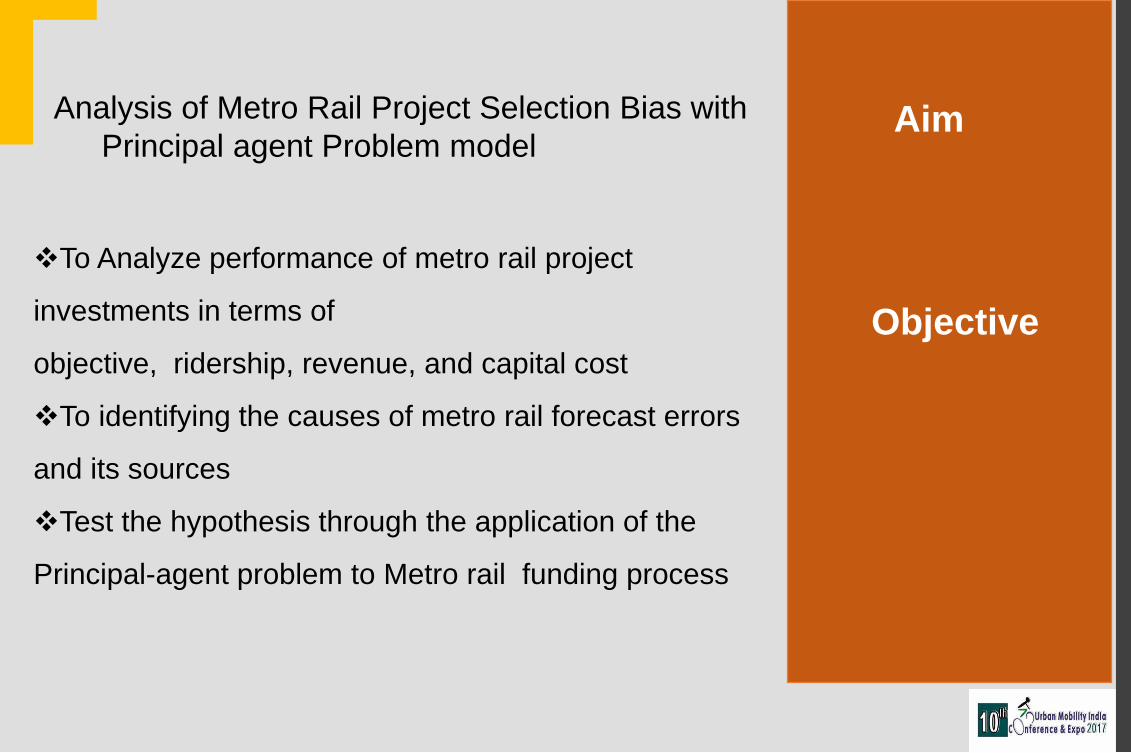
Methodology
4.Comparative Analysis
Preliminary analysis of data
Study the Operation Performance of Metro rail Project (Forecast versus
Actual
Study the forecast errors
Application of Principal-agent model on Metro rail funding policy
5.Conclusion & Suggestion
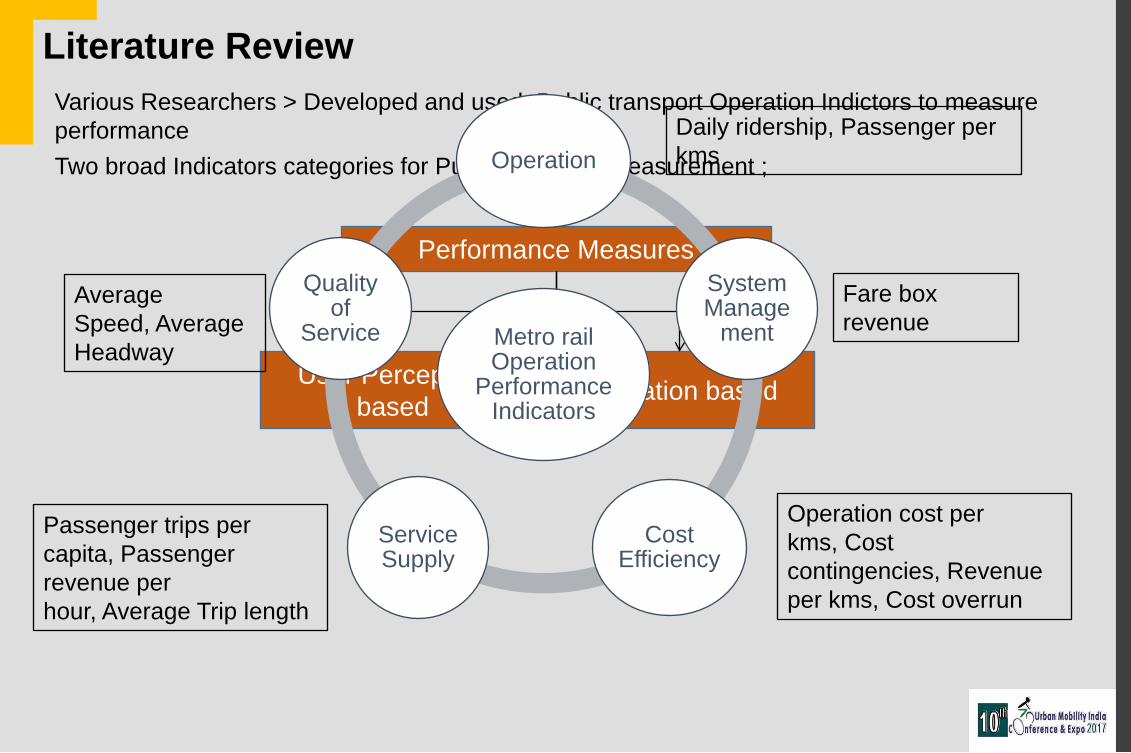
Literature Review
User Perception based Operation based
Performance Measures
Various Researchers > Developed and used Public transport Operation Indictors to measure performanceTwo broad Indicators categories for Public transport measurement ;
Metro rail Operation
Performance Indicators
Operation
System Manage
ment
Cost Efficiency
Service Supply
Quality of
Service
Daily ridership, Passenger per kms
Fare box revenue
Operation cost per kms, Cost contingencies, Revenue per kms, Cost overrun
Passenger trips per capita, Passenger revenue per hour, Average Trip length
Average Speed, Average Headway

Literature Review
Forecast errors in metro rail are attached as followed
Ridership: In Baltimore and Portland, it ranges from 66% to 85% below the original forecasted. (Don H, 1990)
Capital Outlay: The project cost at Pittsburgh’s light rail project were actually 11% below as their actual forecast value, whereas Sacramento’s light rail and Miami metro project is 13% and 106% less than forecast. (Don H, 1990)
Operating Expenses: In case of Buffo’s Light rail (12%), Washington (200%), Atlanta (200%) and Miami’s metro project (84%) above their foreseen level. (Don H, 1990)
Cost-Effectiveness: In case of Zeytinburnu-˘gcılar Tramway cost effectiveness 58% higher than estimated. (Ozge, 2011).
Contingency allowance to cover cost escalation: The contingency allowance for -rail project is ranging from 5 to 10% of estimated project costs. (Don H, 1990)

Theory Strengths (Regarding the Research Problem)
Weaknesses (Regarding the Research Problem)
Game Theory Mathematical derivation of recommendations regarding interdependent choices and actions,
• Highly restricted viewpoint requires scenario modelling
Institutional Theory Defines coercive, normative and mimetic pressures that lead to the sustainable behaviour of organizations
• Lack of understanding of non-conforming organizational behaviour
• provides no explanations for incentive mechanism design
Network Theory Descriptive character that may be used to map the interplay between MoUD and Local authority regarding sustainable funding mechanisms
• Lack of theoretical foundation and explanatory power of mapped interplay
Resource-Based View
Insights into the capabilities and resources that are required to achieve competitive.
• Lack of explanatory power regarding incentive mechanisms
Application of Organisation theories on Research

Theory Strengths (Regarding the Research Problem)
Weaknesses (Regarding the Research Problem)
Transaction Cost Economics
Concerns internal and external costs that result from the sustainable behaviour of local authority
• Dominance of transaction costs
• No explanations for incentive mechanism design
Principal-Agent Theory / Agency Theory
• Structure of the design of incentive mechanisms regarding information asymmetries and agency problems (ex-ante and ex-post contract)
• Derivation of recommendations for incentive design with respect to the suggestions of agency theory
• Restricted view on static MoUD and local authority relationships terminate of efficiency objectives and opportunistic behaviour that may conflict with legitimacy-driven sustainable behaviour
Strategic Choice Theory
Insights into the development of interorganizational sustainability strategies
• Dominance of strategic decisions
• No explanations for incentive mechanism design
Stakeholder Theory
Explanatory theory that maps the interplay of markets and resources , explains sustainable behaviour as a consequence of stakeholder pressures
No explanations for incentive mechanism design

Case study : Delhi,Bangalore,Mumbai ,Jaipur and Chennai
Analysis
1st Objective: To Analyze performance of metro rail project investments in terms of objective, ridership, revenue, and capital cost
2nd Objective :To identifying the causes of metro rail forecast errors and its sources
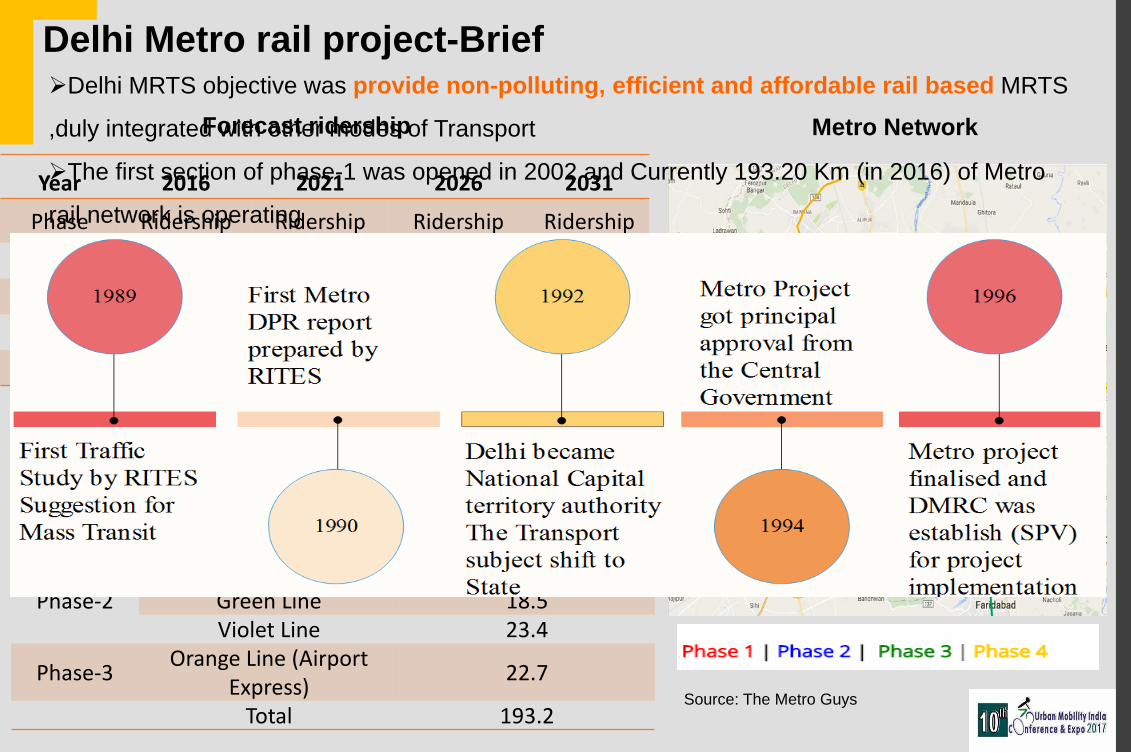
Delhi Metro rail project-Brief
Forecast ridership
Year 2016 2021 2026 2031
Phase Ridership Ridership Ridership Ridership
Phase-1 589234 696458 814698 948988Phase-2 1505038 1835994 2146550 2472714Phase-3 18556426 2300542 2719146 3141264
Total 3950698 4832994 5680394 6562966
Developed Network
Phase Lines Name Length in Km
Phase-1Red Line 25.1
Yellow Line 44.9Blue Line (3) 49.9
Phase-2Blue Line (4) 8.7Green Line 18.5Violet Line 23.4
Phase-3 Orange Line (Airport Express) 22.7
Total 193.2
Metro Network
Source: The Metro Guys
Delhi MRTS objective was provide non-polluting, efficient and affordable rail based MRTS
,duly integrated with other modes of Transport
The first section of phase-1 was opened in 2002 and Currently 193.20 Km (in 2016) of Metro
rail network is operating
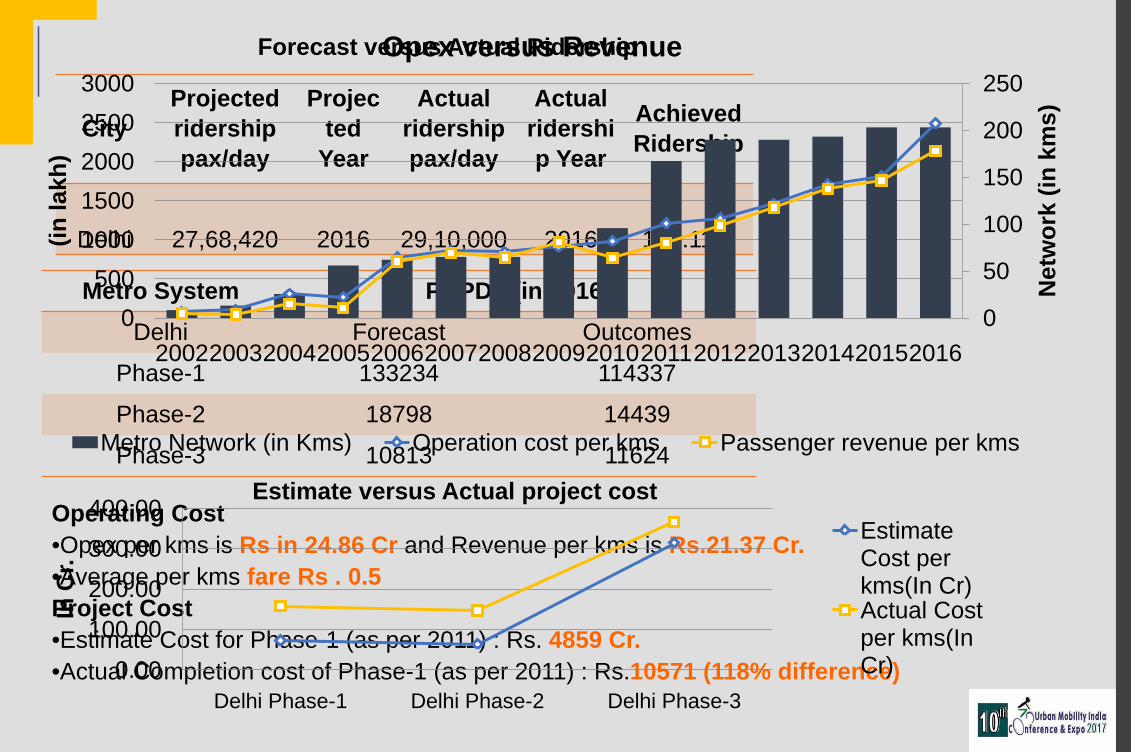
Forecast versus Actual Ridership
CityProjected ridership pax/day
Projected
Year
Actual ridership pax/day
Actual ridership Year
Achieved Ridership
Delhi 27,68,420 2016 29,10,000 2016 105.11%
Metro System PHPDT (in 2016)Delhi Forecast Outcomes
Phase-1 133234 114337
Phase-2 18798 14439
Phase-3 10813 11624
Operating Cost•Opex per kms is Rs in 24.86 Cr and Revenue per kms is Rs.21.37 Cr.•Average per kms fare Rs . 0.5Project Cost•Estimate Cost for Phase-1 (as per 2011) : Rs. 4859 Cr. •Actual Completion cost of Phase-1 (as per 2011) : Rs.10571 (118% difference)
0
50
100
150
200
250
0500
10001500200025003000
200220032004200520062007200820092010201120122013201420152016
Net
wor
k (in
km
s)
(in la
kh)
Opex versus Revenue
Metro Network (in Kms) Operation cost per kms Passenger revenue per kms
0.00
100.00
200.00
300.00
400.00
Delhi Phase-1 Delhi Phase-2 Delhi Phase-3
In C
r.
Estimate versus Actual project costEstimate Cost per kms(In Cr)Actual Cost per kms(In Cr)

Mumbai Metro rail project-BriefThe objective of the metro system was to achieve affordable, safe and environmentally free public transport system.The first section of phase-1 was opened in 2014 and Currently 11.4 Km (in 2016) of Metro rail network is operating Year Daily Ridership
Hourly Ridership PHPDT
2008 475046 38004 17356
2011 513338 41067 185802021 664703 53176 233212031 882533 70603 30491
Corridor Length (Km)Vesova-Andheri-Gahtkopar 15
Colaba-Mahim-Charkop 36Mahim-Munkhurd 12.8
Charkop-Dahisar (east) 7.5Ghatkopar-Mulund 12.4
BKC to kanjurmarg cia Airport 19.5Andheri(east)-Dahisar(east) 18Hutatma Chowk-Ghatkopar 21.8
Sewri-Prabhadevi 3.5
Developed Network
Line -1 | Line -2 | Line-3 | Line -4 | Line -5 | Line -6 | Line -7
Metro NetworkForecasted Ridership
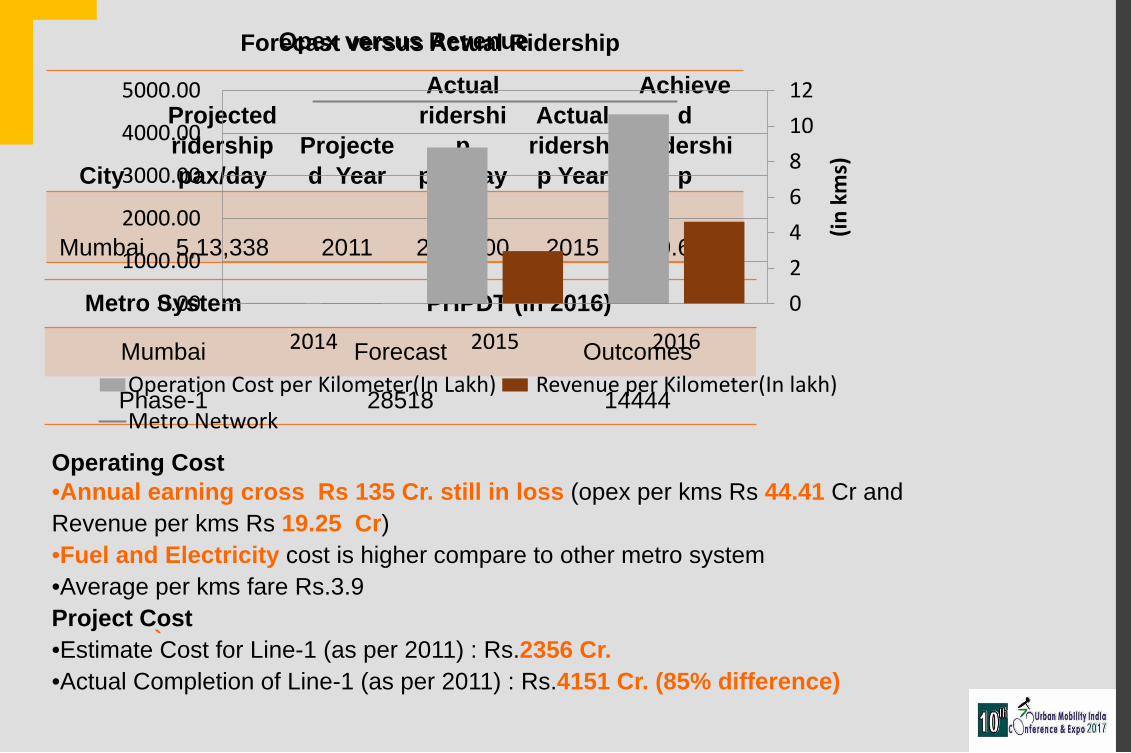
Forecast versus Actual Ridership
City
Projected ridership pax/day
Projected Year
Actual ridershi
p pax/day
Actual ridership Year
Achieved
Ridership
Mumbai 5,13,338 2011 2,60,000 2015 50.65%
Metro System PHPDT (in 2016)
Mumbai Forecast Outcomes
Phase-1 28518 14444
Operating Cost•Annual earning cross Rs 135 Cr. still in loss (opex per kms Rs 44.41 Cr and Revenue per kms Rs 19.25 Cr)•Fuel and Electricity cost is higher compare to other metro system•Average per kms fare Rs.3.9 Project Cost•Estimate Cost for Line-1 (as per 2011) : Rs.2356 Cr.•Actual Completion of Line-1 (as per 2011) : Rs.4151 Cr. (85% difference)
`
024681012
0.00
1000.00
2000.00
3000.00
4000.00
5000.00
2014 2015 2016
(in k
ms)
Operation Cost per Kilometer(In Lakh) Revenue per Kilometer(In lakh)Metro Network
Opex versus Revenue

Jaipur Metro rail project-BriefThe objective for metro system is to provide fast, safe and haste free movement of the public in the city.The first section of phase-1 was opened in 2015 and Currently 9.3 Km (in 2016) of Metro rail network is operating
Forecast Ridership
Year CorridorSectional
Load(PHPDT)
Daily Riders (in
lakhs)2014 Mansarovar-Badi Chaupar 11264 2.1
2021 Mansarovar-Badi Chaupar 16376 2.9
2031 Mansarovar-Badi Chaupar 27750 4.2
2014 Sitapura Industrial Area-Ambabari 12901 3.2
2021 Sitapura Industrial Area-Ambabari 18683 4.9
2031 Sitapura Industrial Area-Ambabari 22429 6.8Developed Network
Description Underground (km)
Elevated (km)
Total (km)
E-W Mansarovar to BadiChaupar 2.789 9.278 12.067
Sitapura Industrial Area to Ambabari 5.095 18.004 23.099
Phase-1Phase -2 c
Metro Network

City
Projected ridership pax/day
Projected Year
Actual ridership pax/day
Actual ridership
YearAchieved Ridership
Jaipur 2,10,000 2014 25,486 2016 12.14%
Metro System PHPDT (in 2016 )
Jaipur Forecast Outcomes
Phase-1 13125 1850
Operating Cost•Opex per kms Rs12.21 Cr and Revenue per kms Rs 2.83 Cr•Fuel and Electricity cost is higher compare to other cost•Average per kms fare Rs.1.6Project Cost•Estimate Cost for Phase-1A (as per 2011) : Rs.3149 Cr.•Actual Completion cost of Phase-1A (as per 2011) : Rs.5000 Cr (59% difference)
0
2
4
6
8
10
12
0.00
200.00
400.00
600.00
800.00
1000.00
1200.00
1400.00
2015 2016
kms
Operation Cost per Kilometer(In Lakh)Passenger revenue per Kilometer(In lakh)Metro Network(in kms)
Operation versus Revenue
0100020003000400050006000
2012-13 2013-14 2014-15 2015-16 2016-17
Estimated Cost at April 2011 (in Cr.)
Estimate versus Actual project cost
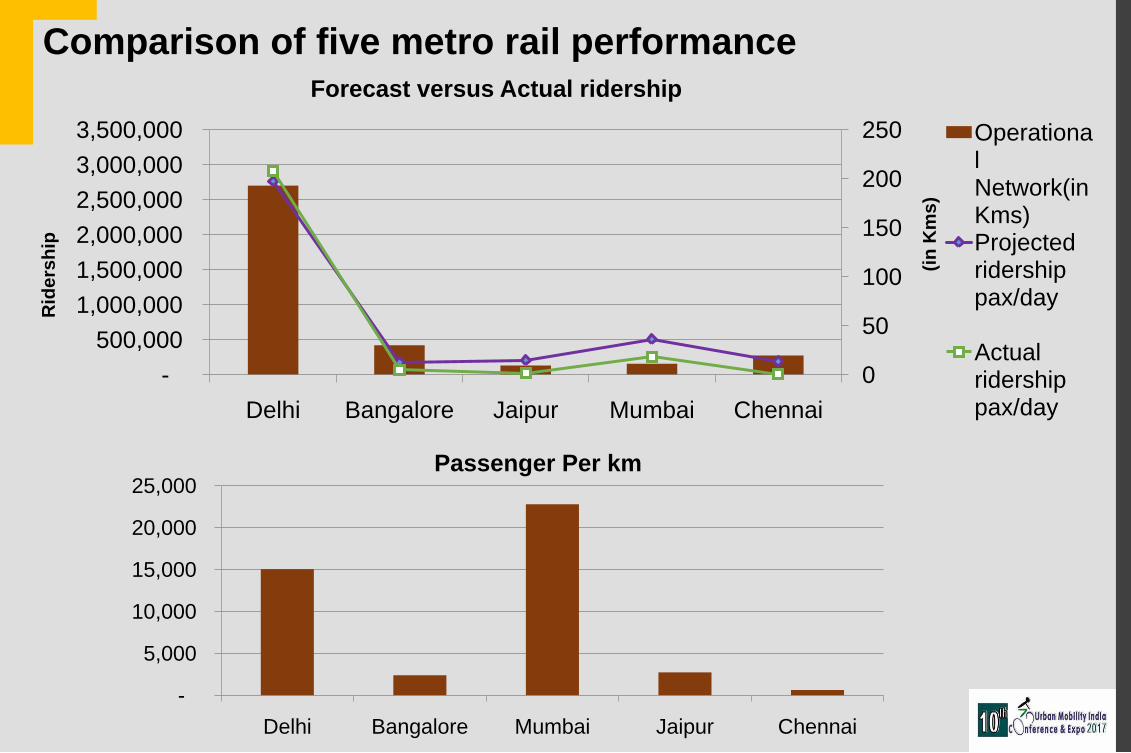
Forecast versus Actual ridership
-
5,000
10,000
15,000
20,000
25,000
Delhi Bangalore Mumbai Jaipur Chennai
Passenger Per km
Comparison of five metro rail performance
0
50
100
150
200
250
-500,000
1,000,000 1,500,000 2,000,000 2,500,000 3,000,000 3,500,000
Delhi Bangalore Jaipur Mumbai Chennai
(in K
ms)
Rid
ersh
ip
Operational Network(in Kms)Projected ridership pax/day
Actual ridership pax/day

Comparison of five metro rail performance
Project (Country) No. of
projects (N)
Quartiles
(25/50/75%)
Average difference
(%)
Standard deviation
India (2016) 5 -49/-88/-93 -58.56 39.34 Europe (2007) 6 -29/-4/45 -20.7 77.30
North America (2007) 10 -69/-63/-53 -60.0 17.0
Ridership Comparison
0.0050.00100.00150.00200.00250.00300.00350.00
0.001000.002000.003000.004000.005000.006000.007000.00
DMRC BMRCL JMRCL CMRL MMRC
(in la
kh)
(in la
kh)
Metro rail Operation Cost
Operational Cost (in lakh) Employ expence (in lakh)Other Expence (in lakh) Fuel & Electricity cost (in lakh)Facilities Managment Services (in lakh)

Comparison of five metro rail performance
Project (Country) No. of projects (N)
Quartiles (25/50/75%)
Average difference (%)
Standard deviation
India (2016) 5 33/51/70 30.21 25.18
Europe (2008) 6 39/45/57 43.30 21.30 North America (2008) 10 33/42/54 35.80 30.40
0
20
40
60
80
100
120
140
0.0050.00
100.00150.00200.00250.00300.00350.00400.00450.00
Delhi Phase-1
Delhi Phase-2
Delhi Phase-3
Bangalore Mumbai Chennai Jaipur Phase-1
(in K
ms)
Network (in Kms) Estimate Cost per Kilometer(In Cr) Actual Cost Per Kilometer (In Cr)
3rd Objective: Test the hypothesis through the application of the Principal-agent problem to
Metro rail funding process

Principal –Agent problem ModelWhy Principal –agent model ?Structure information asymmetries and principal-agent problem that inherent the inter
relationship between the state and central government regarding the metro rail project selection.
It applied when the private information of agent creates a problem for the Principal.
What is Principal–agent problem ?Conflict objective Adverse selection
Principal–agent problem
Moral hazard

CONFLICT OBJECTIVE
ADVERSE SELECTION
MoUDPrincipal
DDAAgent
Assurance or
Uncertainty Honesty
Lack of coordination between the DMRC and DDA regarding the metro route selectionMaster plan was not referred by DMRC (In 1st phase)Tassel for Metro route alignment
DPR report by RITES (data not cross check by DDA)Forecast and Actual result of metro is biased “ The fact that transport modelling for ridership was not carried out accurately by RITES”The statement of ridership projection isvery high in DelhiHidden agendaManifesto of P liti i
MORAL HAZARD
DDA proposed Dwaraka sector-21 corridor (DMRC refuse, Traffic study result not supported for MRTS)Forecast ridership changed 3 timesTwo metro corridor was closed (ridership result was not efficient)
Principal-agent Model-A case of Delhi Metro
Delhi Metro
rail

CONFLICT OBJECTIVE
ADVERSE SELECTION
MORAL HAZARD
MoUDPrincipal
MMRDAAgent
Funding Problem (VGF controversy)
Hidden Agenda, Over estimation of Fare and Cost
Weightagebase Metro route selectionAbsence of Social concernin Metro route selection process
Multiple Agency had produced Traffic data (All private Consults)Overlapping InformationTraffic data was not cross check by MMRDAMaster Plan was not preferred in Phase-1
Legal Controversy of Metro act and Tram actDiffused in Fare decision processArgument raised by the private company (MMOPL) that, the project completion cost reached up to 4321 Cr.whereas the original cost estimated in DPR was 2356 Cr. Absence oftransparency in Project Cost
Mumbai Metro rail
Principal-agent Model-A case of Mumbai Metro

CONFLICT OBJECTIVE
ADVERSE SELECTION
MoUDPrincipal
JDAAgent
Controversy for Funding
Political Pressure,Refused for JV model
Modern Technology for Traffic solution rather than adopting hierarchy of Transport mode as per requirementPolitical promise and Biased for Mass transit systemClient Based Consults, e.g Inflated Ridership and less capital investmentMetro board chairmanship conflict
Absence of Alternative Transport Plan (Prepaid by Wilbur smith Associates)No coordination between the JMRCL and JDA regarding the Metro route selectionNo Master Plan and JDA involved in MRTS route selection processTwo different approaches for Traffic Management by JDA and JMRCL (Asymmetric Information)(e.g during the construction of phase-1, There are historical monuments were found while drillings. This study was not capture in DPR)
JaipurMetro rail
Principal-agent Model-A case of Jaipur Metro

Overview of Principal agent problem
Different ObjectiveHidden Information
(client based consults)
Absence of mass transit alternative
Leapfrog hierarchyManifesto of politician
Cross check result
Lack of Capacity building
Absence of committee to review pre and post
performance
Lack of powerAbsence of Committee
Fare change
Lack of Coordination bwtLocal authority &
SPVAbsence of Land
use transport integration
Lack of governance structure
Conflict in power
Lack of initiative to explore other mode
of fundingMore depending on
JV model
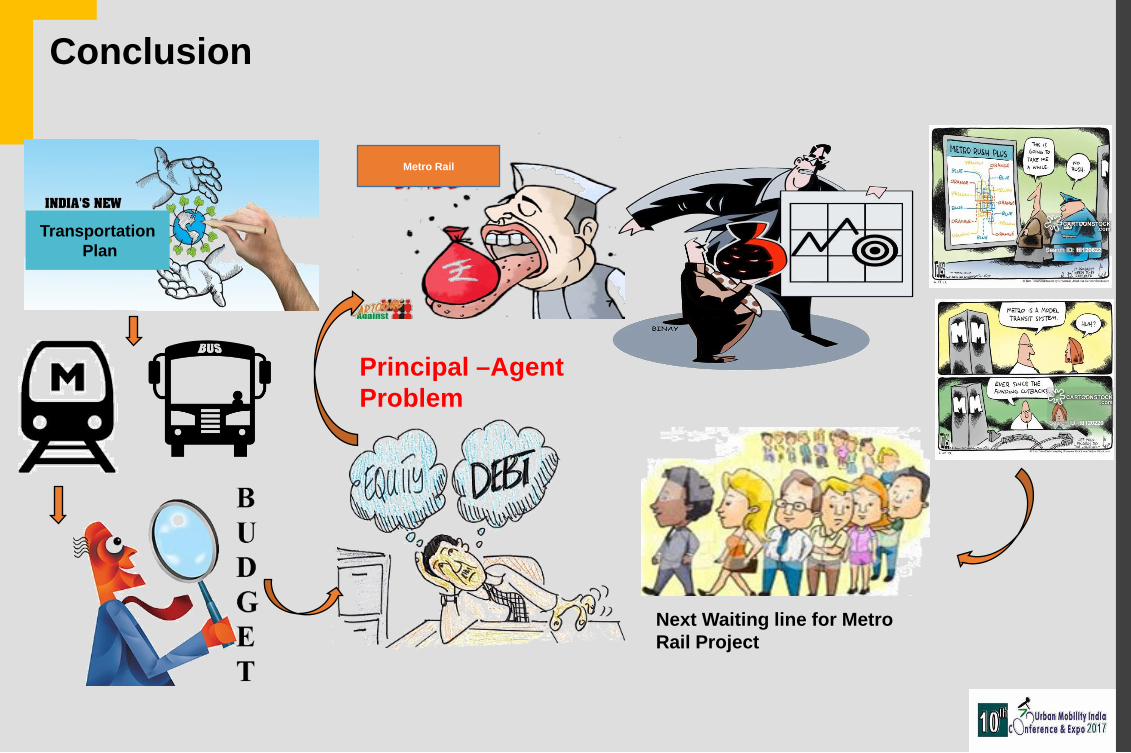
Conclusion
TransportationPlan
Metro Rail
Next Waiting line for Metro Rail Project
Principal –Agent Problem
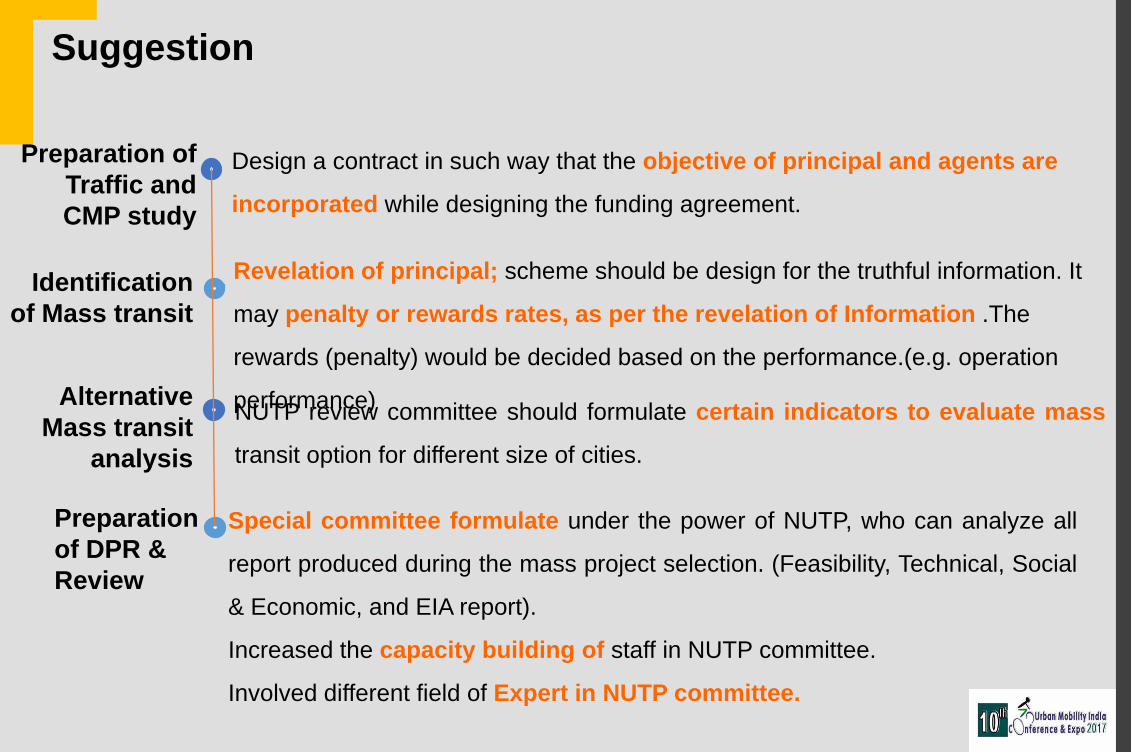
Design a contract in such way that the objective of principal and agents are
incorporated while designing the funding agreement.
Preparation of Traffic and CMP study
Identification of Mass transit
Revelation of principal; scheme should be design for the truthful information. It
may penalty or rewards rates, as per the revelation of Information .The
rewards (penalty) would be decided based on the performance.(e.g. operation
performance) Alternative Mass transit
analysis
NUTP review committee should formulate certain indicators to evaluate mass
transit option for different size of cities.
Preparation of DPR & Review
Special committee formulate under the power of NUTP, who can analyze all
report produced during the mass project selection. (Feasibility, Technical, Social
& Economic, and EIA report).
Increased the capacity building of staff in NUTP committee.
Involved different field of Expert in NUTP committee.
Suggestion
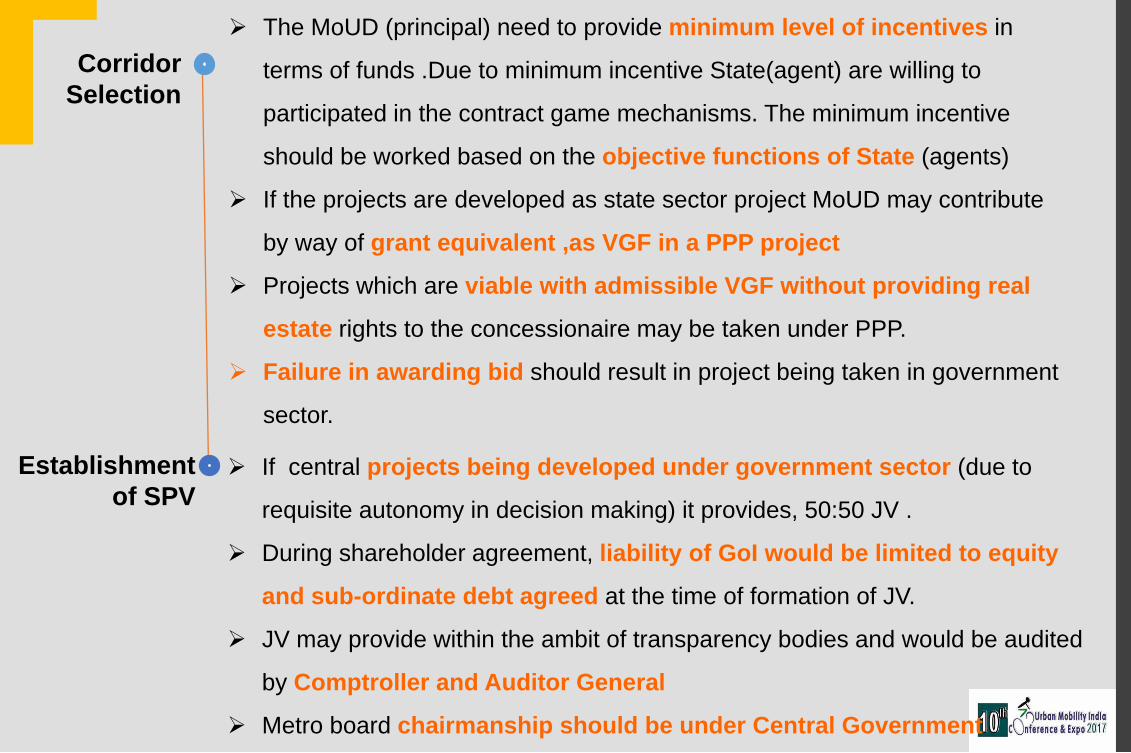
The MoUD (principal) need to provide minimum level of incentives in
terms of funds .Due to minimum incentive State(agent) are willing to
participated in the contract game mechanisms. The minimum incentive
should be worked based on the objective functions of State (agents)
If the projects are developed as state sector project MoUD may contribute
by way of grant equivalent ,as VGF in a PPP project
Projects which are viable with admissible VGF without providing real
estate rights to the concessionaire may be taken under PPP.
Failure in awarding bid should result in project being taken in government
sector.
Establishment of SPV
If central projects being developed under government sector (due to
requisite autonomy in decision making) it provides, 50:50 JV .
During shareholder agreement, liability of GoI would be limited to equity
and sub-ordinate debt agreed at the time of formation of JV.
JV may provide within the ambit of transparency bodies and would be audited
by Comptroller and Auditor General
Metro board chairmanship should be under Central Government
Corridor Selection

Thank You