Analysis of Large-Scale Cell Phone Networks 10-802 Course Project Leman Akoglu Bhavana Dalvi Skyler...
46
Analysis of Large-Scale Cell Phone Networks 10-802 Course Project Leman Akoglu Bhavana Dalvi Skyler Speakman April 22 2010
-
date post
19-Dec-2015 -
Category
Documents
-
view
219 -
download
2
Transcript of Analysis of Large-Scale Cell Phone Networks 10-802 Course Project Leman Akoglu Bhavana Dalvi Skyler...
Analysis of Large-Scale Cell Phone Networks
10-802 Course Project Leman AkogluBhavana Dalvi
Skyler Speakman
April 22 2010
Analysis of Large-Scale Cell Phone Networks
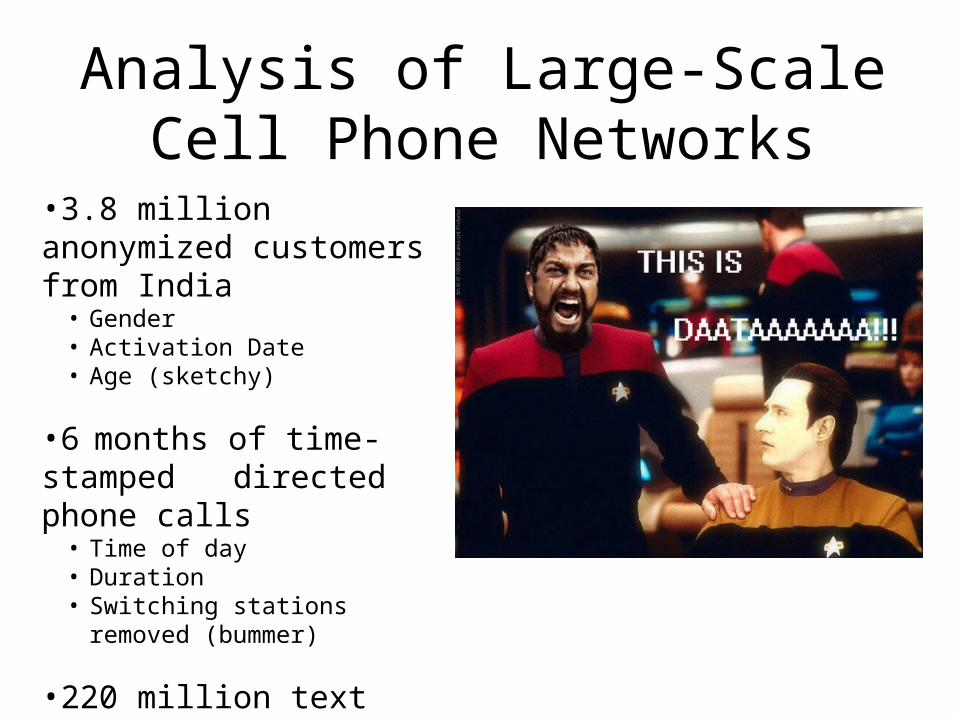
•3.8 million anonymized customers from India• Gender• Activation Date• Age (sketchy)
•6 months of time-stamped directed phone calls• Time of day• Duration• Switching stations removed
(bummer)
•220 million text messages • Time of day
Analysis of Large-Scale Cell Phone Networks
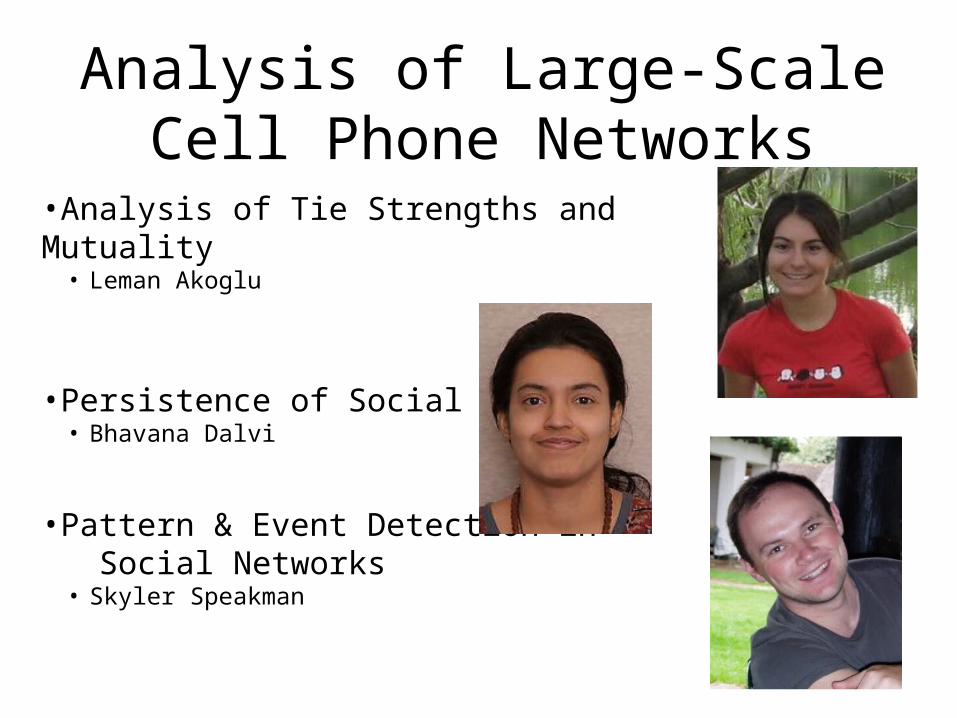
•Analysis of Tie Strengths and Mutuality• Leman Akoglu
•Persistence of Social Ties• Bhavana Dalvi
•Pattern & Event Detection in Social Networks• Skyler Speakman

Analysis of Ties in Composite NetworksLink Prediction in Large SMS+CALL Networks
Presented by Leman AkogluApril 22, 2010
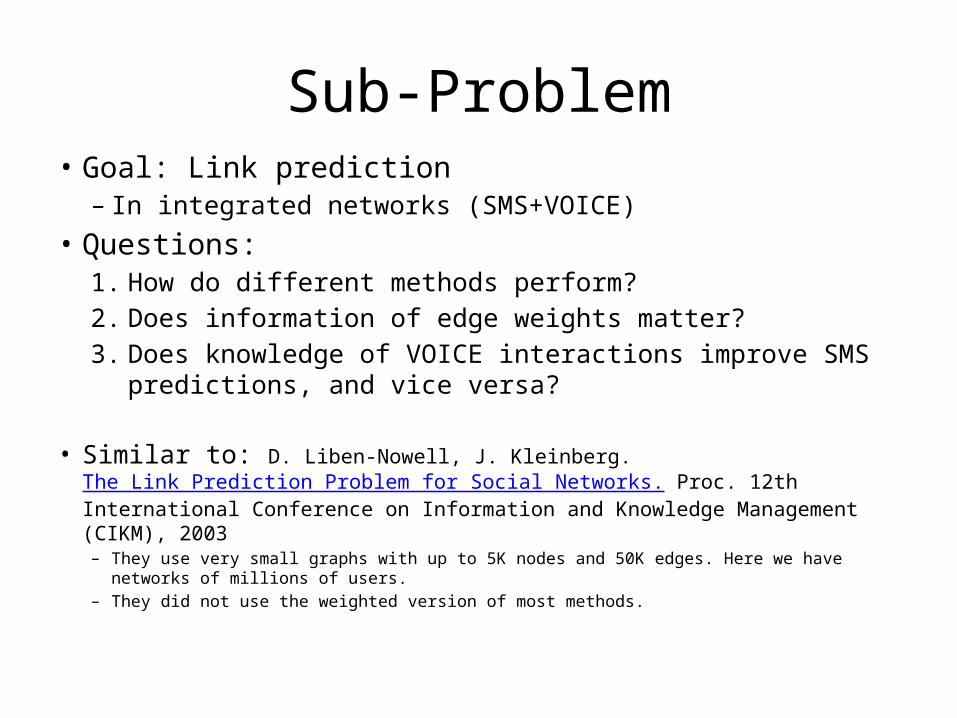
Sub-Problem• Goal: Link prediction
– In integrated networks (SMS+VOICE)• Questions:
1. How do different methods perform?2. Does information of edge weights matter?3. Does knowledge of VOICE interactions improve SMS
predictions, and vice versa?
• Similar to: D. Liben-Nowell, J. Kleinberg. The Link Prediction Problem for Social Networks. Proc. 12th International Conference on Information and Knowledge Management (CIKM), 2003– They use very small graphs with up to 5K nodes and 50K edges. Here we have networks of millions of
users.– They did not use the weighted version of most methods.
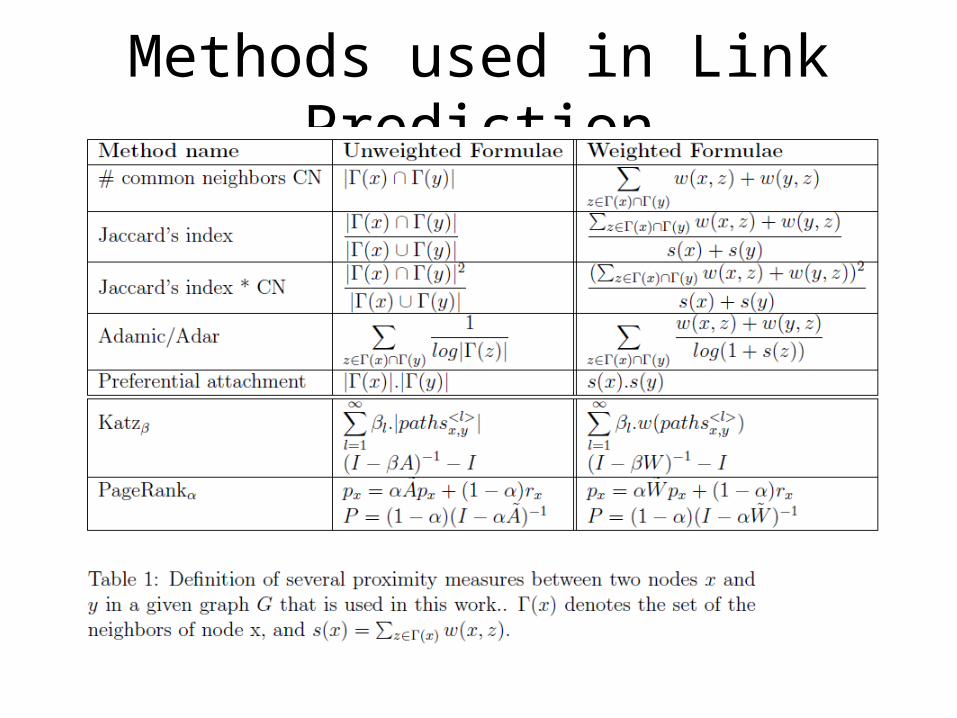
Methods used in Link Prediction
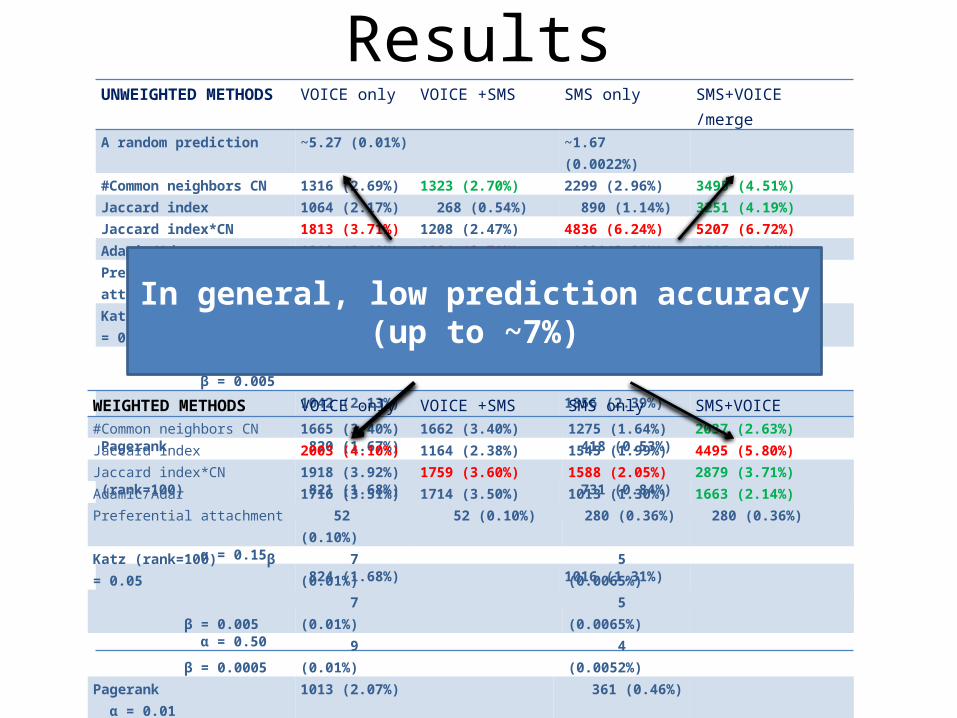
ResultsUNWEIGHTED METHODS VOICE only VOICE +SMS SMS only SMS+VOICE /mergeA random prediction ~5.27 (0.01%) ~1.67 (0.0022%)#Common neighbors CN 1316 (2.69%) 1323 (2.70%) 2299 (2.96%) 3495 (4.51%)Jaccard index 1064 (2.17%) 268 (0.54%) 890 (1.14%) 3251 (4.19%)Jaccard index*CN 1813 (3.71%) 1208 (2.47%) 4836 (6.24%) 5207 (6.72%)Adamic/Adar 1318 (2.69%) 1324 (2.71%) 1821(2.35%) 3597 (4.64%)Preferential attachment 63 (0.12%) 63 (0.12%) 577 (0.74%) 572 (0.73%)Katz (rank=100) β = 0.05 306 (0.62%) 860 (1.11%) β = 0.005 986 (2.01%) 888 (1.14%) β = 0.0005 1042 (2.13%) 1856 (2.39%) Pagerank α = 0.01 820 (1.67%) 418 (0.53%)(rank=100) α = 0.05 821 (1.68%) 731 (0.84%) α = 0.15 820 (1.67%) 1009 (1.30%) α = 0.30 824 (1.68%) 1016 (1.31%) α = 0.50 830 (1.69%) 999 (1.28%)
WEIGHTED METHODS VOICE only VOICE +SMS SMS only SMS+VOICE#Common neighbors CN 1665 (3.40%) 1662 (3.40%) 1275 (1.64%) 2037 (2.63%)Jaccard index 2003 (4.10%) 1164 (2.38%) 1545 (1.99%) 4495 (5.80%)Jaccard index*CN 1918 (3.92%) 1759 (3.60%) 1588 (2.05%) 2879 (3.71%)Adamic/Adar 1716 (3.51%) 1714 (3.50%) 1013 (1.30%) 1663 (2.14%)Preferential attachment 52 (0.10%) 52 (0.10%) 280 (0.36%) 280 (0.36%)Katz (rank=100) β = 0.05 7 (0.01%) 5 (0.0065%) β = 0.005 7 (0.01%) 5 (0.0065%) β = 0.0005 9 (0.01%) 4 (0.0052%)Pagerank α = 0.01 1013 (2.07%) 361 (0.46%)(rank=100) α = 0.05 1014 (2.07%) 377 (0.48%) α = 0.15 1014 (2.07%) 459 (0.59%) α = 0.30 1016 (2.07%) 569 (0.73%) α = 0.50 1017 (2.08%) 657 (0.84%)
In general, low prediction accuracy (up to ~7%)
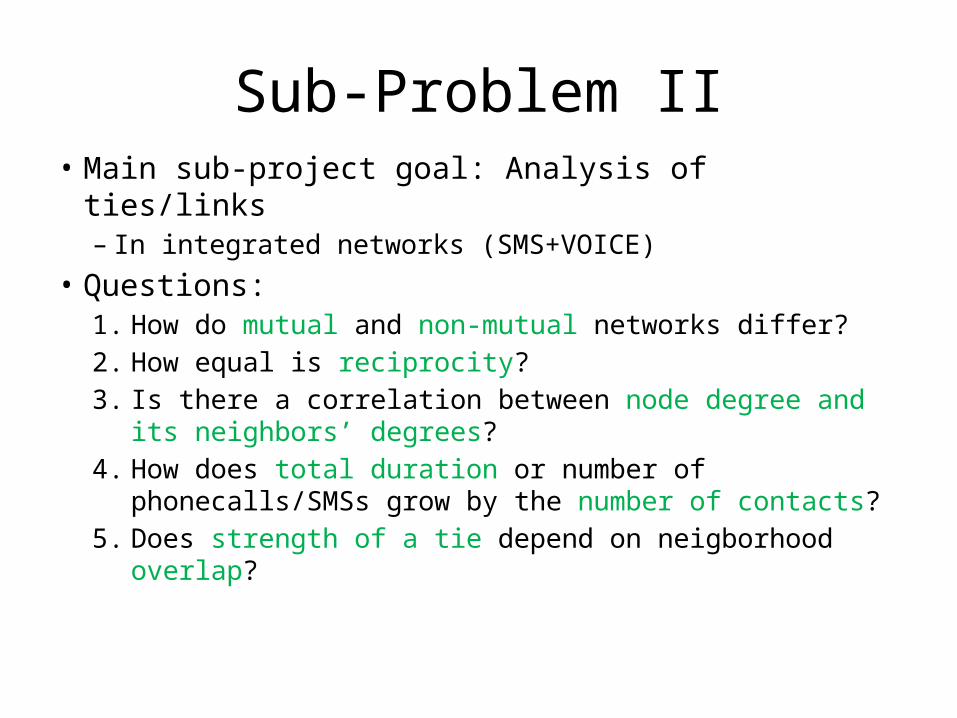
Sub-Problem II• Main sub-project goal: Analysis of ties/links– In integrated networks (SMS+VOICE)
• Questions:1. How do mutual and non-mutual networks differ?2. How equal is reciprocity?3. Is there a correlation between node degree and its
neighbors’ degrees?4. How does total duration or number of phonecalls/SMSs
grow by the number of contacts?5. Does strength of a tie depend on neigborhood overlap?

1. How do mutual and non-mutual networks differ?
SMS PHONECALL
0.3
In the mutual network of SMS, 70% of the nodes become singletons!

2. How equal is reciprocity?
SMS PHONECALL
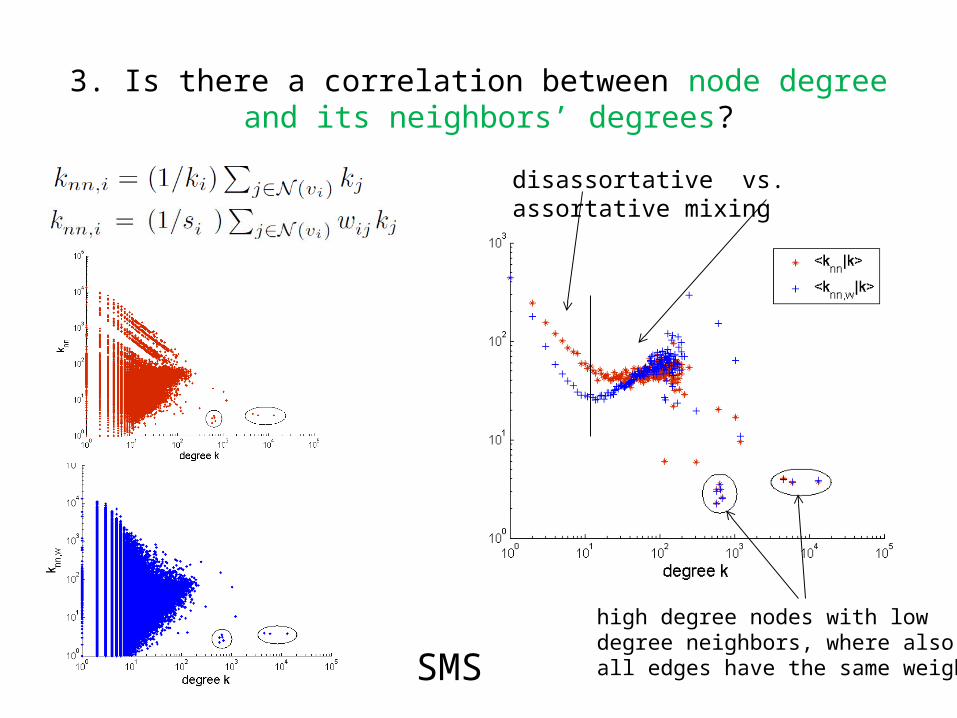
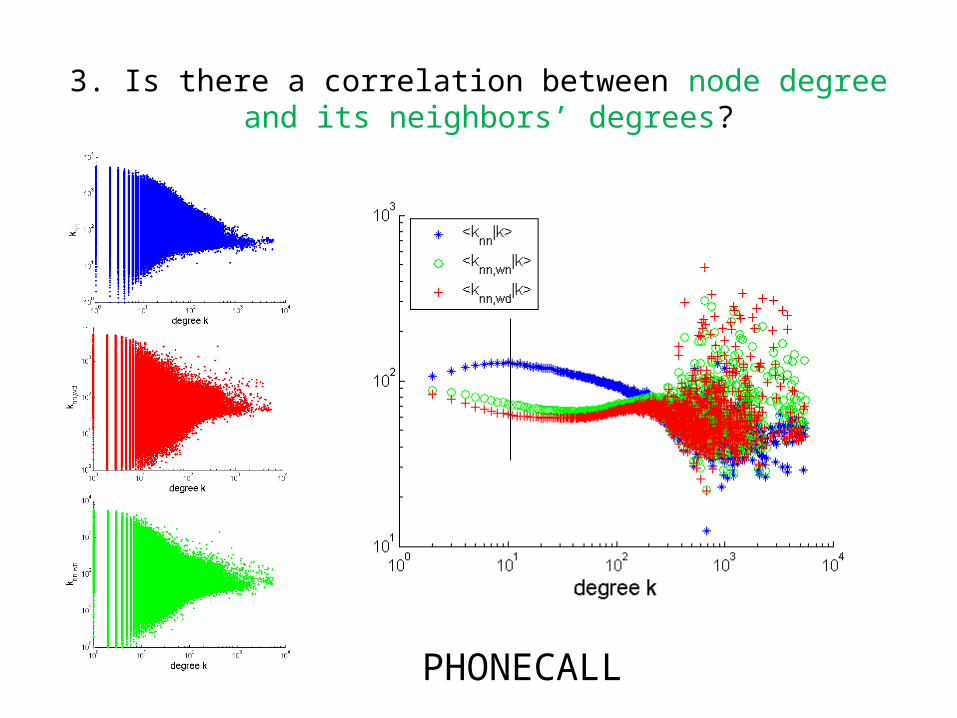
3. Is there a correlation between node degree and its neighbors’ degrees?
SMS
disassortative vs. assortative mixing
high degree nodes with lowdegree neighbors, where alsoall edges have the same weight.
3. Is there a correlation between node degree and its neighbors’ degrees?
PHONECALL
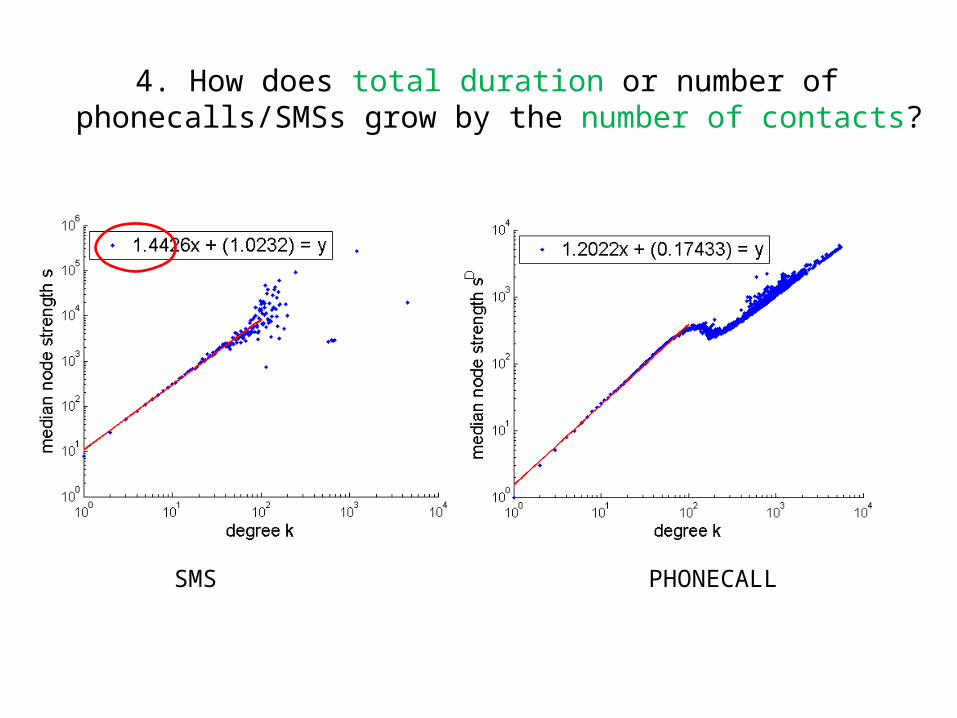
4. How does total duration or number of phonecalls/SMSs grow by the number of contacts?
SMS PHONECALL

5. Does strength of a tie depend on neigborhood overlap?SM
S
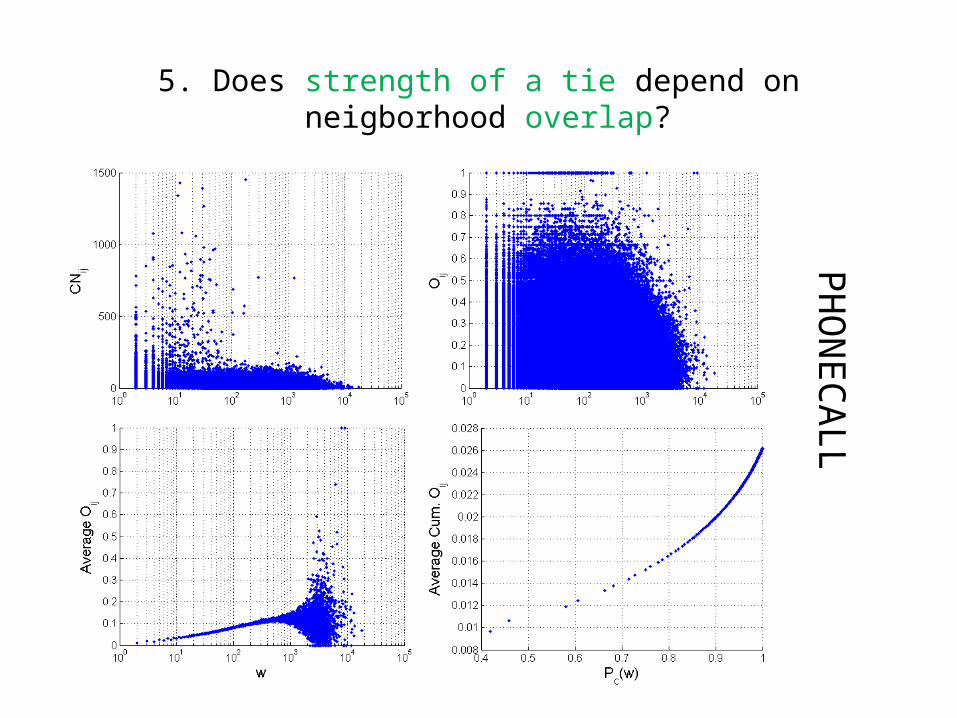
5. Does strength of a tie depend on neigborhood overlap?PH
ON
ECALL

CONCLUSIONS:1. How do mutual and non-mutual networks differ?
• There is far less mutuality in the SMS network.2. Is reciprocity balanced?
• Yes, balanced and small reciprocity is more common.3. Is there a correlation between node degree and its neighbors’
degrees?• Yes, degree of a node and avg. degree of its neighbors have
an assortative mixing for nodes of degree>~10.4. How does total duration or number of phonecalls/SMSs grow
by the number of contacts?• Total node strength grows super-linearly (power-law) by
increasing degree.5. Does strength of a tie depend on neigborhood overlap?
• Yes, tie strength increases by increasing neighborhood overlap on average.
Network Structure and Tie Persistence in mobile network
Bhavana Dalvi

Goal
• Predict which of the existing ties will survive?• Questions : – Which link features matter?– Which node features matter?– How are they correlated to each other?– Which prediction method to use?
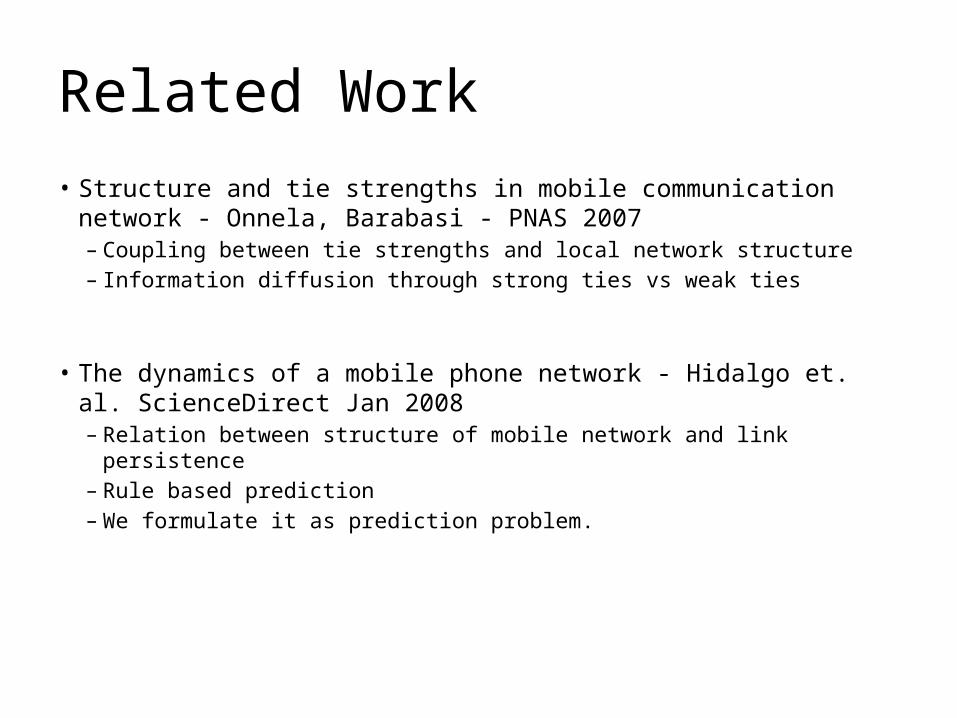
Related Work• Structure and tie strengths in mobile communication network - Onnela,
Barabasi - PNAS 2007– Coupling between tie strengths and local network structure– Information diffusion through strong ties vs weak ties
• The dynamics of a mobile phone network - Hidalgo et. al. ScienceDirect
Jan 2008– Relation between structure of mobile network and link persistence– Rule based prediction– We formulate it as prediction problem.
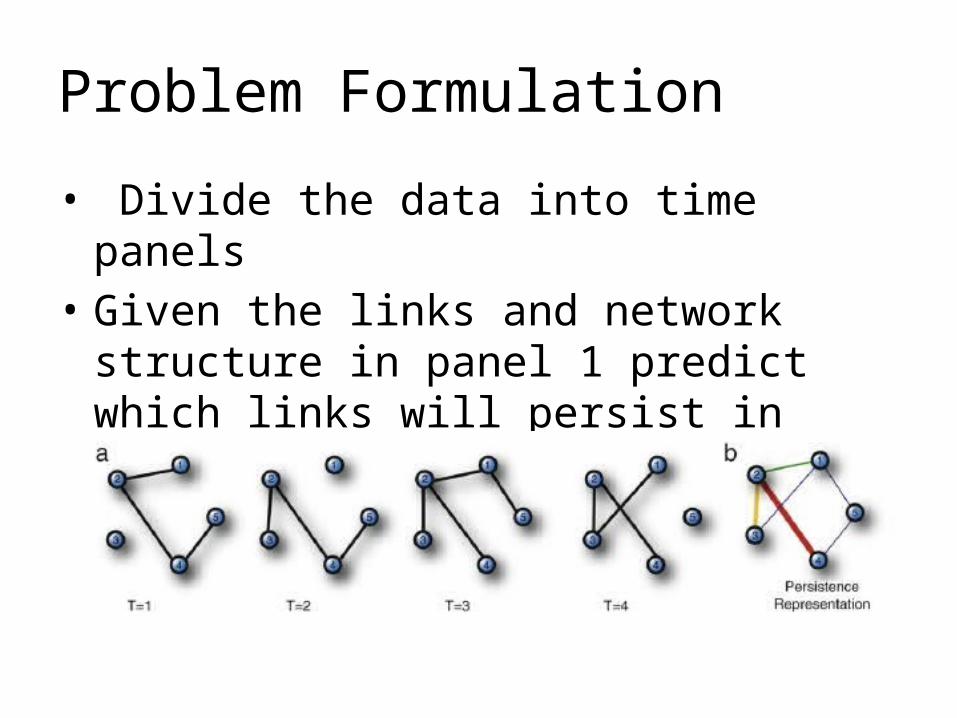
Problem Formulation
• Divide the data into time panels • Given the links and network structure in panel
1 predict which links will persist in panels 2,3,4 etc.
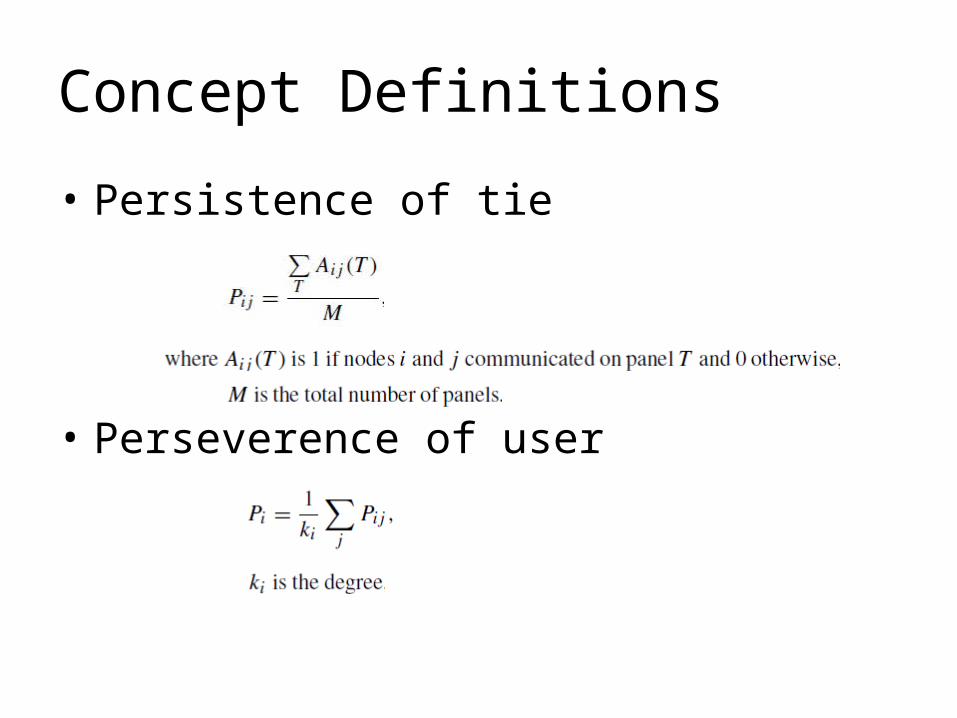
Concept Definitions
• Persistence of tie
• Perseverence of user
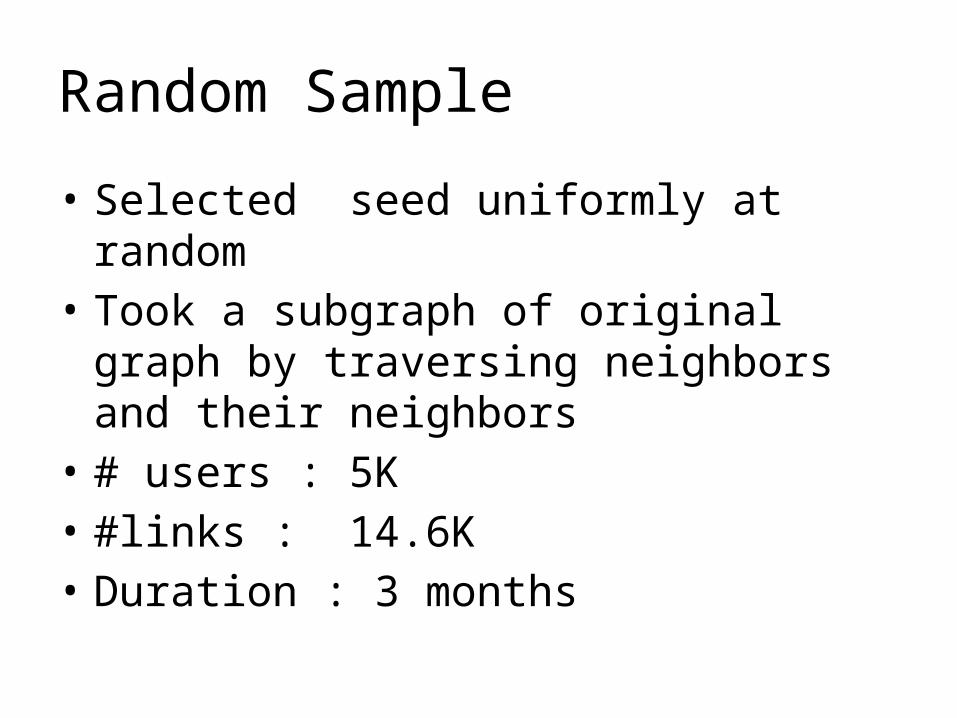
Random Sample
• Selected seed uniformly at random• Took a subgraph of original graph by traversing
neighbors and their neighbors• # users : 5K• #links : 14.6K• Duration : 3 months
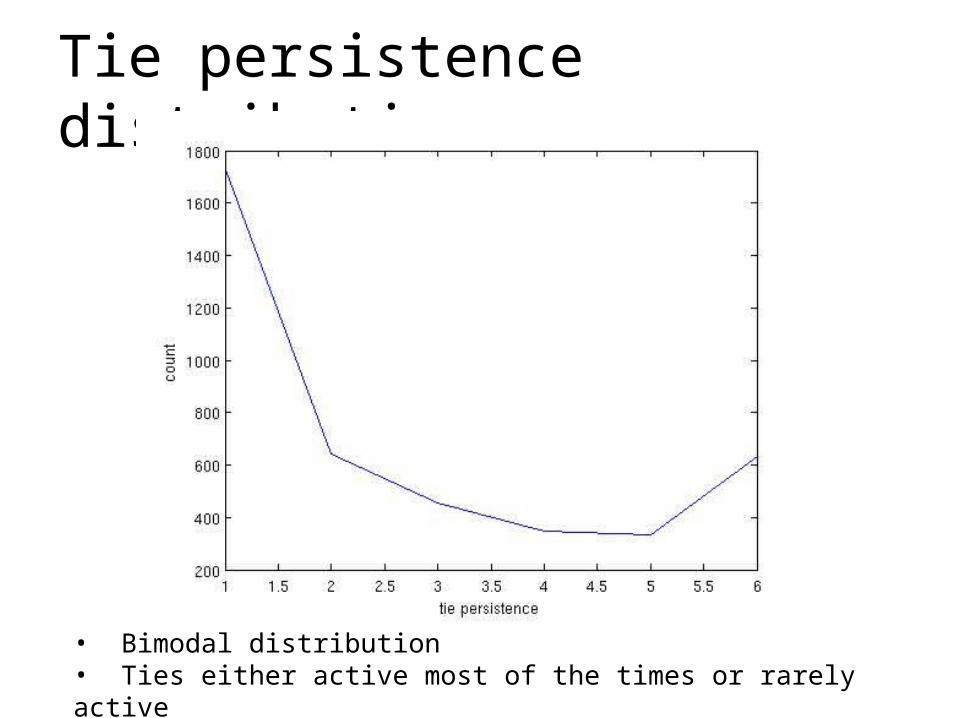
Tie persistence distribution
• Bimodal distribution• Ties either active most of the times or rarely active
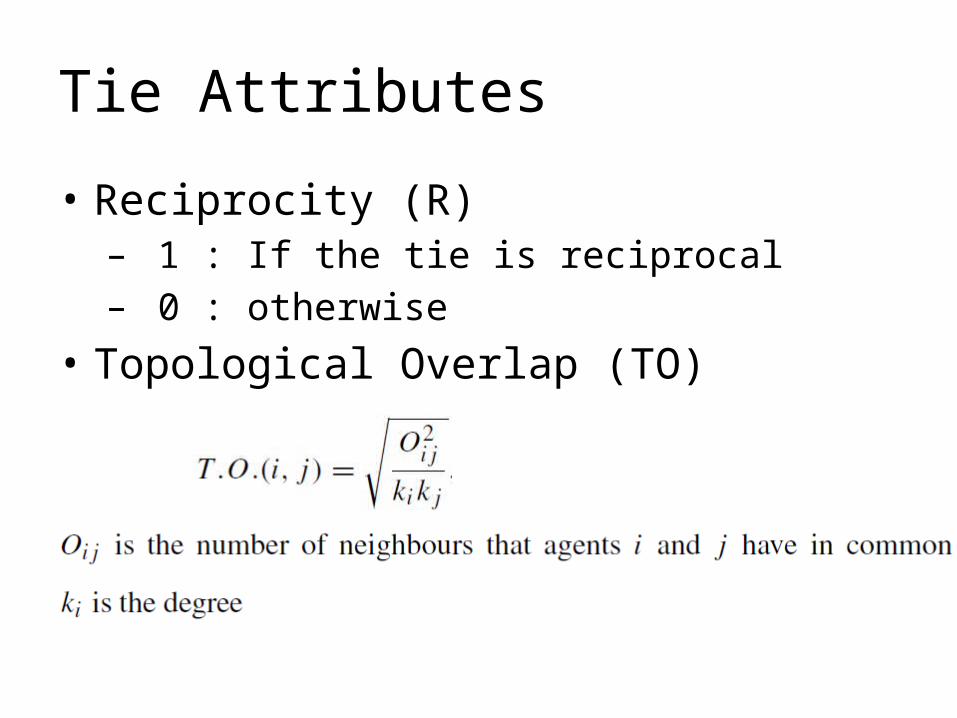
Tie Attributes
• Reciprocity (R)– 1 : If the tie is reciprocal – 0 : otherwise
• Topological Overlap (TO)
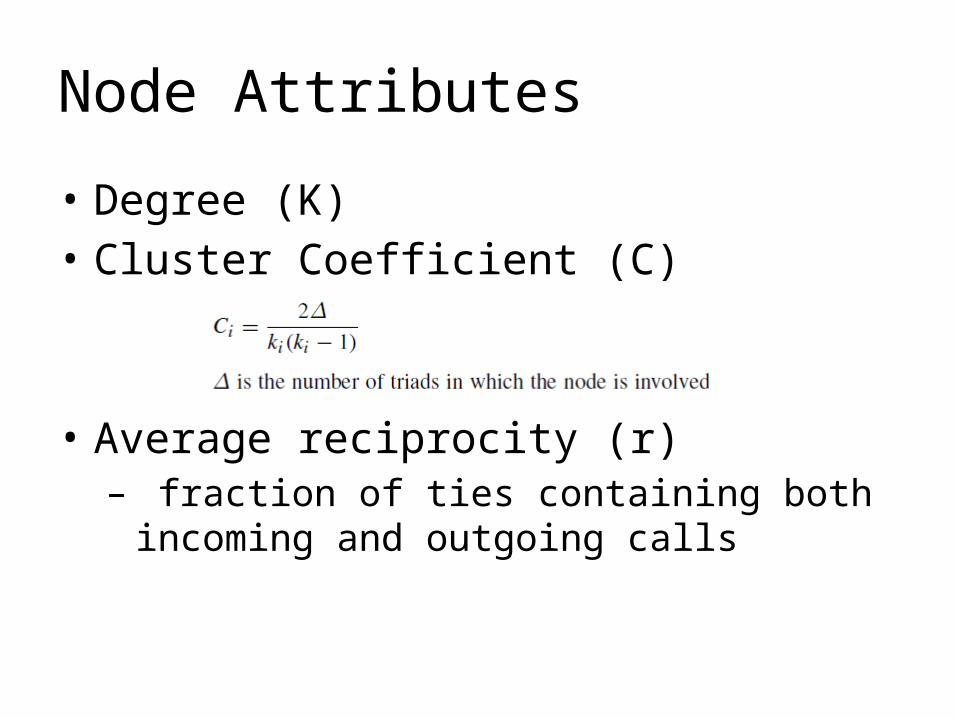
Node Attributes
• Degree (K)• Cluster Coefficient (C)
• Average reciprocity (r)– fraction of ties containing both incoming and
outgoing calls

Pearson Correlation Coefficient
• Measures of dependence between two quantities
Corr(X,Y) = cov(X,Y) var(X) * var(Y)

Tie PersistenceDelta_C Delta_K Delta_r R TO Tie_persistence
Delta_C 1 0.2184 0.1274 -0.1226 -0.0692 -0.0019
Delta_K 1 -0.1271 -0.4083 -0.4087 0.0735
Delta_r 1 0.0835 0.0664 0.0428
R 1 0.4126 0.5064
TO 1 0.2237
Tie_persistence 1

User PerseverenceC K r User_perseverence
C 1 0.0675 0.2740 0.2594
K 1 0.0679 0.0695
r 1 0.3853
User_perseverence 1

Example regression Coefficients for Tie Persistence
• Delta_C : -0.0067• Delta_K : 0.0008• Delta_r : 0.0643• R : 0.5441• TO : 0.2311
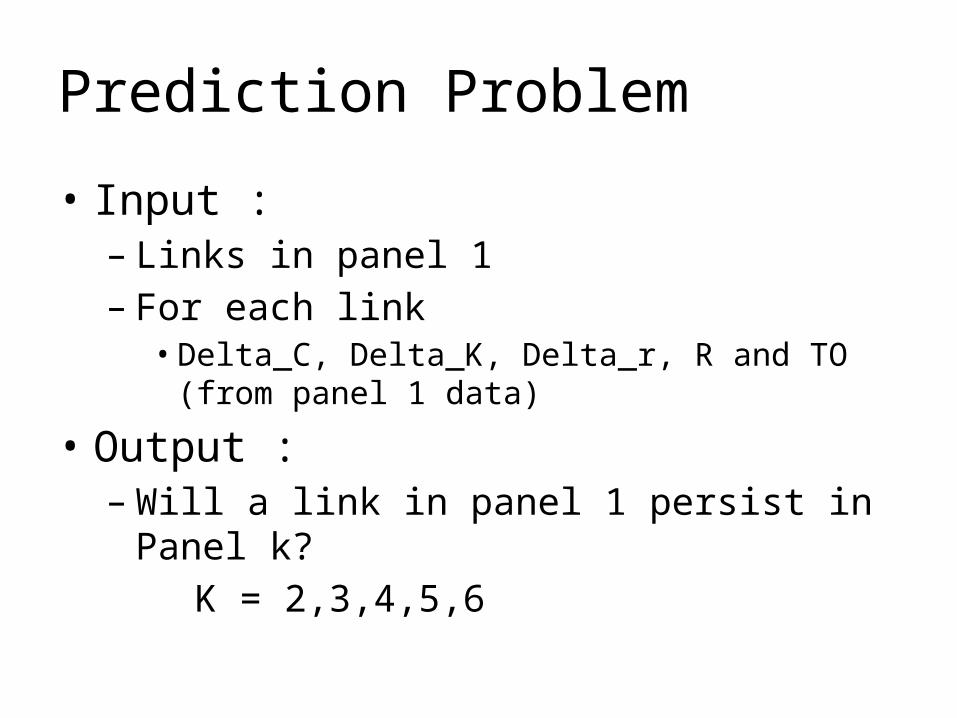
Prediction Problem
• Input :– Links in panel 1– For each link• Delta_C, Delta_K, Delta_r, R and TO (from panel 1 data)
• Output :– Will a link in panel 1 persist in Panel k? K = 2,3,4,5,6
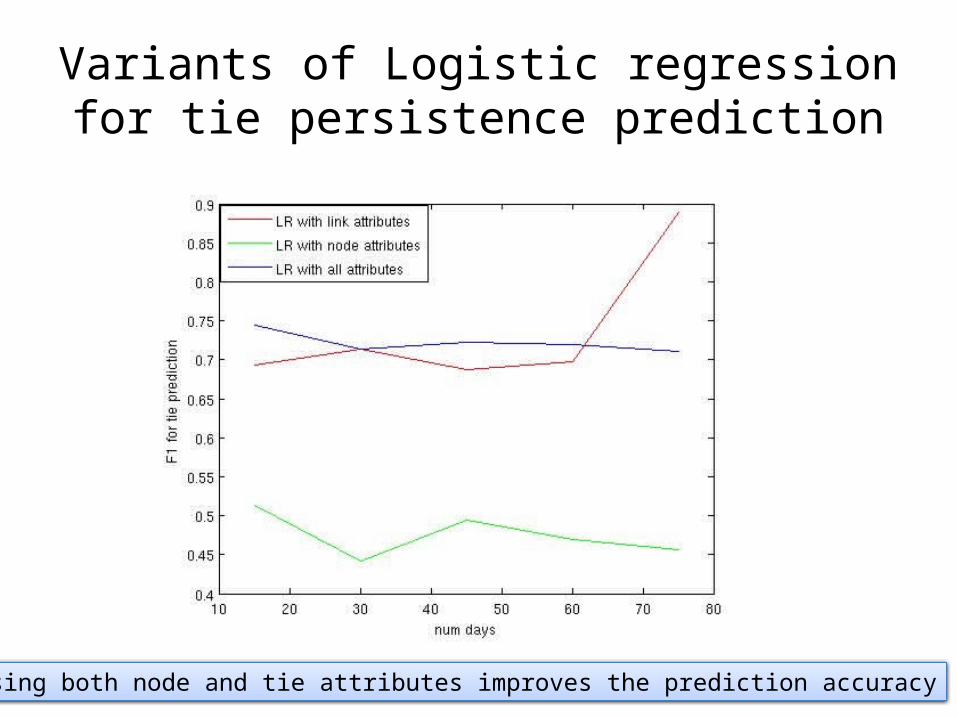
Variants of Logistic regression for tie persistence prediction
Using both node and tie attributes improves the prediction accuracy
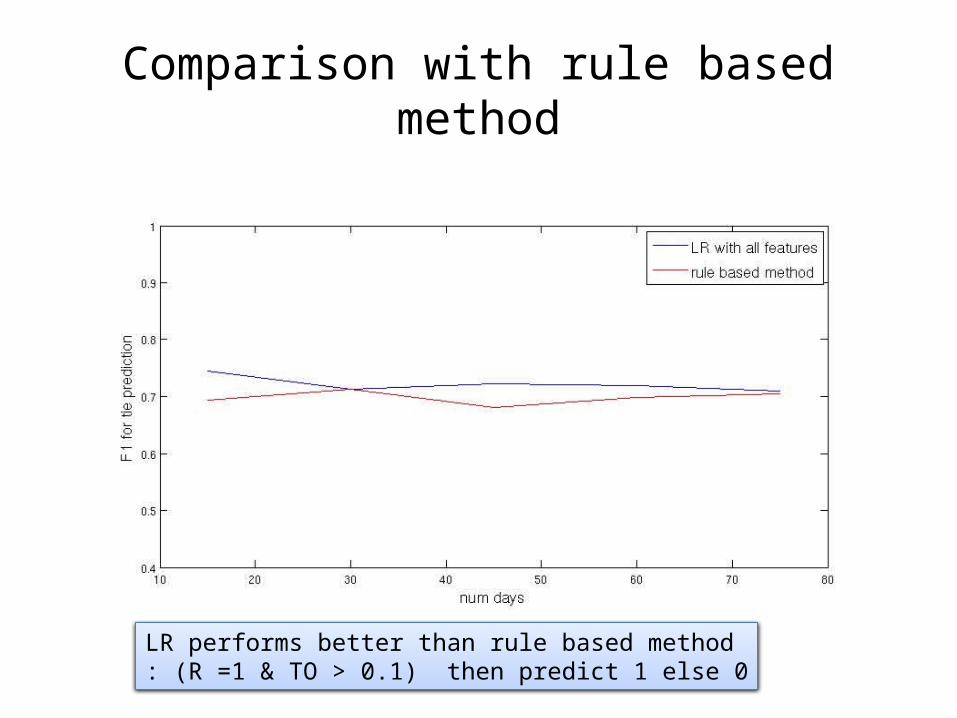
Comparison with rule based method
LR performs better than rule based method: (R =1 & TO > 0.1) then predict 1 else 0
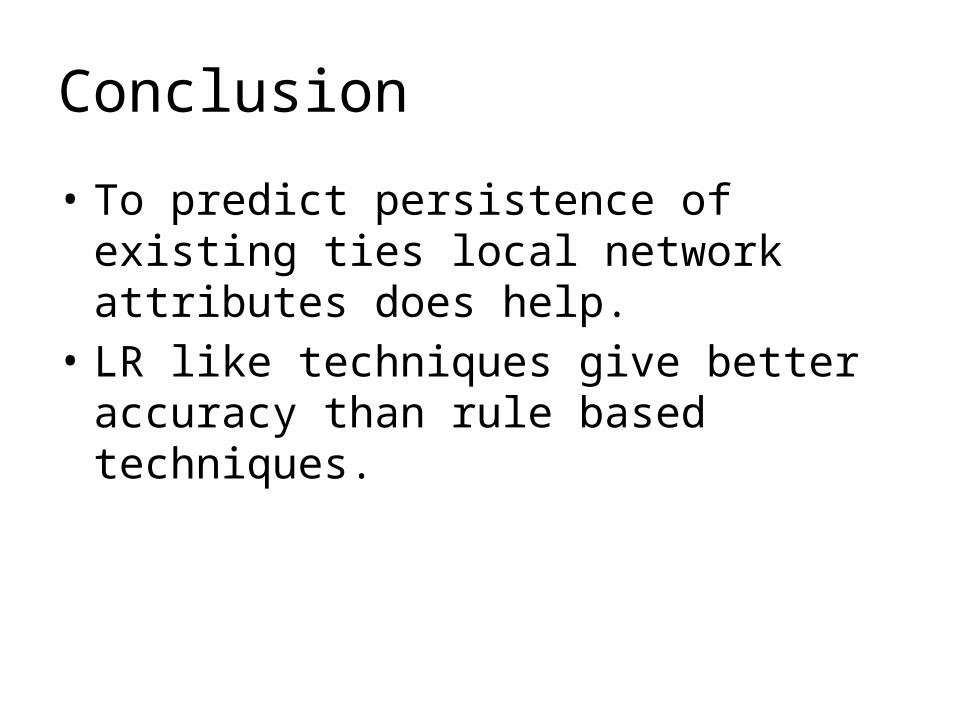
Conclusion
• To predict persistence of existing ties local network attributes does help.
• LR like techniques give better accuracy than rule based techniques.

Analysis of Social MediaPresentation
Contribution from Skyler SpeakmanApril 22 2010
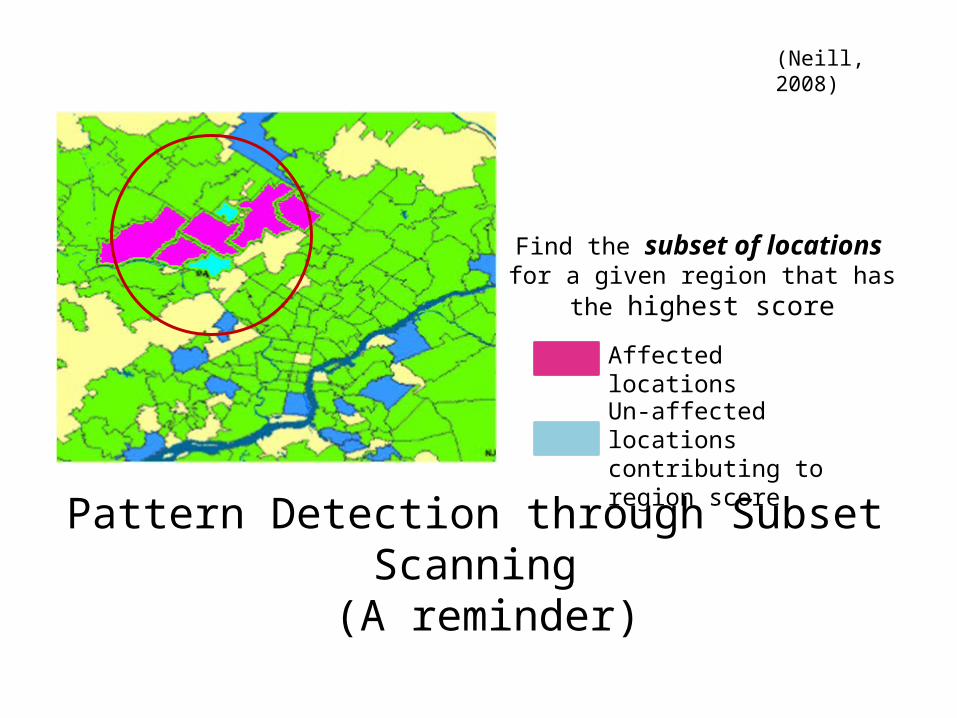
Pattern Detection through Subset Scanning (A reminder)
Find the subset of locations for a given region that has the highest
score
Affected locations
Un-affected locations contributing to region score
(Neill, 2008)

Connectivity Constraints
Increase power to detect non-circular clusters
Create an adjacency graph of the locations and score
every connected subset

Social Media
• Can pattern detection work with people on ‘societal scale’ ?– Automatic (participatory sensing)– Self-reported (healthmap.org)
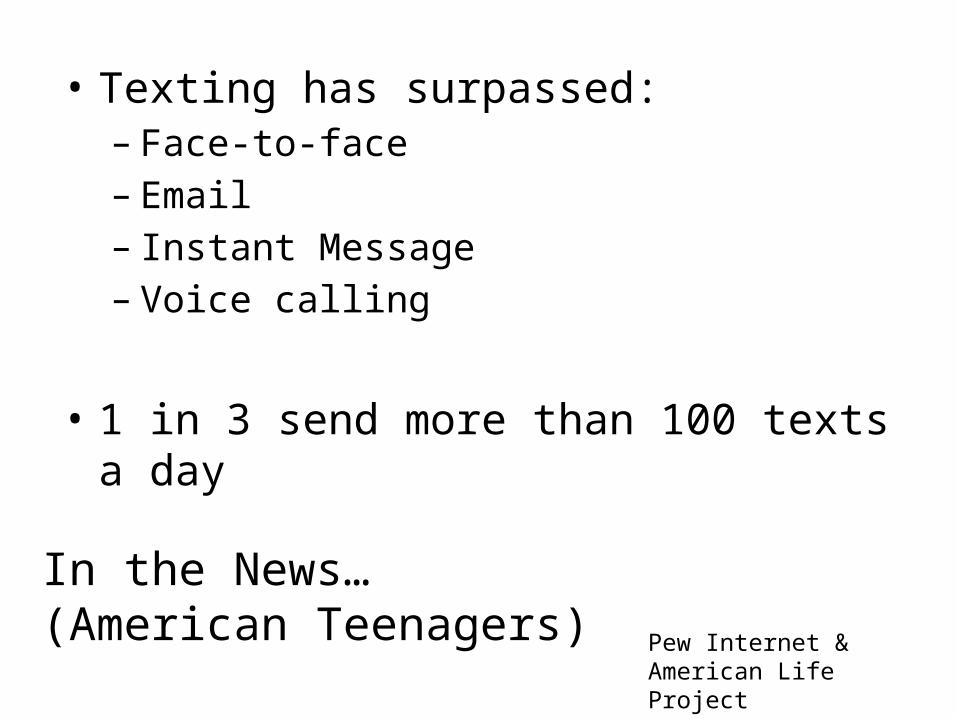
In the News… (American Teenagers)
• Texting has surpassed:– Face-to-face– Email– Instant Message– Voice calling
• 1 in 3 send more than 100 texts a day
Pew Internet & American Life Project

Anomaly Detection through Subset Scanning
Assume texts ~ Poisson(bi) (learned from historical data)
Ssi
Ssi
ii
bBcCFSF ,
We wish to maximize a scoring function
over all possible connected subsets, S
CBB
CC
HDataP
SHDataPSF
log
)|(
))(|(
0
1
Provides a likelihood score that the counts in S are generated from a
different distribution (Anomalous)
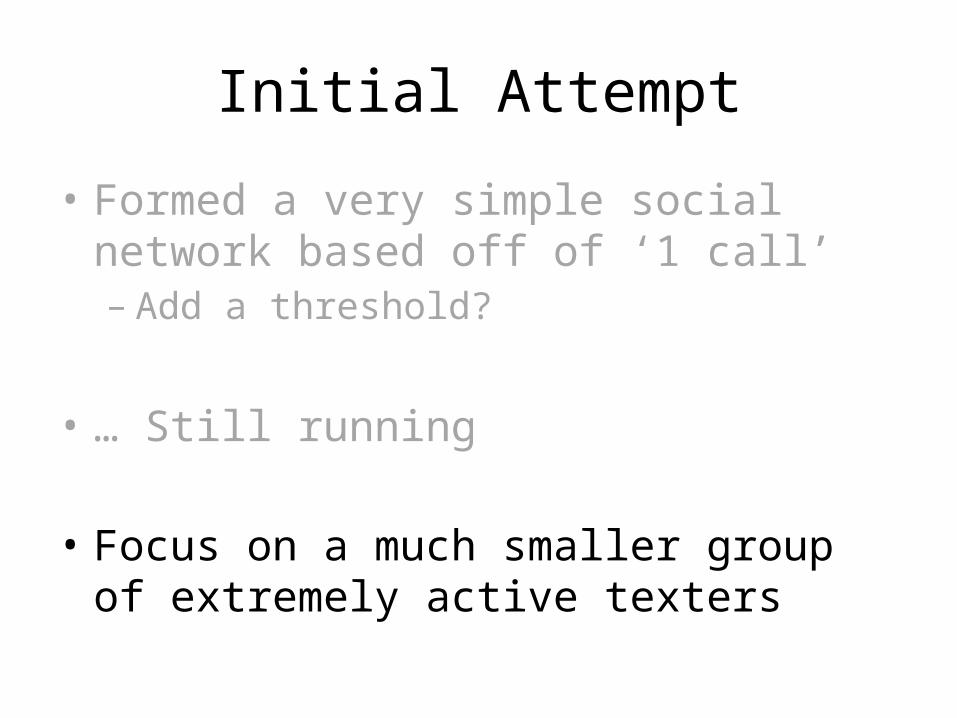
Initial Attempt
• Formed a very simple social network based off of ‘1 call’– Add a threshold?
• … Still running
• Focus on a much smaller group of extremely active texters


Trimming the data…
• Require a threshold of monthly activity in order to be considered– 500 incoming & outgoing texts every month• 468 customers
• Require a threshold of messages exchanged in order to be connected
Threshold 100 50 40 30 20 10 5 2 0
Edges 411 461 480 521 563 630 726 872 1008
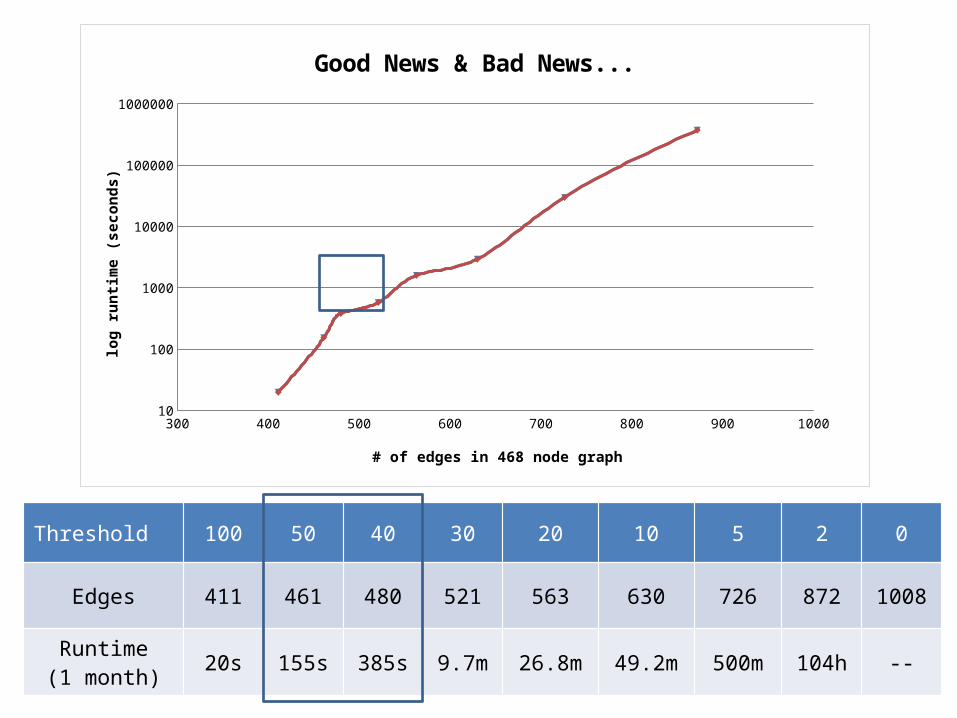
Threshold 100 50 40 30 20 10 5 2 0
Edges 411 461 480 521 563 630 726 872 1008
Runtime(1 month) 20s 155s 385s 9.7m 26.8m 49.2m 500m 104h --
300 400 500 600 700 800 900 100010
100
1000
10000
100000
1000000
Good News & Bad News...
# of edges in 468 node graph
log
runti
me
(sec
onds
)
1 2 3 4 5 6 7 8 9 10 11 12 13 14 15 16 17 18 19 20 21 22 23 24 25 26 27 28 29 30 310
500
1000
1500
2000
2500
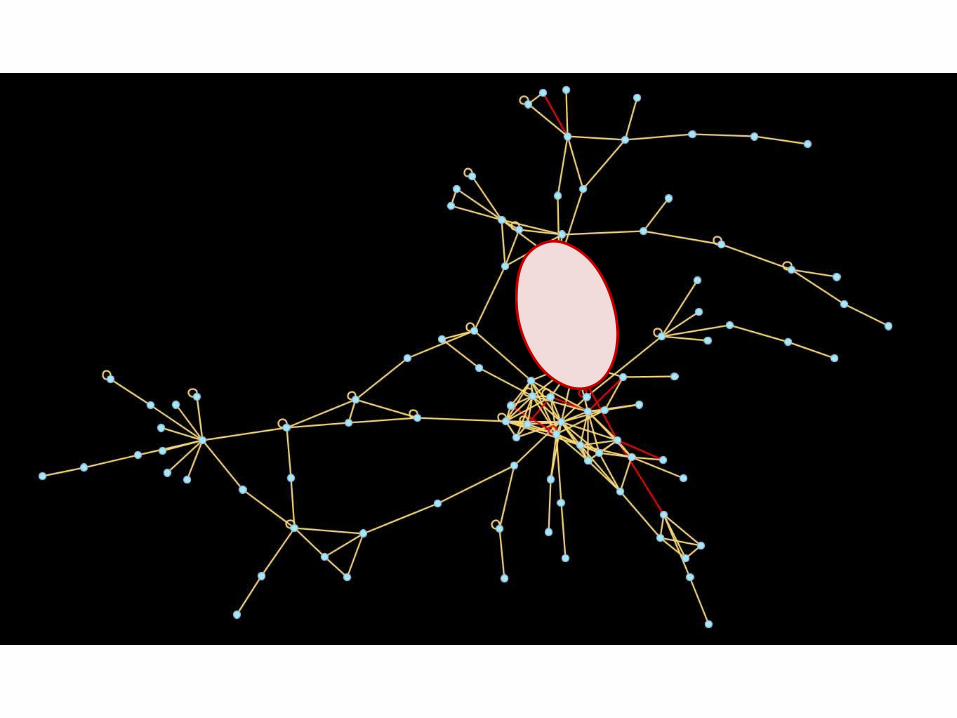
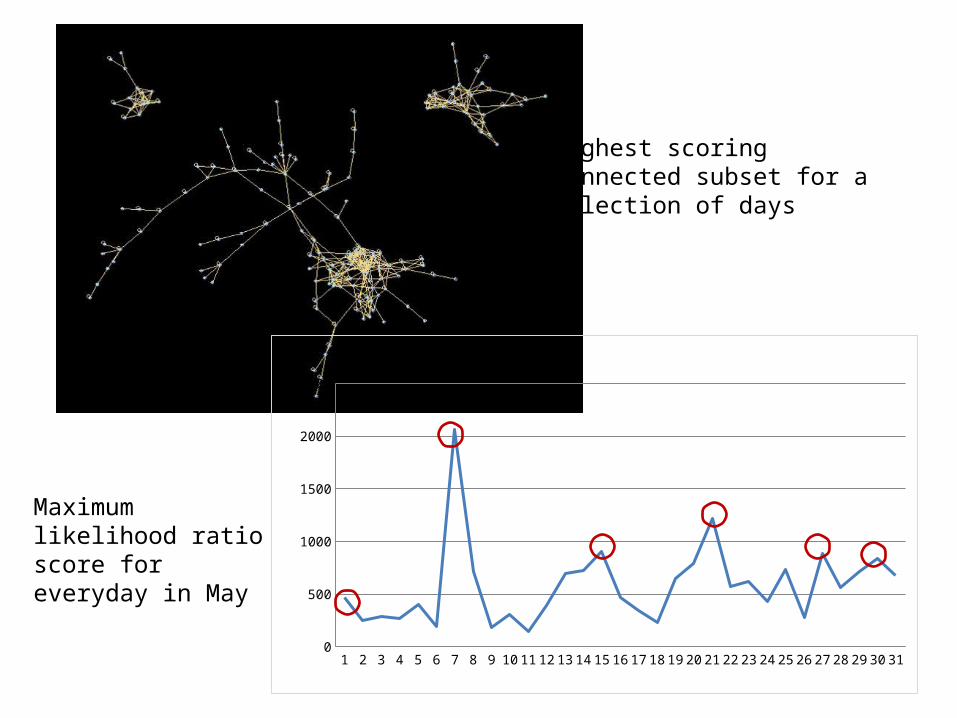
Maximum likelihood ratio score for everyday in May
Highest scoring connected subset for a selection of days

Conclusions
• GraphScan algorithm can reasonably scale to graphs of a few hundred nodes
• Performance is highly dependent on underlying graph structure– Future improvements through heuristics are
possible (necessary)• Realistic anomaly detection is difficult with
unlabeled data, but have demonstrated a solid proof of principle


![[David Matthews, Kasim Dalvi] Teach Yourself Compl](https://static.fdocuments.in/doc/165x107/55cf9df4550346d033b006ff/david-matthews-kasim-dalvi-teach-yourself-compl.jpg)